


Introduction
Current explanations of impediments to decarbonization, while vital, often ignore the international monetary system. Carbon emissions are tied to economic activity (Hickel and Kallis, Reference Hickel and Kallis2020; Jorgenson, Reference Jorgenson2014), and the US dollar is one of the most powerful global economic forces (Costigan et al., Reference Costigan, Cottle and Keys2017; Emmenegger, Reference Emmenegger2015; Schwartz, Reference Schwartz2019). Thus, understanding the relationship between the two is paramount. This research essay is exploratory and outlines several potential decarbonization constraints specific to US dollar centrality and strength.
My focus builds on existing critical macrofinance research that argues monetary policy is a key site for climate reform (Campiglio et al., Reference Campiglio, Dafermos, Monnin, Ryan-Collins, Schotten and Tanaka2018; Gabor, Reference Gabor2020, Reference Gabor2021; Golka et al., Reference Golka, Murau and Thie2024; Kelton, Reference Kelton2020; Löscher and Kaltenbrunner, Reference Löscher and Kaltenbrunner2023; Pettifor, Reference Pettifor2019; Reference Smoleńska and van ’t Klooster2022; Svartzman and Althouse, Reference Svartzman and Althouse2022; Driscoll, Reference Driscoll2023). Pettifor (Reference Pettifor2019) discusses US dollar centrality and calls for an end to its dominance so that other countries can gain greater control over their own monetary policy to meet their social and environmental needs. Likewise, Svartzman and Althouse (Reference Svartzman and Althouse2022) argue that hierarchy and exploitation in the current international monetary system block periphery countries from the green investment necessary to decarbonize. Both works rightly identify unequal power relations and systemic global imbalances. This research essay builds upon their findings with an explicit focus on constraints related to US dollar centrality and strength. It shows how monetary hierarchy not only affects the decarbonization capacity of periphery countries but also the United States itself. It draws forth novel connections between imbalances and hierarchy in the international monetary system and growth model theory.
The rise of the US dollar
During World War II, forty-four leaders from allied nations met in Bretton Woods, New Hampshire and officially adopted the US dollar, backed by gold at a fixed exchange rate, as the primary global reserve asset. The US government wanted to maintain its current account surplus along with an alleged ability to aid Europe in rebuilding. Though many opposed this advantage for Americans, including Keynes, Europeans eventually accepted the proposal because under this system they could still convert US dollars to gold and the solution was framed as temporary. Nearly thirty years later, President Nixon terminated the US dollar-to-gold conversion. Terminating the conversion, thus, removed the commodity backing of gold from the dollar and began generating dollars explicitly as credit.
According to credit money theory, money is credit produced primarily through bank loans. In contrast to commodity money theory, credit money theory better explains the global dominance of certain currencies like the USD (Schwartz, Reference Schwartz2024); some economies, for example, can consistently run current account deficits, while others cannot. This is because credit itself is inherently hierarchical, and, likewise, currencies are tied to status in the international monetary system (Murau and Klooster, Reference Murau and van ’t Klooster2023). As the US is home to the world’s deepest, most liquid, and sophisticated financial markets, the dollar has maintained its global dominance to this day (Germain and Schwartz, Reference Germain and Schwartz2014, Reference Germain and Schwartz2017). Klein and Pettis (Reference Klein and Pettis2020: 175) write:
American sovereign debt is plentiful, easy to trade, and free of default risk. The U.S. economy is large, diversified, and open. By extension, the dollar can be cheaply converted to any other currency and is always accepted as payment by the world’s producers of essential manufactures and commodities.
US dollar-denominated assets are often used to invoice international trade transactions, fund debt and finance cross-border banking, and store surplus in reserves. In fact, they comprise over sixty percent of the global central bank reserves (see Figure 1).
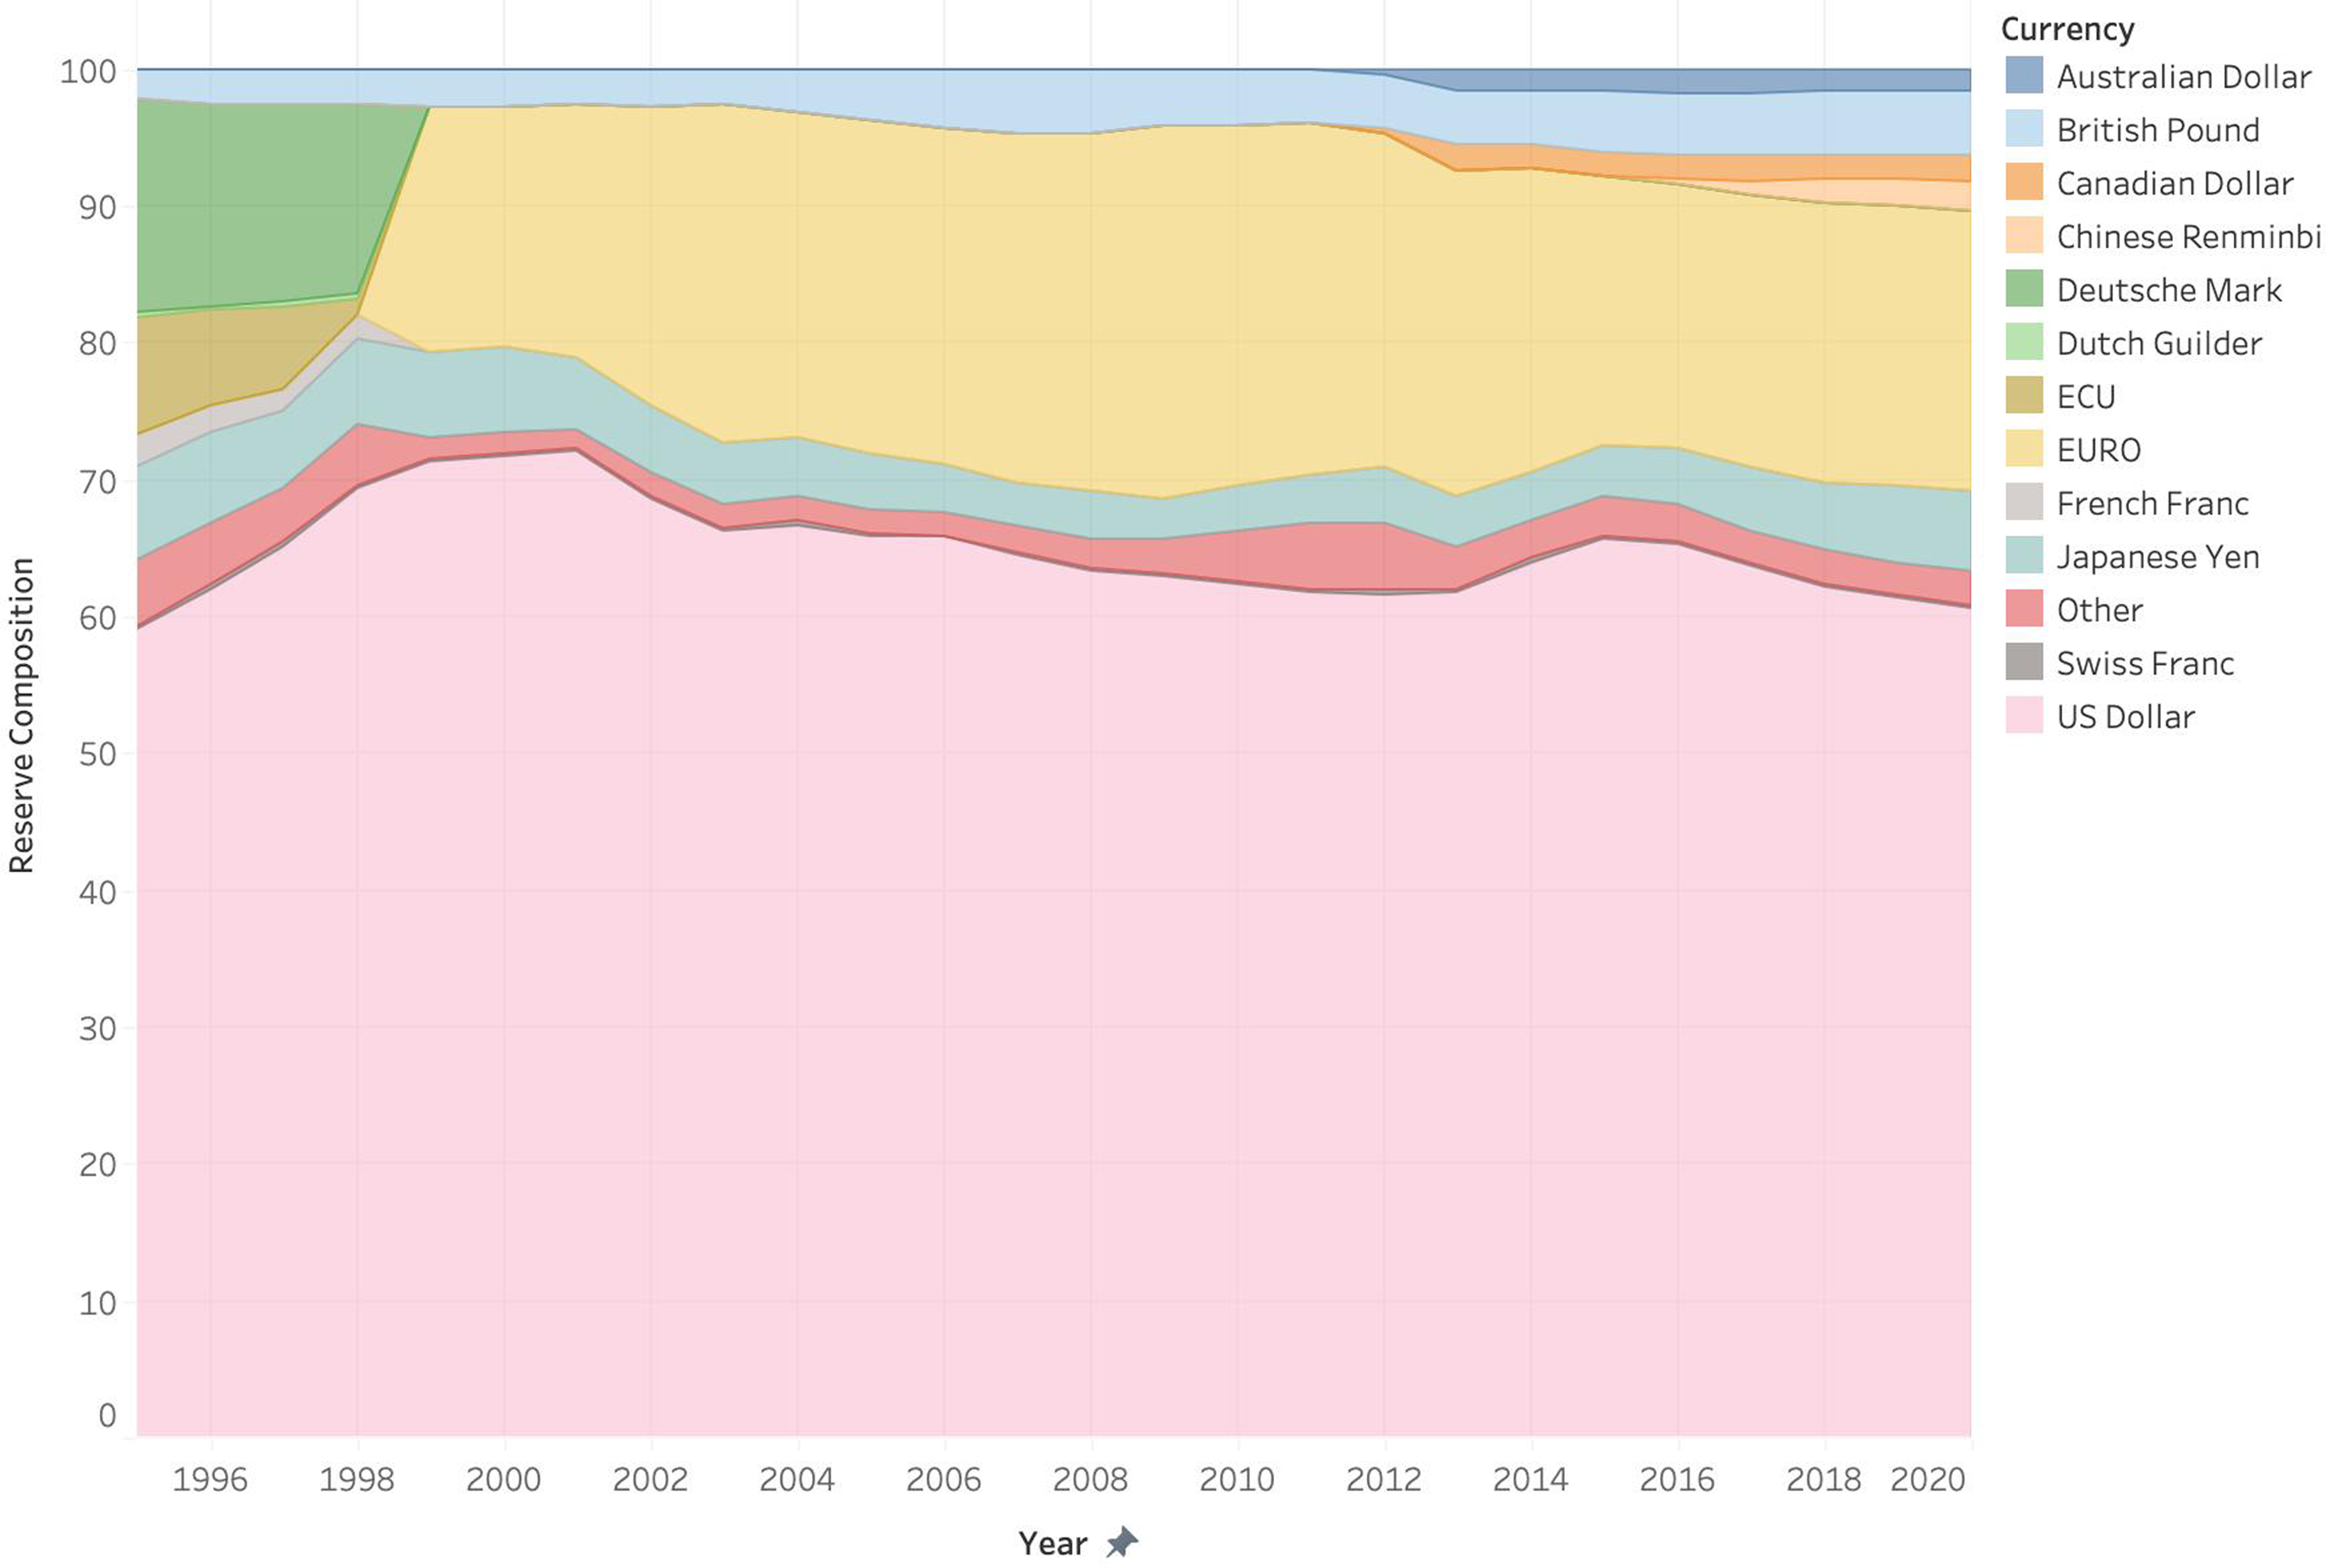
Figure 1. Currency composition of foreign exchange reserves.
Source: The Federal Reserve Bank of St. Louis.
This monetary dominance made the US Federal Reserve a ‘lender of last resort’, helping ensure stability and liquidity for the global financial system during crises through swap lines, lending, discount rates, and more (Mehrling, Reference Mehrling2010). Such status and superior capacity to create desirable credit also means increased demand for US dollar-denominated assets.Footnote 1 As ‘the only unit in the global economy that can exogenously create extra global demand’ (Schwartz, Reference Schwartz, Hassel and Palier2025: 3), running a current account deficit is a ‘feature not a bug’ for the global reserve currency. Status as the ‘preeminent’ currency, in short, enables the United States to spend more than it makes, finance deficits, and expand the exports of other countries through credit creation.
Centrality of the dollar
Dollar centrality enables higher household consumption and imports in the United States. The country’s comparatively greater potential to consume, due to its fossil fuel resources and size, can increase per capita consumption emissions. This section charts that relationship through interrogating how dollar centrality drives higher consumption and import levels, resulting in higher emissions in a unique national context.
US household consumption, imports, and emissions
Dollar centrality enables higher rates of household consumption and imports for the United States. Other governments, particularly those with a surplus, purchase US reserve assets because US currency holds the highest value and lowest risk (offering the safest investment for surplus). The high value of the dollar (due to demand), however, drives up the prices of American goods, decreasing their export competitiveness and market share. Consumption spending is therefore shifted from other countries to the United States, the largest import market and source of demand in the world with an increasing trade deficit. As the largest net importer in the world, US consumption drives export-led growth in other countries.Footnote 2 Americans have been consuming both ‘excess capital inflows and the excess manufactured goods from the rest of the world’ (Klein and Pettis, Reference Klein and Pettis2020: 202).
According to the Federal Reserve, the increased rate of imports due to the trade deficit has been matched with a rise in American household consumption and debt (Wen and Shimek, Reference Wen and Shimek2007). The growth model (Baccaro et al., Reference Baccaro, Blyth and Pontusson2022) of the United States is primarily driven by household consumption, at 55.5% of GDP (Baccaro and Hadziabdic, Reference Baccaro and Hadziabdic2024); the United States’ aggregate demand is stimulated through wages and debt, which enables people to spend money and consume more. Reisenbichler and Wiedemann (Reference Reisenbichler, Wiedemann, Baccaro, Blyth and Pontusson2022), in a key exploration of the US growth model, identify two key channels that drive domestic demand: housing and credit markets. Both channels allow US households to increase consumption despite real income losses over time. Crucially, US household consumption is ‘upward looking’ toward those who are wealthiest. Middle-class consumers are continually ‘reducing financial savings in an attempt to keep up with households higher on the income distribution’ (Behringer and van Treeck, Reference Behringer and van Treeck2019: 325). Middle and lower-income households have now adopted what scholars term, a ‘finance culture’, where they access newer forms of debt and credit to fill gaps left by rising income and wealth inequality (Fligstein and Goldstein, Reference Fligstein and Goldstein2015). The US government actively maintains these two channels to expand access to credit by derisking mortgage lending and providing debt relief, tax credits, and subsidies (Behringer and van Treeck, Reference Behringer and van Treeck2019; Reisenbichler and Wiedemann, Reference Reisenbichler, Wiedemann, Baccaro, Blyth and Pontusson2022). The United States reacting to and absorbing the excess capital and goods from the rest of the world, no doubt, underlies this ‘financialized culture of consumption’ with consumer preferences for more and more goods.
The United States’ uniquely ravenous culture of consumption linked to its status in the global monetary system, hierarchy, and wealth, also translates to the consumption of fossil fuels and carbon-intensive goods (Knight et al., Reference Knight, Schor and Jorgenson2017; Lynch et al., Reference Lynch, Long, Stretesky and Barrett2019; Starr et al., Reference Starr, Nicolson, Ash, Markowitz and Moran2023). The consumption of energy by the bottom twenty percent of income brackets, for instance, is less than what the top five percent consume. For a wealthy country so large, such a statistic has significant implications; for instance, emissions from the production and use of ‘luxury commodities’ in the United States exceed the emissions of entire countries (Lynch et al., Reference Lynch, Long, Stretesky and Barrett2019). US household consumption is particularly carbon-intensive, furthermore, because several path-dependent historical circumstances locked the US economy into fossil fuel development and consumption. North America, a comparatively large geography well-suited to expand to accommodate global demand, sits on massive coal and oil reserves, and, as such, the United States has more fossil fuel resource endowments than many other countries combined (Murphy and Dunlap, Reference Murphy and Dunlap2012). Furthermore, the post-World War II American growth model was a ‘fossil fuel-intensive agro-industrial economy’ that united the left and right through political agreements between unions, auto manufacturers, the middle class, and farmers (Oatley and Blyth, Reference Oatley and Blyth2021). Thus, fossil fuels not only supported American development but domestic unity as well. All in all, natural resource endowments combined with fossil fuel commodities like oil and natural gas being priced in US dollars (Colgan, Reference Colgan2021; El-Gamal et al., Reference El-Gamal, Jaffe and Baker2009; Spiro, Reference Spiro1999) means that carbon is comparatively inexpensive for Americans to consume (especially with a strong dollar).
The US carbon history is maintained through high levels of consumption today. Roughly two-thirds of emissions in the United States are sourced from behaviors directly or indirectly related to consumption: transportation, electricity, and commercial/residential buildings (Environmental Protection Agency, 2018). Given that, it is worth investigating how the carbon consumption of the United States compares with other countries (Kenworthy and Hicks, Reference Kenworthy and Hicks2008). Table 1 compares US per capita emissions to nineteen other wealthy democraciesFootnote 3 with respect to fossil fuel energy, per capita energy use, car ownership, petrol prices, and miles driven.
Table 1. Comparing annual carbon consumption across wealthy democracies.
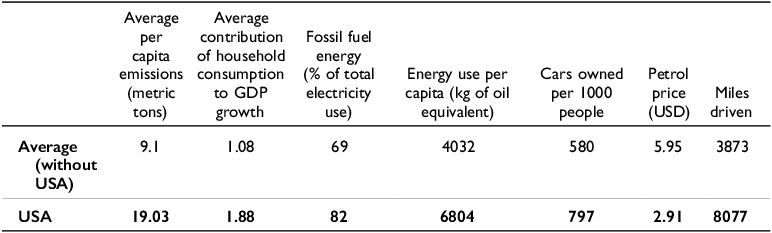
Note: Data on per capita emissions, fossil fuel energy, energy use, and cars are from the World Bank. Petrol price data is from Bloomberg and driving data is from the World Resources Institute. Consumption Data are from the OECD. All data is from most recent year except consumption and emissions data which are averages calculated from 1979 (the business cycle peak year for many of these countries) to 2018.
While consumption does not necessarily have to be carbon intensive (e.g., driving electric cars charged by solar energy), due to this history and geography, Americans consume more carbon than their counterparts. They not only consume more electricity,Footnote 4 but that electricity is largely generated by fossil fuels. They also have lower petrol prices (and thus, greater demand), drive more, and own more cars (and historically import more cars than any other country). All in all, US Dollar centrality is a structural factor that enables higher carbon-intensive consumption in the United States, a particularly large and resource-endowed geography.
Going beyond the geography of the United States, emissions from the baseline carbon-intensive consumption of the US economy do not pollute due to national economic activity alone. They are imbedded in the global trade system with external forces that can increase and decrease emission levels. The relationship is most clear when examining the US current account balance and emissions from 1990 to 2018, charted in Figure 2. Once countries like Germany and China increased exports in the early 1990s, increasing deficits correlate with increasing emissions and decreasing deficits correlate with decreasing emissions in the United States. Why? As discussed earlier, dollar dominance and an overvalued USD increases imports and the deficit. On the flipside of a rise in the deficit and imports, household consumption must rise as well. And because baseline US consumptive capacity is especially carbon-intensive in nature (not true of all deficit countries), emissions rise with it.
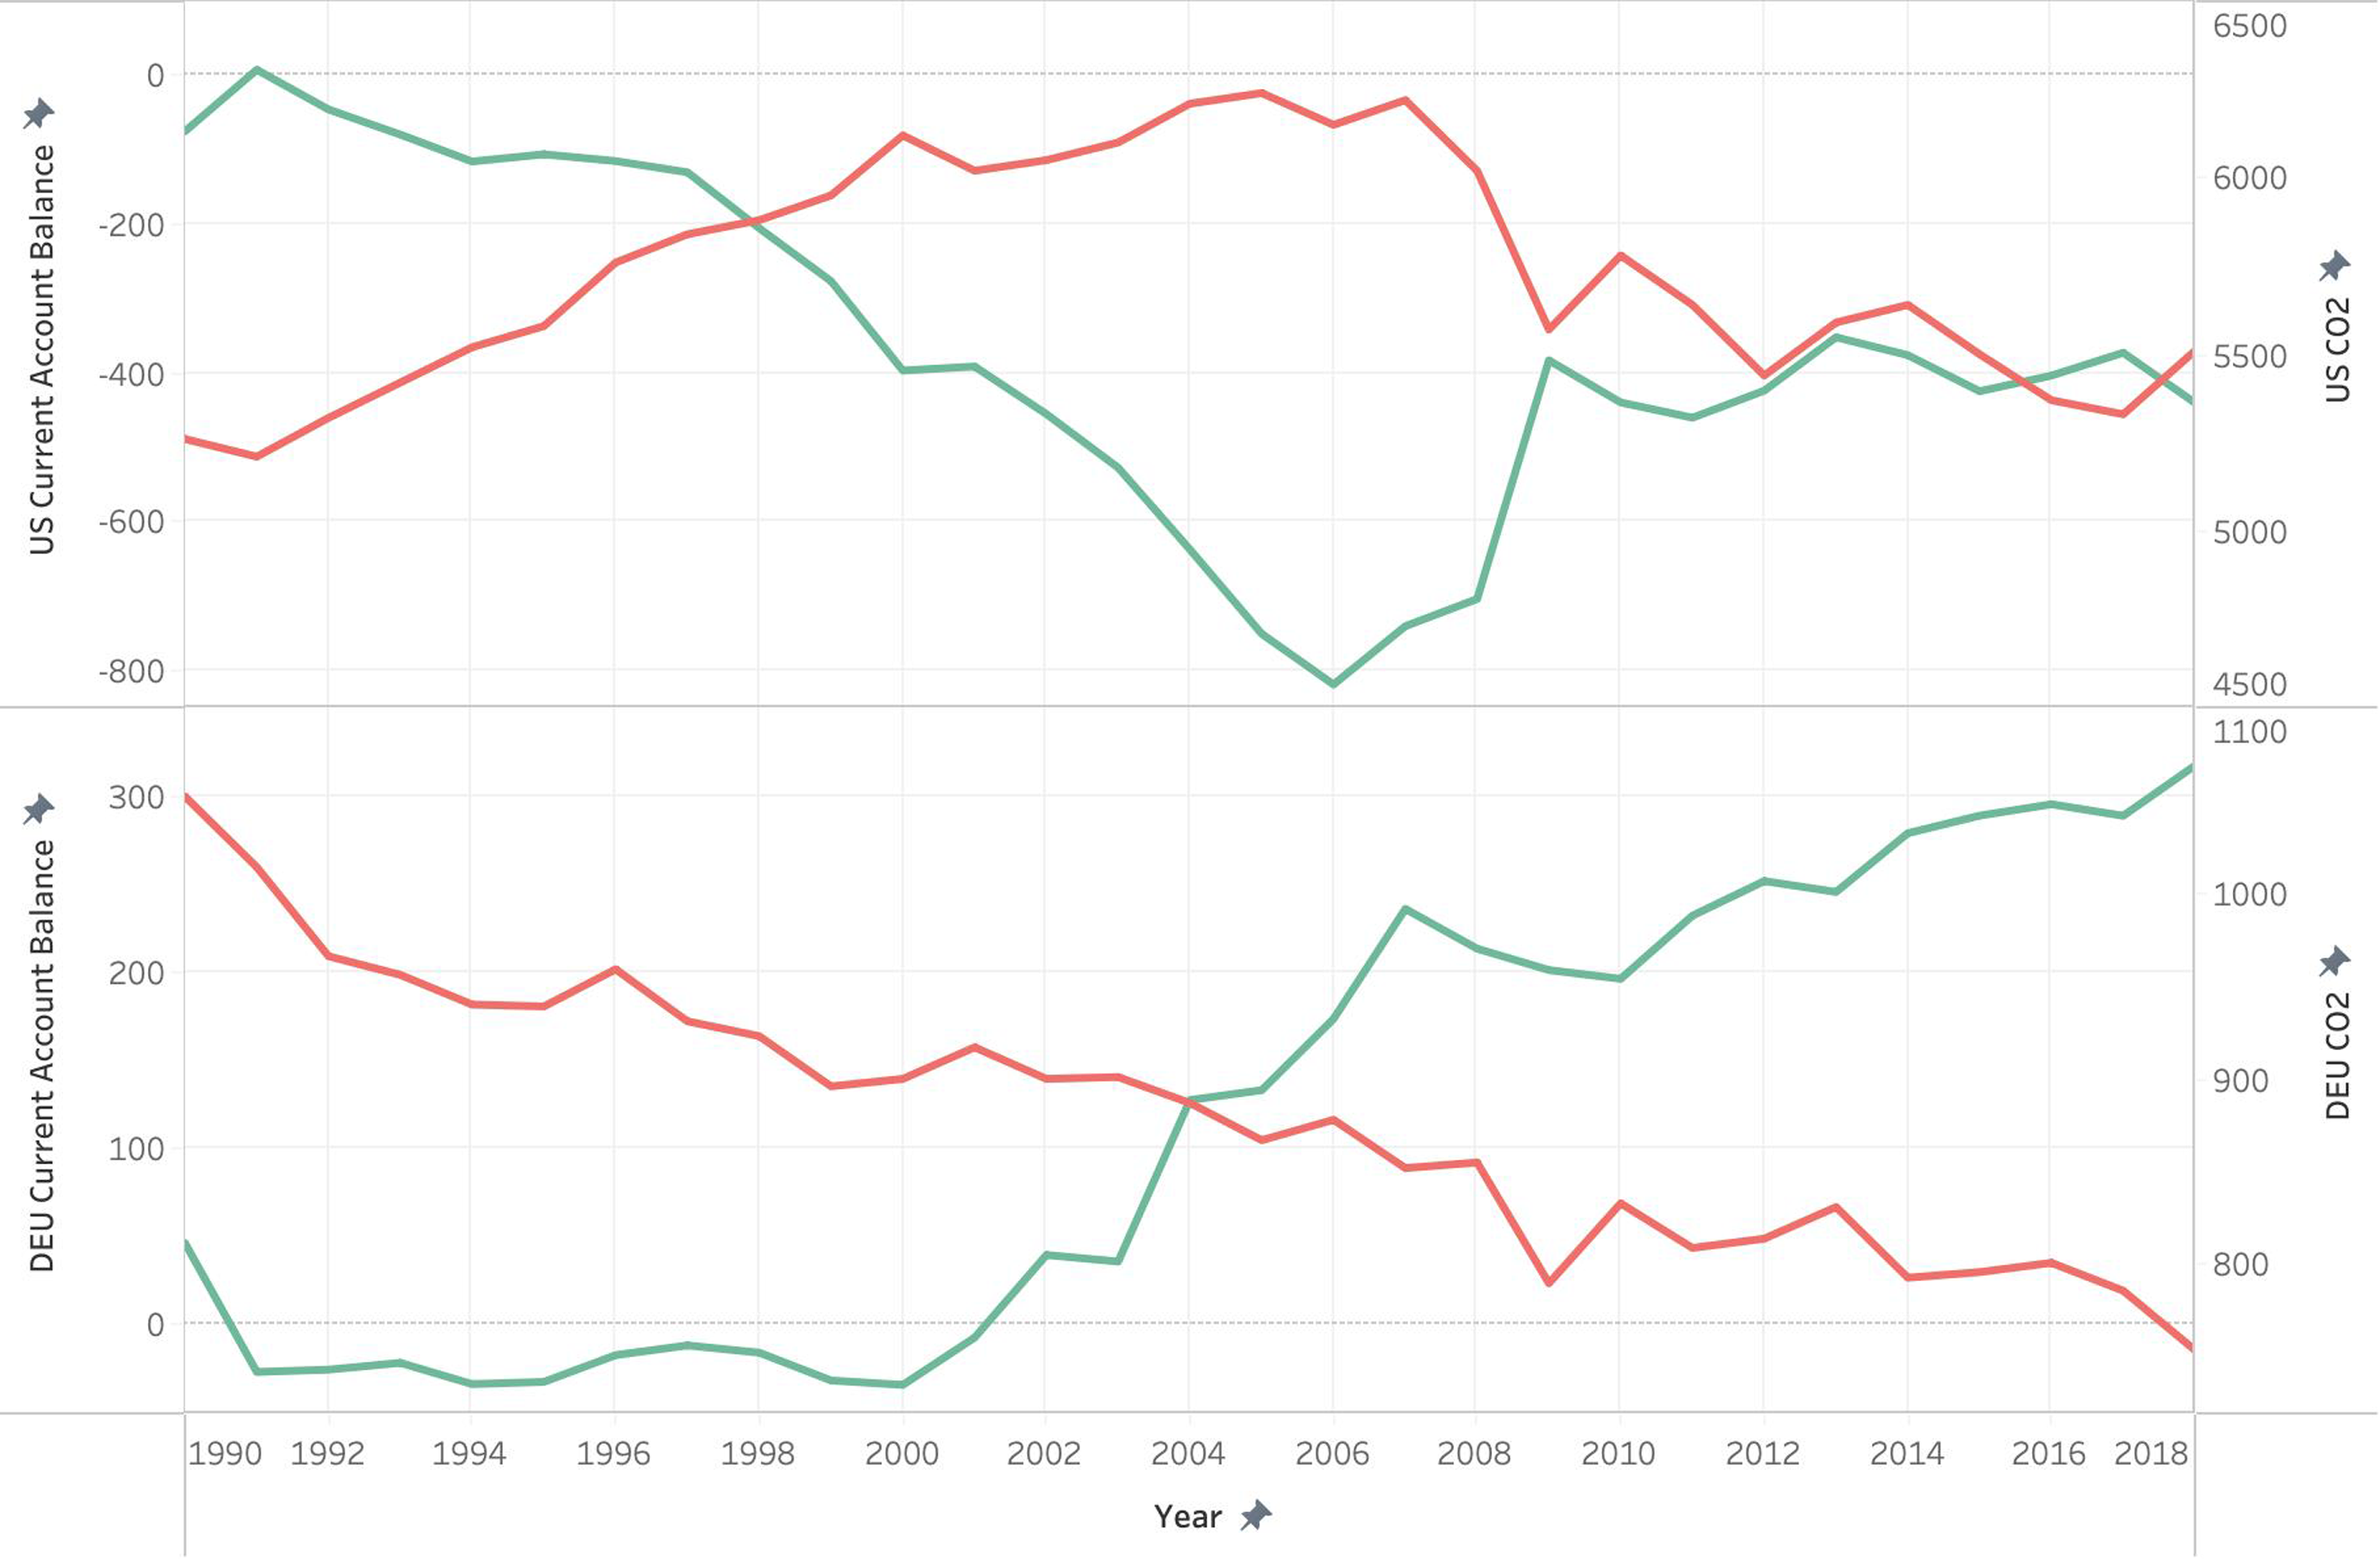
Figure 2. US and German current account balance (Green) and emissions (Red), 1990-2018.
Source: Current account data are sourced from the Federal Reserve Bank of St. Louis (Billions of USD); emissions data are sourced from the World Resources Institute (Million MtCO2e).
This relationship between countries’ trade and emissions is further evidenced by Germany, perhaps the purest example of an export-led growth model. To maintain undervaluation and competitive export prices, Germany’s export-led growth model is characterized by wage restraint (Baccaro and Benassi, Reference Baccaro and Benassi2017; Baccaro and Neimanns, Reference Baccaro and Neimanns2022; Di Carlo, Reference Di Carlo2020). Coupled with strict economic policies and credit regulation (Baccaro and Höpner, Reference Baccaro, Höpner, Baccaro, Blyth and Pontusson2022), this circumstance depresses German household consumption, the financial sector, and related credit creation (Braun and Deeg, Reference Braun and Deeg2019). Managing the German growth model has led to persistent trade surpluses for nearly two decades (Jacoby, Reference Jacoby2020; Rothstein and Schulze-Cleven, Reference Rothstein and Schulze-Cleven2020). Figure 2 also depicts Germany’s current account balance and emissions from 1990 (reunification) to 2018. As in the United States, the same relationship exists between the current account and emissions: emissions decrease with surpluses and increase with deficits. In this case, however, Germany experiences a steady decrease in emissions due, in part, due to repressed domestic demand inherent to the growth model.Footnote 5 The electricity sector demonstrates the trade balance-emissions relationship well. Germany and the United States have comparable levels of fossil fuels in their electricity sectors (roughly 80% of total), but the German growth model depressing household consumption and demand can contribute to lower levels of carbon-intensive consumption and emissions.Footnote 6
Furthermore, the German growth model (and its lower emissions) is more dependent on the United States than the other way around. ‘The trading system depends on the most indifferent’ and the US is one of the few countries in the world that could flirt with economic self-sufficiency (Wolf, Reference Wolf2022). Germany would not have its prosperity without a dependency on large external markets in countries like the US and China. If fact, without those export destinations, such suppression of domestic demand would lead to painful levels of unemployment (Polyak, Reference Polyak2022). According to the OECD’s Trade in Value Added database, the United States is Germany’s most valuable export destination (OECD, 2022a).Footnote 7 Vehicle exports generate the largest value of all German exports, and many go straight to American consumers who, as seen by the baseline US growth model in Table 1, benefit from comparatively lower petrol prices and drive significantly more than consumers in other countries.Footnote 8 That bilateral relationship illustrates how the dollar shapes trade relationships which, in turn, shape emissions.
While the emissions-trade dynamic certainly varies a great deal in the bilateral relationships between countries and is complex to unravel, the carbon-intensive consumption of the US is largely consistent across general imports as well. The United States imports more emissions than any other country, some of which is linked to China’s growth and exported emissions (Davis et al., Reference Davis, Peters and Caldeira2011; Peters et al., Reference Peters, Minx, Weber and Edenhofer2011). Furthermore, the United States is the top import market for the most carbon-intensive goods. According to the Observatory of Economic Complexity and US Department of Commerce, the United States imports more cement, steel, and cars than any other country (International Trade Administration, 2020; MIT Media Lab, Reference Media Lab2022). Compared to Europeans, Americans also drive the largest and most polluting cars (Voelk, Reference Voelk2020). And even though the US is a top exporter of crude petroleum, it is also the world’s second-largest import market after China. In short, USD centrality enables higher consumption in a country particularly well-suited to expand demand and burn carbon.
Strength of the dollar
During crises in particular, printing the world’s reserve currency carries significant privileges for the United States at the expense of other countries. The Federal Reserve can cut interest rates, buy up assets, and do more to stabilize US markets and strengthen the dollar. Other countries, particularly exporters who depend on US demand and hold US dollars, are without this control and partially reliant on the Federal Reserve for stabilization. Thus, this section shows how dollar strength has the potential to disadvantage the monetary autonomy and decarbonization capacity of dollar-exposed countries. Finally, it shows that while dollar strength can be a blessing for the US, it can also be a curse as overvaluation may also compromise the competitiveness of US green manufacturing and exports.
Dollar-exposed emerging market economies
Some emerging market economies (EMEs) are especially vulnerable to a strong dollar. Though many factors affect dollar strength such as geopolitics or growth, here I will focus on the most direct factor: interest rates. When the Federal Reserve increases interest rates, and another economy’s central bank does not, the interest rate differential puts a downward pressure on the other economy’s exchange rate, depreciating the currency. Due to strong spillover effects via financial markets, the contractionary effects of Fed rate hikes can be stronger abroad than within the United States (Ca’ Zorzi et al., Reference Ca’ Zorzi, Dedola, Georgiadis, Jarociński, Stracca and Strasser2020: 30), even reaching the relatively wealthy Eurozone (Moschella and Polyak, Reference Moschella and Polyak2022). In fact, rate hikes and a strong dollar negatively affect the rate and flows of global climate finance. Table 2 displays the relationship between interest rates and climate finance, showing that the pace of financing peaked during the COVID-19 era of loose monetary policies and then slowed as rates increased. There is a negative correlation observed between rate increases and climate finance flow increases. This is critical as many estimate that global decarbonization should be financed at approximately four trillion USD per year (Songwe et al., Reference Songwe, Stern and Bhattacharya2022). Note that while US Fed rate hikes and a strong dollar constrain climate finance, rate cuts and looser monetary conditions can amplify it.
Table 2. Federal funds effective rate and climate financing.
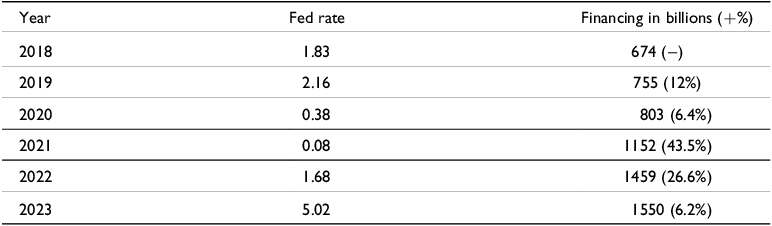
Note: Rate data are from The Federal Reserve Bank of St. Louis. Climate finance data are from the Climate Policy Initiative. (+%) indicates percent increase from previous year.
At a more micro level, a strong dollar (and sometimes the associated rate hikes) negatively affects dollar-exposed EMEs most notably in the areas of trade, external debt, and investment. To begin with trade, the US dollar is the main invoicing currency for global transactions (Erik et al., Reference Erik, Lombardi, Mihaljek and Shin2020) and especially prominent in the basic commodity markets of oil, natural gas, and food. When the value of the US dollar increases, it changes the relative prices of key imports for many EMEs (Hofmann et al., Reference Hofmann, Mehrotra and Sandri2022). As a result, research finds that a strong dollar usually decreases trade levels in EMEs (Bruno et al., Reference Bruno, Kim and Shin2018) and harms EME export levels as well (Bruno and Shin, Reference Bruno and Shin2020b). Second, due to the dollar strengthening, EME external debt increases if it is denominated in US Dollars. Crucially, while EME debt increases, the value of EME national currencies often weaken. This means that EME capacity to pay down those debts decreases simultaneously with increasing debt burdens.Footnote 9 Beyond government debt, many of the most successful firms in EME corporate sectors who borrow in US dollars and are similarly vulnerable (Bruno and Shin, Reference Bruno and Shin2017, Reference Bruno and Shin2020a). Third and finally, a strong dollar drives a recoil of investment from EMEs (Avdjiev et al., Reference Avdjiev, Du, Koch and Shin2019; Hofmann et al., Reference Hofmann, Shim and Shin2020). With improved returns on offer in the currency and sovereign bond markets of higher-income countries, capital moves elsewhere and chases rising interest rates. The investment not only flees governments, it also flees from local financial and banking sectors, weakening them (Bruno and Shin, Reference Bruno and Shin2015). All in all, a strong dollar means that dollar-exposed emerging markets face higher debts and lower growth.
The case of Chile is illustrative of this dynamic. Selected because, at the time of writing, Chile was more exposed than any other country to a strong USD with high-risk levels on a number of metrics: external debt in USD, corporate bonds in USD, commodity import reliance, foreign debt, lower banking reserves, foreign exchange loans, private sector debt, and government default (Tooze, Reference Tooze2022). Figure 3 illustrates the impact of Federal Reserve rate hikes on the Chilean Peso and Chilean central bank rates. To combat the devaluation of the Chilean Peso that followed the major rate increases from the Federal Reserve in the early summer of 2022, in addition to inflation, the Banco Central de Chile was forced to double its interest rates and significantly contract its economy. Rate hikes weakened the Chilean national balance sheet and, thus, the country’s ability to borrow.
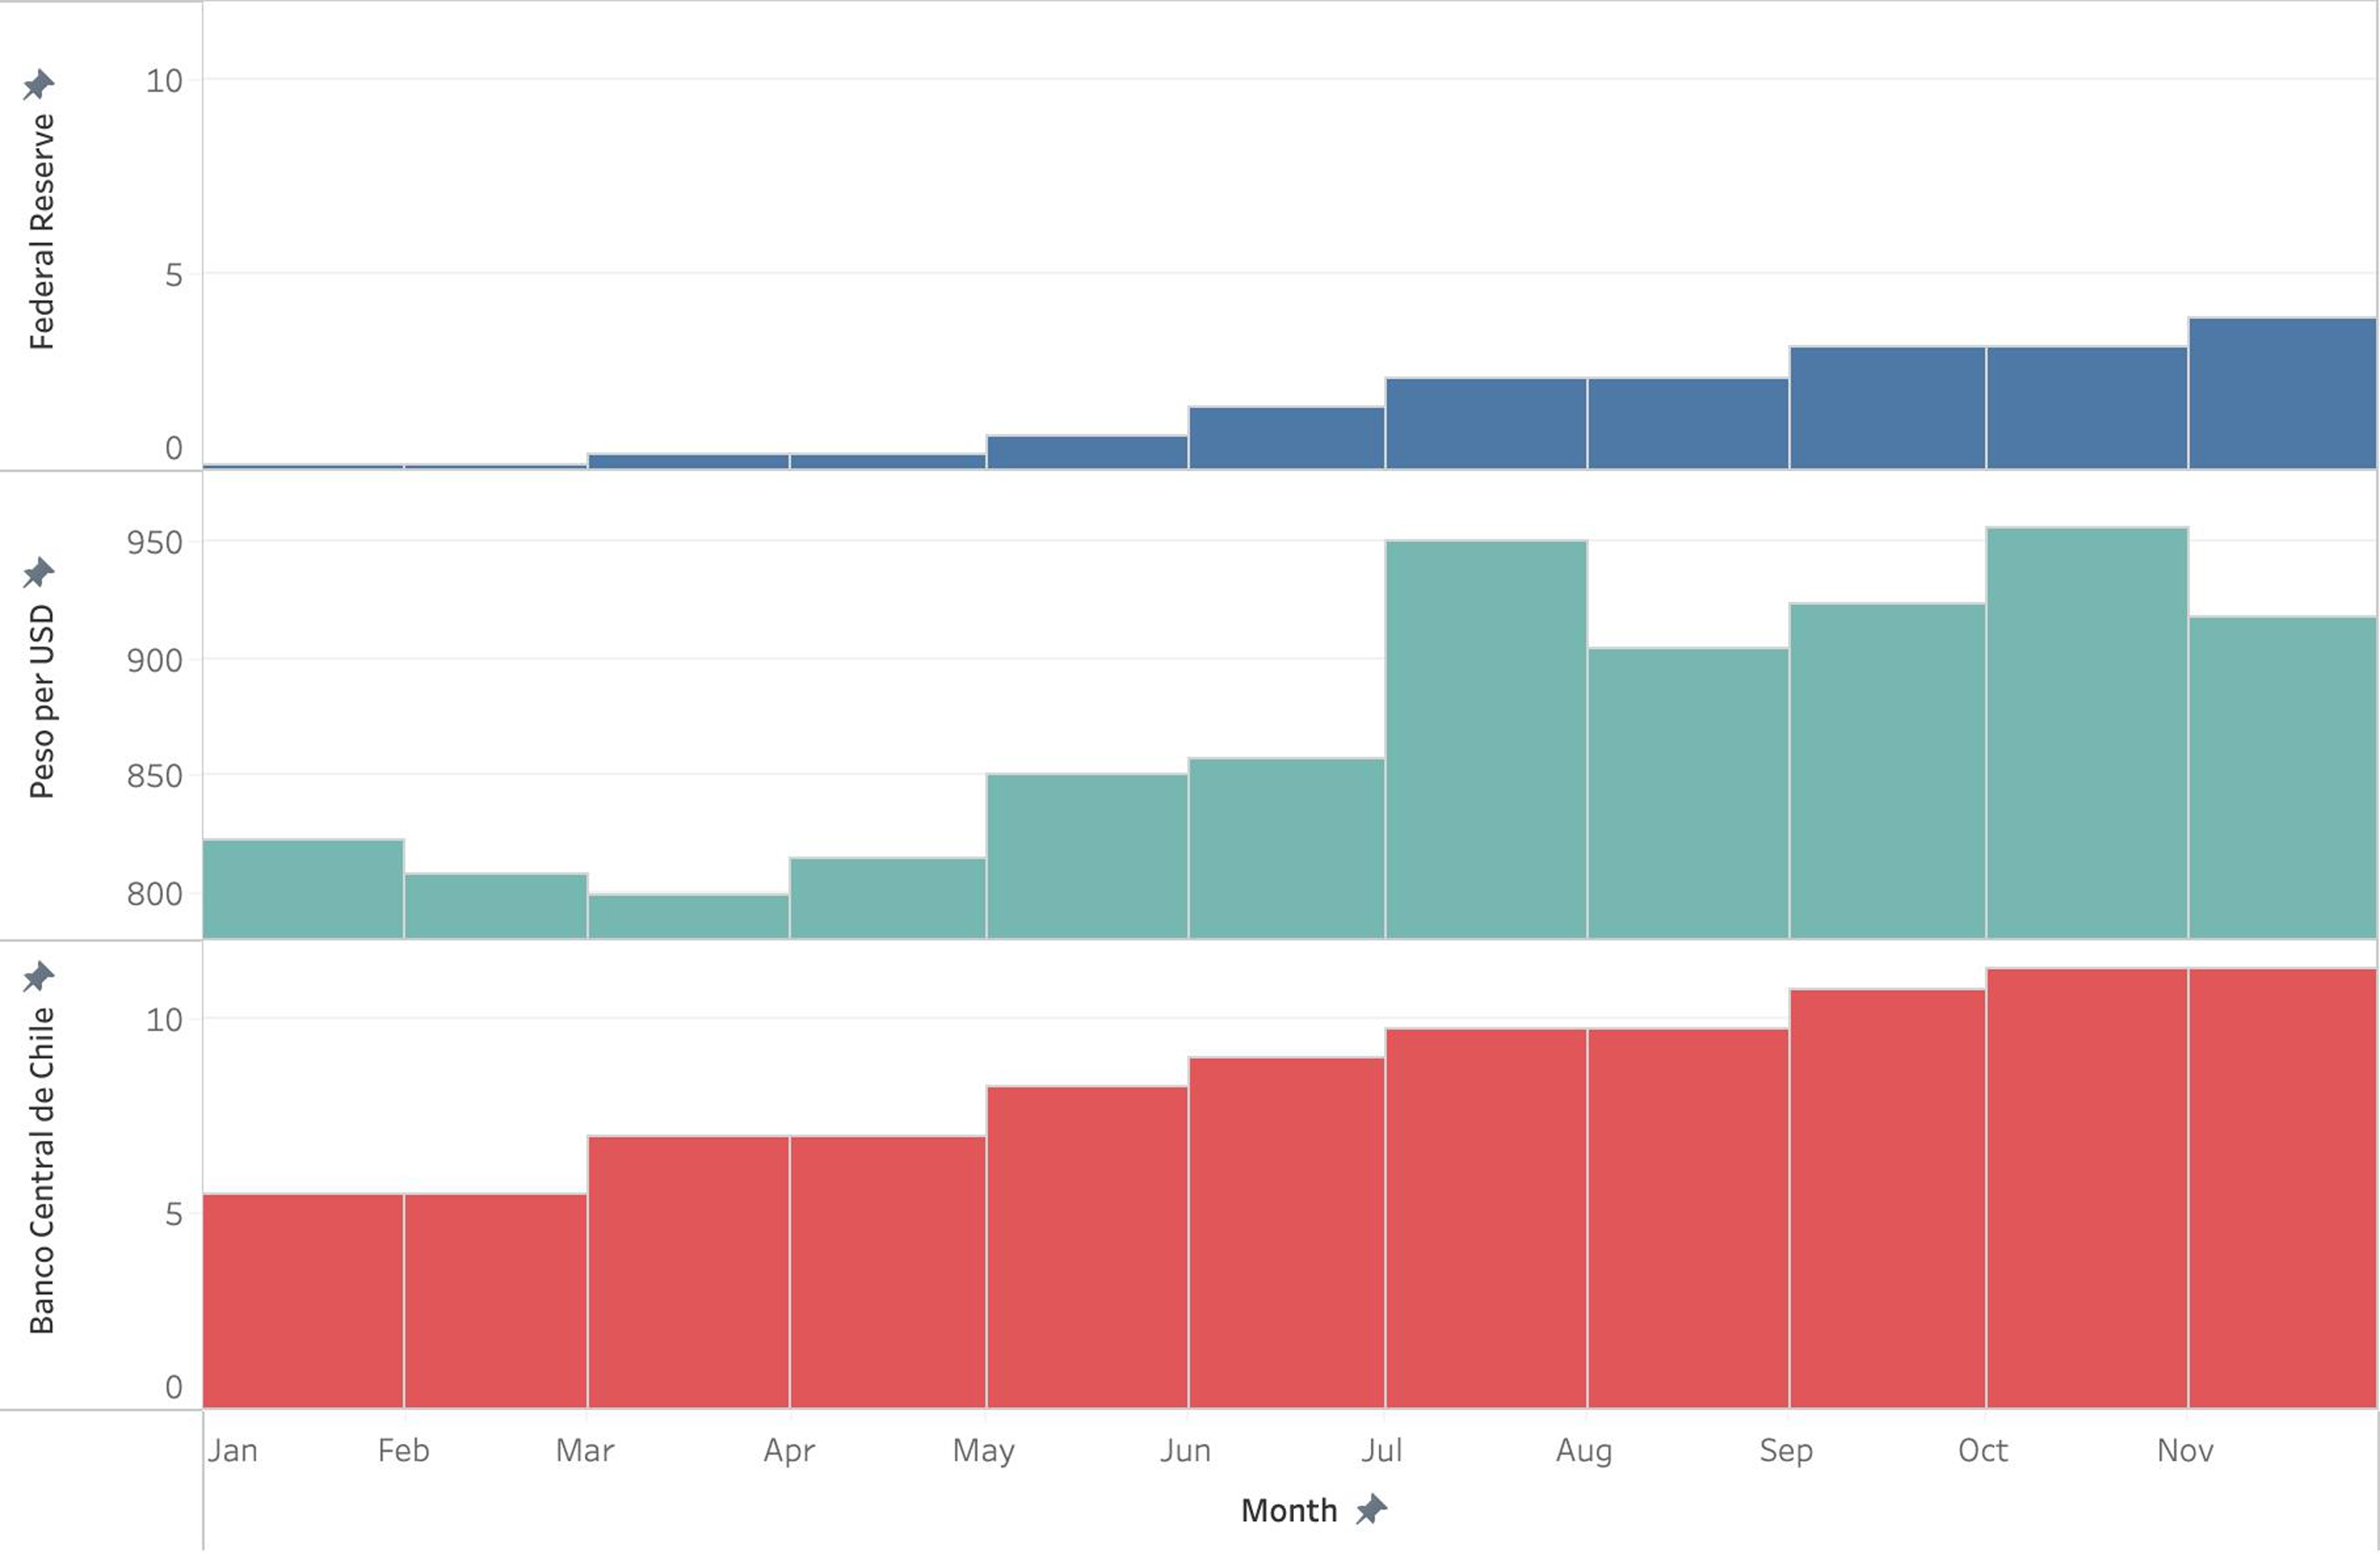
Figure 3. Central bank rates and Chilean Pesos per USD (2022).
Source: Rate data from the Bank for International Settlements; currency exchange rate data from the International Monetary Fund.
Dollar strength, thus, has the potential to compromise the monetary autonomy and decarbonization capacity of dollar-exposed EMEs. National and regional governments can make all the future emission reduction commitments they like, but without the proper financing, their actions will fall short of their ambitions. The green transition is impossible for states with weaker balance sheets and borrowing capacities due to currency devaluation, increased debt, and low liquidity. Even lower ambition, market-based solutions, like derisking the private sector, are not feasible. Derisking private investment does not happen when there are macro risks of currency devaluation, political discord, and debt default.Footnote 10 All in all, a strong dollar can, at times, cripple the green macrofinancial capacities of many dollar-exposed emerging market economies because they can face (1) decreased trade with higher import costs and weaker exports, (2) higher debts coupled with a lower capacity to pay those debts down with a weaker currency, and (3) a withdrawal of investment.Footnote 11
US green exports
To some, the United States’ enactment of the Inflation Reduction Act, the largest industrial policy budget for decarbonization, represented an industrial threat to the rest of the world. This is because many governments desire to guide their nations to export the future goods (e.g., solar panels) that will decarbonize the world and reap profits. Thus, some policy discussions hint at moving toward forms of ‘green mercantilism’, where governments protect the growth of their infant green industries. Dollar centrality may compromise the ability of the United States to compete on price.
The global presence and dominance of the US dollar partially contributed to the decline in US manufacturing (Barrot et al., Reference Barrot, Loualiche, Plosser and Sauvagnat2022), because an overvalued national currency means overvalued national goods on global markets. Data on international solar panel and wind turbine markets reflect this reality. And the story is all about China. Using data from the International Energy Agency, Figure 4 displays the global production share of solar photovoltaic modules. China produces nearly 70% of the world’s solar panels. In fifth place, the United States produces a measly 3.2% after Vietnam, South Korea, and Malaysia.
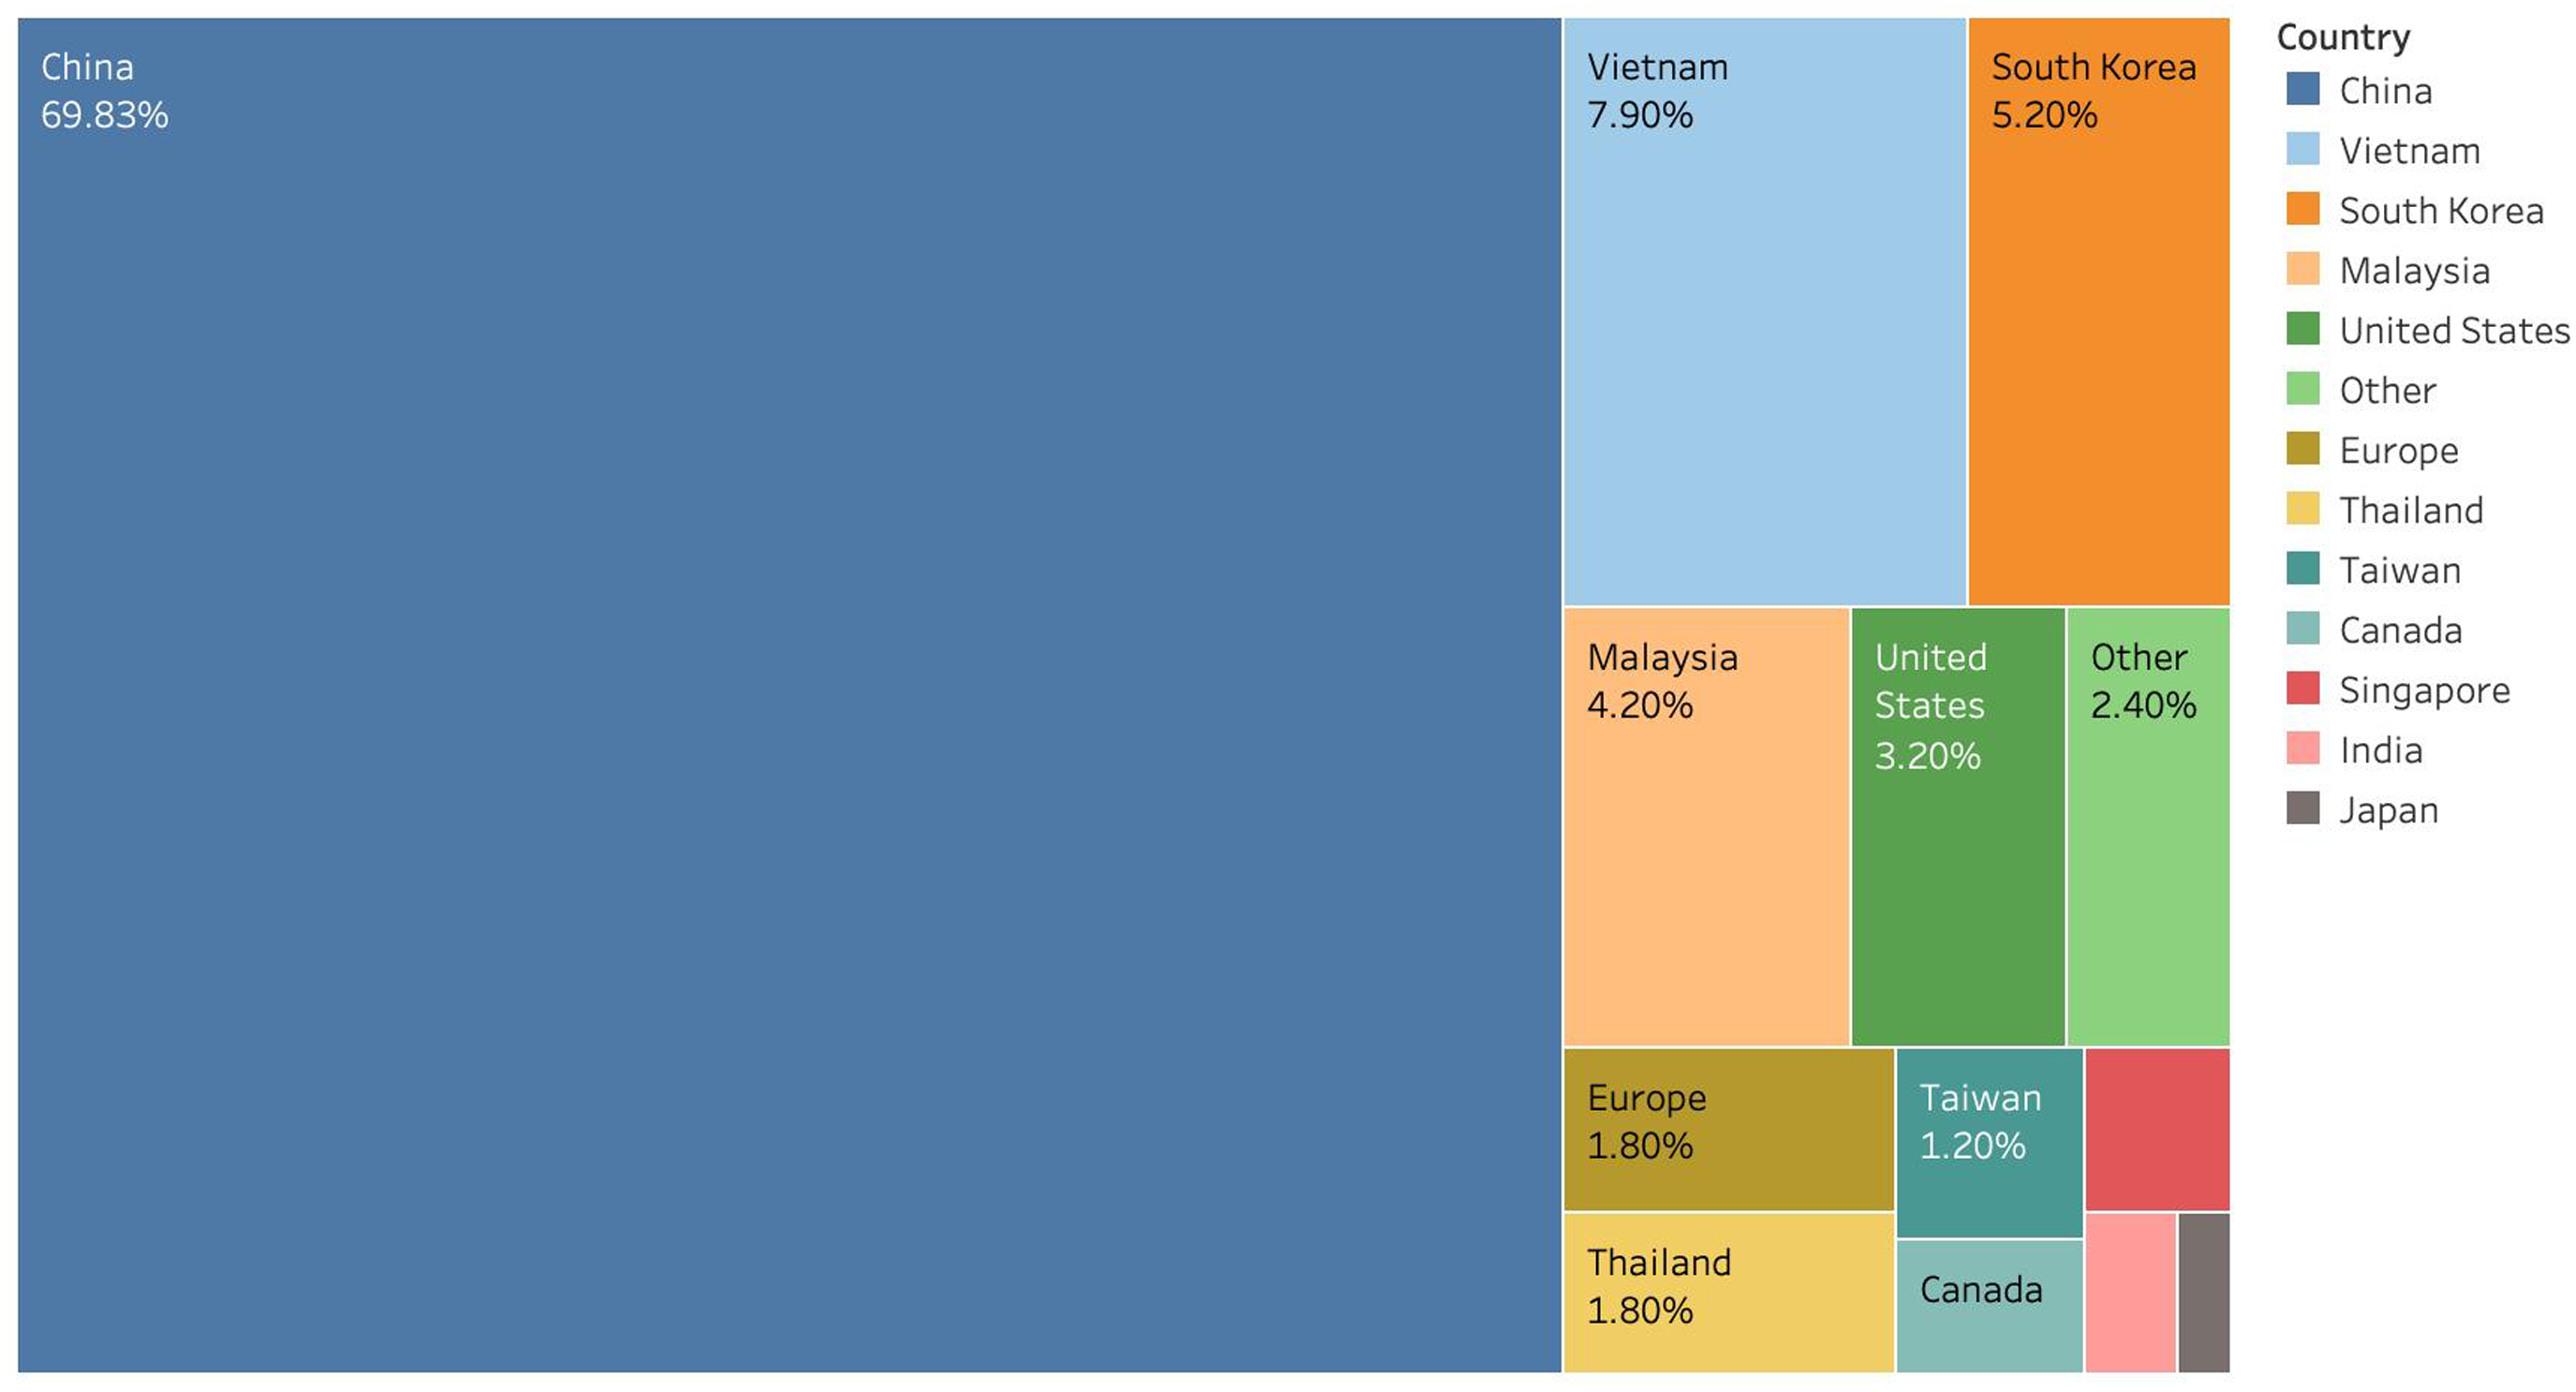
Figure 4. Share (%) of solar photovoltaic module production worldwide (2020).
Source: International Energy Agency.
Using data from Bloomberg, Figure 5 displays the global market share of wind turbine production. Chinese firms comprise nearly forty percent of the market. Firms from a few European countries and the United States hover between ten and fifteen percent.
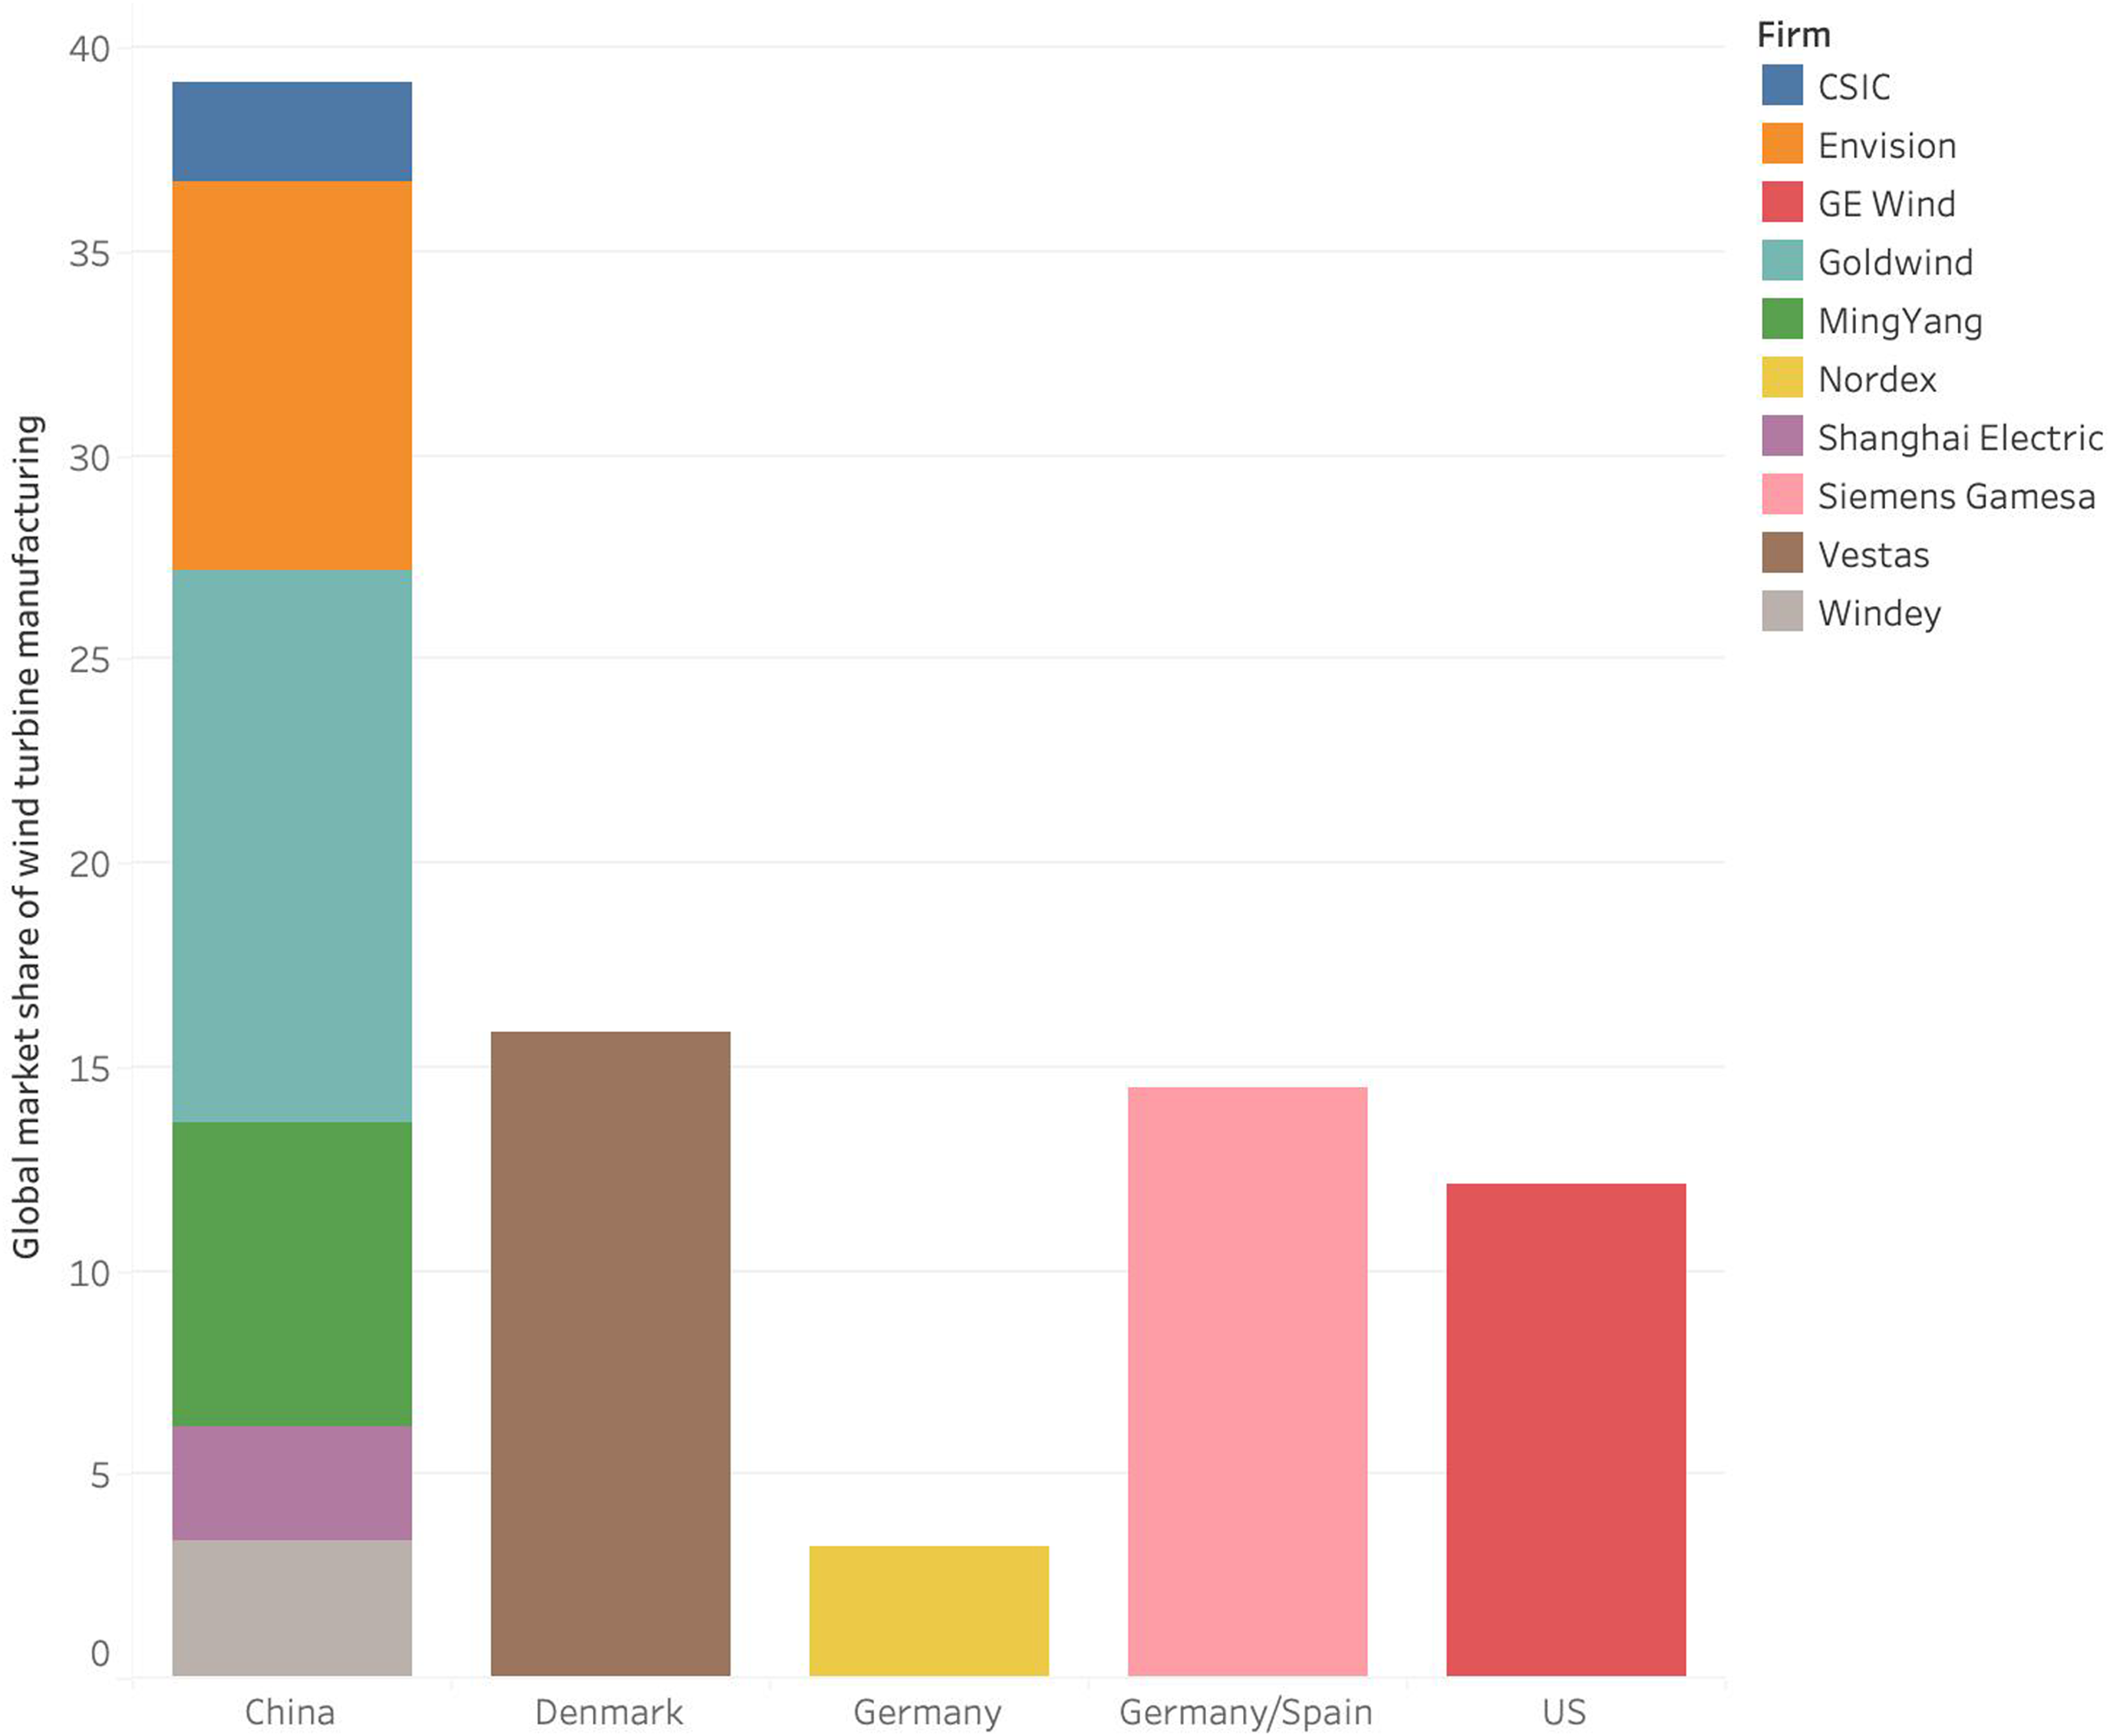
Figure 5. Global market share of wind turbine manufacturing (2019).
Source: BloombergNEF.
These figures are no accident. Production is cheaper in many other contexts. Furthermore, while the United States was blessed with abundant fossil fuel endowments, it is not as blessed at this time with as many critical minerals necessary for building the necessary goods for the green transition. Unsurprisingly, China has access to vaster quantities than anyone else (Lazard and Youngs, Reference Lazard and Youngs2021; Riofrancos, Reference Riofrancos2023).Footnote 12 President Biden canceled some tariffs on Chinese solar panel imports (Helman, Reference Helman2022), angering US producers, because the United States is unlikely to decarbonize without China. China’s dominance of green technologies extends, as well, to electric cars, producing and using far more than any other country (International Energy Agency, 2024). In, short, it may be that the US lacks the supply, the growth model, and – thanks to dollar centrality – perhaps the competitive pricing. Time will answer this question.
Decarbonizing the international monetary system?
This research essay is the first to overview some of the ways in which the structural position of US dollar centrality and strength may constrain global decarbonization. An exploration of existing and potential impediments alone has significant descriptive value for advancing future research and strategizing about decarbonization. This work invites an abundance of future research in three key areas.
First, national economies are globally interdependent and asymmetric (Driscoll, Reference Driscoll2024; Driscoll and Blyth, Reference Driscoll and Blyth2025; Johnston and Matthijs, Reference Johnston, Matthijs, Baccaro, Blyth and Pontusson2022; Schwartz and Blyth, Reference Schwartz, Blyth, Baccaro, Blyth and Pontusson2022). Thus, the interdependence of emissions among economies, current accounts, and trade needs to be mapped between countries. The circumstance of dollar centrality has enormous power implications among countries decarbonizing, given their position in the global hierarchy (Schwartz, Reference Schwartz2019). Second, while this research essay, limited in its scope, explored the ways in which dollar centrality and strength may impede decarbonization, there are surely ways it may help drive decarbonization (i.e., offering a degree of global stability, increased ability to borrow for the United States, etc.). The increased ability to borrow, no doubt, allowed the recent Inflation Reduction Act of 2022 to contain uncapped tax credits with massive investment potential (Sahay and Fertik, Reference Sahay and Fertik2022). A perspective on how the USD may accelerate decarbonization deserves representation in the academic literature as well. Third, this piece represents a new application of growth model theory to the problems of climate change and international monetary hierarchy and imbalances. Future growth model theory scholarship can expand this work to other settings and financial channels. It can also discuss the implications of these ideas for concepts such as growth regimes, growth coalitions, and growth strategies (Baccaro and Pontusson, Reference Baccaro and Pontusson2022; Hassel and Palier, Reference Hassel and Palier2023).
Finally, there is one ‘the chicken or the egg’ question to explore that is perhaps impossible to answer with complete closure: does the currency status or the country drive US emissions and carbon-intensive consumption? More concretely, would any country serving as currency hegemon and the world’s creditor have emissions increase? Or is the United States simply exceptional with its size, domestic resources, and geoeconomic power? Answering this question, without the appropriate and existing counterfactual cases to make comparisons, is challenging. My best answer is as follows. We are seeing a circumstance of both. We know that being the home to the world’s premier currency increases domestic household consumption (that is a feature not a bug). We also know that the United States has a higher comparative potential for carbon-intensive baseline consumption due to its abundant energy resources and size. Therefore, the dollar serving as the world’s premier currency can drive up consumption-side emissions in this particular country; it is both the currency status and the country. All in all, however, this question on emissions drivers and currency status, one point of many in this research essay, should be interrogated further in future research.
Regarding decarbonization outcomes and policy, beyond a new Bretton Woods (Gallagher and Kozul-Wright, Reference Gallagher and Kozul-Wright2022), rectifying monetary inequity and disequilibrium between higher and lower-income countries (Löscher and Kaltenbrunner, Reference Löscher and Kaltenbrunner2023; Svartzman and Althouse, Reference Svartzman and Althouse2022) is clearly critical. Lower-income countries can gain inspiration from Barbados Prime Minister Mia Mottley’s leadership and renegotiate their debts (Lustgarten, Reference Lustgarten2022). Other countries, like Vietnam, are attempting to build their green industries with local currency (Larsen, Reference Larsen2024). The International Monetary Fund can find inspiration, as well, from its once more radical origins, take more leadership, and distribute ‘climate-specific trusts’ and ‘special drawing rights’ to countries that are in the most debt and climate distress. Climate aspirations and development for emerging market economies are impossible without adequate financing.
Acknowledgments
I am grateful to Mark Blyth, Benjamin Braun, Tim Sahay, Mark Schwartz, and the anonymous Finance and Society reviewers for their comments. All errors are my own.


 Open access