


1. Introduction
Quantifying the absolute timing, rates and duration of geological processes is fundamental to nearly all interpretations of how such processes fit into a broader tectonic framework. Utilization of the U(-Th)-Pb decay system in zircon and/or monazite has been the dominant choice for investigations of high-temperature processes, such as crystallization of igneous rocks or deep crustal metamorphism (e.g. Hermann & Rubatto, Reference Hermann and Rubatto2003; Cottle, Lederer & Larson, Reference Cottle, Lederer and Larson2019; Larson et al., Reference Larson, Shrestha, Cottle, Guilmette, Johnson, Gibson and Gervais2022; Foster et al., Reference Foster, Parrish, Horstwood, Chenery, Pyle and Gibson2004). Advancements in laser ablation mass spectrometry-based in situ U(-Th)-Pb geochronology, and, in particular, the concomitant collection of trace element data (e.g., Kylander-Clark, Hacker & Cottle, Reference Kylander-Clark, Hacker and Cottle2013), have enabled myriad studies that better define the true nature of the metamorphic, magmatic and structural processes responsible for the development of orogenic systems (Hacker, Kylander-Clark & Holder, Reference Hacker, Kylander-Clark and Holder2019; Larson, Gervais & Kellett, Reference Larson, Gervais and Kellett2013; Cottle, Larson & Yakymchuk, Reference Cottle, Larson and Yakymchuk2018; Stearns et al., Reference Stearns, Cottle, Hacker and Kylander-Clark2016).
In many of these studies, especially those about metamorphism, the chemistries of accessory minerals associated with U(-Th)-Pb dates have been used to interpret the behaviour (i.e. growth, resorption) of other phases in the rock, informing the petrochronologic history (Foster et al., Reference Foster, Parrish, Horstwood, Chenery, Pyle and Gibson2004; Mottram et al., Reference Mottram, Parrish, Regis, Warren, Argles, Harris and Roberts2015; Shrestha et al., Reference Shrestha, Larson, Duesterhoeft, Soret and Cottle2019; Kohn et al., Reference Kohn, Catlos, Ryerson and Harrison2001). For example, monazite heavy rare Earth element (HREE) concentrations, often using Y or Yb/Gd as proxies, are commonly viewed as reflecting the growth/resorption histories of phases with higher partition coefficients for those elements such as xenotime and/or, more commonly, garnet (Pyle & Spear, Reference Pyle and Spear1999; Foster et al., Reference Foster, Kinny, Vance, Prince and Harris2000; Buick et al., Reference Buick, Hermann, Williams, Gibson and Rubatto2006; Kohn et al., Reference Kohn, Wieland, Parkinson and Upreti2005). Garnet in pelitic rocks acts as a primary sink for HREEs. As it grows, it depletes the available HREEs, limiting their incorporation into coeval monazite. (e.g. Pyle et al., Reference Pyle, Spear, Rudnick and Mcdonough2001a). When garnet resorbs (or is not a product), HREEs are more available to incorporate into coeval monazite. While other mineral phases, including xenotime, zircon, titanite and even apatite, can have an effect on HREE partitioning between monazite and garnet (e.g., Larson et al., Reference Larson, Shrestha, Cottle, Guilmette, Johnson, Gibson and Gervais2022; Shrestha et al., Reference Shrestha, Larson, Duesterhoeft, Soret and Cottle2019), in general, interpreting REE concentrations within monazite as dominated by garnet behaviour has informed construction of pressure-temperature-time (P-T-t) paths across a range of geologic settings and throughout Earth’s history.
As was the case early in the development of the U(-Th)-Pb geochronology, until recently, Lu-Hf geochronology required dissolving garnet, whole rock material and/or coeval phases to produce an isochron. The potential advantage of garnet Lu-Hf geochronology over U(-Th)-Pb geochronology is that it allows the dating of garnet, a major rock-forming phase, the chemistry of which is sensitive to changes in pressure, temperature and effective bulk composition. Instead of inferring garnet behaviour via accessory phase chemistry, the garnet itself can be directly dated. Until recently, however, the complex and lengthy process to dissolve garnet, and separate and measure the Lu and Hf, in order to date it as well as the loss of spatial context of the date(s), has limited its practical widespread usage. New developments in in situ garnet dating utilizing plasma-source tandem mass spectrometers equipped with reaction cells have enabled in situ garnet dating using the Lu-Hf system while maintaining spatial context (e.g., Simpson et al., Reference Simpson, Gilbert, Tamblyn, Hand, Spandler, Gillespie, Nixon and Glorie2021). Early studies applying this method have demonstrated its potential utility in identifying multiple age domains within individual garnet crystals (Larson et al., Reference Larson, Cottle, Button, Dyck, Lihter and Shrestha2024; Godet et al., Reference Godet, Jouvent, Laureijs, Guilmette, Larson, Coleman, Darveau and Côté-Roberge2024; Tamblyn et al., Reference Tamblyn, Hand, Simpson, Gilbert, Wade and Glorie2022; Kaempf et al., Reference Kaempf, Clark, Johnson, Jayananda, Alfing, Payne, Sajeev and Hand2025; Kaempf et al., Reference Kaempf, Johnson, Clark, Alfing, Brown, Lanari and Rankenburg2024). The precision of in situ Lu-Hf garnet dates, however, can be limited by the generally low abundances of Hf and/or limited spread in Lu/Hf ratios.
For metapelitic rocks, which commonly contain both garnet and monazite, the question arises as to how to best quantify the P-T-t history. Whereas using in-situ Lu-Hf enables direct dating of garnet, how, if at all, does the potential low-precision nature and/or relatively poor spatial resolution (c.f. monazite U(-Th)-Pb) of the technique limit interpretations? Moreover, does the often-employed assumption that the chemistry of monazite reflects the behaviour of garnet always hold true? In the present study, we examine two garnet and monazite-bearing metapelitic rocks from the Slave craton and compare the result of in situ U(-Th)-Pb monazite and Lu-Hf garnet measurements in order to directly compare the techniques and better inform choices regarding the suitability of each technique for retrieving the most useful insights into orogenic processes.
2. Methods
2.a. Specimen selection
Two garnet-sillimanite-cordierite migmatitic paragneiss specimens (396B and 488C2) were collected from the Archean basement exposure of the southern Slave Craton, on Simpson Island in Northwest Territories, Canada (61°39’50.3”N 112°45’49.0”W) (Fig. 1). These specimens were targeted specifically because garnet in old (i.e. >1 Ga) metapelites commonly contains sufficient Lu and radiogenic Hf concentrations to facilitate precise in situ Lu-Hf geochronology measurements (see Godet et al., Reference Godet, Jouvent, Laureijs, Guilmette, Larson, Coleman, Darveau and Côté-Roberge2024; Larson et al., Reference Larson, Cottle, Button, Dyck, Lihter and Shrestha2024).
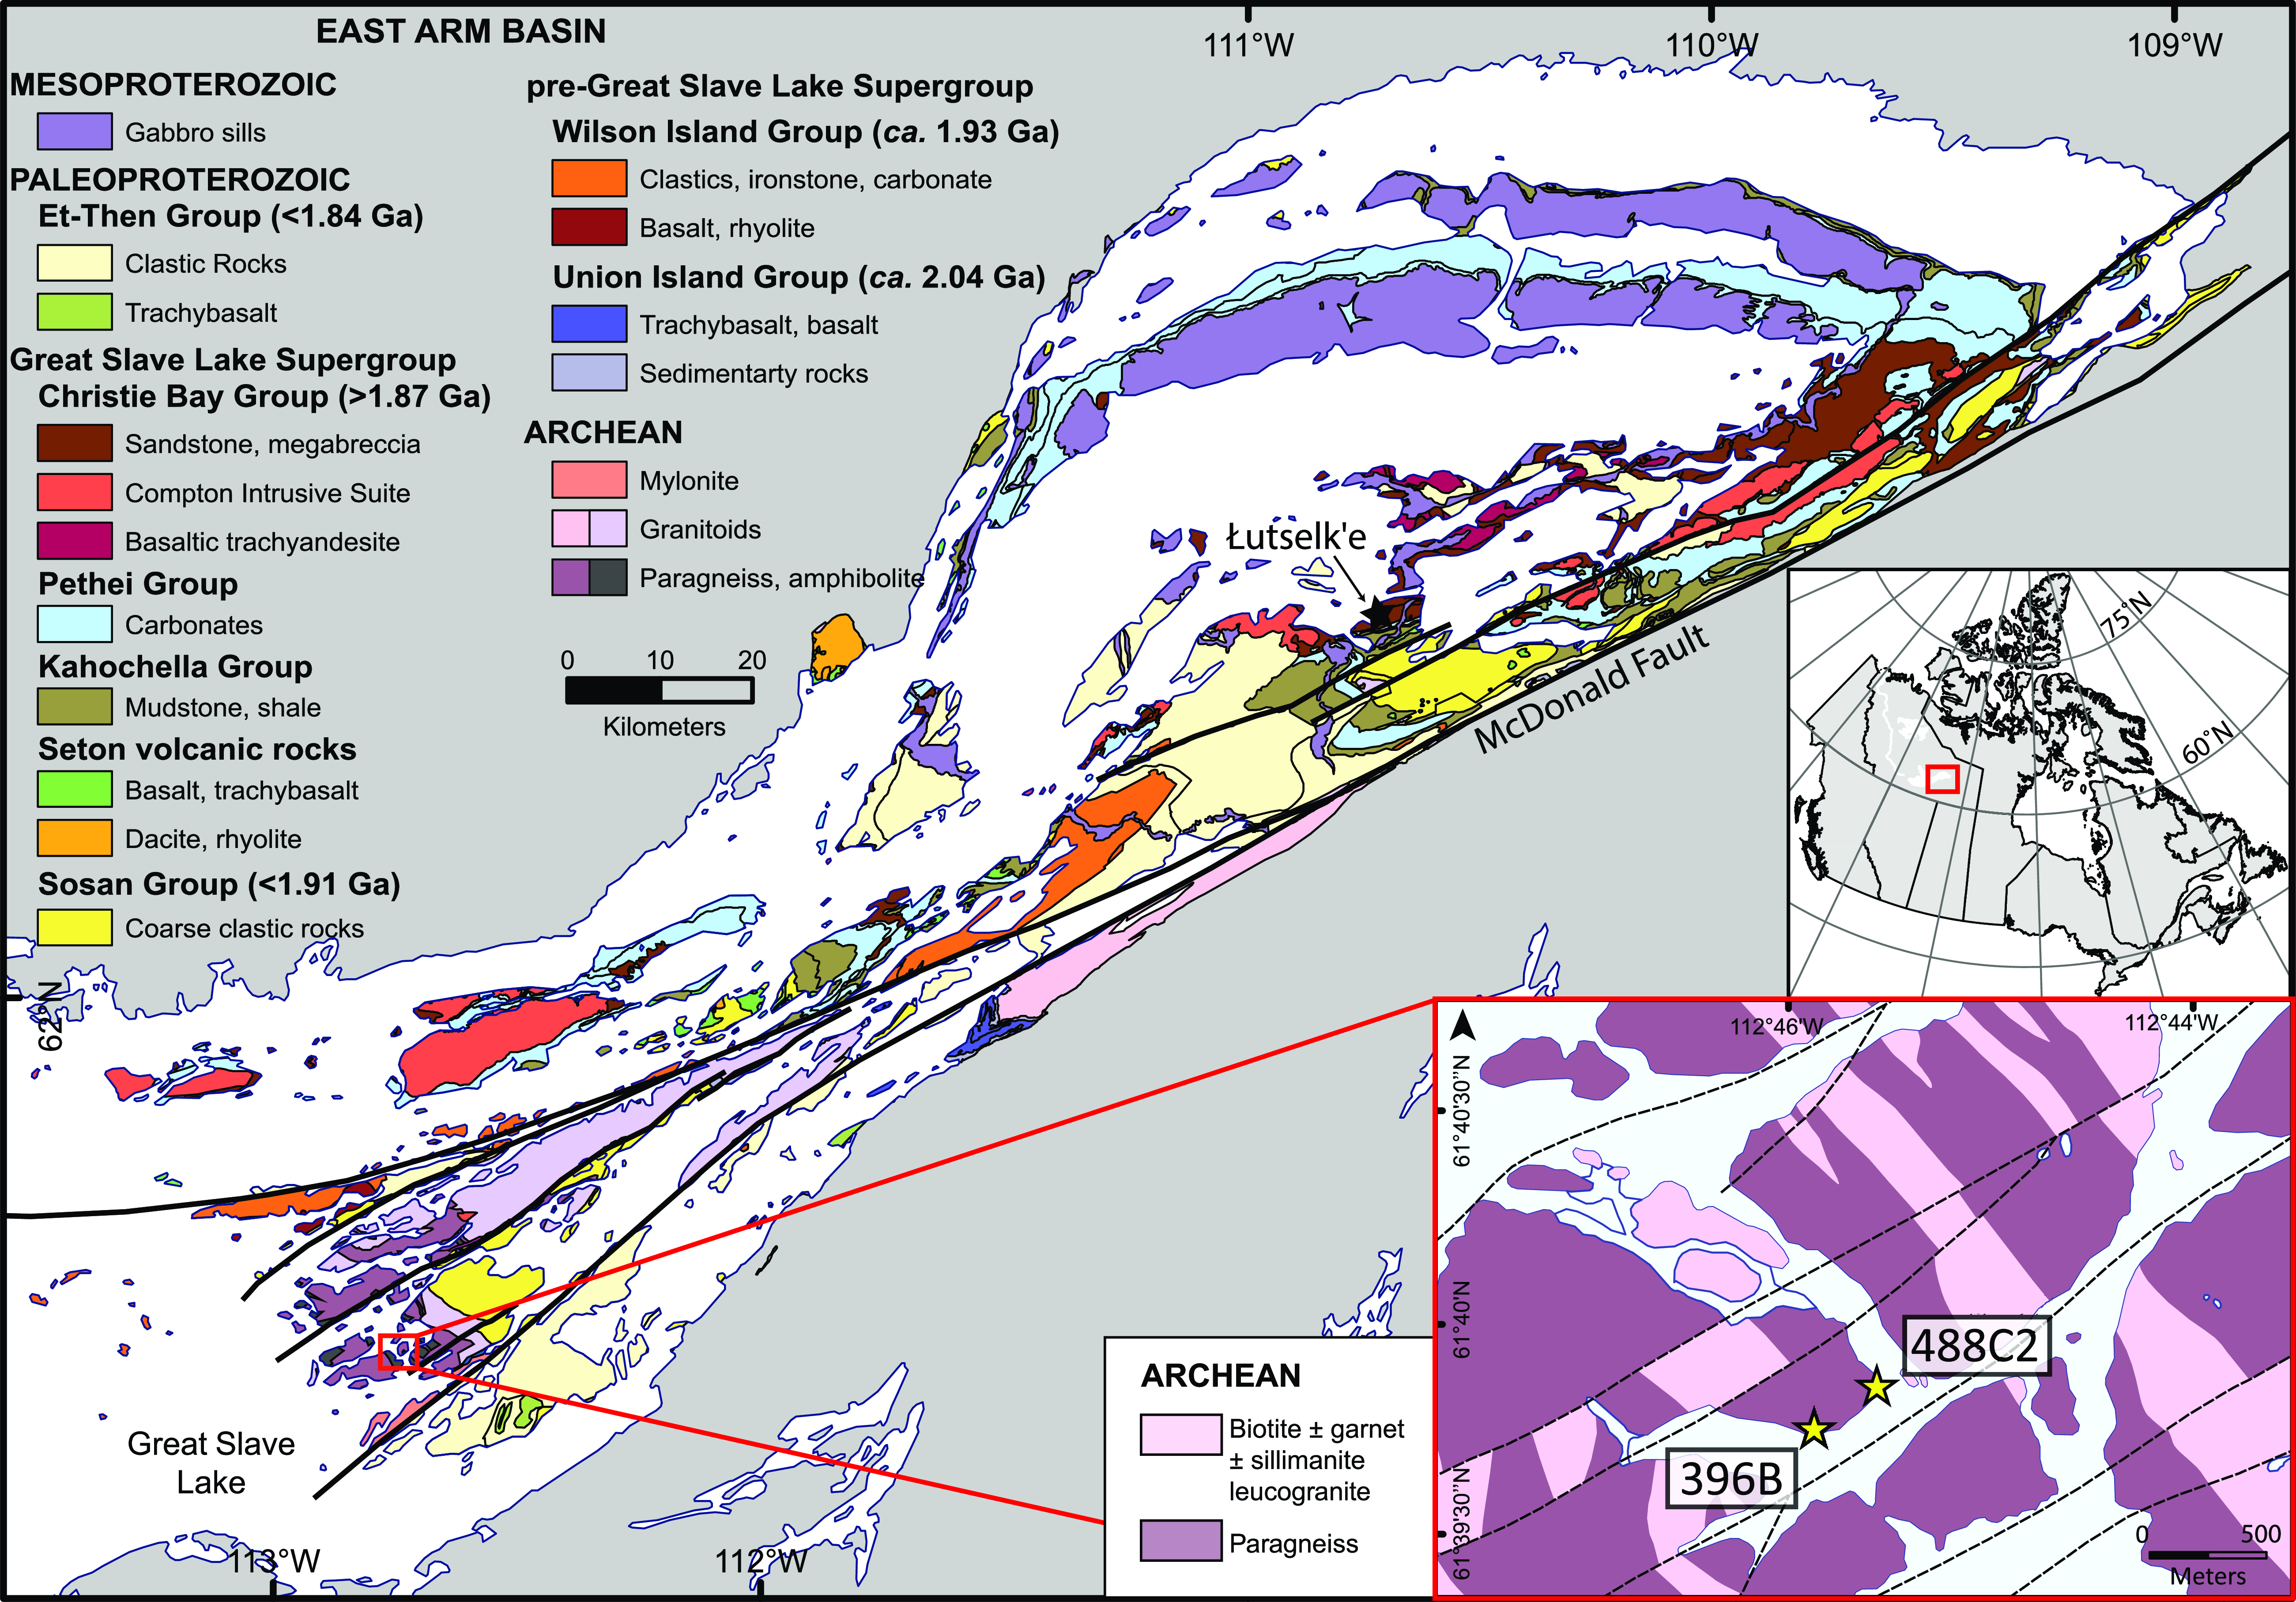
Figure 1. Geological map of the East Arm basin after Hoffman (Reference Hoffman1988), Lemkow and Wright (Reference Lemkow and Wright2013), and Canam et al. (Reference Canam, Macmillan, Cairns and Pierce2024). Insets show the location of the East Arm basin area within Canada and the sampling locations for specimens 396B and 488C2.
2.b. EDS phase mapping
The modal mineralogy of thin sections was characterized using automated mineralogy techniques that integrate backscattered electron (BSE) and energy dispersive spectrometry (EDS) (Gottlieb et al., Reference Gottlieb, Wilkie, Sutherland, Ho-Tun, Suthers, Perera, Jenkins, Spencer, Butcher and Rayner2000). The thin sections were analyzed at Vidence Inc., Burnaby, BC, Canada using a Hitachi SU3900 SEM fitted with a single large area (60 mm2) Bruker SDD EDS and running the AMICS automated mineralogy package, which indexes pixels on the basis of EDS spectra and BSE brightness. BSE brightness was calibrated against quartz, gold and/or copper standards. The EDS spectra were compared to a library of standards and minerals identified on a closest-match basis. Results provided high-resolution modal area analyses for all mineral phases, which were integrated with mineral chemistries to estimate the effective bulk composition for each sample. Acquisition settings are provided in the Supplementary File.
2.c. Electron microprobe analysis
Mineral compositions were obtained at the Fipke Laboratory for Trace Element Research (FiLTER) at the University of British Columbia, Okanagan (UBCO) using a Cameca SXFive Field Emission Electron Probe Microanalyser (EPMA). Data reduction was performed using the method of Pouchou and Pichoir (1985). Data were collected using 15keV voltage and 20nA current with a 5µm beam size for biotite, chlorite, garnet and plagioclase. To analyze pinitized cordierite (identified as muscovite in the phase maps) a 100µm beam size was used to measure a large area and integrate the composition of the very fine-grained alteration mineral. The standards used for calibration were garnet spessartine for Si and Mn, titanite for Ti, garnet almandine for Al and Fe, wollastonite for Ca, albite for Na, diopside for Mg, orthoclase for K, apatite for P, fluorite for F and synthetic KCl for Cl. WDS quantification of Si, Al and F used the LTAP crystal; Ti, Ca, K, P and Cl used the LPET crystal; Fe and Mn used the LLIF crystal; and Na and Mg used the TAP crystal.
Oxide data were converted to atoms per formula unit (a.p.f.u.) based on oxygen numbers in mineral formulae: 12 O – garnet, 22 O – biotite, 8 O – plagioclase, 18 O – cordierite and chlorite. Garnet endmember proportions were calculated as: almandine = Fe/(Fe+Mg+Ca+Mn), pyrope = Mg/(Fe+Mg+Ca+Mn), grossular = Ca/(Fe+Mg+Ca+Mn) and spessartine = Mn/(Fe+Mg+Ca+Mn). Mg number for ferromagnesic phases was calculated as Mg# = Mg/(Fe+Mg). Average mineral compositions used to calculate effective bulk composition and plot garnet isopleths are provided in Table 1, and a complete table of mineral compositions for all analyzed spots is provided in Table S1 the Supplementary Materials.
Table 1. Representative mineral compositions (wt.% oxide and cations per formula unit) for samples used in this study

2.d. Petrological modelling
Metamorphic phase diagrams, garnet isopleths and isomodes were calculated using Theriak-Domino petrological modelling software (de Capitani & Petrakakis, Reference De Capitani and Petrakakis2010). Effective bulk compositions for each thin section were constructed by integrating the mineral chemistry data from the EPMA with the modal proportions returned by automated mineralogy. All modelling was done in the MnO–Na2O–CaO–K2O–FeO–Fe2O3–MgO–Al2O3–SiO2–H2O–TiO2–O2 (MnNCKFMASHTO) chemical system using the internally consistent thermodynamic dataset ds-55 of Holland and Powell (Reference Holland and Powell1998- updated to 2012). Dataset ds-55 was chosen as it best replicates the stability and composition of garnet in amphibolite–granulite facies metapelitic rocks (e.g. Dyck et al., Reference Dyck, Goddard, Wallis, Hansen and Martel2021; McKenzie et al., Reference Mckenzie, Dyck, Gibson and Larson2024; Bowie et al., Reference Bowie, Daniel Gibson, Dyck, Godin and Larson2024). Activity–composition relations used include those for melt, garnet, biotite and ilmenite (White, Powell & Holland, Reference White, Powell and Holland2007), feldspar (Holland & Powell, Reference Holland and Powell2003) and white mica (Coggon & Holland, Reference Coggon and Holland2002). Uncertainty on pressures and temperatures associated with assemblage boundaries, isopleths and isomodes on metamorphic phase diagrams is estimated to be ± 20–30°C and ± 0.05 GPa at 1σ, but is notably reaction-dependent, with larger uncertainties typically attributed to field boundaries that mark change in stability of minor oxides (Palin et al., Reference Palin, Weller, Waters and Dyck2016). In both models, H2O was set to minimally saturate (i.e., 0.05 mol% free H2O) the mineral assemblage at the solidus at a set pressure of 0.5 GPa. Therefore, assemblages modelled below the solidus are not applicable to the prograde portions of the P–T path, as an unknown proportion of water was lost prior to melt initiation (e.g. Dyck et al., Reference Dyck, Waters, St-onge and Searle2020).
2. e. U(-Th)-Pb Petrochronology
Monazite U-Pb analyses were carried out in the Fipke Laboratory for Trace Element Research (FiLTER) at the University of British Columbia, Okanagan (UBCO) using an Elemental Scientific Lasers NWR Excimer 193 nm laser paired with an Agilent 8900 triple quadrupole inductively coupled plasma mass spectrometer (QQQ-ICP-MS) run in single quadrupole mode. The signal on the mass spectrometer was tuned for maximal Pb, U and Th signal using the reference glass ‘SRM-NIST610’, while minimizing associated oxide production (i.e. ThO). A circular laser spot with a 10-micron diameter was used for analyses with an estimated laser fluence of 2.5 J/cm2, a repetition rate of 6 Hz and typical pit depths of 5-7 microns. Each analytical site was ‘pre-cleaned’ with two laser pulses prior to the main ablation; analyses comprised 25 s of ablation followed by 20 s washout. The analyte was transported to the QQQ-ICP-MS via a 0.3 L/min He carrier gas, which was mixed with 0.85 L/min Ar sample gas prior to entering the plasma with an in-house signal smoothing device. Nitrogen gas (N2) was introduced to the plasma (3 ml/min) to enhance sensitivity (Hu et al., Reference Hu, Gao, Liu, Hu, Chen and Yuan2008). Reference monazites were analyzed at the start and end of the analytic session and after every 10–15 unknown analyses. After background subtraction, instrumental mass bias, drift and laser-induced elemental downhole fractionation were corrected against a primary reference matrix-matched monazite (see below) using Iolite v.4.5 (Paton et al., Reference Paton, Woodhead, Hellstrom, Hergt, Greig and Maas2010; Paton et al., Reference Paton, Hellstrom, Paul, Woodhead and Hergt2011).
The reference monazite ‘44069’ (206Pb/238U Isotope Dilution-Thermal Ionization Mass Spectrometry (ID-TIMS) age of 424.9 ± 0.4 Ma -Aleinikoff et al., Reference Aleinikoff, Schenck, Plank, Srogi, Fanning, Kamo and Bosbyshell2006) was used as the primary calibration with ‘Bananeira’ (206Pb/238U ID-TIMS age of 511.9 ± 1.5 Ma -Horstwood et al., Reference Horstwood, Košler, Gehrels, Jackson, Mclean, Paton, Pearson, Sircombe, Sylvester, Vermeesch, Bowring, Condon and Schoene2016; 206Pb/238U Laser Ablation-Inductively Coupled Plasma-Mass Spectrometry age of 508 ± 1 Ma -Kylander-Clark, Hacker & Cottle, Reference Kylander-Clark, Hacker and Cottle2013), ‘Trebilcock’ (235U/204Pb-207Pb/204Pb date of 272 ± 4 Ma -Tomascak, Krogstad & Walker, Reference Tomascak, Krogstad and Walker1996) and ‘STK’ monazite (207Pb-corrected 206Pb/238U dates range between 1043 ± 1 Ma and 1027 ± 1 Ma - Fisher et al., Reference Fisher, Bauer, Luo, Sarkar, Hanchar, Vervoort, Tapster, Horstwood and Pearson2020) were analyzed as secondary reference materials to verify the methodology and estimate excess dispersion. Excess dispersion of 0.5% was added in quadrature to the isotopic ratios of all analyses; the results of all secondary reference monazite overlap with expected dates. Fifteen analyses of Trebilcock define a weighted mean 207Pb-corrected 206Pb/238U date of 273 ± 1 Ma (mean square weighted deviation (MSWD) = 0.84, n = 15/15), while the same number of analyses of Bananeira yield an over-dispersed weighted mean 207Pb-corrected 206Pb/238U date of 509 ± 2 Ma (MSWD = 3.7, n = 15/15). STK analyses define a 207Pb-corrected 206Pb/238U weighted mean date of 1046 ± 3 Ma (MSWD = 0.74, 15/15) and a207Pb/206Pb date, uncorrected for common lead, of 1026 ± 6 Ma (MSWD = 1.2, n = 15/15).
Yttrium concentrations for each monazite spot were normalized to repeat analyses of ‘Bananeira’(Kylander-Clark, Hacker & Cottle, Reference Kylander-Clark, Hacker and Cottle2013) semi-quantitatively (e.g. Longerich, Jackson & Günther, Reference Longerich, Jackson and Günther1996); 89Y was monitored for 5 ms. Analyses of reference monazites 44069 and Trebilcock returned values within 15 and 25 % of expected, respectively, though both are known to be somewhat heterogeneous with respect to trace elements (Kylander-Clark, Hacker & Cottle, Reference Kylander-Clark, Hacker and Cottle2013).
2.f. Lu-Hf Geochronology
Garnet Lu-Hf geochronology was also performed in the FiLTER facility at UBCO using the same instrumentation as outlined above with the same basic setup and tuning procedure. Following the methods outlined in Simpson et al. (Reference Simpson, Gilbert, Tamblyn, Hand, Spandler, Gillespie, Nixon and Glorie2021; Reference Simpson, Glorie, Hand, Spandler, Gilbert and Cave2022), once optimized, the QQQ-ICP-MS was run in MS/MS and the reaction cell was charged with NH3 gas (90% He:10%NH3 at a rate of 0.37 ml/min) to facilitate separation of isobaric interference on 176Lu and 176Hf through the production of complex adduct ions. The glass reference material SRM-NIST610 (Jochum et al., Reference Jochum, Weis, Stoll, Kuzmin, Yang, Raczek, Jacob, Stracke, Birbaum, Frick, Günther and Enzweiler2011; Nebel, Morel & Vroon, Reference Nebel, Morel and Vroon2009) was used for primary calibration and to correct instrument drift through the analytical session. Corrections for background, instrumental mass bias and drift were carried out using Iolite v.4.5 (Paton et al., Reference Paton, Hellstrom, Paul, Woodhead and Hergt2011) with an in-house developed data reduction scheme (Larson, Reference Larson2024). SRM-NIST610 was analyzed using spot sizes of 30 and 60 microns such that analyses measured in both pulse and analogue detector modes could be accurately calibrated. Analyses of the reference material Högsbo ca. 1030 Ma (U-Pb on columbite; Romer & Smeds, Reference Romer and Smeds1996) used a 65-micron diameter laser spot, with those for other reference materials, Granite Mountain (ca. 2630 Ma U-Pb on apatite – C. McFarlane Pers. Comm) and Skaha (72.4 ± 0.6 Ma dissolution garnet Lu-Hf; in-house), and all unknowns, used a 150-micron diameter spot. The laser spots used a fluence of ∼4 J/cm2 with a repetition rate of 10 Hz over 40 seconds of analysis, resulting in craters <5 microns um deep, followed by a 25 s washout. The sample gas (He) was run at a rate of 0.350 ml/min, while the Ar for the ICP, which was mixed with the He via an in-house developed signal smoothing device, was run at 0.9 ml/min. As with the monazite analyses, N2 was added to the plasma at a rate of 0.3 ml/min to improve sensitivity.
A sample-standard bracketing approach was used, with analyses of reference materials carried out every 10–15 unknowns. Excess dispersion measured in the radiogenic ratios of the reference materials (typically the SRM-NIST610 spot size not being used for primary normalization) were propagated through to the unknowns in quadrature. After normalization to SRM-NIST610, Lu-Hf ratios were matrix corrected using Högsbo garnet. Matrix-corrected analyses of Granite Mountain garnet yield a freely regressed isochron date of 2562 ± 137 Ma (MSWD = 0.8, n = 24/24), while analyses of Skaha garnet return an isochron of 73 ± 7 (MSWD = 1.8, n = 25/25) when regressed through an assumed initial 176Hf/177Hf ratio of 0.2829 ± 0.003. These dates overlap the reference dates for both Granite Mountain and Skaha.
3. Results
3.a. Petrography & mineral chemistry
3.a.1. Specimen 396B
The thin section for 396B is made up of pinitized cordierite (∼41%), plagioclase (∼21%), sillimanite (∼11%), biotite (∼8%), garnet (∼7%), quartz (∼7%) and minor chlorite localized in fractures (∼4%), and accessory ilmenite and monazite (Fig. 2a). Centimetre-scale kyanite blades were observed in outcrop (Fig. 2b). However, analysis of the thin section reveals that sillimanite has fully replaced kyanite. This thin section contains one large (∼1 cm) partially resorbed garnet surrounded by a rim of cordierite, plagioclase and sillimanite. The garnet core composition is Alm0.74Prp0.22Grs0.02Sps0.02 with a slight increase in almandine content towards the rim (Fig. 3). Biotite (XMg = 0.54) is found throughout the sample, forming both fine-grained intergrowths with plagioclase and large idiomorphic grains intergrown with cordierite (Fig. 2c). Despite pervasive pinitization, cordierite domains preserve a ∼5/4 ratio in molar Si/Al with a XMg = 0.59 (Table 1). Quartz is largely restricted to a leucosome on the periphery of the section (Fig. 2a).
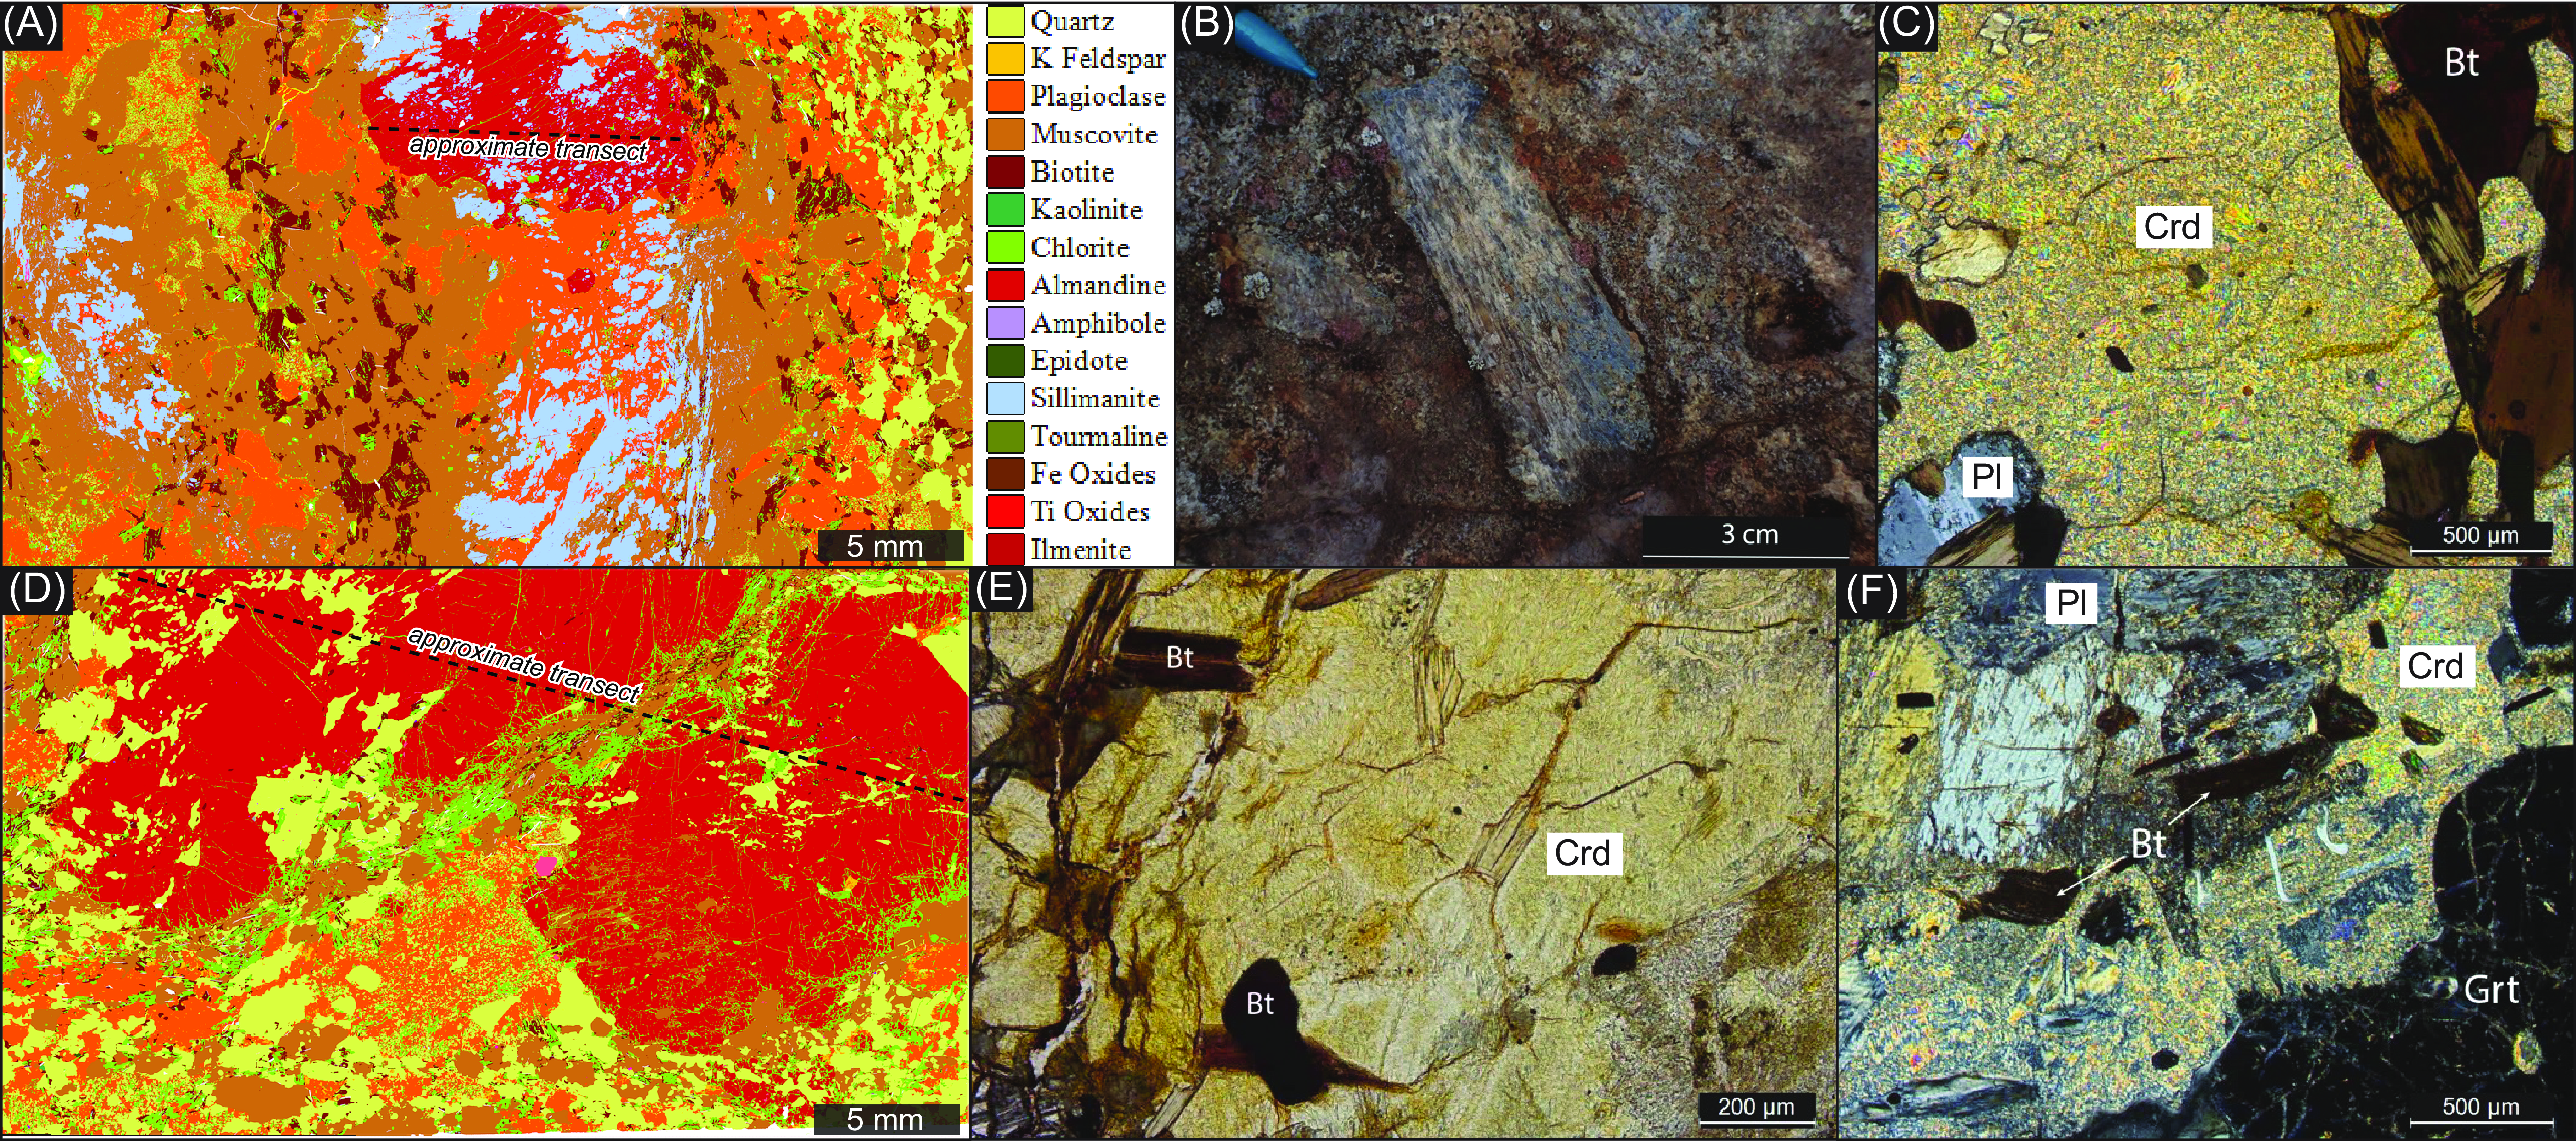
Figure 2. Sample petrography. A) Energy dispersive spectrometry (EDS) phase map for specimen 396B. B) Kyanite porphyroblast in outcrop where specimen 396B was collected. C) Pinitized cordierite domains in specimen 396B. D) EDS phase map for specimen 488C2 with same phase colouring as in frame A. E) Pinitized cordierite domains in specimen 488C2. F) Corona of cordierite surrounding garnet in specimen 488C2.
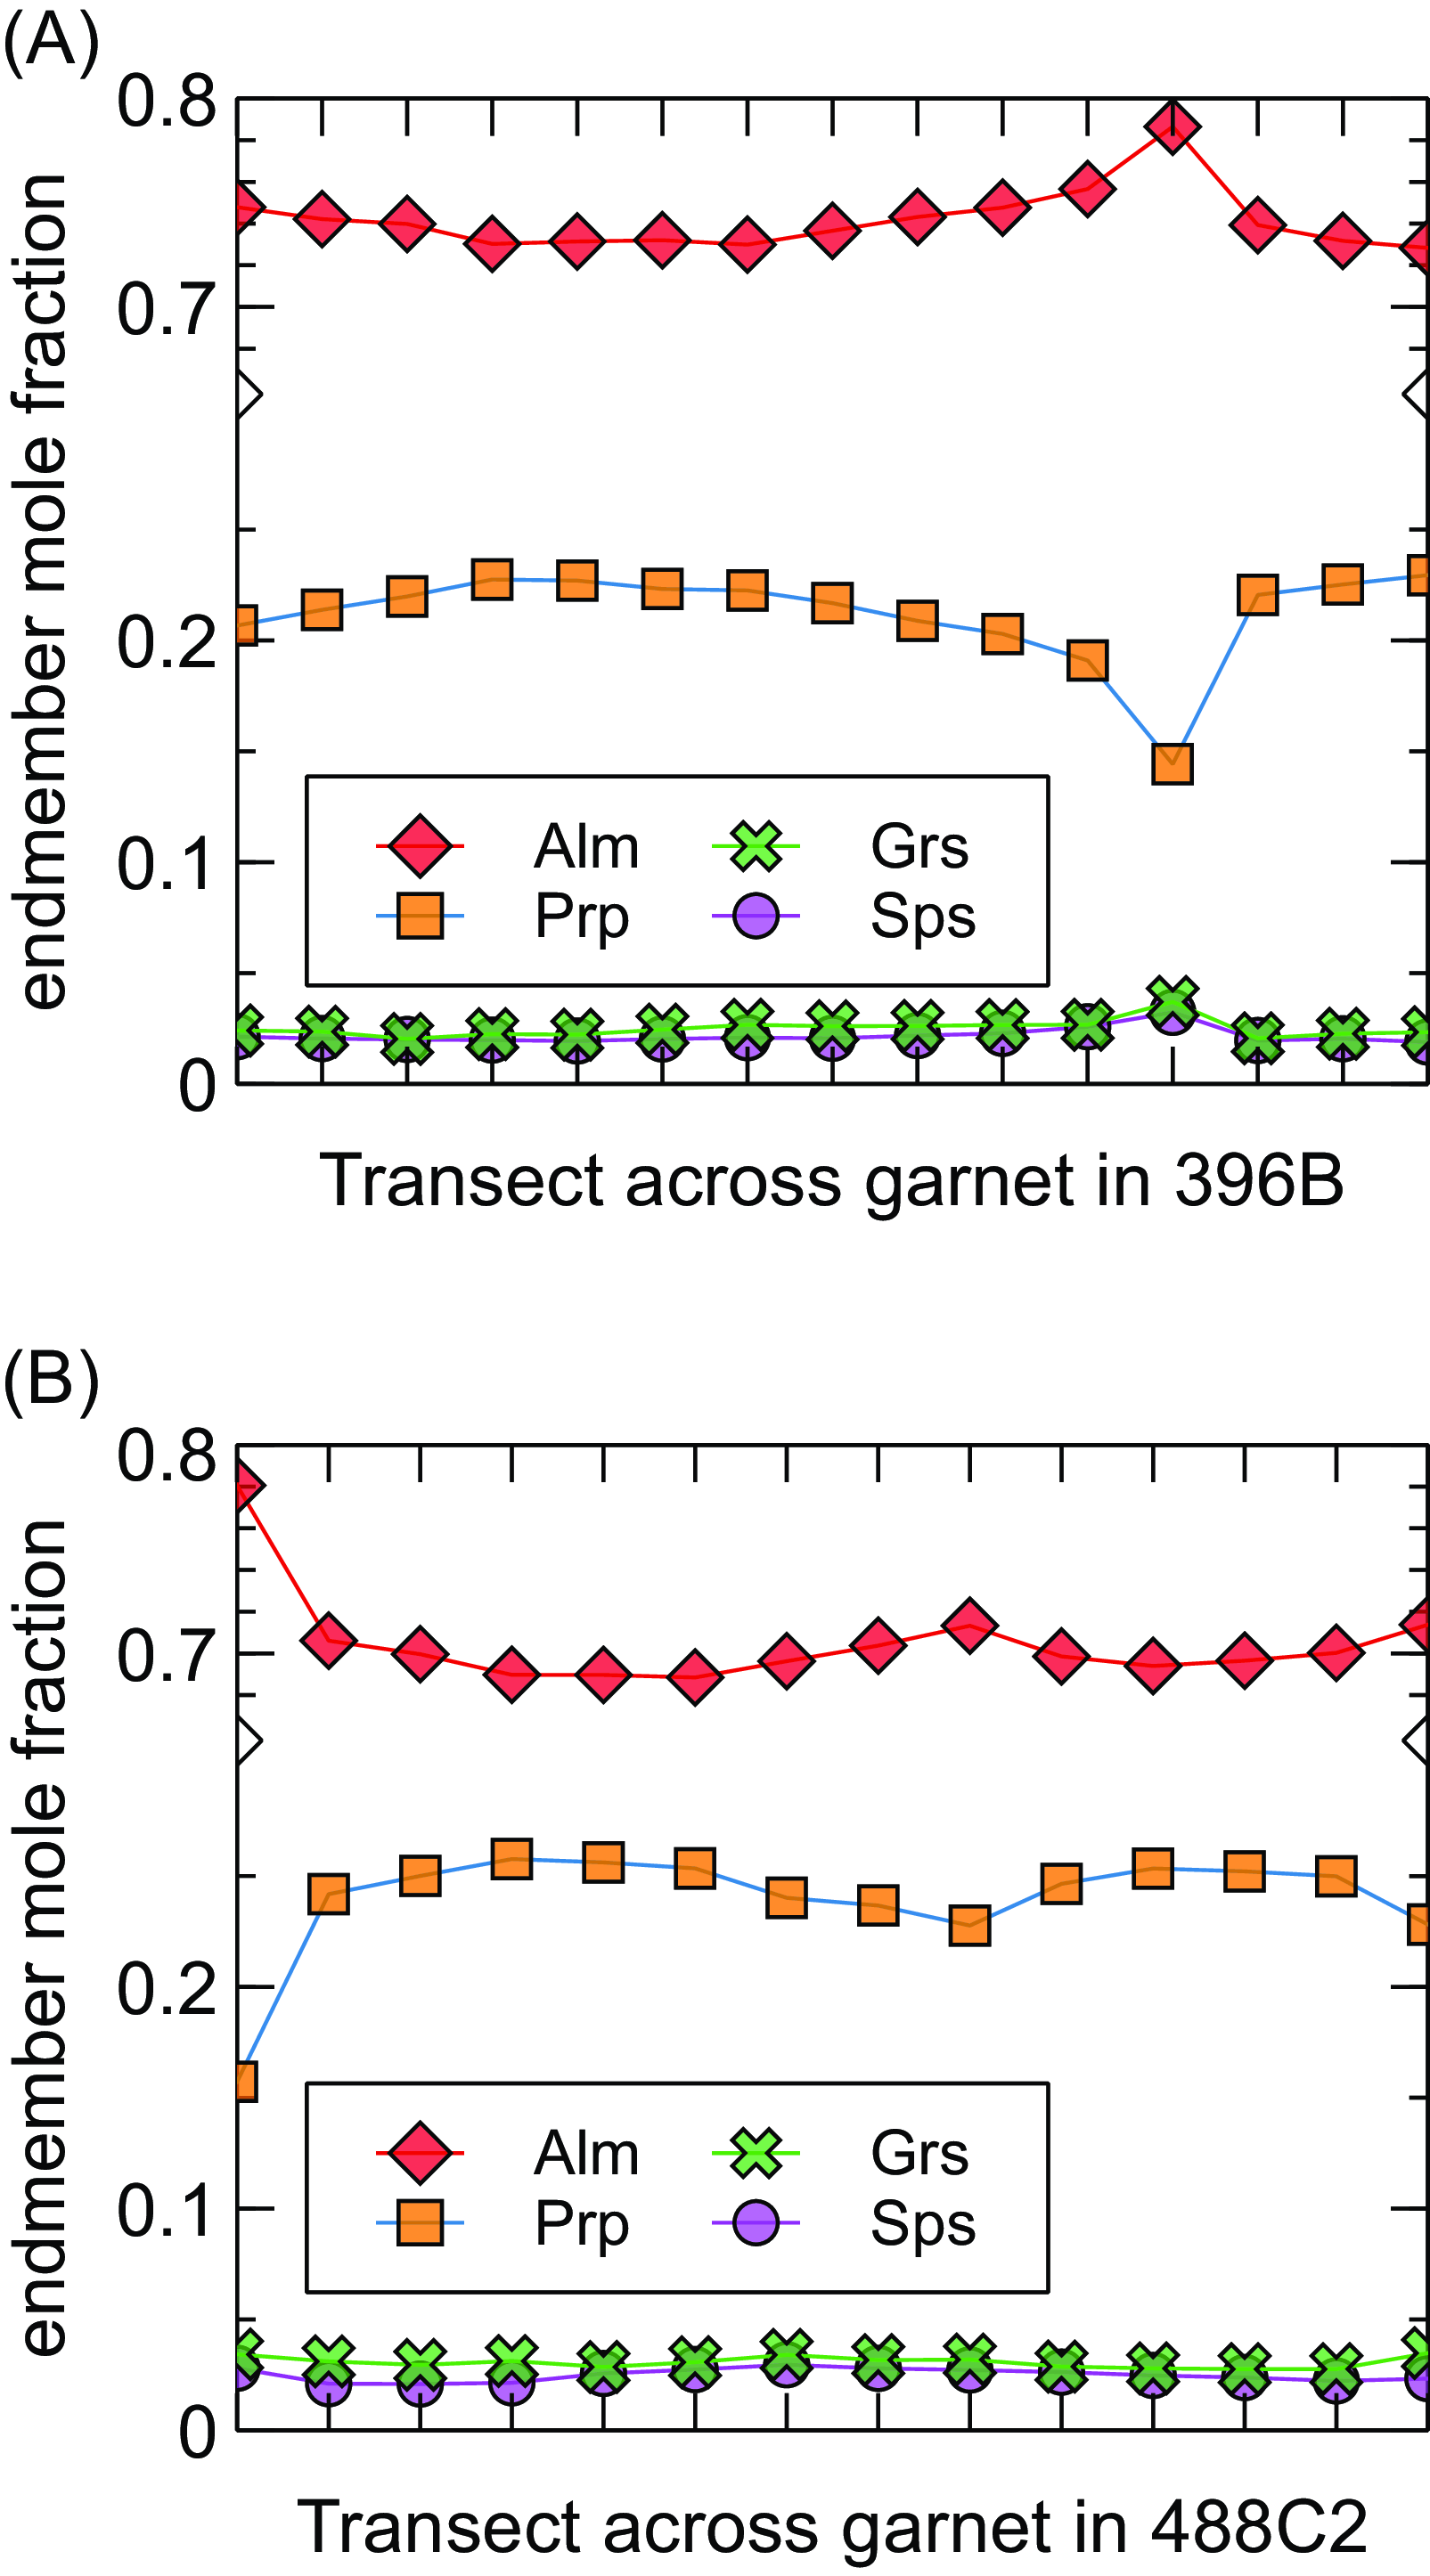
Figure 3. Electron Probe Microanalyser garnet line profiles for A) specimen 396B, and B) specimen 488C2. Plot created using the free scientific plotting software Veusz (Sanders, Reference Sanders2023).
3.a.2. Specimen 488C2
The thin section of 488C2 contains garnet (∼42%), quartz (∼20%), pinitized cordierite (∼14%), plagioclase (∼10%), chlorite (∼10%), biotite (∼2%), with accessory K-feldspar, monazite and apatite (Fig. 2d). The thin section was cut to bisect a single large (∼3 cm diameter) garnet that is surrounded by a rim of pinitized cordierite (Figs. 2e, f). An EPMA transect of the lower right garnet revealed endmember proportions of Alm0.70Prp0.24Grs0.03Sps0.02 (Table 1). There is a slight decrease in pyrope and an increase in almandine from core to rim (Fig. 3). Biotite forms a fine-grained matrix phase with a XMg = 0.51. Pinitized cordierite domains preserve a Si/Al molar ratio of ∼5/4 and a XMg = 0.61 (Table 1). Quartz forms corona around garnet and is also found in association with plagioclase in a leucosome (Fig. 2a)
3.b. Pressure–temperature conditions and garnet stability
Modelled phase assemblages and garnet isopleths were used to estimate peak P–T conditions for each analyzed sample (Figs. 4, 5). In both models, isopleths of pyrope and grossular replicate the measured garnet composition at ∼5.5 ± 0.5 kbar and ∼775 ± 30 °C within the stability field of garnet–biotite–sillimanite–plagioclase–K-feldspar–ilmenite ± cordierite ± quartz. The observed decrease in pyrope and an increase in almandine from core to rim is consistent with the rocks having decompressed at or near peak temperatures towards cordierite-bearing stability fields. While otherwise unconstrained, the prograde paths would have traversed a kyanite-bearing field prior to entering the sillimanite stability field. Figure 6 shows the abundance of garnet for each modelled bulk composition over the same pressure–temperature range. As seen in both models, garnet is likely to have grown along the prograde path and then subsequently been consumed during either a combination of decompression and/or cooling post-peak conditions.
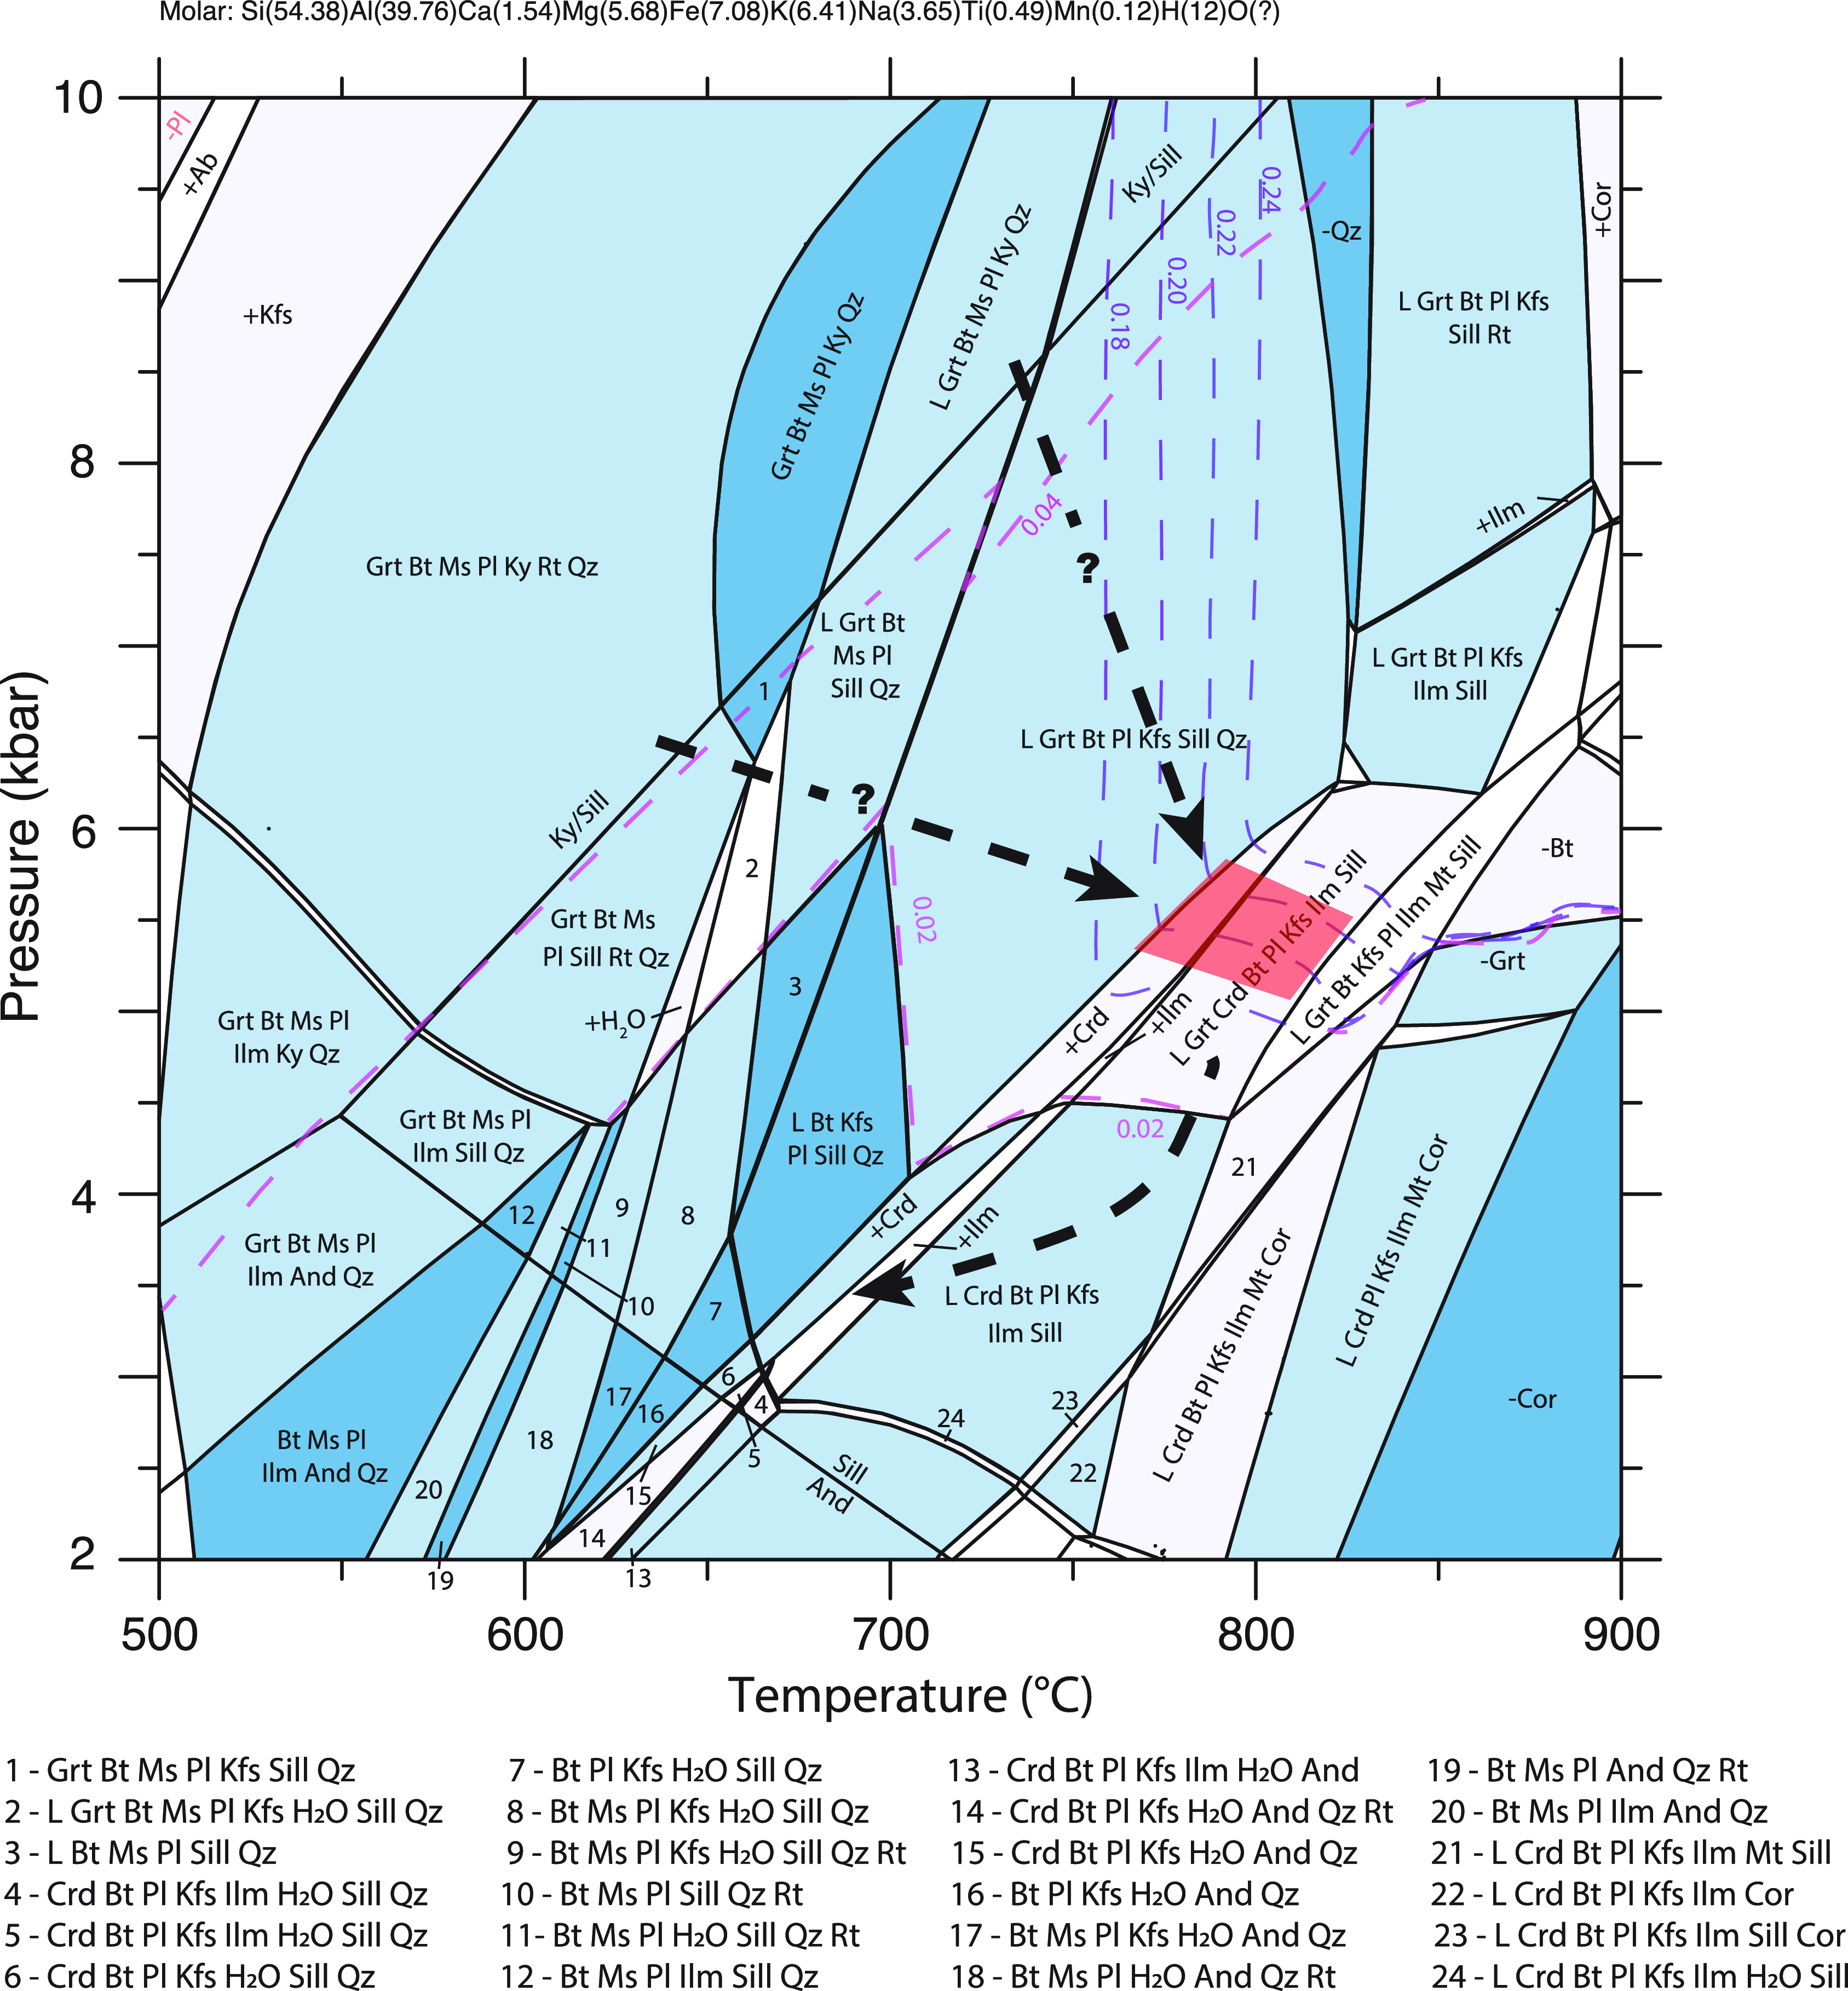
Figure 4. Pressure–temperature pseudosection for specimen 396B. Relevant fields are contoured for pyrope (blue) and grossular (pink) isopleths. Red polygon represents the garnet rim composition (± 10% of end-member mole fraction).
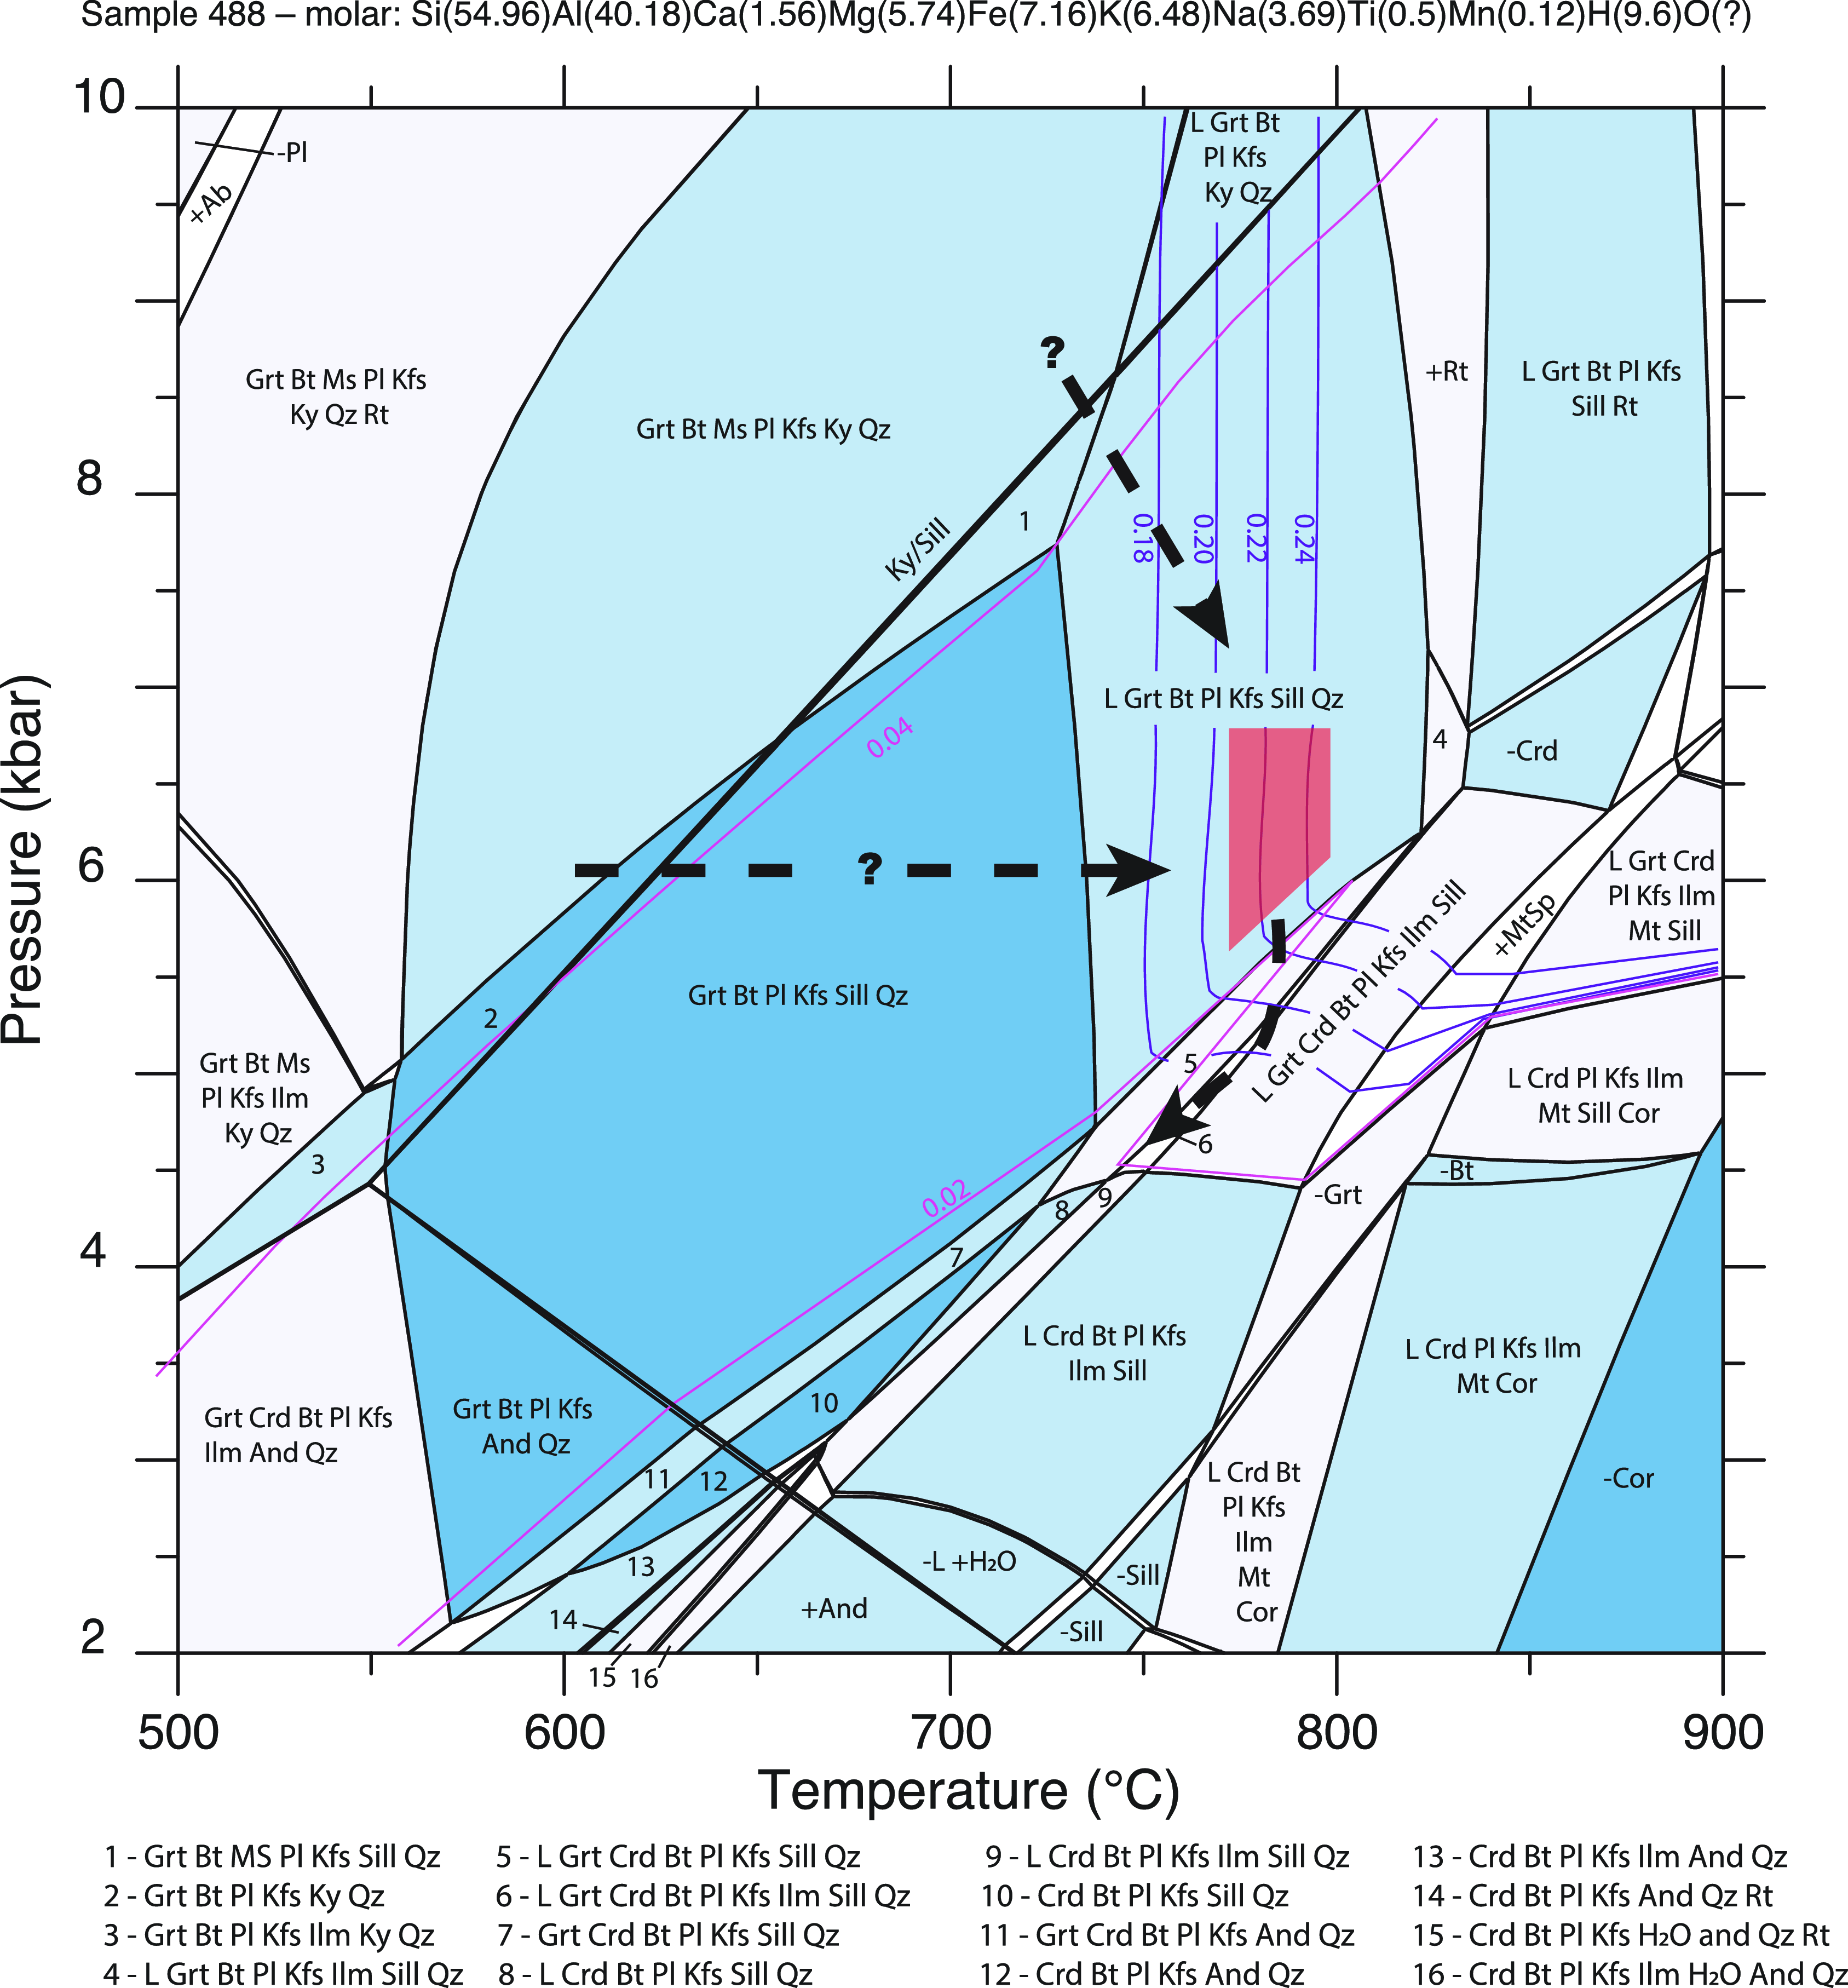
Figure 5. Pressure–temperature pseudosection for specimen 488C2. Relevant fields are contoured for pyrope (blue) and grossular (pink) isopleths. Red polygon represents the garnet rim composition (± 10% of end-member mole fraction).
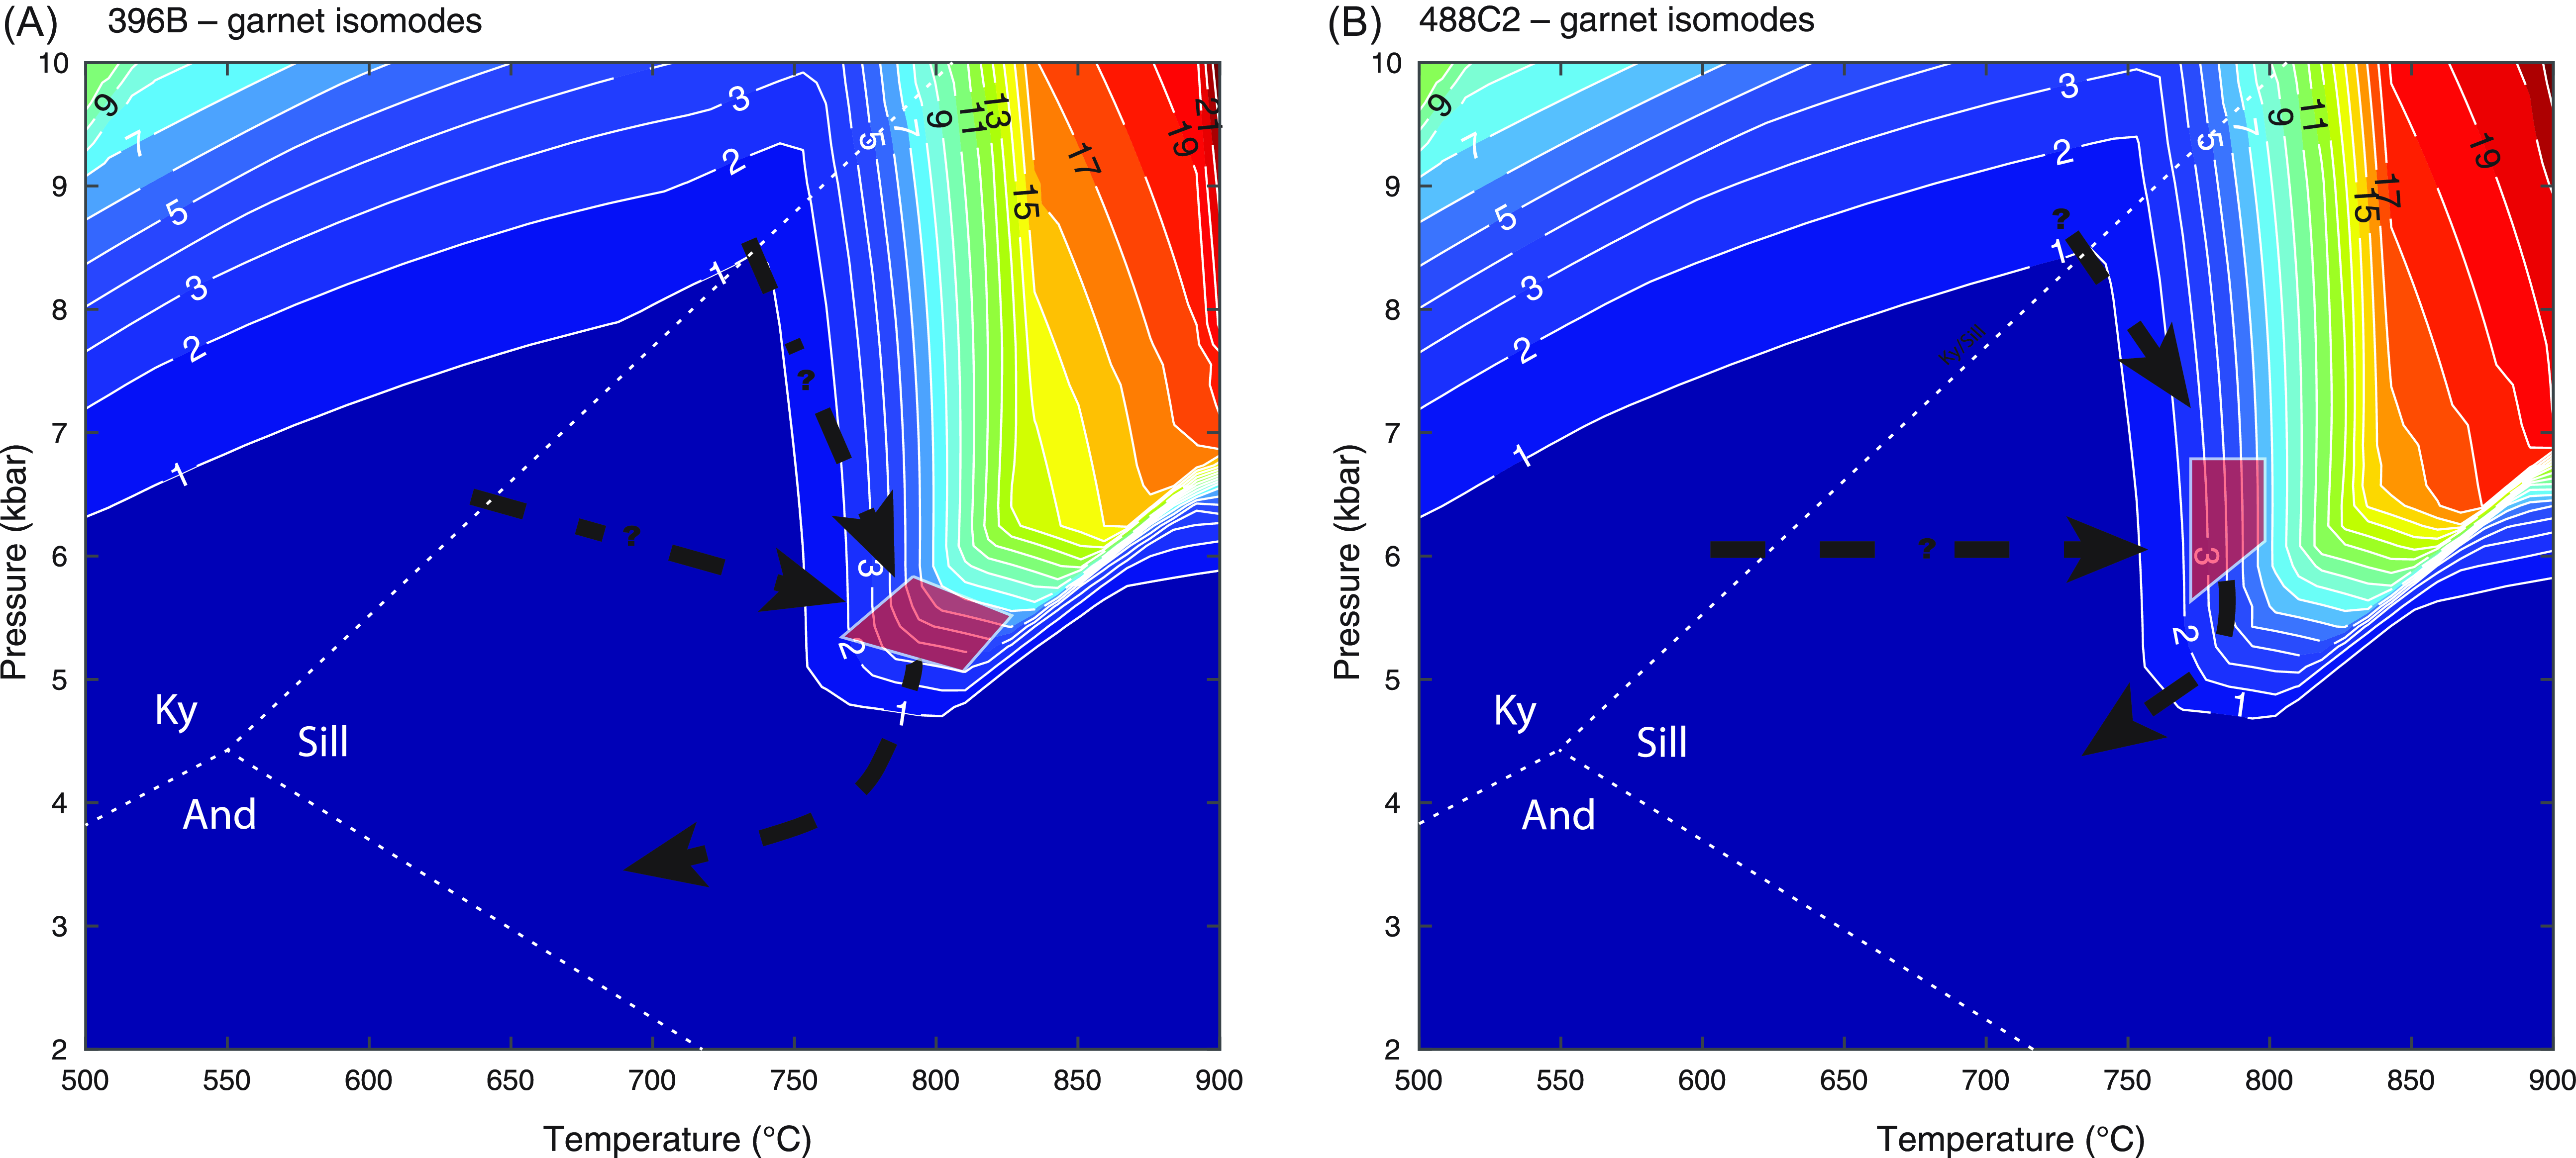
Figure 6. Pressure–temperature pseudosections for A) 396B and B) 488C2 contoured to show isomodes of garnet. Sections are overlain by the interpreted pressure–temperature paths (black lines) and conditions of garnet rim equilibration (red polygons).
3.c. U(-Th)-Pb Petrochronology
Sixty laser ablation spots across 10 monazite grains were measured in specimen 396B (Fig. S1). Concordant 207Pb/206Pb dates range between 2484 ± 32 Ma and 2979 ± 46 Ma (Table S2) with a dominant population between ca. 2500 and 2600 Ma (Fig. 7A). Yttrium concentrations range between ∼2230 and 28700 ppm with the lowest concentrations generally associated with the oldest dates (Fig. 7B).

Figure 7. Summary of monazite geochronology results. A and B) Tera-Wasserburg concordia plots of monazite analyses in specimens 396B and 488C2, respectively, created using the ChrontouR package (Larson, Reference Larson2020) for the open R scripting platform. C) Kernel density estimation plots of 207Pb/206Pb dates from the specimens analyzed. A kernel bandwidth of 12 was used for both specimens. D) 207Pb/206Pb date versus approximate Y concentration for both specimens as marked created using the free Veusz scientific plotting package. E) Two-dimensional Gaussian mixture modelling of the combined 207Pb/206Pb date and Y concentration data from specimens 396B and 488C2 using the mclust package (v.6.0.0; Scrucca et al., Reference Scrucca, Fop, Murphy and Raftery2016) for the open R scripting platform. F) Radial plot (Galbraith, Reference Galbraith1990) with automated de-mixing of the combined 207Pb/206Pb dates from both specimens where t = the 207Pb/206Pb date and σ = uncertainty (as 1 standard error) of the date. Identified population peaks are as listed; those with a probability (prob) > 40% are in bold font. Plot created using the IsoplotR package (Vermeesch, Reference Vermeesch2018) for the open R scripting platform.
In specimen 488C2, 44 laser spots across 7 monazite grains (Fig. S1) yield concordant 207Pb/206Pb dates that range between 2529 ± 16 Ma and 2779 ± 26 Ma (Table S2) with a dominant population between ca. 2550 and 2600 Ma (Fig. 7C). Yttrium concentrations range from ∼1970 to 17240 ppm with no statistically significant correlation with date (Fig. 7D).
3.d. Lu-Hf Geochronology
One large garnet grain within specimen 396B was targeted for Lu-Hf geochronological analysis (Fig. 8A). One hundred and three spots define a single 176Lu/177Hf versus 176Hf/177Hf isochron age of 2568 ± 38 Ma (Fig. 3B; MSWD = 1.2). Approximate Lu concentrations range between 0.4 and 12 ppm with higher values spatially associated with grain cores (Fig. 8A). Isochrons defined by either core or rim-only analyses only (Table S3) overlap within uncertainty.
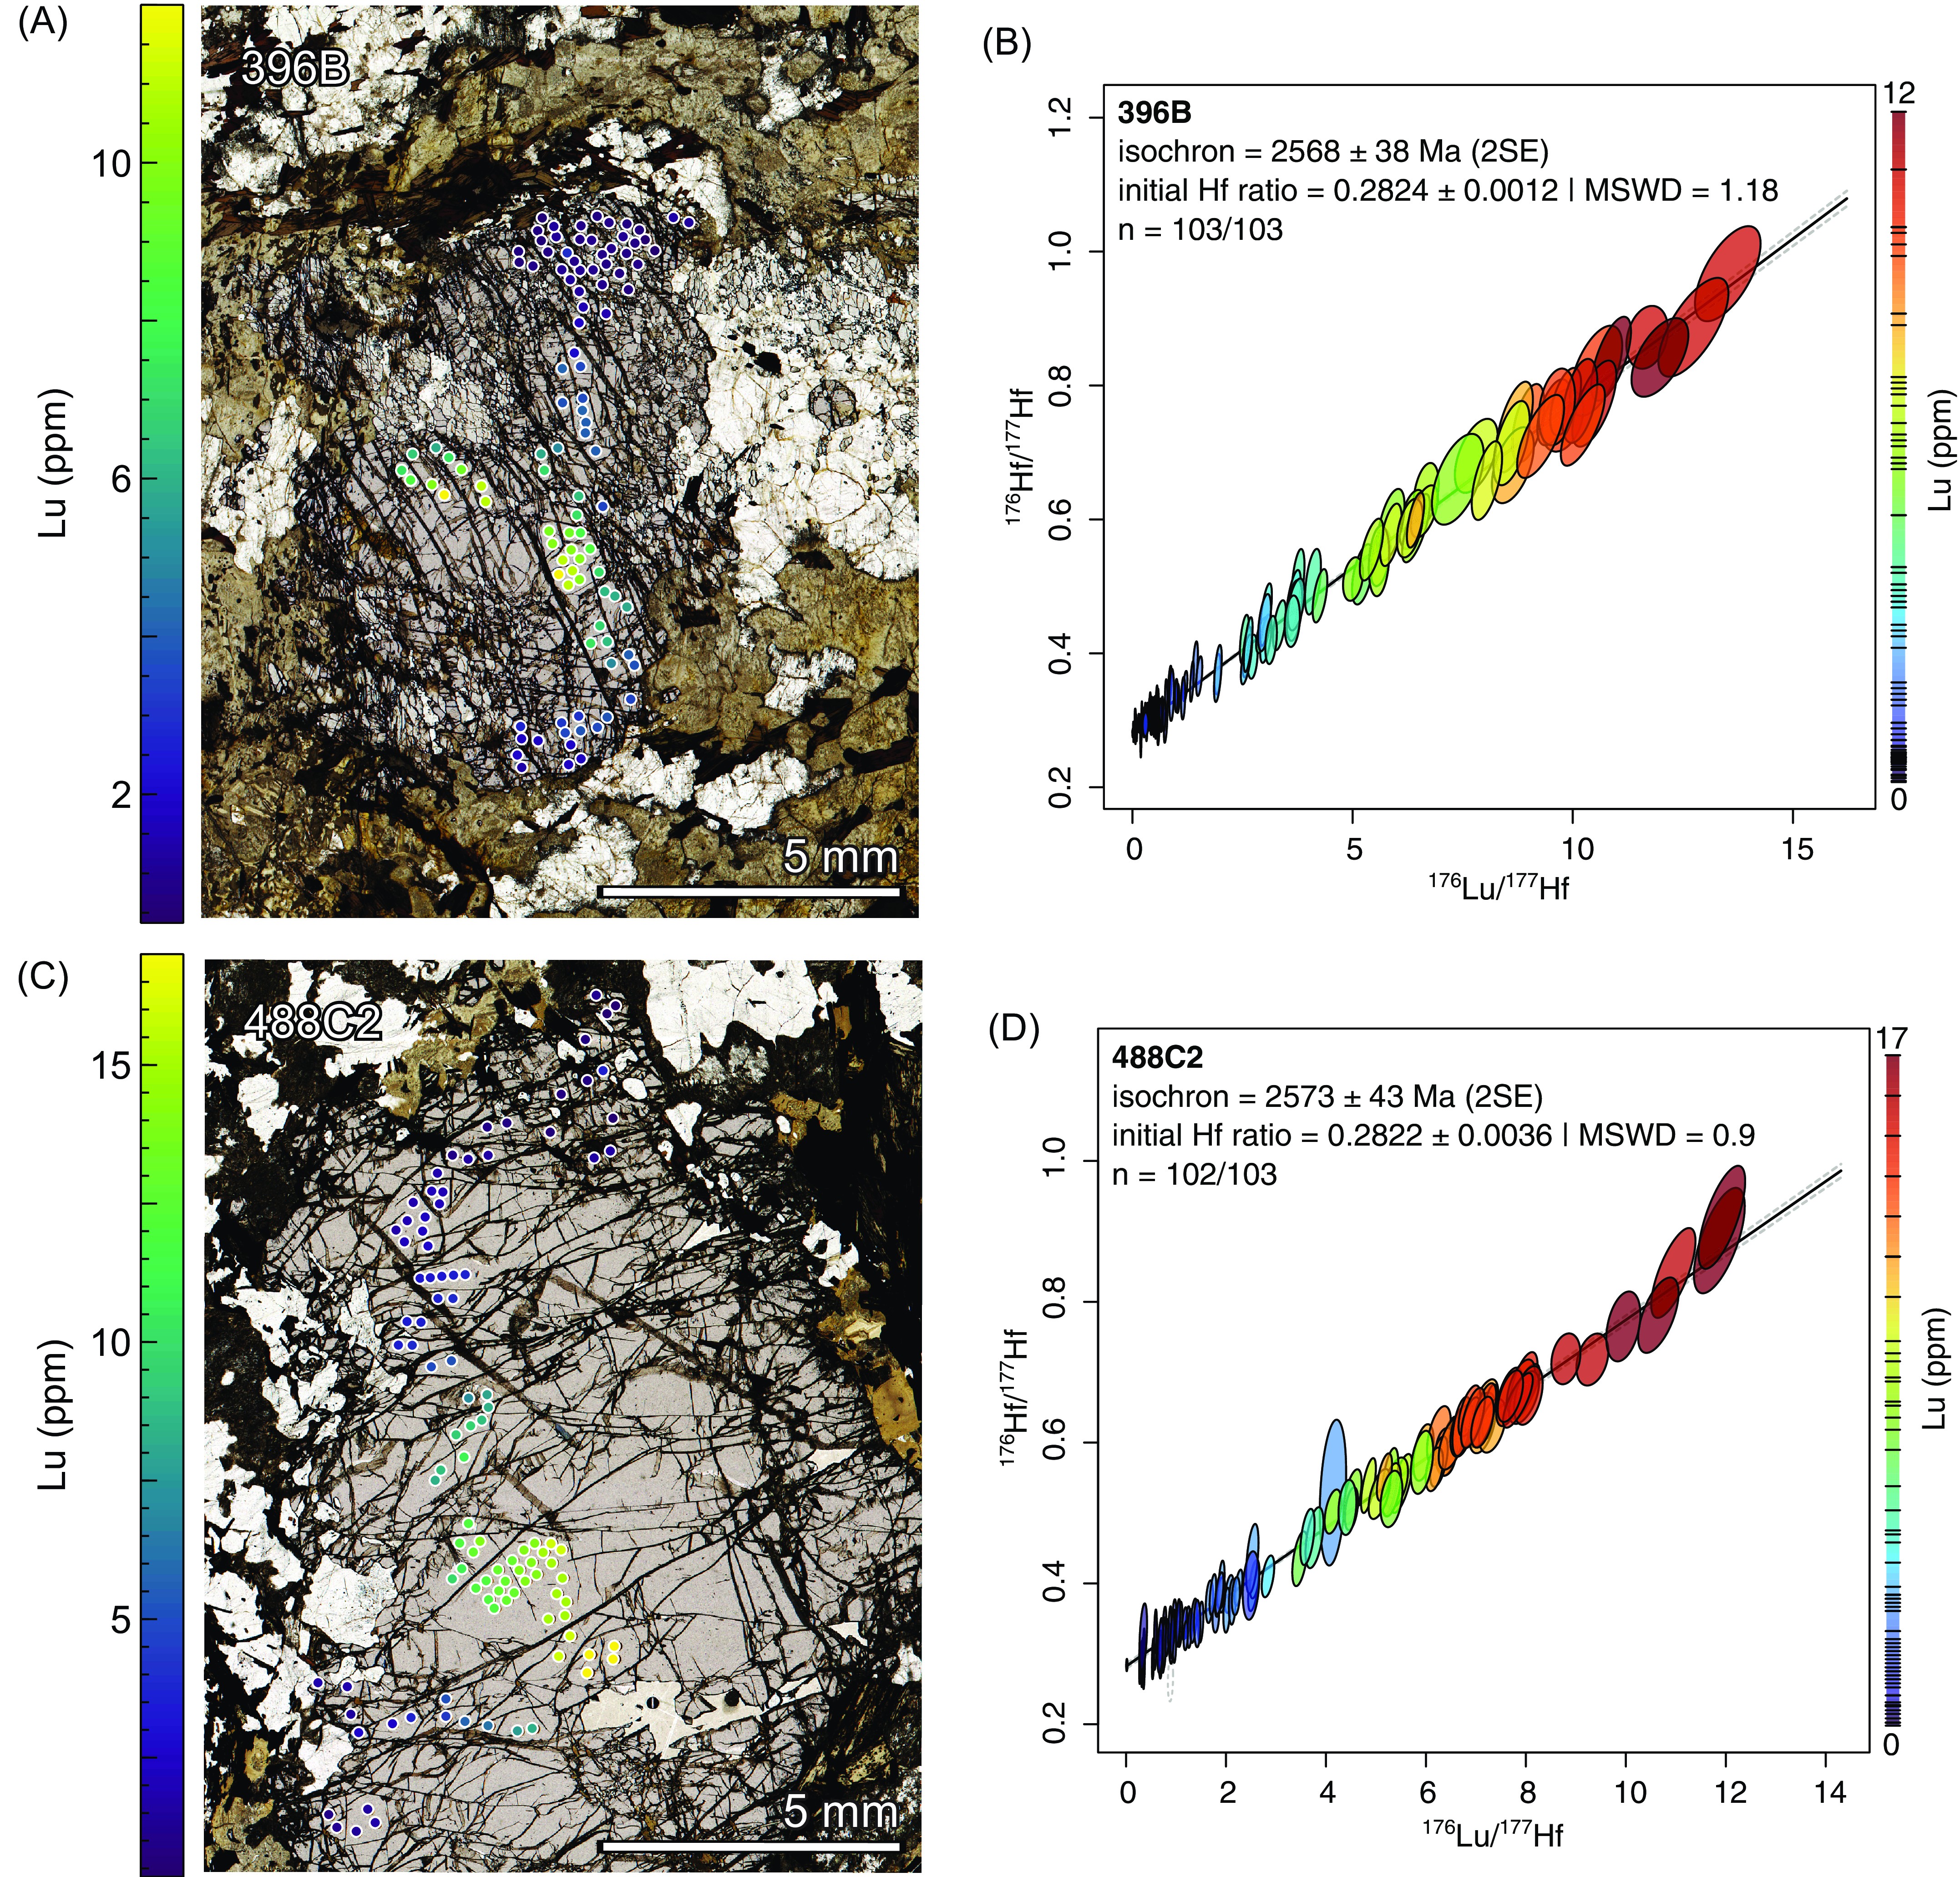
Figure 8. (A and C) Locations of laser spot analyses within garnet in specimens 396B and 488C2. Spot diameter is 150 microns. (B and D) 176Hf/177Hf versus 176Lu/177Hf isochron plots of in situ garnet Lu-Hf isotopic data. Dashed lines indicate 95% confidence interval on the regression. 2SE = two standard error of the mean; MSWD = mean square weighted deviates. Specimens as marked.
One hundred and two spot analyses (of 103 total) in a single large garnet grain in specimen 488C2 (Fig. 8C) define a single population 176Lu/177Hf versus 176Hf/177Hf isochron date of 2573 ± 43 Ma (Fig. 4D; MSWD = 0.9). Approximate Lu concentrations range from 0.4 to 17 ppm with greater concentrations in grain cores compared to rims (Fig. 8C). Isochrons defined by core- or rim-only analyses (Table S3) overlap within uncertainty.
4. Discussion
4.a. Integration of monazite and garnet geochronology results
The monazite analyses from specimens 396B and 488C2 spread along the x-axis of concordia towards reverse discordance in Tera-Wasserburg space (Fig. 7A, B). This spread may reflect minor unresolved U/Pb fractionation but does not affect the 207Pb/206Pb ratios. Specimens 396B and 488C2 were collected from the same general location only a few hundred metres apart with no recognized intervening structures (Fig. 1), and, as such, it is expected that they have experienced the same geological history. When combined, the 207Pb/206Pb dates and Y concentration data from the spot analyses from the two specimens define three general populations. Automated 2D Gaussian un-mixing of the data using the mclust package (Scrucca et al., Reference Scrucca, Fop, Murphy and Raftery2016) for the open R platform defines a broad population (2735 ± 105 Ma) with variable Y content (11800 ± 15100 ppm; 2SE), an intermediate age population (2559 ± 26 Ma) with relatively low Y concentrations (9200 ± 3900 ppm) and a young age population (2533 ± 22 Ma) with high Y concentrations (21700 ± 3200 ppm) (Fig. 2E). The 207Pb/206Pb dates and Y concentration data plotted on a radial plot (Galbraith, Reference Galbraith1990) and automatically un-mixed via IsoplotR (Vermeesch, Reference Vermeesch2018) results in 5 peaks, though the two main peaks comprise 96% of the data (Fig. 7F). The dominant peaks are at 2533 Ma and 2571 Ma, with the former being associated with higher Y concentrations. The main peaks from the radial plot overlap with those calculated via 2D Gaussian de-mixing.
In metapelitic rocks, general petrochronological interpretations tie Y concentrations in monazite to the rock reservoir, which is typically dominated by garnet (Pyle et al., Reference Pyle, Spear, Rudnick and Mcdonough2001b; Buick et al., Reference Buick, Hermann, Williams, Gibson and Rubatto2006; Hermann & Rubatto, Reference Hermann and Rubatto2003; Larson et al., Reference Larson, Shrestha, Cottle, Guilmette, Johnson, Gibson and Gervais2022; Foster et al., Reference Foster, Parrish, Horstwood, Chenery, Pyle and Gibson2004; Foster et al., Reference Foster, Kinny, Vance, Prince and Harris2000; Gibson et al., Reference Gibson, Carr, Brown and Hamilton2004; Shrestha et al., Reference Shrestha, Larson, Duesterhoeft, Soret and Cottle2019; Larson et al., Reference Larson, Ali, Shrestha, Soret, Cottle and Ahmad2019). In simple two-component systems (i.e. lacking xenotime or other phases that preferentially incorporate HREE), when garnet is growing or stable, the amount of Y available for monazite is restricted, leading to lower Y concentrations in the latter. When garnet is decomposing (i.e., decreasing modal abundance), perhaps along the decompression and/or retrograde portion of the path, any monazite (re)crystallizing at that time will take up Y released and will have higher Y concentrations (Shrestha et al., Reference Shrestha, Larson, Duesterhoeft, Soret and Cottle2019). Given the lack of xenotime identified in the two specimens analyzed, the lower Y concentrations of the ca. 2570 Ma population indicate that garnet was growing or stable at that time, likely associated with prograde metamorphism. In contrast, the high Y concentration of the younger ca. 2533 Ma population is consistent with growth coeval with garnet breakdown, perhaps during decompression and/or retrograde metamorphism.
The interpretation based on monazite dates and Y concentrations is consistent with the garnet Lu-Hf dates obtained. When combined, as with the monazite data, the Lu-Hf analyses for both specimens define a single population isochron at 2570 ± 25 Ma (MSWD = 1, n = 205/206), which coincides with the ca. 2570 Ma, lower Y monazite population. The internal consistency of the combined monazite and garnet geochronology dataset, and the lack of phases that may complicate HREE partitioning between monazite and garnet, are compatible with the simple interpretation that prograde metamorphism was ongoing ca. 2570 Ma followed by retrograde metamorphism ca. 2530 Ma.
4.b. Integration of monazite and garnet geochronology
Comparison of the monazite and garnet geochronological records presented herein outlines two potential limitations in the in situ garnet Lu-Hf data collected. First, the regressions (after York et al., Reference York, Evensen, Martinez and De Basabe Delgado2004) through the Lu-Hf data form single populations assuming normally distributed uncertainties (e.g. Wendt & Carl, Reference Wendt and Carl1991). As such, at the precision of the ratio data (∼1.5 %), it is difficult to resolve multiple populations of garnet growth at the same timescale as the monazite; for individual specimens, the uncertainty on the isochrons overlap both of the main monazite populations. In fact, the precision of the 176Hf/177Hf isotope ratios in both specimens would have to increase by at least 50% to allow differentiation between ca. 2570 and 2530 Ma (Fig. 9). This potential limitation can be ameliorated by increasing the number of analyses, assuming those analyses have similar or greater spread in Lu/Hf. For example, combining the Lu-Hf data from the two specimens (n = 205) defines a higher-precision regression (2570 ± 25 Ma) centred on the older monazite population peak. Similarly, a weighted mean date calculated from two-point garnet isochrons regressed through the initial 176Hf/177Hf defined by the entire dataset (and input as the initial ratio in IsoplotR to avoid losing a degree of freedom in the calculation; Vermeesch, Reference Vermeesch2018) is consistent with a single population at 2572 ± 25 (MSWD = 0.95). Caution should be exercised, however, in relying on the precision of the weighted mean, as precision scales with the number of analyses. As noted by Condon et al. (Reference Condon, Schoene, Schmitz, Schaltegger, Ickert, Amelin, Augland, Chamberlain, Coleman, Connelly, Corfu, Crowley, Davies, Denyszyn, Eddy, Gaynor, Heaman, Huyskens, Kamo, Kasbohm, Keller, Maclennan, Mclean, Noble, Ovtcharova, Paul, Ramezani, Rioux, Sahy, Scoates, Szymanowski, Tapster, Tichomirowa, Wall, Wotzlaw, Yang and Yin2024), weighted mean dates or isochrons implicitly assume instantaneous crystallization and, as such, uncertainties much less than the single point uncertainties from which they are derived may not be geologically meaningful. In the case of the garnet Lu-Hf data presented herein, the isotopic ratios have median uncertainties of 3–4% and 6–7% for 176Lu/177Hf and 176Hf/177Hf, respectively. Taking the lowest value of 3% would equate to approximately 77 Myrs based on a derived date of 2570 Ma. Similarly, the median uncertainty on the two-point isochron dates used for input into the weighted mean noted above is 521 Myrs, well in excess of the calculated uncertainty.
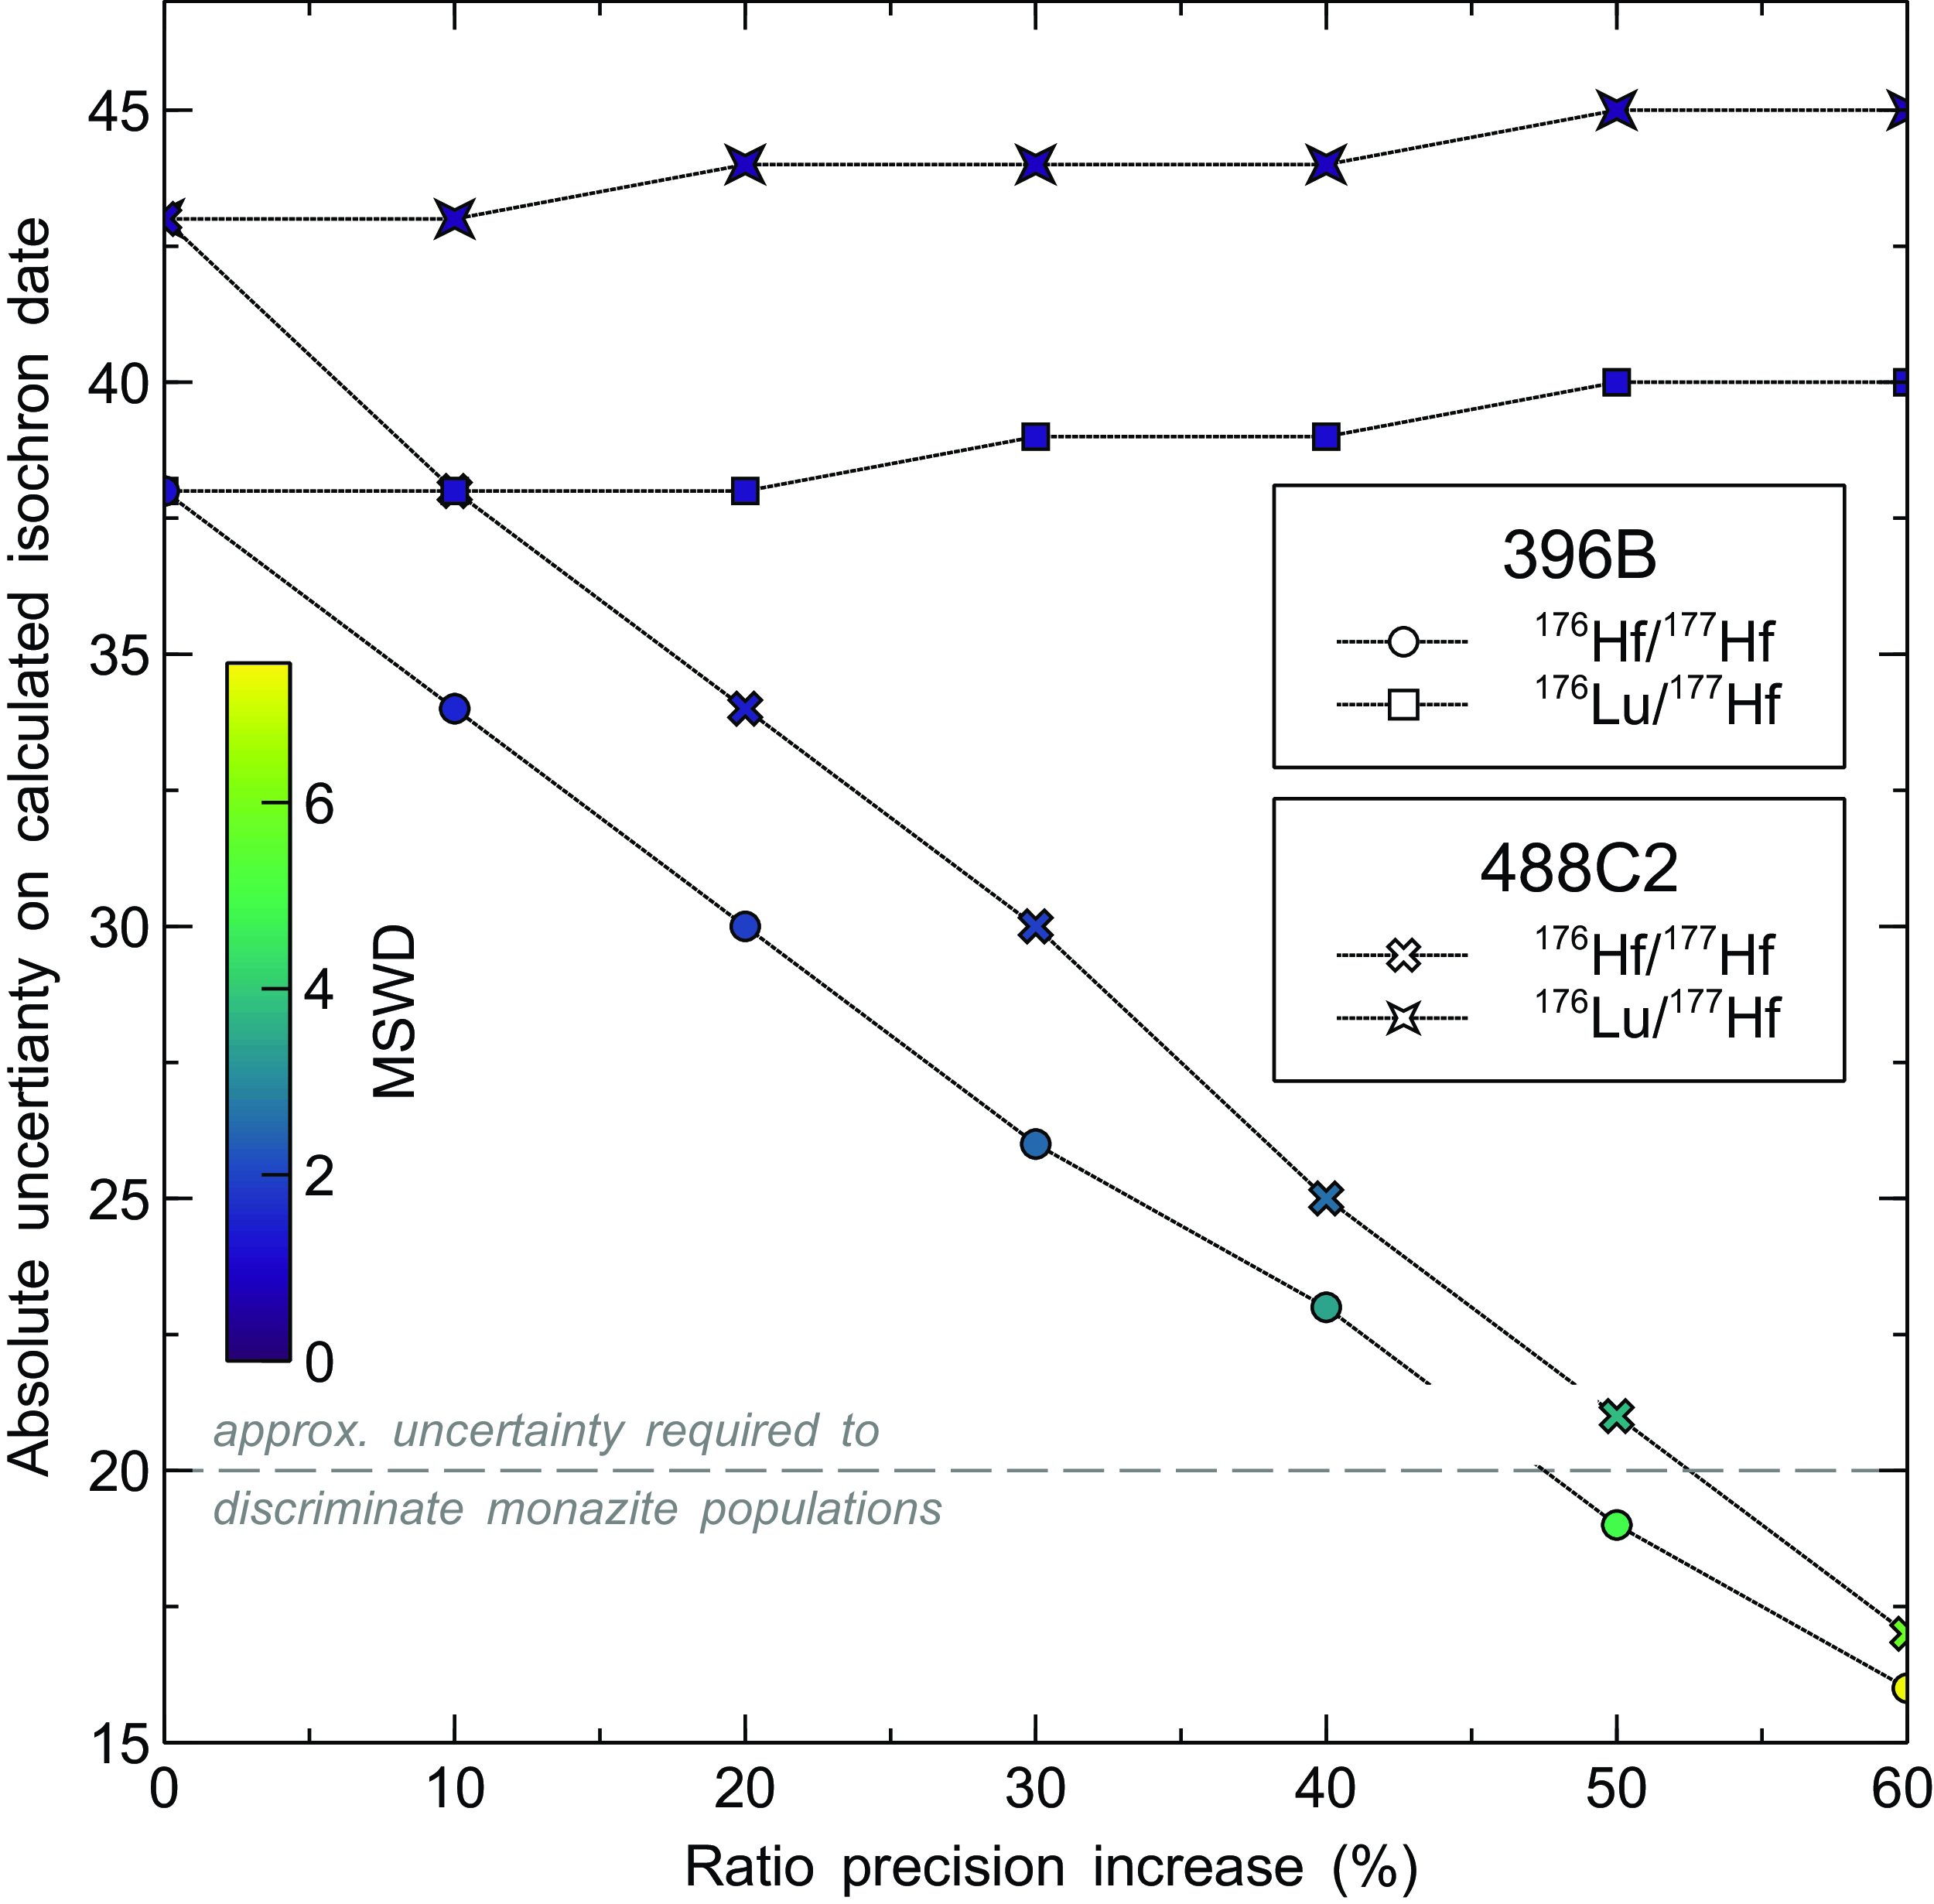
Figure 9. Plot demonstrating the increased precision on the 176Hf/177Hf and/or 176Lu/177Hf ratios required to increase the precision on the Lu-Hf isochron dates required to discriminate between the two monazite populations. Plot created using the free scientific plotting software Veusz (Sanders, Reference Sanders2023).
Second, while extracting geochronological information from garnet as a primary phase commonly targeted for P-T information can tie P-T conditions to date, that record is necessarily limited to times at which garnet (re)crystallized. While it is possible for Lu and Hf in garnet to be modified post-crystallization via thermally driven volume diffusion (TDVD), the high temperatures required (possibly > 900˚C; Smit, Scherer & Mezger, Reference Smit, Scherer and Mezger2013) and the difference in diffusivity between Lu and Hf (see Bloch et al., Reference Bloch, Jollands, Devoir, Bouvier, Ibañez-Mejia and Baumgartner2020) make it unlikely that TDVD would result in a date that corresponds to a specific event. The practical limitation of applying Lu-Hf geochronology to times of garnet growth, therefore, can restrict the potential portion of the overall geochronological history of the specimen that can be investigated. In situations when garnet is not growing, or has not been allowed to fully re-equilibrate, accessory phases, which can be significantly more reactive (e.g., Shrestha et al., Reference Shrestha, Larson, Duesterhoeft, Soret and Cottle2019; Yakymchuk & Brown, Reference Yakymchuk and Brown2014), may offer a more complete record of the metamorphic history. The monazite in the specimens examined exemplify that with a low Y ca. 2570 Ma population, coeval with the garnet Lu-Hf dates and sequestration of HREE in garnet at the time, and a higher Y ca. 2530 Ma population consistent with growth during garnet decomposition. As demonstrated, dating only the garnet in these specimens yields information only about the timing of garnet growth, i.e., prograde metamorphism. Combining the garnet with monazite geochronology data, however, provides more detailed information about a longer portion of the P-T-t path.
Finally, it is relevant to note the difference in spatial resolution that currently exists between in situ Lu-Hf and monazite U(-Th)-Pb geochronologic methods. Whereas in situ Lu-Hf typically requires laser spots with diameters in excess of 100 microns, monazite U(-Th)-Pb dating, using a multi-collector ICP-MS instrument, routinely utilizes spot diameters of 7–8 microns (e.g. Cottle, Larson & Yakymchuk, Reference Cottle, Larson and Yakymchuk2018; Cottle, Lederer & Larson, Reference Cottle, Lederer and Larson2019; Larson et al., Reference Larson, Shrestha, Cottle, Guilmette, Johnson, Gibson and Gervais2022; Lihter et al., Reference Lihter, Larson, Shrestha and Cottle2023) and even as small as 5 microns (Mottram & Cottle, Reference Mottram and Cottle2024). These spot-size differences correlate directly to the total volume of material analyzed and, critically, the ability to avoid or minimize inclusions and/or imperfections (i.e. cracks). Such complications can affect the measured ratios or, at a minimum, decrease precision. This same issue remains when dating monazite using the Lu-Hf decay system. While the capability of the method has been demonstrated (Wu et al., Reference Wu, Niu, Yang, Wang, Yang and Wu2024), the spot sizes used are an order of magnitude larger (i.e. 50–80 microns) than those required for MC-ICP-MS based U(-Th)-Pb monazite geochronology.
5. Conclusions
While geochronology of single phases undoubtedly has utility in answering specific geological questions, investigation of the metamorphic history of meta-pelitic rocks, as evidenced by this case study, is best assessed using a combined approach. The reactive nature of monazite across a range of P-T-X conditions, its compositional sensitivity to the growth and breakdown of rock-forming phases, and the precision and spatial resolution at which it can be dated all combine to make it a critically useful target for quantifying the absolute timing and duration of P-T paths in metamorphic rocks. When combined with garnet Lu-Hf geochronology, which can eliminate assumptions required to interpret monazite HREE chemistry, more complete petrochronologic histories of metamorphic rocks can be derived.
Supplementary material
The supplementary material for this article can be found at https://doi.org/10.1017/S001675682500007X
Acknowledgements
M. Button and S. Shrestha are thanked for their work facilitating analyses in the Fipke Laboratory for Trace Element Research. Insightful comments from J. Garber and J. Kaempf helped improve this work. This study was supported by NSERC Discovery grants to K. Larson and B. V. Dyck. Supplementary data are available in an Open Science Foundation repository: https://osf.io/k6qtu/?view_only=006b1c4104934f39a4297848a7e8bdd7


 Open access