


1. Introduction
Constraining the timing of ductile deformation is crucial for understanding the tectono-metamorphic evolution of intermediate-lower crustal domains in both continental and oceanic crust (e.g. Xypolias, Reference Xypolias2010; Oriolo et al. Reference Oriolo, Wemmer, Oyhantçabal, Fossen, Schulz and Siegesmund2018). Mylonites reflect zones of high strain where dominantly ductile deformation has been localized. Mylonitic shear zones occur at all scales in the lithosphere and may provide pathways that localize fluids and secondary alteration (e.g. Beach, Reference Beach1976; Austrheim, Reference Austrheim2013; Kirkland et al. Reference Kirkland, Olierook, Danišík, Liebmann, Hollis, Ribeiro and Rankenburg2023). These rocks may thus preserve key evidence for the kinematics and structure of an orogen as well as of rift-related systems. Dating the evolution of the shear zones has been described as one of the most difficult problems in geochronology (e.g. Oriolo et al. Reference Oriolo, Wemmer, Oyhantçabal, Fossen, Schulz and Siegesmund2018; Kirkland et al. Reference Kirkland, Olierook, Danišík, Liebmann, Hollis, Ribeiro and Rankenburg2023). In addition to the dating of major fabric-forming minerals, in situ geochronology or petrochronology on minor and accessory minerals may provide direct constraints on the timing of deformation (e.g. Piazolo et al. Reference Piazolo, Austrheim and Whitehouse2012) as it allows linking isotopic dating, microstructures, geochemistry and thermobarometry. In recent years, the combination, simultaneously or not, of isotopic ratios and trace element for accessory and minor minerals with in situ techniques, opens the possibility to date the small syn-kinematic domains developed on pre-existing grains (e.g. Simonetti et al. Reference Simonetti, Carosi, Montomoli, Cottle and Law2020, Reference Simonetti, Carosi, Montomoli, Law and Cottle2021b; Carosi et al. Reference Carosi, Montomoli, Iaccarino, Benetti, Petroccia and Simonetti2022; Moser et al. Reference Moser, Hacker, Gehrels, Seward, Kylander-Clark and Garber2022; Walters et al. Reference Walters, Cruz-Uribe, Song, Gerbi and Biela2022; Kirkland et al. Reference Kirkland, Olierook, Danišík, Liebmann, Hollis, Ribeiro and Rankenburg2023; Kavanagh-Lepage et al. Reference Kavanagh-Lepage, Gervais, Larson, Graziani and Moukhsil2023; Corvò et al. Reference Corvò, Maino, Piazolo, Kylander-Clark, Seno and Langone2023). Among the accessory minerals, monazite and titanite are the most promising being present in different rock types and, most important being more reactive with respect to other accessory minerals, i.e. zircon. Both chronometers have been shown to develop chemical zoning as function of metamorphic reactions with and without deformation allowing to link the ages to specific geologic events (Engi, Reference Engi2017; Hetherington et al. Reference Hetherington, Backus, Mcfarlane, Fisher, Pearson, Moser, Corfu, Darling, Reddy and Tait2017; Kohn, Reference Kohn2017; Kohn et al. Reference Kohn, Engi, Lanari and Swainson2017).
The usefulness of monazite as a geochronometer is due to its lattice properties allowing it to contain high concentration of Th and U and low amounts of common-Pb (Parrish, Reference Parrish1990). Monazite is common in metapelitic/metapsammitic rocks with Ca-poor and Al-rich bulk compositions at metamorphic conditions above upper greenschist facies (e.g. Spear & Pyle, Reference Spear and Pyle2010). Unlike zircon, monazite has a higher reactivity, it is able to preserve isotopic inheritance and to record P-T conditions from prograde to retrograde (e.g. Langone et al. Reference Langone, Braga, Massonne and Tiepolo2011). Monazite may develop chemical zoning that can be linked to a specific metamorphic reaction related to static or dynamic (re)crystallization of both major and accessory rock-forming minerals (e.g. Wawrzenitz et al. Reference Wawrzenitz, Krohe, Rhede and Romer2012; Hetherington et al. Reference Hetherington, Backus, Mcfarlane, Fisher, Pearson, Moser, Corfu, Darling, Reddy and Tait2017). In the last years, the combination of in situ U–Th–Pb data with the geochemical composition of the dated monazites allowed to establish the timing of complex geologic events (e.g. Shaw et al. Reference Shaw, Karlstrom, Williams, Jercinovic and Mccoy2001; Williams & Jercinovic, Reference Williams and Jercinovic2002; Rasmussen & Muhling, Reference Rasmussen and Muhling2007; Di Vincenzo et al. Reference Di Vincenzo, Carosi, Palmeri and Tiepolo2007; Janots et al. Reference Janots, Berger, Gnos, Whitehouse, Lewin and Peqke2012; Wawrzenitz et al. Reference Wawrzenitz, Krohe, Rhede and Romer2012; Williams & Jercinovic, Reference Williams and Jercinovic2012; Didier et al. Reference Didier, Bosse, Cherneva, Gautier, Georgieva, Paquette and Gerdjikov2014; Grand’Homme et al. Reference Grand’homme, Janots, Seydoux-Guillaume, Guillaume, Bosse and Magnin2016; Kohn, Reference Kohn2016; Regis et al. Reference Regis, Warren, Mottram and Roberts2016; Bosse & Villa, Reference Bosse and Villa2019; Bergemann et al. Reference Bergemann, Gnos, Berger, Janots and Whitehouse2020; Simonetti et al. Reference Simonetti, Carosi, Montomoli, Cottle and Law2020, Reference Simonetti, Carosi, Montomoli, Law and Cottle2021b; Schulz, Reference Schulz2021; Carosi et al. Reference Carosi, Montomoli, Iaccarino, Benetti, Petroccia and Simonetti2022). Although monazite can be useful to date tectonic events in rocks from the middle and lower crust (Erickson et al. Reference Erickson, Pearce, Taylor, Timms, Clark, Reddy and Buick2015; Williams & Jercinovic, Reference Williams and Jercinovic2012, Mottram & Cottle, Reference Mottram and Cottle2024), it has been documented that monazite is able to record shearing by fluid-assisted dissolution and growth on rims at low amphibolite-facies metamorphic condition (e.g. Terry et al. Reference Terry, Robinson, Hamilton and Jercinovic2000) or even lower metamorphic conditions (e.g. Shaw et al. Reference Shaw, Karlstrom, Williams, Jercinovic and Mccoy2001).
Recently, it has been demonstrated that titanite microstructures can be used to date hypervelocity meteorite impacts (e.g. Papapavlou et al. Reference Papapavlou, Darling, Storey, Lightfoot, Moser and Lasalle2017; McGregor et al. Reference Mcgregor, Erickson, Spray and Whitehouse2021) as well as the activity of ductile shear zones developed within continental crustal rocks (e.g. Gordon et al. Reference Gordon, Kirkland, Reddy, Blatchford, Whitney, Teyssier, Evans and Mcdonald2021; Moser et al. Reference Moser, Hacker, Gehrels, Seward, Kylander-Clark and Garber2022; Kavanagh-Lepage et al. Reference Kavanagh-Lepage, Gervais, Larson, Graziani and Moukhsil2023; Corvò et al. Reference Corvò, Maino, Piazolo, Kylander-Clark, Seno and Langone2023). Conversely to monazite, the adoption of titanite as a geochronometer is complicated by two main issues. Firstly, it has a strong affinity for Pb and thus it may incorporate common lead during crystallization (e.g. Kohn, Reference Kohn2017). Consequently, most titanite U–Pb measurements require correction for substantial common Pb before age interpretations, e.g. by regressing less radiogenic and more radiogenic measurements on inverse isochrons (Tera-Wasserburg diagrams) to derive an age. Secondly, the temperature range for diffusive Pb-loss within the grains is somewhat disputed. Titanite has been traditionally considered as a thermochronometer with closure temperatures of 650°C and 750°C determined experimentally for titanite crystals with 0.5 and 5mm radii, respectively, and considering a cooling of about 5°C/Myr (Cherniak, Reference Cherniak1993). In contrast with the experimental works, several studies on natural titanite grains suggest that the U–Pb isotope system may be resistant to volume diffusion at temperature of up to 800°C (Kohn, Reference Kohn2017; Hartnady et al. Reference Hartnady, Kirkland, Clark, Spaggiari, Smithies, Evans and Mcdonald2019) providing crystallization ages (and not cooling ages) and referring to titanite as a petrochronometer (e.g. Hartnady et al. Reference Hartnady, Kirkland, Clark, Spaggiari, Smithies, Evans and Mcdonald2019; Holder et al. Reference Holder, Hacker, Seward and Kylander-Clark2019; Olierook et al. Reference Olierook, Taylor, Erickson, Clark, Reddy, Kirkland, Jahn and Barham2019; Scibiorski et al. Reference Scibiorski, Kirkland, Kemp, Tohver and Evans2019; Kirkland et al. Reference Kirkland, Yakymchuk, Gardiner, Szilas, Hollis, Olierook and Steenfelt2020; Gordon et al. Reference Gordon, Kirkland, Reddy, Blatchford, Whitney, Teyssier, Evans and Mcdonald2021; Moser et al. Reference Moser, Hacker, Gehrels, Seward, Kylander-Clark and Garber2022; Walters et al. Reference Walters, Cruz-Uribe, Song, Gerbi and Biela2022). Besides these two main issues, several authors (e.g. Gordon et al. Reference Gordon, Kirkland, Reddy, Blatchford, Whitney, Teyssier, Evans and Mcdonald2021; Moser et al. Reference Moser, Hacker, Gehrels, Seward, Kylander-Clark and Garber2022; Kavanagh-Lepage et al. Reference Kavanagh-Lepage, Gervais, Larson, Graziani and Moukhsil2023; Corvò et al. Reference Corvò, Maino, Piazolo, Kylander-Clark, Seno and Langone2023) highlighted a decoupling between the U–Pb isotopic system and some trace elements and a strong dependence on the mineral assemblage of the hosting microdomain for titanite during deformation (e.g. Corvò et al. Reference Corvò, Maino, Piazolo, Kylander-Clark, Seno and Langone2023).
In this contribution, we aim to assess the robustness and utility of the two geochronometers in deciphering the tectono-metamorphic history of high-strain rocks. We present monazite and titanite microstructural, chemical and isotopic data from mylonitic paragneisses and calc-silicates from an extensional shear zone affecting the continental crustal section of the Ivrea-Verbano Zone. This zone is ideally suited for our study since it has been the object of detail reconstructions of strain distribution and lithological make-up. It has been shown that both monazite and titanite are present in the main lithologies. Importantly, the zone records different tectono-metamorphic events, the timing of which remains disputed (e.g. Siegesmund et al. Reference Siegesmund, Layer, Dunkl, Vollbrecht, Steenken, Wemmer and Ahrendt2008; Garde et al. Reference Garde, Boriani and Sørensen2015; Simonetti et al. Reference Simonetti, Langone, Bonazzi, Corvò and Maino2023). Here, we (i) describe the behaviour of monazite and titanite under the same shearing conditions, (ii) shed light on the timing of deformation by U–Th–Pb dating of monazite and titanite and on the petrologic evolution of mylonites during deformation and (iii) discuss the complementary and contrasting utility of these two geochronometers in dating deformation in mid- to lower-crustal rocks.
2. Geological setting
The Ivrea-Verbano Zone (IVZ) in north-western Italy represents a cross-section through the middle to lower continental crust of the Southern Alpine basement (Figure 1a). During the Alpine collision, the IVZ underwent vertical exhumation and open folding, but it escaped the metamorphic overprint (Henk et al. Reference Henk, Franz, Teufel and Oncken1997; Rutter et al. Reference Rutter, Brodie, James and Burlini2007; Wolff et al. Reference Wolff, Dunkl, Kiesselbach, Wemmer and Siegesmund2012). The IVZ is delimited by the Insubric Line northward, while south-eastward, it is juxtaposed to the Serie dei Laghi Unit by the Late-Variscan Cossato–Mergozzo–Brissago Line, which is in turn crosscut by the Pogallo Line (Figure 1a; Boriani et al. Reference Boriani, Burlini and Sacchi1990).
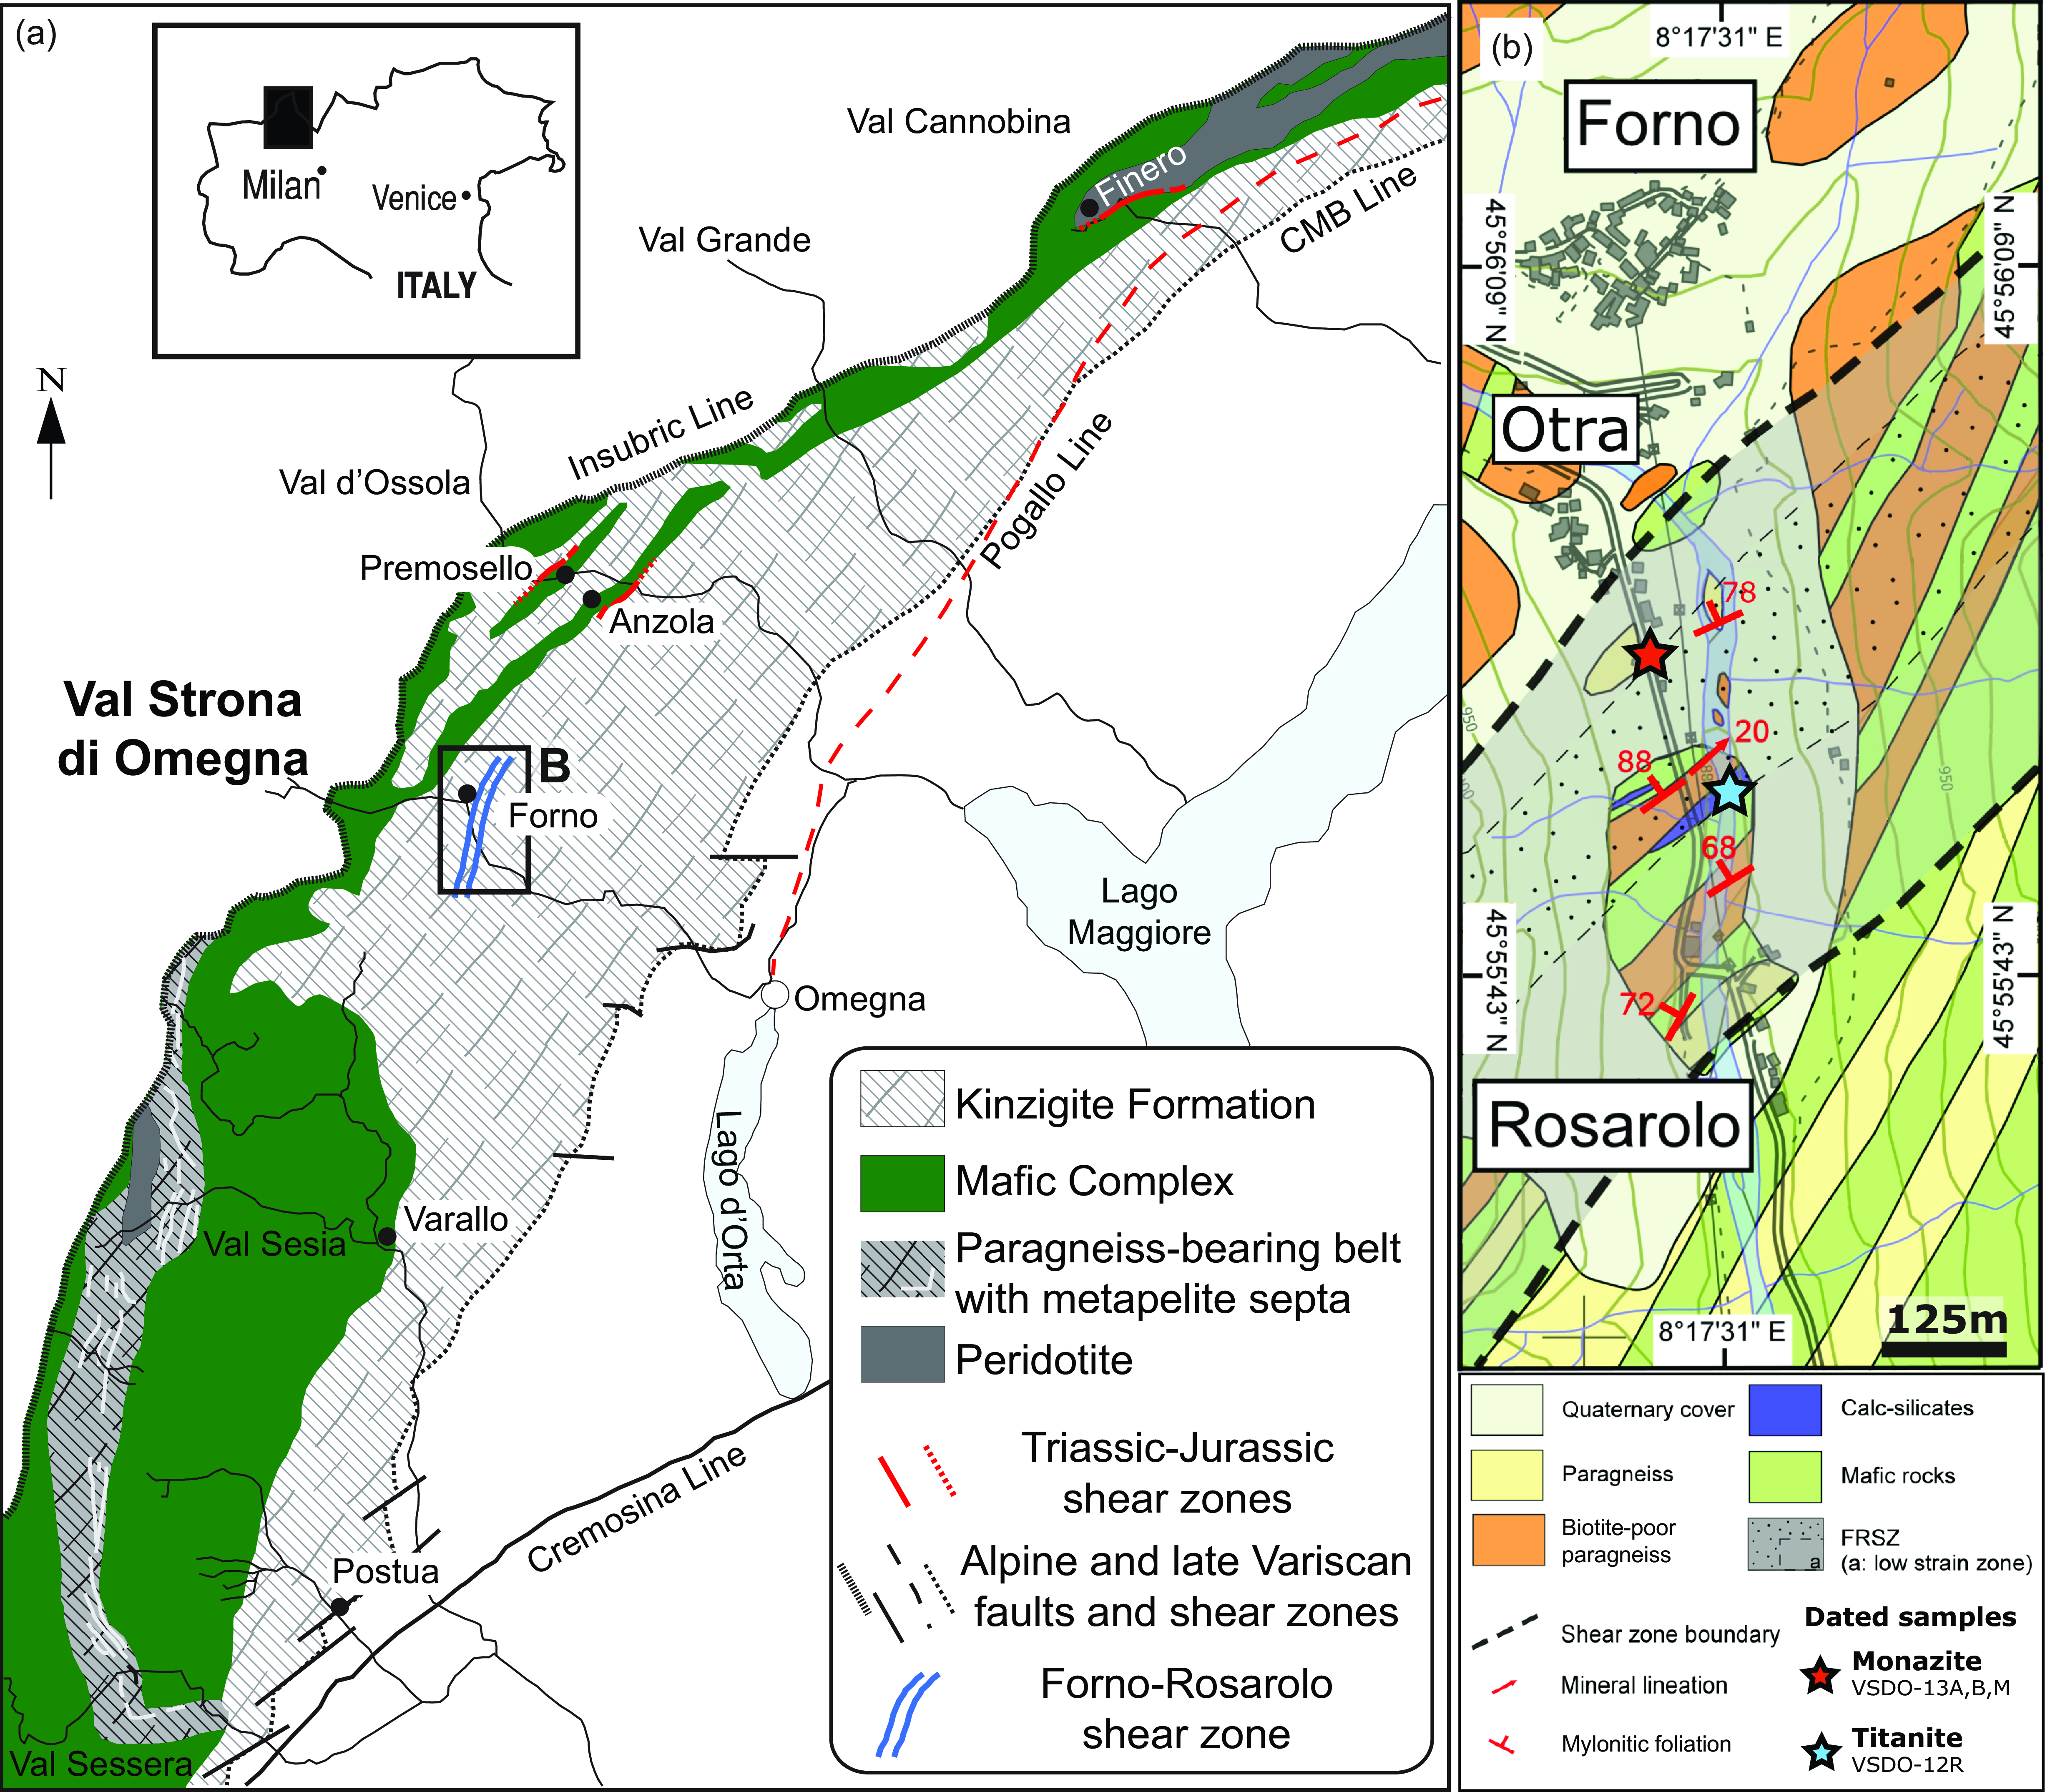
Figure 1. Geological sketch map of the Ivrea-Verbano Zone, modified after Ewing et al. (Reference Ewing, Rubatto, Beltrando and Hermann2015), Simonetti et al. (2021a, Reference Simonetti, Langone, Corvò and Bonazzi2023) and Corvò et al. (Reference Corvò, Maino, Piazolo, Seno and Langone2022). In (a) the locations of Triassic-Jurassic shear zones (in red) dated by the U–Pb method are after Langone et al. Reference Langone, Zanetti, Daczko, Piazolo, Tiepolo and Mazzucchelli2018 (Finero area), Corvò et al. Reference Corvò, Maino, Piazolo, Kylander-Clark, Seno and Langone2023 (Anzola area) and Corvò et al., Reference Corvò, Montemagni, Zanchetta and Langone2025 (Premosello area) . The studied area is delimited by the black box. (b) Schematic structural and geological map of the Forno-Rosarolo shear zone (modified after Bertolani, Reference Bertolani1968 and Simonetti et al. Reference Simonetti, Langone, Bonazzi, Corvò and Maino2023) with the location of samples analysed for the geochronology.
The IVZ is traditionally subdivided into three main units (Figure 1a), from NW-SE: (i) the mantle peridotites; (ii) the Mafic Complex and (iii) a volcano-sedimentary metamorphic sequence, namely the Kinzigite Formation. The latter is considered as the original upper part of the tilted crustal section made up of a heterogeneous group of metasediments, comprising mainly metapelites with intercalated metabasic rocks (i.e. volcanic sediments and MORB-like lavas) and minor marbles/calc-silicates and quartzites (Zingg, Reference Zingg, Salisbury and Fountain1990; Schmid, Reference Schmid, von Raumer and Neubauer1993; Quick et al. Reference Quick, Sinigoi, Snoke, Kalakay, Mayer and Peressini2002; Kunz et al. Reference Kunz, Johnson, White and Redler2014). At a regional scale, peak metamorphic grade decreases from granulite (∼900°C and 900 MPa) to amphibolite facies (∼600°C and ∼400 MPa) from NW to SE (Schmid & Wood, Reference Schmid and Wood1976; Brodie & Rutter, Reference Brodie and Rutter1987; Zingg, Reference Zingg, Salisbury and Fountain1990; Schmid, Reference Schmid, von Raumer and Neubauer1993; Redler et al. Reference Redler, Johnson, White and Kunz2012; Kunz et al. Reference Kunz, Johnson, White and Redler2014; Kunz & White, Reference Kunz and White2019). The highest degree of metamorphic conditions has been recorded by paragneiss septa (i.e. depleted granulite) forming layers within the Mafic Complex (Figure 1a; Sinigoi et al. Reference Sinigoi, Quick, Mayer and Budahn1996; Ewing et al. Reference Ewing, Hermann and Rubatto2013). The progressive switch at the mid- to lower crustal levels from granulite to amphibolite facies is marked by a transition zone of ∼1–5 kilometres (Figure 1b) that experienced extensive migmatization processes (e.g. Redler et al. Reference Redler, Johnson, White and Kunz2012; Kunz et al. Reference Kunz, Johnson, White and Redler2014; Carvalho et al. Reference Carvalho, Bartoli, Ferri, Cesare, Ferrero, Remusat, Capizzi and Poli2019). In the north-eastern part of the IVZ, this transition zone hosts two mylonitic shear zones, namely the Anzola (Brodie & Rutter, Reference Brodie and Rutter1987; Corvò et al. Reference Corvò, Maino, Piazolo, Seno and Langone2022, Reference Corvò, Maino, Piazolo, Kylander-Clark, Seno and Langone2023) and the Forno-Rosarolo shear zones (Siegesmund et al. Reference Siegesmund, Layer, Dunkl, Vollbrecht, Steenken, Wemmer and Ahrendt2008; Simonetti et al. Reference Simonetti, Langone, Bonazzi, Corvò and Maino2023). Although described as separate shear zones and often named in different ways (see Simonetti et al. Reference Simonetti, Langone, Corvò and Bonazzi2021a), these structures have been interpreted as a single fault system, with NNE-SSW strike (e.g. Rutter et al. Reference Rutter, Brodie, James and Burlini2007), associated to the Triassic-Jurassic (180–230 Ma) rift-related tectonic (Beltrando et al. Reference Beltrando, Stockli, Decarlis and Manatschal2015; Petri et al. Reference Petri, Duretz, Mohn, Schmalholz, Karner and Müntener2019; Simonetti et al. Reference Simonetti, Langone, Bonazzi, Corvò and Maino2023; Corvò et al. Reference Corvò, Maino, Piazolo, Kylander-Clark, Seno and Langone2023). In this time interval, crustal thinning (<10 km thick) was accommodated by several shear zones active during different phases of rifting (Manatschal et al. Reference Manatschal, Müntener, Lavier, Minshull and Péron-Pinvidic2007; Mohn et al. Reference Mohn, Manatschal, Beltrando, Masini and Kusznir2012) at different crustal levels (e.g. Beltrando et al. Reference Beltrando, Stockli, Decarlis and Manatschal2015).
2.a. Geochronological background
Several authors, by using geochronological and/or thermochronological techniques, aimed to constrain the timing of the main geodynamic episodes that characterized the evolution of the crustal section of the IVZ. Here, we report a summary of the main tectono-metamorphic event well recorded by both geo- and thermochronometers.
The rare occurrence of Carboniferous (Pennsylvanian) metamorphic (i.e. 316±3 Ma U–Pb on zircon, Ewing et al. Reference Ewing, Hermann and Rubatto2013, Reference Ewing, Rubatto, Beltrando and Hermann2015; 311±2 Ma garnet–whole rock Lu–Hf isochrons, Connop et al. Reference Connop, Smye, Garber, Moser, Caddick and Vervoort2024) and magmatic ages (i.e. 314 ±5 Ma U–Pb on zircon Klötzli et al. Reference Klötzli, Sinigoi, Quick, Demarchi, Tassinari, Sato and Günes2014) indicates that the pervasive amphibolite- and granulite-facies mineral parageneses of the IVZ formed after the peak of Variscan compressional deformation and plutonism.
The IVZ recorded mostly tectono-metamorphic and magmatic events during the Permian as documented by dating of different accessory minerals from metamorphic (e.g. Henk et al. Reference Henk, Franz, Teufel and Oncken1997; Vavra et al. Reference Vavra, Schmid and Gebauer1999; Guergouz et al. Reference Guergouz, Martin, Vanderhaeghe, Thébaud and Fiorentini2018; Kunz et al. Reference Kunz, Regis and Engi2018; Williams et al. Reference Williams, Kelsey and Rubatto2022; Wyatt et al. Reference Wyatt, Smye, Garber and Hacker2022; Corvò et al. Reference Corvò, Kylander-Clark and Langone2024) and magmatic rocks (e.g. Peressini et al. Reference Peressini, Quick, Sinigoi, Hofmann and Fanning2007; Karakas et al. Reference Karakas, Wotzlaw, Guillong, Ulmer, Brack, Economos, Bergantz, Sinigoi and Bachmann2019). This High-Temperature (HT) event has been confirmed also recently by both in situ garnet U–Pb dating (Bartoli et al. Reference Bartoli, Millonig, Carvalho, Marschall and Gerdes2024) and garnet–whole rock Lu–Hf isochrons (Connop et al. Reference Connop, Smye, Garber, Moser, Caddick and Vervoort2024) of metamorphic samples across the crustal section. The pervasive amphibolite- and granulite-facies mineral parageneses formed during the Permian lithospheric thinning, well documented across the Alps (e.g. Schuster & Stüwe, Reference Schuster and Stüwe2008).
The geochronological studies performed on metamorphic rocks across the IVZ crustal section revealed also that the HT conditions persisted for several Myr. Thanks to a systematic study of textures, REE content and U–Pb ages of zircon and monazite grains, Guergouz et al. (Reference Guergouz, Martin, Vanderhaeghe, Thébaud and Fiorentini2018) inferred that the minimum duration for high-temperature metamorphism should be between 20 and 30 Myr. Kunz et al. (Reference Kunz, Regis and Engi2018) dated granulitic rocks by zircon U–Pb and suggested that the HT metamorphic conditions lasted for a longer time interval, up to 60 Myr. A recent study of monazite across the crustal section exposed in the Valle Strona di Omegna reported dates mostly in the range 240–320 Ma with two main peaks at circa 290 and 270 Ma (Williams et al. Reference Williams, Kelsey and Rubatto2022). According to these authors, the monazite textural and chemical features indicate that these dates record the timing of pre-peak to peak metamorphic conditions. The long-lasting persistency of HT conditions agrees with the model proposed by Schuster & Stüwe (Reference Schuster and Stüwe2021) suggesting lithospheric thinning with negligible surface subsidence between 290 and 240 Ma.
Magmatism and deformation associated with the Triassic-Jurassic Tethyan rifting largely overprinted the Permian crustal section (e.g. Beltrando et al. Reference Beltrando, Stockli, Decarlis and Manatschal2015). A review of both geochronological and thermochronological Triassic-Jurassic data has been recently published (Simonetti et al. Reference Simonetti, Langone, Corvò and Bonazzi2021a). Here, we summarize isotopic data related to post-Permian deformation events recorded by the IVZ crustal section. One of the oldest studies focused on deformation was provided by Brodie et al. (Reference Brodie, Rutter and Rex1989) by dating with Ar-Ar method syn-kinematic hornblende from mylonitic amphibolites of the Anzola shear zone (Figure 1a). These authors obtained two ages at 215±5 Ma and 210±5 Ma that were interpreted by the authors in terms of the effects of grain-size reduction on the closure temperature for argon in hornblende and helped further to chart the cooling history of the rocks. The activity of the Anzola Shear Zone has been recently constrained by Corvò et al. (Reference Corvò, Maino, Piazolo, Kylander-Clark, Seno and Langone2023) by U–Pb petrochronology of titanite from mylonites consisting of alternating amphibolites and calc-silicates. These authors obtained a Jurassic lower intercept age (188±2 Ma) from rims/tips of titanite grains showing different chemistry and a major concentration of dislocations with respect to the inner domains. The Jurassic deformation was also recorded at different crustal levels by rocks showing different metamorphic conditions. The most prominent rifting-related structure in the southern portion of the IVZ is the Pogallo Line, which is interpreted as a low-angle normal fault that accommodated thinning (Hodges & Fountain, Reference Hodges and Fountain1984) between Triassic and Jurassic age (ca. 210 and 170 Ma; Zingg, Reference Zingg, Salisbury and Fountain1990; Mulch et al. Reference Mulch, Cosca and Handy2002; Wolff et al. Reference Wolff, Dunkl, Kiesselbach, Wemmer and Siegesmund2012) under decreasing temperatures from amphibolite- to greenschist-facies conditions. In the northern sector of the IVZ, Late Triassic to Early Jurassic ductile shear zones developed within (ultra)mafic rocks of the lower crust (U–Pb zircon data, Langone et al. Reference Langone, Zanetti, Daczko, Piazolo, Tiepolo and Mazzucchelli2018; hornblende Ar-Ar data, Boriani & Villa, Reference Boriani and Villa1997 of mylonitic metagabbro in Val Cannobina) and mantle peridotites (e.g. U–Pb zircon data, Corvò et al. Reference Corvò, Langone, Padrón-Navarta, Tommasi and Zanetti2020) under upper-amphibolite to granulite-facies conditions (Brodie, Reference Brodie1981; Kenkmann, Reference Kenkmann2000; Kenkmann & Dresen, Reference Kenkmann and Dresen2002; Degli Alessandrini, Reference Degli Alessandrini2018; Langone et al. Reference Langone, Zanetti, Daczko, Piazolo, Tiepolo and Mazzucchelli2018).
3. Methods
3.a. Sampling strategy
For geochronology, we selected metapelites showing different microstructural features (protomylonitic and mylonitic fabric) and composition (biotite-rich and biotite-poor) for monazite dating and a calc-silicate sample for titanite dating (Table 1). All the samples are coming from the transition between the high-strain and the low-strain zones of the shear zone (Simonetti et al. Reference Simonetti, Langone, Bonazzi, Corvò and Maino2023). Monazite samples were collected from one outcrop along the road whereas titanite-bearing samples are coming from another outcrop along the river, about 150m southward (Figure 1b). Monazite was analysed within six thin-sections from a biotite-poor (VSDO-13B) and two biotite-rich paragneisses (VSDO-13A and VSDO-13M; Figure 2; Table 1).
Table 1. Summary of mineral assemblage, accessory minerals, type of fabric and analysed minerals for the studied samples
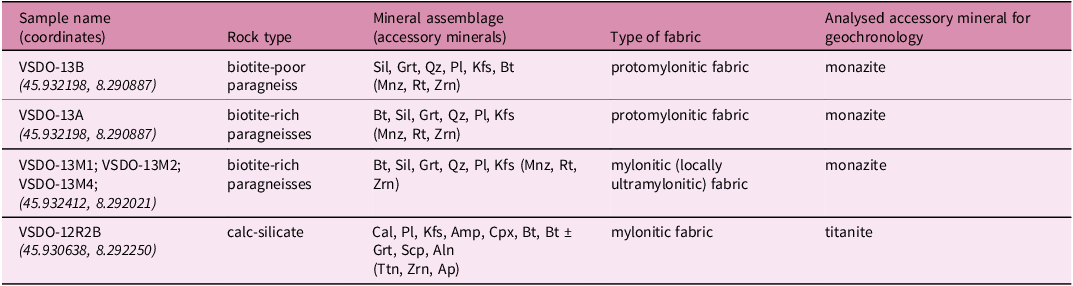

Figure 2. Thin-section scans (a-c) of sheared paragneisses and BSE images (d-f) showing some textural and petrographic details. Dashed white boxes on BSE images in d-f, enclose some monazite grains whose internal zoning is shown in Figure 5. Mineral abbreviations after Whitney & Evans (Reference Whitney and Evans2010).
Titanite was studied on different thin-sections of mylonitic calc-silicates. The samples were cut parallel to the mineral lineation and perpendicular to the main foliation, therefore, along the XZ plane of the finite strain ellipsoid. The analyses were carried out in a (50 µm-thick) thin-section of a representative sample (VSDO-12R2B; Table 1; Figure 3).
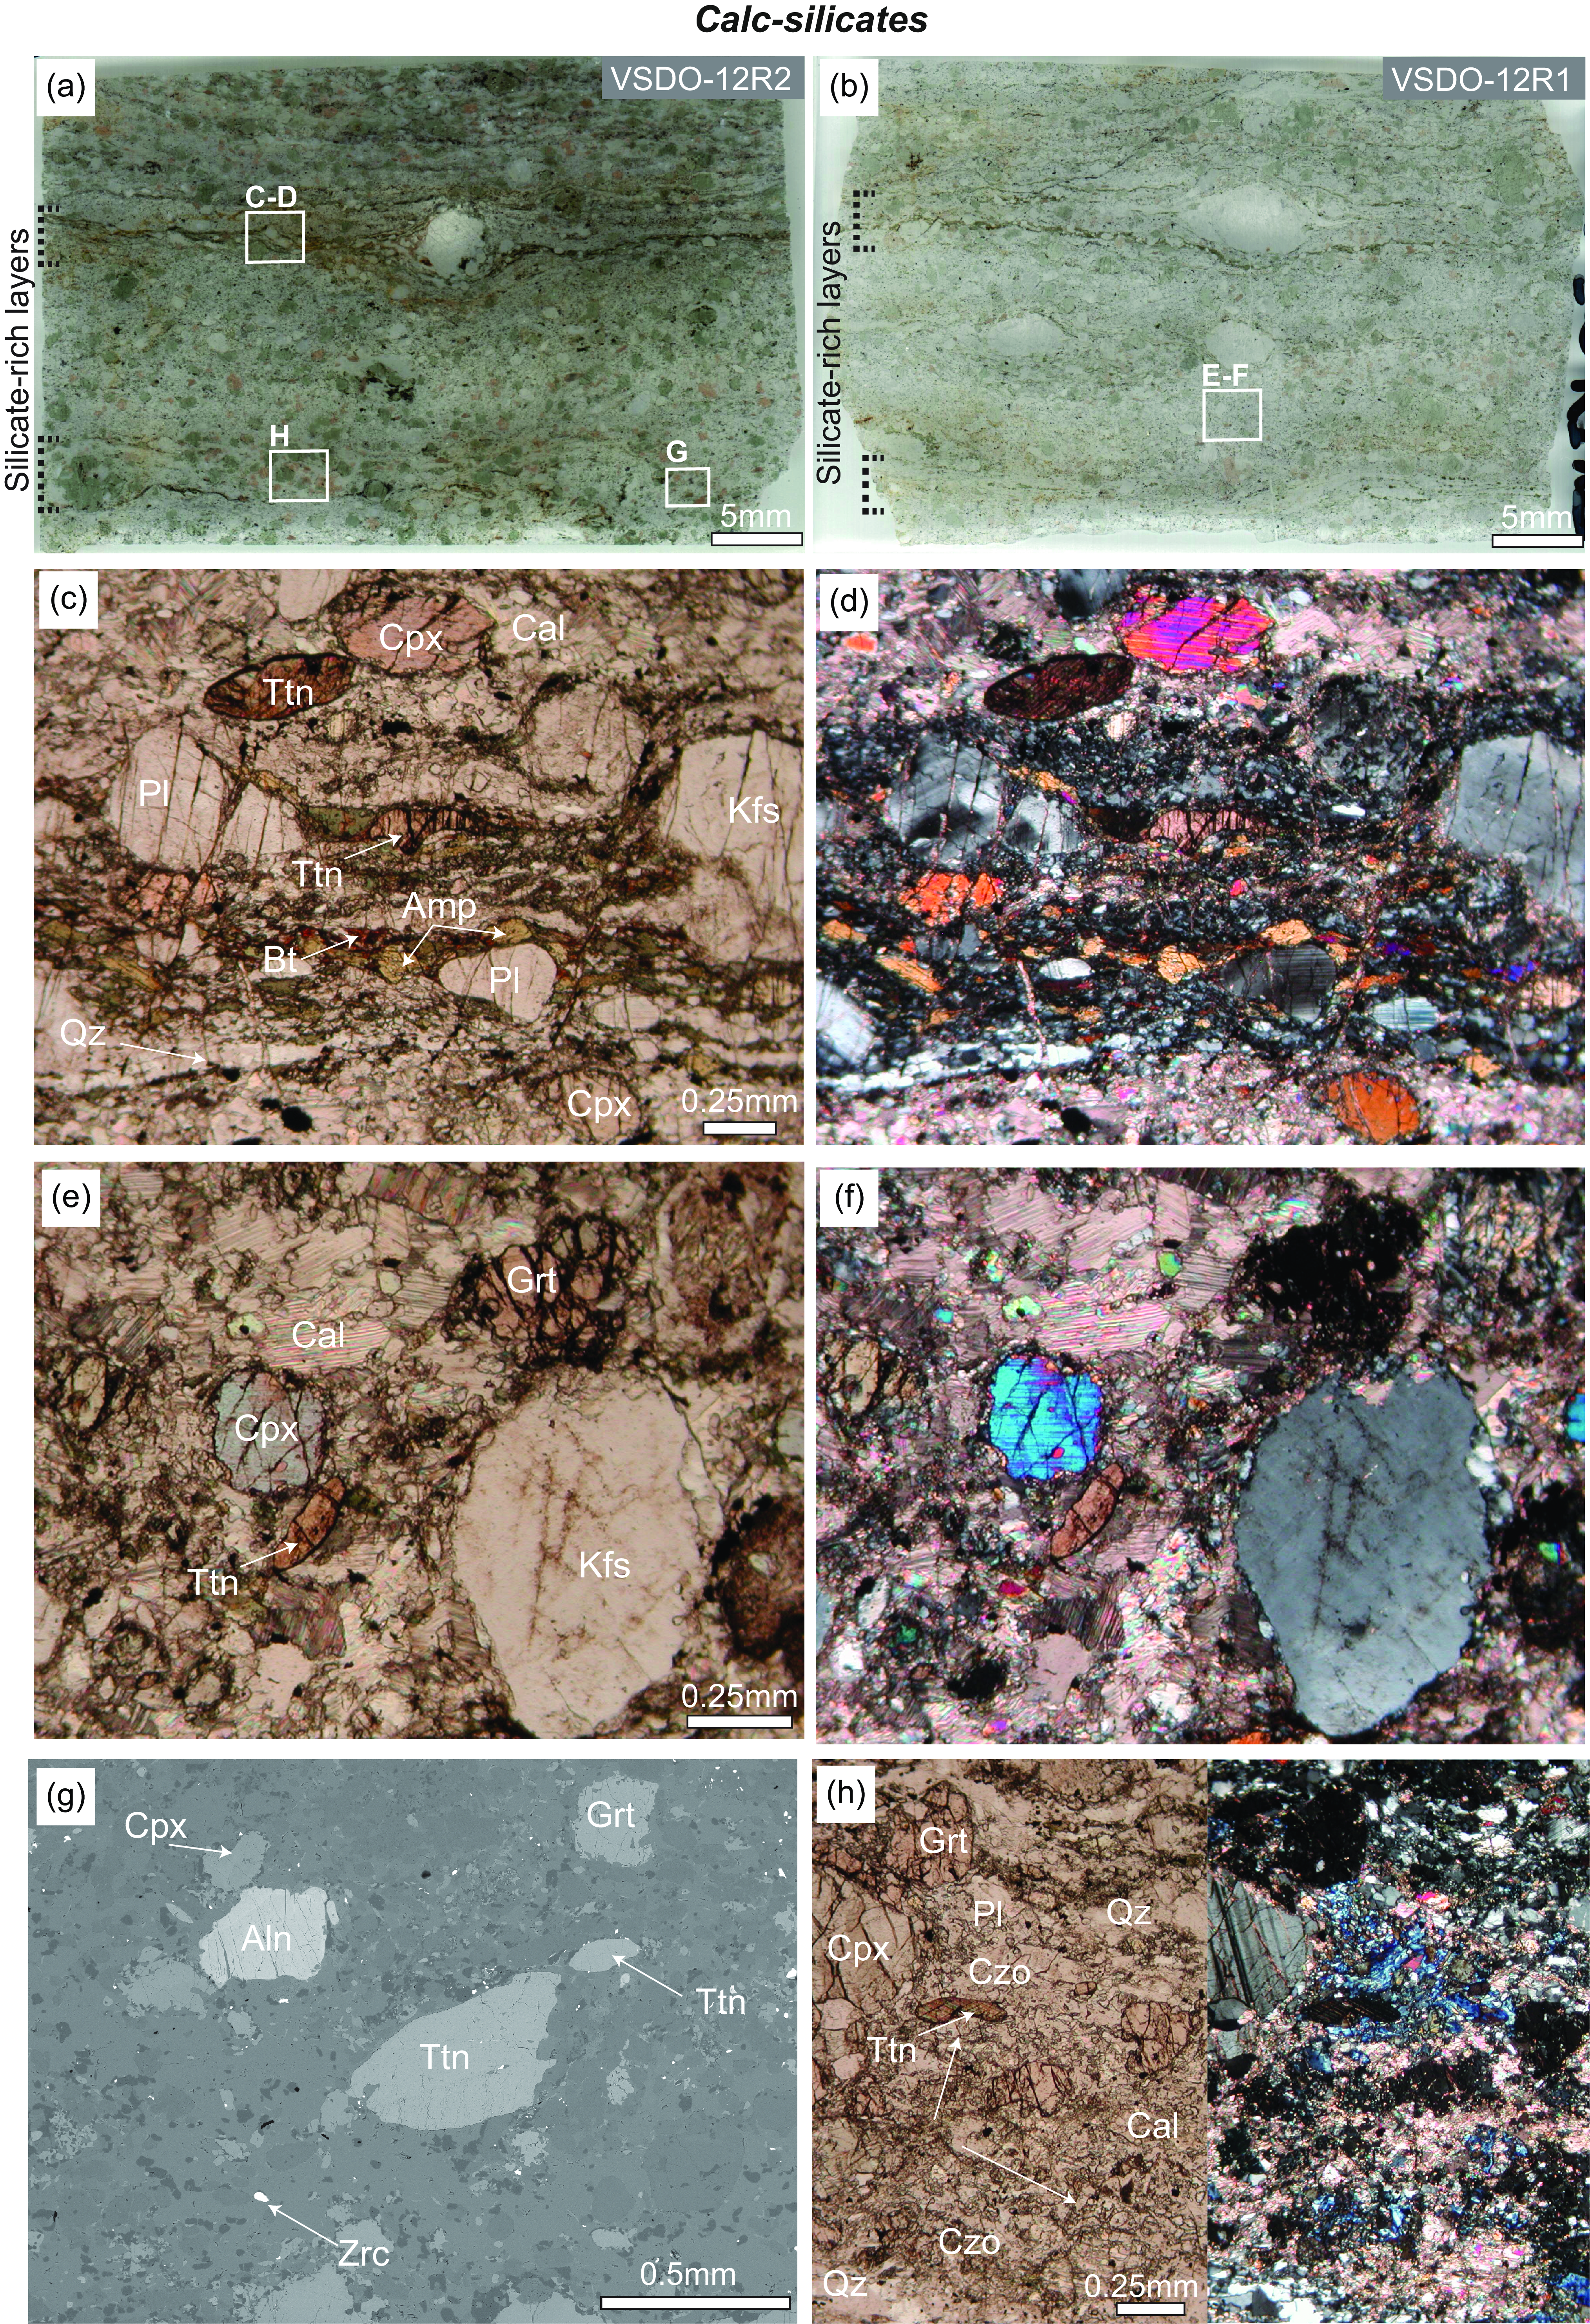
Figure 3. Thin-section scans (a-b) of sheared calc-silicates with thin silicate-rich layers highlighted by the dashed bracket on the left side of each image. Microphotographs show the main petrographic and textural features under both plane (c, e) and crossed (d, f) polarized lights of calcite-poor (c, d) and calcite-rich layers (e, f). The BSE image in g highlights the presence of a large allanite grain close to titanite. The microphotograph in h shows the occurrence or retrograde clinozoisite under both planes (left side) and crossed (right side) polarized lights.
3.b. Monazite and titanite chemistry
Thin-sections were polished, C-coated and inspected using a Scanning Electron Microscope (SEM; Mira3, TESCAN) hosted at the Earth and Environmental Sciences Department of Pavia University, in order to observe monazite and titanite microstructural position, internal features and zoning in back-scattered electron (BSE).
The composition and zoning of monazite grains were characterized by acquiring X-ray maps (for P, Ca, Y, La, Ce, Pr, Nd, Sm, Eu, Gd, Th and U) and chemical analyses with a JEOL 8200 Super Probe electron microprobe hosted at the University of Milano (Italy) and a CAMECA SX-Five microprobe hosted in the Service CAMPARIS Sorbonne University (Paris). An accelerating voltage of 15 kV, a beam current of 5 and of 150 nA (respectively for chemical analysis and X-ray maps) and a spot size of 1 μm were used for the JEOL 8200 Super Probe. The CAMECA SX-Five microprobe was set at 15 kV, a beam current of 5 and of 230 nA for the maps. Monazite formula, normalized to 16 oxygens, was obtained with an in-house Excel spreadsheet. Results are provided in Table S1 (Supplementary Material).
X-ray compositional maps (Si, Ti, Al, Ca, Fe, F, Zr, Nb, La, Ce and Nd) and chemical analyses (Si, Ti, Al, Fe, Mn, Ca, Na, P, Zr, Nb, La, Ce, Nd, Cl and F) of titanite were acquired with a JEOL 8230 Super Probe electron microprobe hosted at the University of Florence (Italy). An accelerating voltage of 15 kV, a beam current of 20 and of 100 nA (respectively for chemical analysis and X-ray maps) and a spot size of 1 μm were used for chemical analyses, whereas variable spot size was considered according to map size for the compositional map. Titanite stoichiometry was calculated using the method of Oberti et al. (Reference Oberti, Smith, Rossi and Caucia1981). Results are provided in Table S2 (Supplementary Material).
3.c. Imaging and quantitative microstructural analysis (EBSD)
In order to analyse the microstructural features, several monazite and titanite grains from the studied samples were selected for obtaining Electron-Backscattered Diffraction (EBSD) maps in thin-section using the FEI Quanta 650 FEG–ESEM (with Oxford X–max 80 SDD EDS, Oxford/HKL Nordleys EBSD system and Aztec software) at the LEMAS, University of Leeds, UK. A working distance of 20 mm, a 70° stage tilt, accelerating voltage of 20 kV and a step size of 0.5–1 μm were used for analyses. Post processing included correcting for wild spikes and down to a 5 nearest neighbour zero solutions correction. Quantitative orientation analyses are presented by maps, pole and dislocation analysis methods using AztecCrystal 2.2 (Oxford Instruments). Pole figures (PF) for monazite and titanite crystallographic system (monoclinic; (100), (010), (001), lower hemisphere projection on plane XZ), and misorientation profiles tendentially from core to rim or from the low to high distorted domains across the grains are used to assess orientation changes locally and within whole grains.
So-called Grain Reference Orientation Deviation (GROD) maps are presented to highlight the pattern and degree of lattice distortions inside grains. These colour-coded maps show the change in crystal orientation with respect to its average orientation. Lattice distortions within deformed grains were quantified by calculation of the local dislocation density using the ‘Weighted Burgers vector’ (WBV) analysis following the approach described by Wheeler et al. (Reference Wheeler, Mariani, Piazolo, Prior, Trimby and Drury2009, Reference Wheeler, Piazolo, Prior, Trimby and Tielke2024) and Timms et al. (Reference Timms, Pearce, Erickson, Cavosie, Rae, Wheeler, Wittmann, Ferrièere, Poelchau, Tomioka, Collins, Gulick, Rasmussen and Morgan2019). Specifically, we performed a loop around the area of titanite grains where the LA-ICP-MS spot analyses were taken. The derived dislocation density value refers to the number of geometrically necessary dislocations that are needed to accommodate the measured lattice distortion over the area in which the LA-ICP-MS spot was taken.
3.d. Monazite and titanite U–(Th–)Pb dating
Monazite and titanite U–(Th–)Pb dating was carried out using a laser ablation, inductively coupled, plasma mass spectrometry (LA-ICP-MS) at CNR-Istituto di Geoscienze e Georisorse U.O. Pavia (Italy). Analytical details, with the technical/methodological parameters following the PlasmaAge recommendation, are reported within Table S3 (Supplementary Material).
The large size of titanite grains/domains allowed us to collect simultaneously trace element concentrations and U–Th–Pb isotopes. Trace element concentrations were calculated using SiO2 as the internal standard and the concentration of 29.8 wt.%, the average obtained from EMPA analyses. NIST610 was used as primary reference materials, and MKED-1 and TTN150 (Klemme et al. Reference Klemme, Prowatke, Münker, Magee, Lahaye, Zack, Kasemann, Cabato and Kaeser2008) were analysed as quality control. The relative standard deviation for MKED-1 is better than 18% and concentrations are typically within better than 5% for Zr, Nb, Nd, Sm, Tb, Dy, Ho, Er, Tm, Hf, Th and U; better than 11% for Al, Ti, Mn, Fe, Pr, Eu, Gd, Yb, Lu and Pb of expected values for ‘MKED-1’ (Spandler et al. Reference Spandler, Hammerli, Sha, Hilbert-Wolf, Hu, Roberts and Schmitz2016). Vanadium, Y, La and Ce are less accurate (21–13%).
Moacir monazite (Cruz et al. Reference Cruz, Cunha, Merlet and Sabaté1996; Seydoux-Guillaume et al. Reference Seydoux-Guillaume, Paquette, Wiedenbeck, Montel and Heinrich2002; Gasquet et al. 2010) and MKED-1 titanite (Spandler et al. Reference Spandler, Hammerli, Sha, Hilbert-Wolf, Hu, Roberts and Schmitz2016) were used as the primary standards for U–(Th-)Pb dating and were run every ∼ 10 unknowns. Precision and accuracy are reported within Table S3 (Supplementary Material).
The software GLITTER ® was used for data reduction (Van Achterbergh et al., Reference Van Achterbergh, Ryan, Jackson, Griffin and Sylvester2001) of both isotopic ratio and trace elements. IsoplotR (Vermeesch, Reference Vermeesch2018) was used for representing isotopic data of both monazite and titanite; ages are provided together with the 2sigma uncertainties. Monazite data with discordance higher than 5% and/or a spot overlap were excluded to avoid data bias. The 238U/206Pb and 207Pb/206Pb isotopic ratios for each analysis are presented uncorrected for common lead in Tera-Wasserburg concordia diagram using IsoplotR (Vermeesch, Reference Vermeesch2018).
Full analytical results for monazite and titanite are reported as Supplementary Material Table S4 and S5, respectively.
3.e. Zr-in-titanite thermometer
The Zr-in titanite thermometer of Hayden et al. (Reference Hayden, Watson and Wark2008) was used to calculate titanite temperatures. Uncertainties are given at 2σ, propagated assuming ± 0.1 GPa for pressure estimates, 2σ variation of the Zr concentration in titanite and the 2σ uncertainties given by the authors for their calibration of the thermometer (see Cruz-Uribe et al. Reference Cruz-Uribe, Feineman, Zack and Barth2014). Temperature estimates are reported in Table S5 (Supplementary Material).
4. Field observations and general petrography
The Forno-Rosarolo Shear Zone (FRSZ), also known as Rosarolo Shear Zone (Siegesmund et al. Reference Siegesmund, Layer, Dunkl, Vollbrecht, Steenken, Wemmer and Ahrendt2008), crops out in the IVZ section of the Strona di Omegna valley between the Rosarolo and Forno villages (Figure 1b). It was recently mapped and characterized in detail by Simonetti et al. (Reference Simonetti, Langone, Bonazzi, Corvò and Maino2023). It is a NE-SW-oriented shear zone with a thickness of about 500m. Mylonitic foliation is subvertical, in places steeply dipping toward the NW. A sinistral top-to-the-SW sense of shear is well highlighted by the presence of δ- and σ-type porphyroclasts, shear boudins, flanking structures and winged inclusions in all the involved lithologies (Simonetti et al. Reference Simonetti, Langone, Bonazzi, Corvò and Maino2023). The FRSZ developed in a narrow area described as the transition zone between the amphibolite- and granulite-facies metamorphic rocks (Redler et al. Reference Redler, Johnson, White and Kunz2012; Kunz et al. Reference Kunz, Johnson, White and Redler2014). Several lithologies are involved in the deformation, in particular paragneisses, metabasites and local calc-silicates (Simonetti et al. Reference Simonetti, Langone, Bonazzi, Corvò and Maino2023). The margins of the shear zone are characterized by two low-strain domains (Figure 1b), with different thicknesses, made by anastomosed protomylonites and mylonites layers surrounding weakly deformed lenses, whereas the high-strain core (Figure 1b) consists of alternating mylonites and ultramylonites. The sheared rocks are characterized by a foliation-oriented NE-SW and dipping at variable angle, between 42° and 88°, toward the NW and a mineral lineation plunging at moderate angle toward the NE (Figure 1b).
The protomylonitic biotite-poor paragneiss is coarse grained and consists of quartz, feldspars, sillimanite, garnet and minor biotite (Figure 2a). Rutile, zircon, monazite, oxides and sulphides are accessories. Intracrystalline deformation is recognizable in all major phases. Feldspars show undulose extinction and deformation lamellae, they are only locally fractured, and biotite shows kinks of the cleavage. Quartz is coarse-grained and presents lobate grain boundaries and window and pinning structures. Sometimes chessboard extinction microstructure is also present. Locally, quartz-rich domains are characterized by a gradual grain-size reduction and by the presence of both subgrains and new grains forming a ‘core and mantle structure’ around larger grains. The prismatic sections of sillimanite show undulose extinction. These rocks are affected by intense fracturing and veining at high angles with respect to the foliation. Fractures and veins are generally closely spaced and crosscut the grains. This late brittle event promoted the replacement of the primary assemblage by secondary minerals such as chlorite, white mica, epidote and ilmenite. Monazite occurs in different textural positions: totally or partially enclosed within garnet or sillimanite porphyroblasts (Figure 2d), within or among recrystallized quartz grains. Rarely monazite shows jagged contours as evidence for partially replaced by allanite (Figure S1, Supplementary Material) but locally it is affected by intense fracturing.
Protomylonitic biotite-rich paragneisses are characterized by biotite, sillimanite, garnet, feldspars and quartz (Figure 2b,e). Monazite, zircon, rutile and graphite are common accessories. These paragneisses show a migmatitic texture overprinted by a well-defined foliation marked by layers of elongated biotite and large sillimanite prisms with subordinate quartz-feldspathic layers (Figure 2b, e). This foliation wraps around rounded to elliptical garnet grains which contain numerous inclusions of matrix-forming minerals (Figure 2b, e).
Feldspars generally show evidence of ductile deformation such as undulose extinction and deformation lamellae. Quartz is coarse-grained and presents lobate grain boundaries. Locally window and pinning structures and deformation lamellae can be recognized. Some grains also display chessboard extinction microstructure.
Sillimanite prisms show undulose extinction and deformation bands whereas the cleavage of biotite is kinked. Sillimanite fish, asymmetric mantled porphyroclasts and S-C-C’ fabric occur indicating a sinistral top-to-the-SW sense of shear. Brittle features are rare as well as the occurrence of secondary minerals such as chlorite after biotite and garnet, ilmenite after rutile.
Mylonitic paragneisses from the high-strain zone show the same mineral assemblage of those from the low-strain zone but differ for a more apparent mylonitic fabric (Figure 2c,f). The foliation is marked by alternating melanocratic and leucocratic layers. The formers are made mainly of biotite and sillimanite whereas the leucocratic ones consist of quartz and feldspars (Figure 2c,f). As porphyroclasts, we observed mainly garnet, sillimanite and feldspars. Garnet occurs as rounded or elongated grains parallel to the foliation and, compared to less deformed rocks, it experienced an apparent grain-size reduction (Figure 2c,f). Sillimanite occurring in basal section commonly forms fish-shaped porphyroclasts rarely replaced at the edges by retrograde white-mica. The prismatic sections are generally elongated parallel to the foliation and show evidence for both ductile deformations, such as undulose extinction and kinking, and brittle deformation such as necking and fractures. Also in these samples, monazite is rarely partially replaced by allanite growing syn-kinematically (Figure S1, Supplementary Material).
Calc-silicates are well exposed in a small outcrop along the river (Figure 1b). They are characterized by large (up to few centimetres) whitish clasts containing feldspars and mafic minerals (clinopyroxene and amphibole) surrounded by a greyish fine-grained matrix (Figure 3a,b). At the microscale, they show a well-developed foliation and mylonitic fabric (Figure 3a–h). The largest porphyroclasts are made of feldspars whereas clinopyroxene and garnet are smaller (Figure 3a–h). Calc-silicate shows a compositional layering consisting of calcite-rich layers alternating with layers richer in silicates (Figure 3a,b). The latter are generally thinner and are made of plagioclase, quartz, green-amphibole and biotite with rare or minor calcite (Figure 3c,d). Due to the low modal abundance of calcite, they can be defined as carbonate-bearing calc-silicate layers. The thicker calcite-rich layers contain (sub)rounded to elliptical grains of clinopyroxene and feldspars; anhedral garnet, locally showing a poikiloblastic texture, is also common (Figure 3e–h). Titanite is an abundant accessory mineral whereas allanite and zircon are less common (Figure 3g). Feldspars and clinopyroxene show evidence for intracrystalline deformation such as undulose extinction; deformation twins are well recognizable within plagioclase (Figure 3d,f,h). Thin ribbons of recrystallized quartz are also common in the carbonate-bearing calc-silicate layers (Figure 3d,h). Features indicative of brittle deformation are also common: major minerals as well as titanite and allanite show fractures, locally associated to a small displacement of fragments. Fractures are filled by secondary minerals such as calcite, chlorite and epidote. Retrograde replacement of primary mineral assemblage is not only localized along fractures; within the calcite-poor layers, clinozoisite is abundant and generally replaces feldspars.
5. Monazite
5.a. Monazite composition
We identified a total of 32 monazite grains in the biotite-rich paragneisses and 4 monazite grains in the biotite-poor paragneisses (Table S6, Supplementary Material). The results of EPMA analysis are reported in Table S1 (Supplementary Material). The monazite grains analysed are rare earth element (REE) phosphate with Ce as the dominant REE (Figure 4) and thus they can be classified as monazite-(Ce) according to Linthout (Reference Linthout2007). Monazites from protomylonites are characterized, on average, by a higher huttonite component (Figure 4) due to the increase of Th and U with respect to Ca + Si following the solid solution between cheralite (Ca(Th,U)(PO4)2) and huttonite (Th,U)SiO4 end-members (Förster, Reference Förster1998; Linthout, Reference Linthout2007).
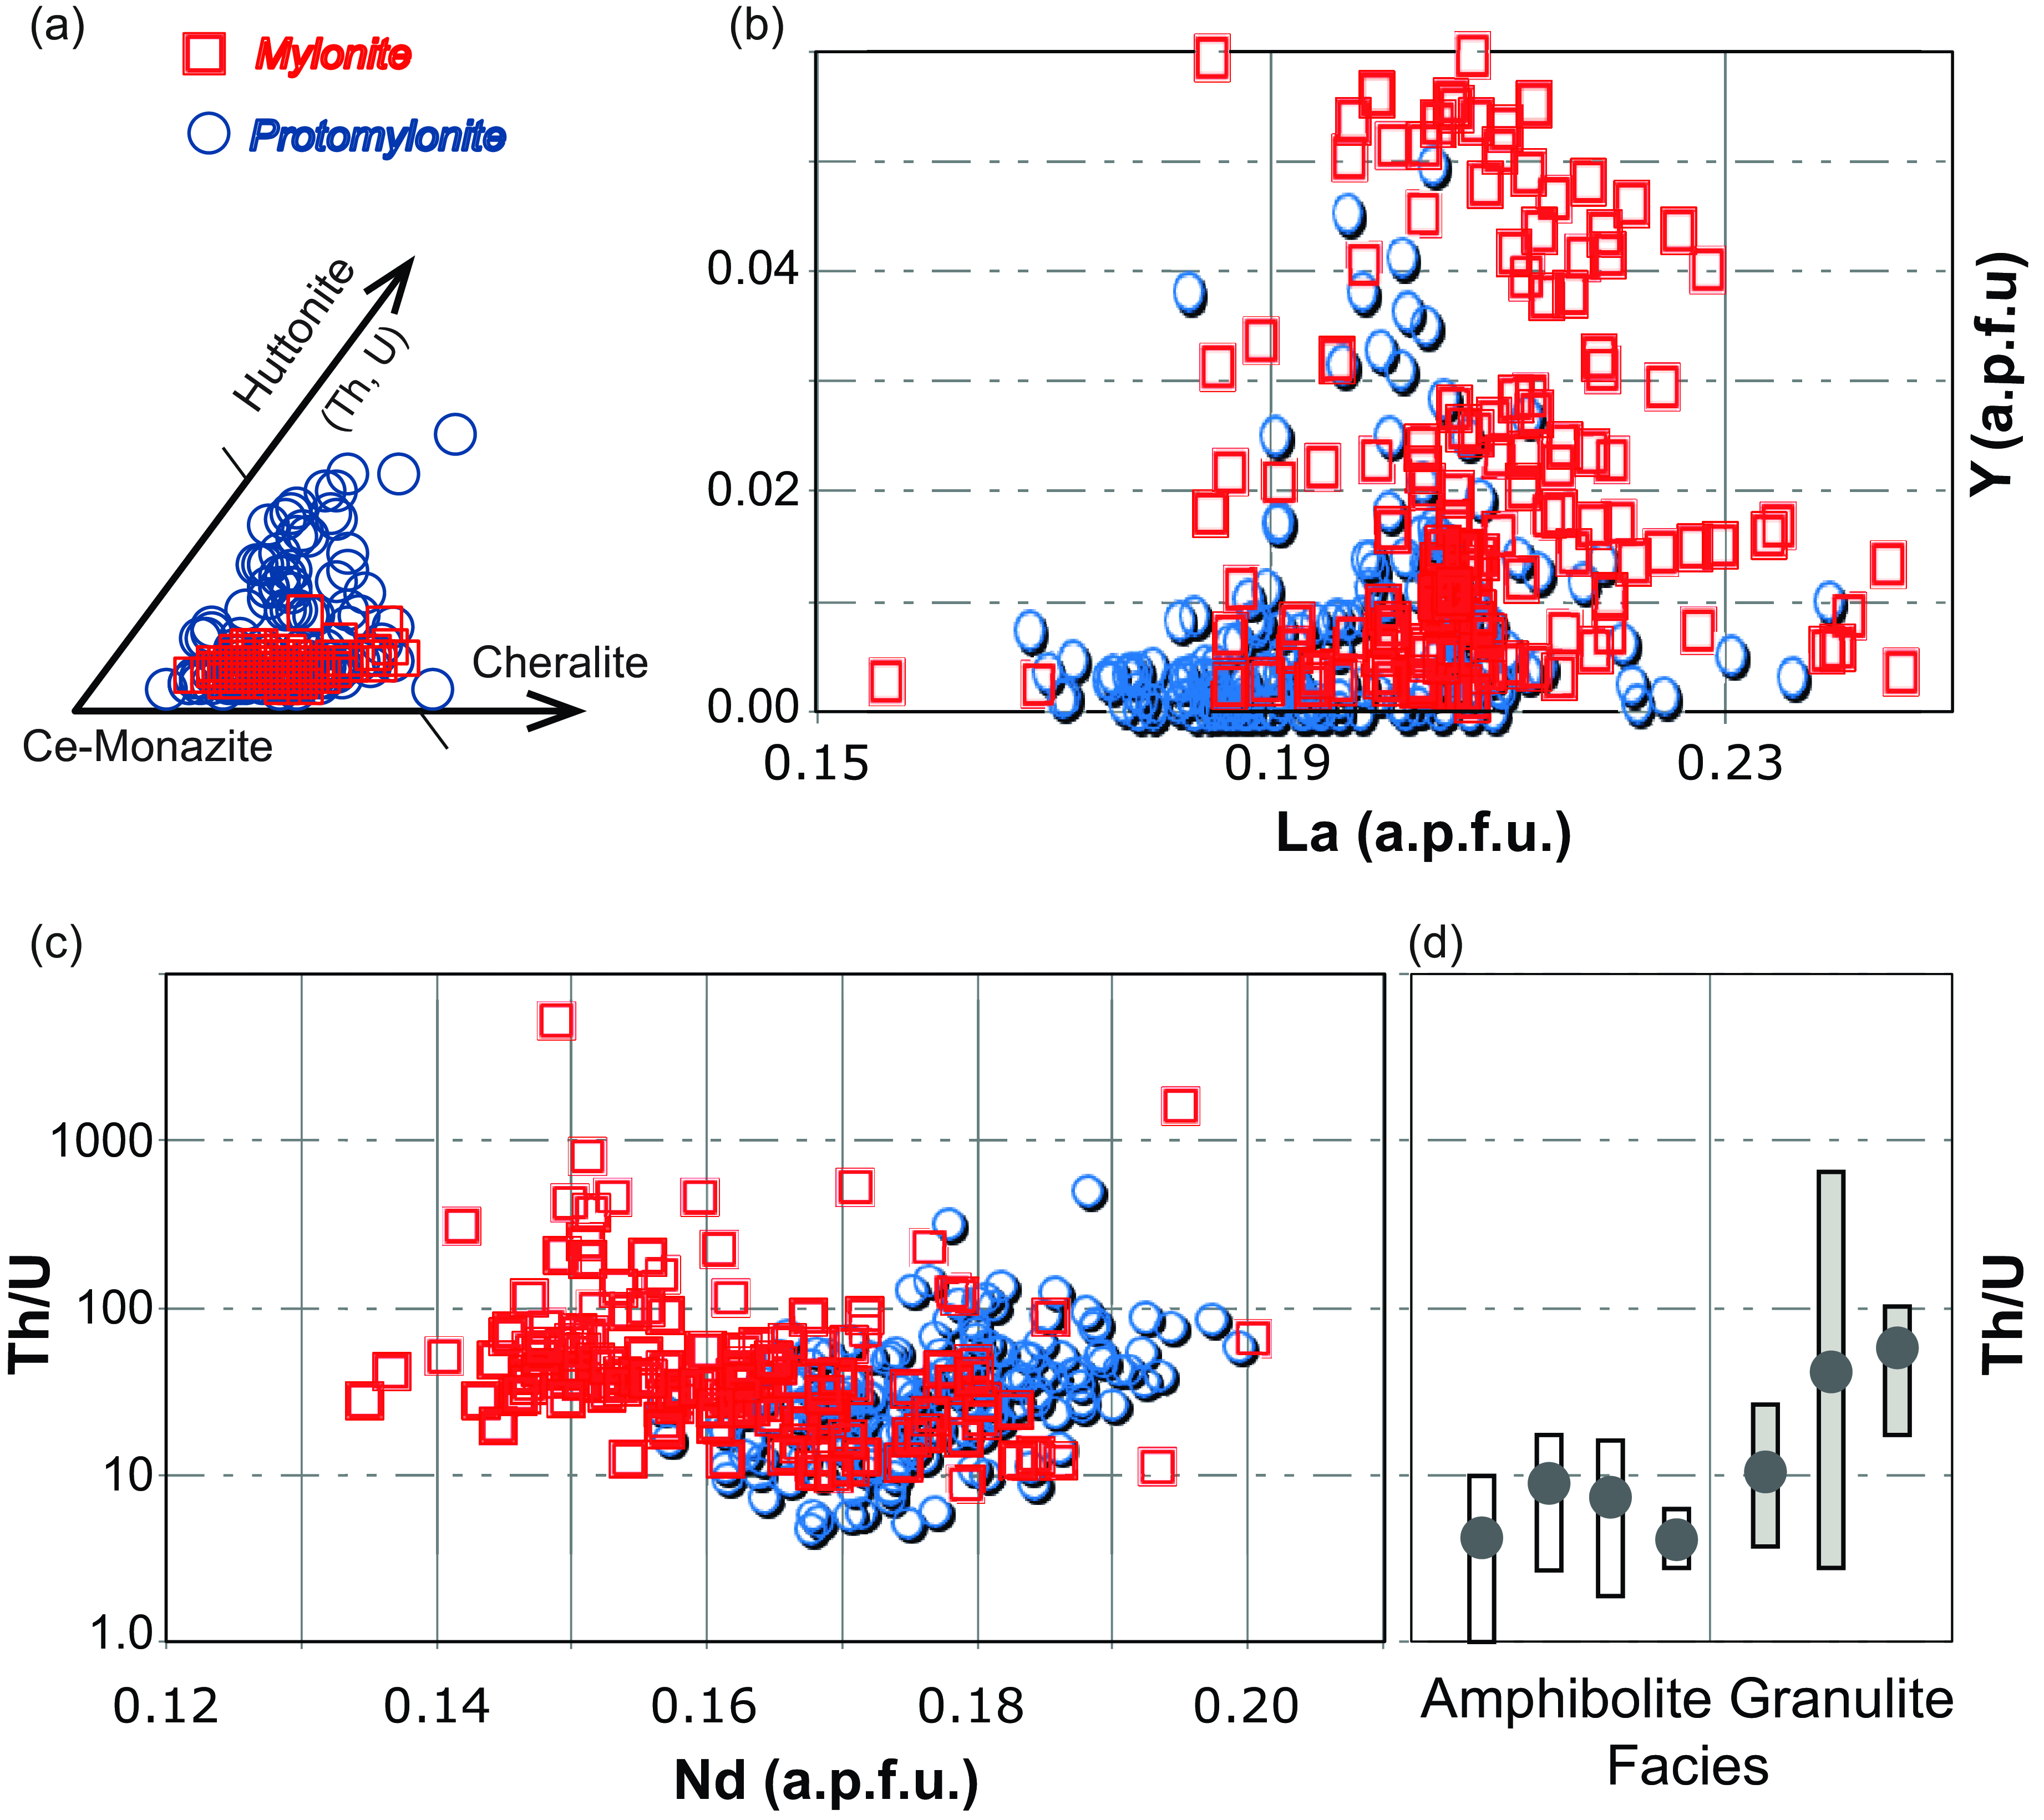
Figure 4. Mineral chemistry of monazite from mylonites (red squares) and protomylonites (blue circles). (a) Monazite composition and classification according to Linthout (Reference Linthout2007), (b) Y (a.p.f.u.) versus La (a.p.f.u.), (c) Th/U versus Nd (a.p.f.u.). (d) Th/U ratio of monazite from metasedimentary rocks with different metamorphic degrees from the Valle Strona di Omegna after Williams et al. (Reference Williams, Kelsey and Rubatto2022).
Among the analysed elements, Nd, Y and La show apparent variations as function of the rock fabric. While Y and La are on average higher within monazite from mylonites, Nd has an opposite trend (Figure 4b–c; Table S1, Supplementary Material). The Th/U ratio does not change significantly within the two different sheared rocks (Figure 4c; Table S1, Supplementary Material) and it has values comparable to those reported for monazite within granulites exposed in the Valle Strona di Omegna (Williams et al. Reference Williams, Kelsey and Rubatto2022; Figure 4d).
5.b. Monazite textural position and zoning
5.b.1. Protomylonite: Biotite-poor paragneiss (VSDO-13B1)
Here, we selected 4 monazite grains (Mnz1a, Mnz4a, Mnz6a and Mnz6b) that are among grains of major rock-forming minerals or included within a sillimanite porphyroblast (Figure 5, Table S6, Supplementary Material).
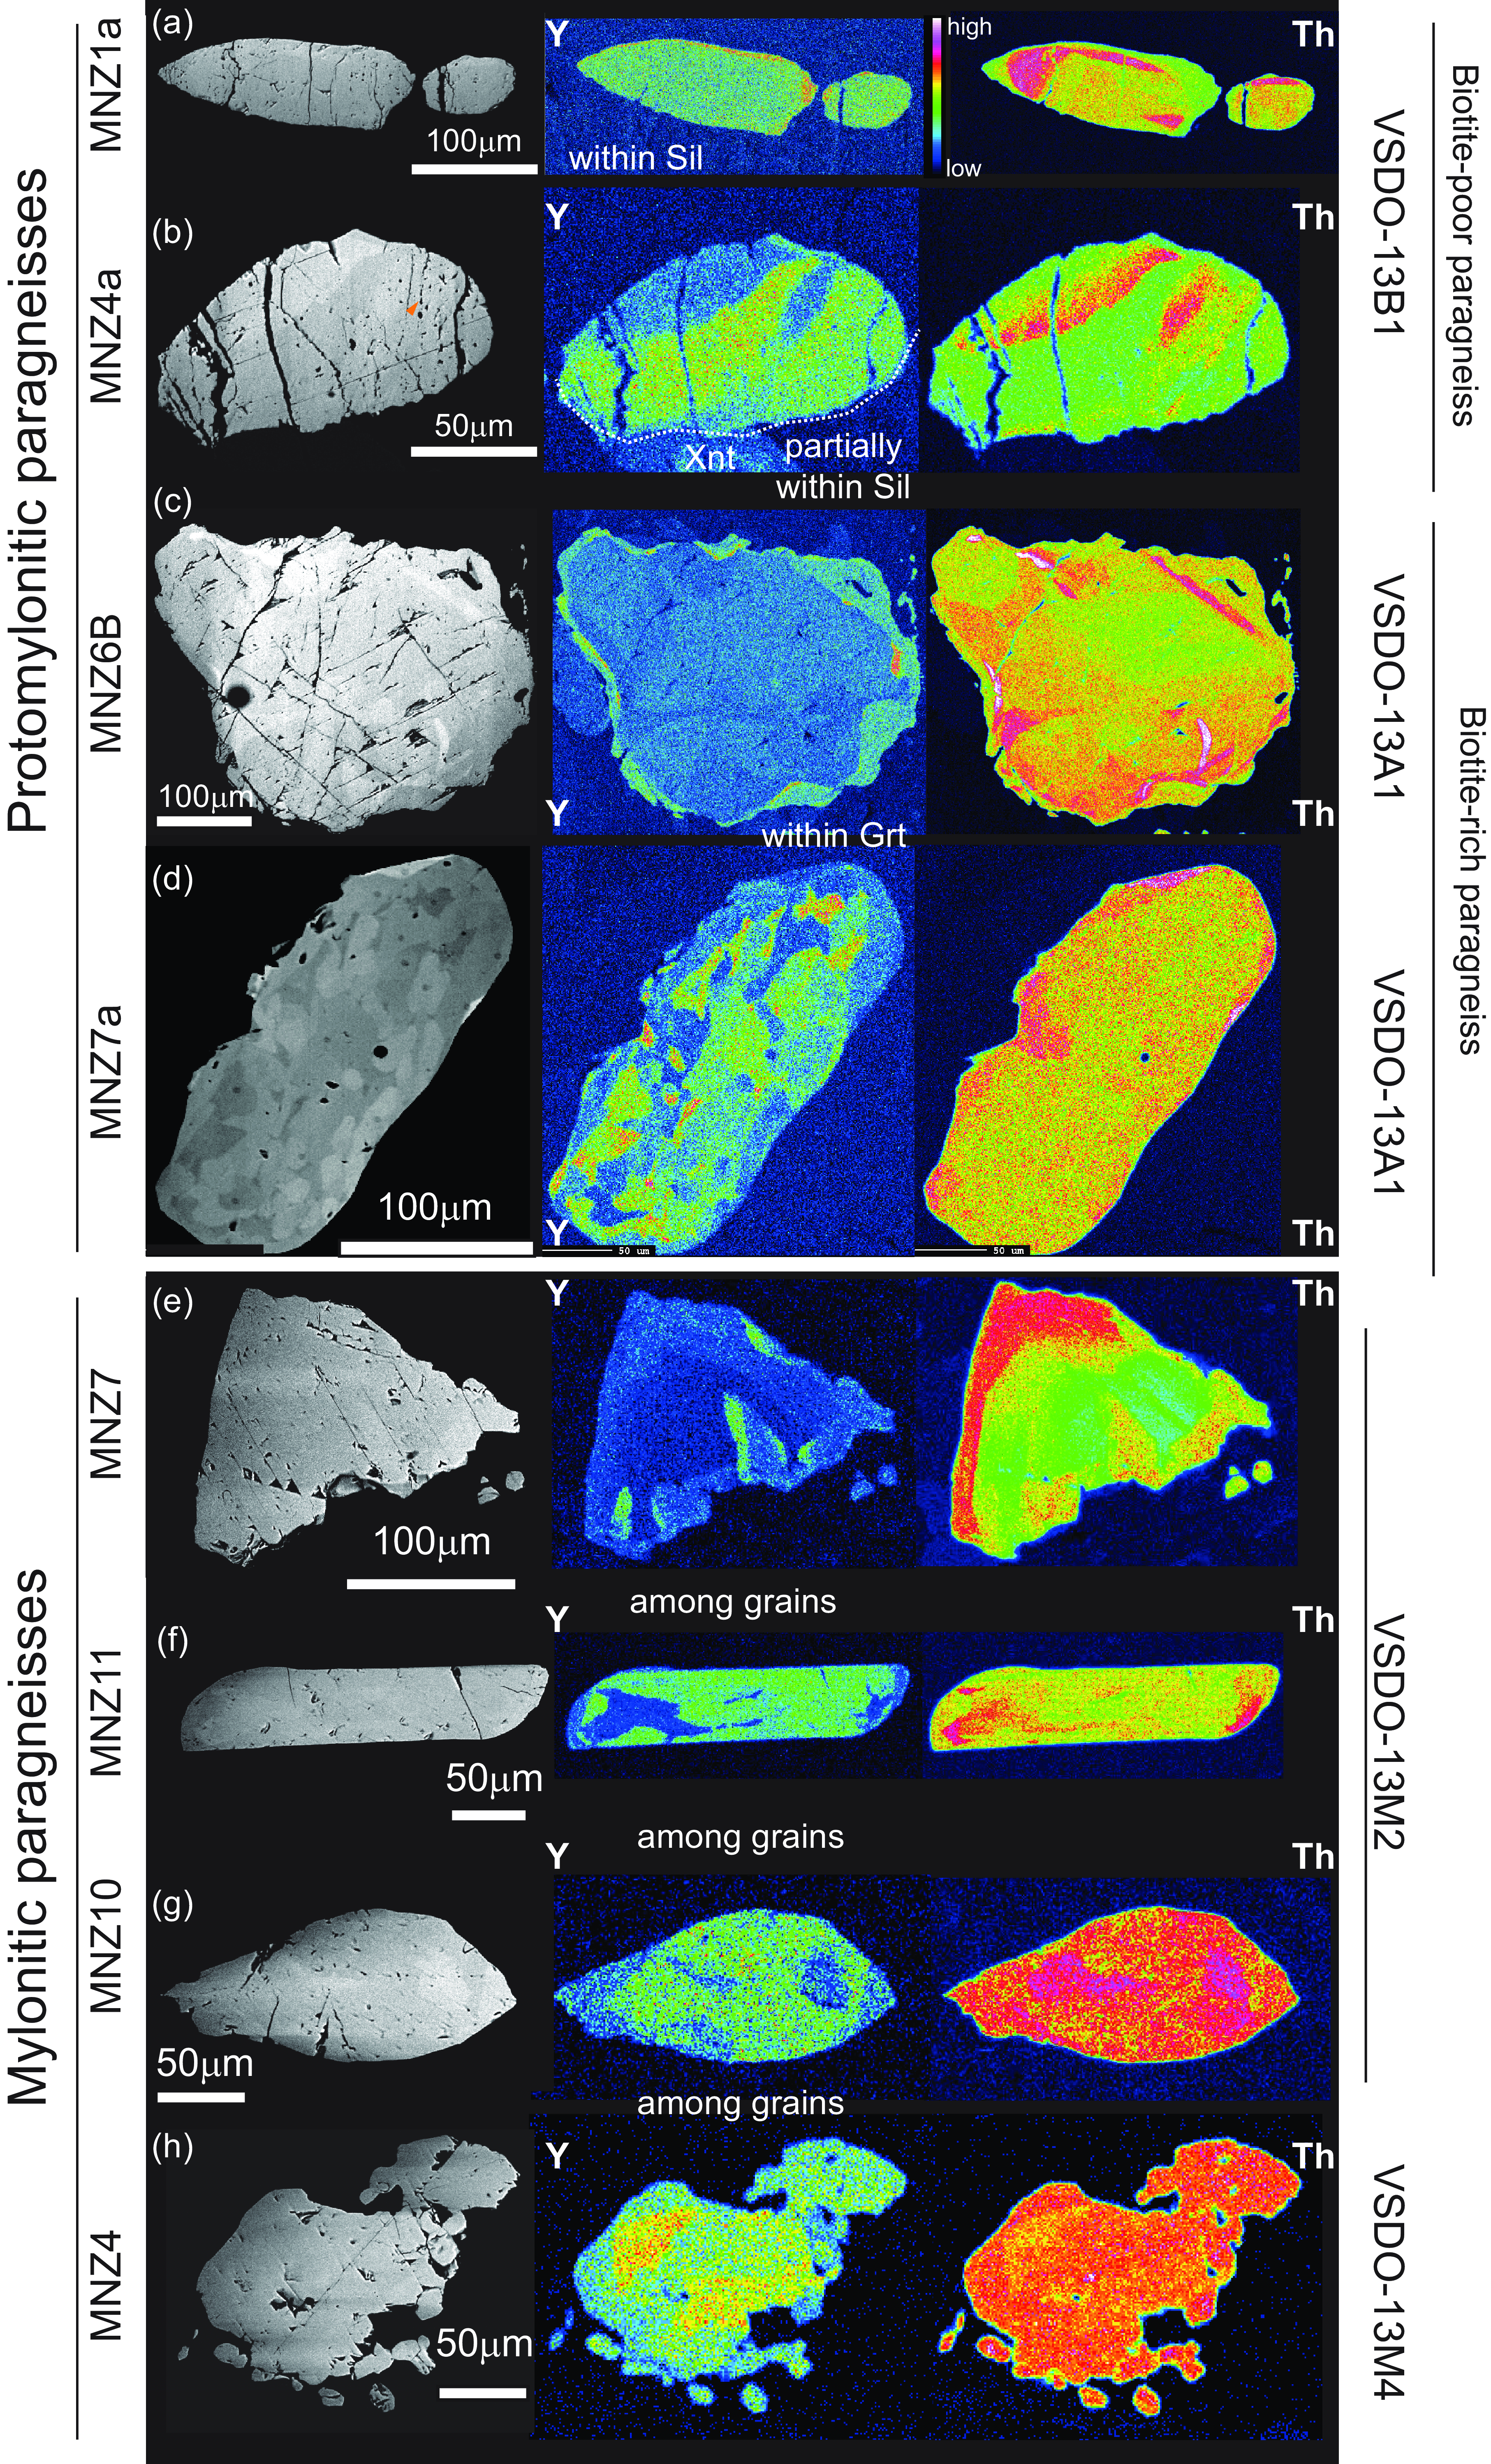
Figure 5. BSE and chemical X-ray maps (Y, Th) of monazite grains within proto- and mylonitic paragneisses (a-h). The textural position of each monazite grain is reported within the Y-map. The locations of monazite in A and B are reported in Figure 2d, and the locations of monazite grains in d and f are shown in Figure 2e,f, respectively.
Mnz1a and 6b have an elongated shape whereas Mnz6a has a more irregular shape with cuspate terminations. All these grains are characterized by a large Th-rich core surrounded by thin rims/edges with lower Th content. Y is generally homogeneous within the large core and tends to be higher in the outermost domains (a few µm) of the grains (Figure 5a–b). Mnz4a is stubby (Figure 5b) and differs from the other grains since it shows opposite zoning features: on one side, towards the foliation, high-Th and low-Y domains occur. This grain is also characterized by intense fractures that crosscut the entire grain, and it has numerous fine-grained pores/inclusions aligned almost parallel to the main fractures (Figure 5b).
5.b.2. Protomylonite: Biotite-rich paragneisses (VSDO-13A1)
In sample VSDO-13A1, a total of 9 grains were characterized by X-ray maps: 8 grains are located along the main foliation and 1 is included in garnet (Table S6, Supplementary Material).
The monazite grains located along the main foliation show a variable size and shape (Table S6, Supplementary Material), and all present apparent chemical zoning for Y and Th (Figure 5a–d and Figure S2 and Table S1, Supplementary Material). The most common zoning pattern consists of large cores richer in Th and poorer in Y surrounded by thinner irregular rims richer in Y and poorer in Th (e.g. Mnz6b Figure 5c and Mnz2a, 8a, Figure S2). The Th distribution in the internal domains is irregular and locally riches concentrations up to 12wt.% (ThO2). Locally Y-rich bands alternate with Th-rich ones (e.g. Mnz4a, Figure 5b). Monazite grains totally or partially enclosed within garnet are characterized by patchy zoning of both Y and Th (e.g. Mnz7a, Figure 5d). Less commonly, Y is almost homogeneously distributed within the grain whereas Th looks oscillating (e.g. Mnz1a Figure 5a).
5.b.3. Mylonites: paragneisses
Sheared paragneisses (VSDO-13M1, VSDO-13M2 and VSDO-13M4) contain abundant monazite grains. Twenty-three grains were selected as representative of different textural positions and were fully characterized (EPMA chemical analyses and X-ray maps; Table S1, Supplementary Material): 13 are located along the main foliation, 3 are in the strain shadow around porphyroclasts, 4 are in contact with garnet and 3 are totally or partially included within garnet porphyroclasts (Table S6, Supplementary Material). Some of these monazite features are shown in Figure 5 and S2. The X-ray maps of selected monazite grains revealed that monazite shows three main different zoning patterns.
(i) Ten of the analysed twenty-three grains do not show a clear core-rim zoning and are locally characterized by internal domains poorer in Y and external domains richer in Y (e.g. Mnz7, VSDO-13M1; Mnz7 VSDO-13M2; Mnz14, VSDO-13M4, Figure 5e). In these grains, Y and Th are correlated.
(ii) Seven of the analysed twenty-three grains show irregular shapes with inner domains richer in Y and external domains Y-depleted. In these grains, the zoning pattern of Th is not apparently correlated with Y (e.g. Mnz6, VSDO-13M1; Mnz4 VSDO-13M4, Figure 5h).
(iii) Five of the analysed twenty-three grains are elongated (high aspect ratio) and show richer Y cores and poorer Y rims/tips (Mnz15, Mnz11 and Mn10 VSDO-13M2, Figure 5f–g). Also in these grains, the zoning pattern of Th is not apparently correlated with Y.
A patchy distribution of both Th and Y was observed for one grain partially included within garnet (e.g. Mnz15, VSDO-13M4).
5.c. Monazite quantitative orientation data
Four monazite grains from the studied samples were analysed by EBSD (Figure 6). Two from the protomylonitic paragneiss (Mnz2a, Mnz6B, VSDO-13A1) and two from the mylonitic paragneiss (Mnz1, Mnz2, VSDO-13M1). All monazite grains show significant distortions (up to 12°) regardless of the degree of strain intensity of the two different samples. However, monazite grains from mylonites show a higher degree of distortions strongly localized at the rims/tips of the grain with respect to those from protomylonites. In all grains, the systematic orientation of the main grain (blue colour) with little changes of distortions towards the rims (red colour) is highlighted not only by EBSD maps but also by the profile and pole figures (Mnz2a, Mnz2; Figure 6a,d). The single blue points in pole figures emphasize the occurrence of neoblasts (e.g. Mnz6B, Mnz1; Figure 6b,c).
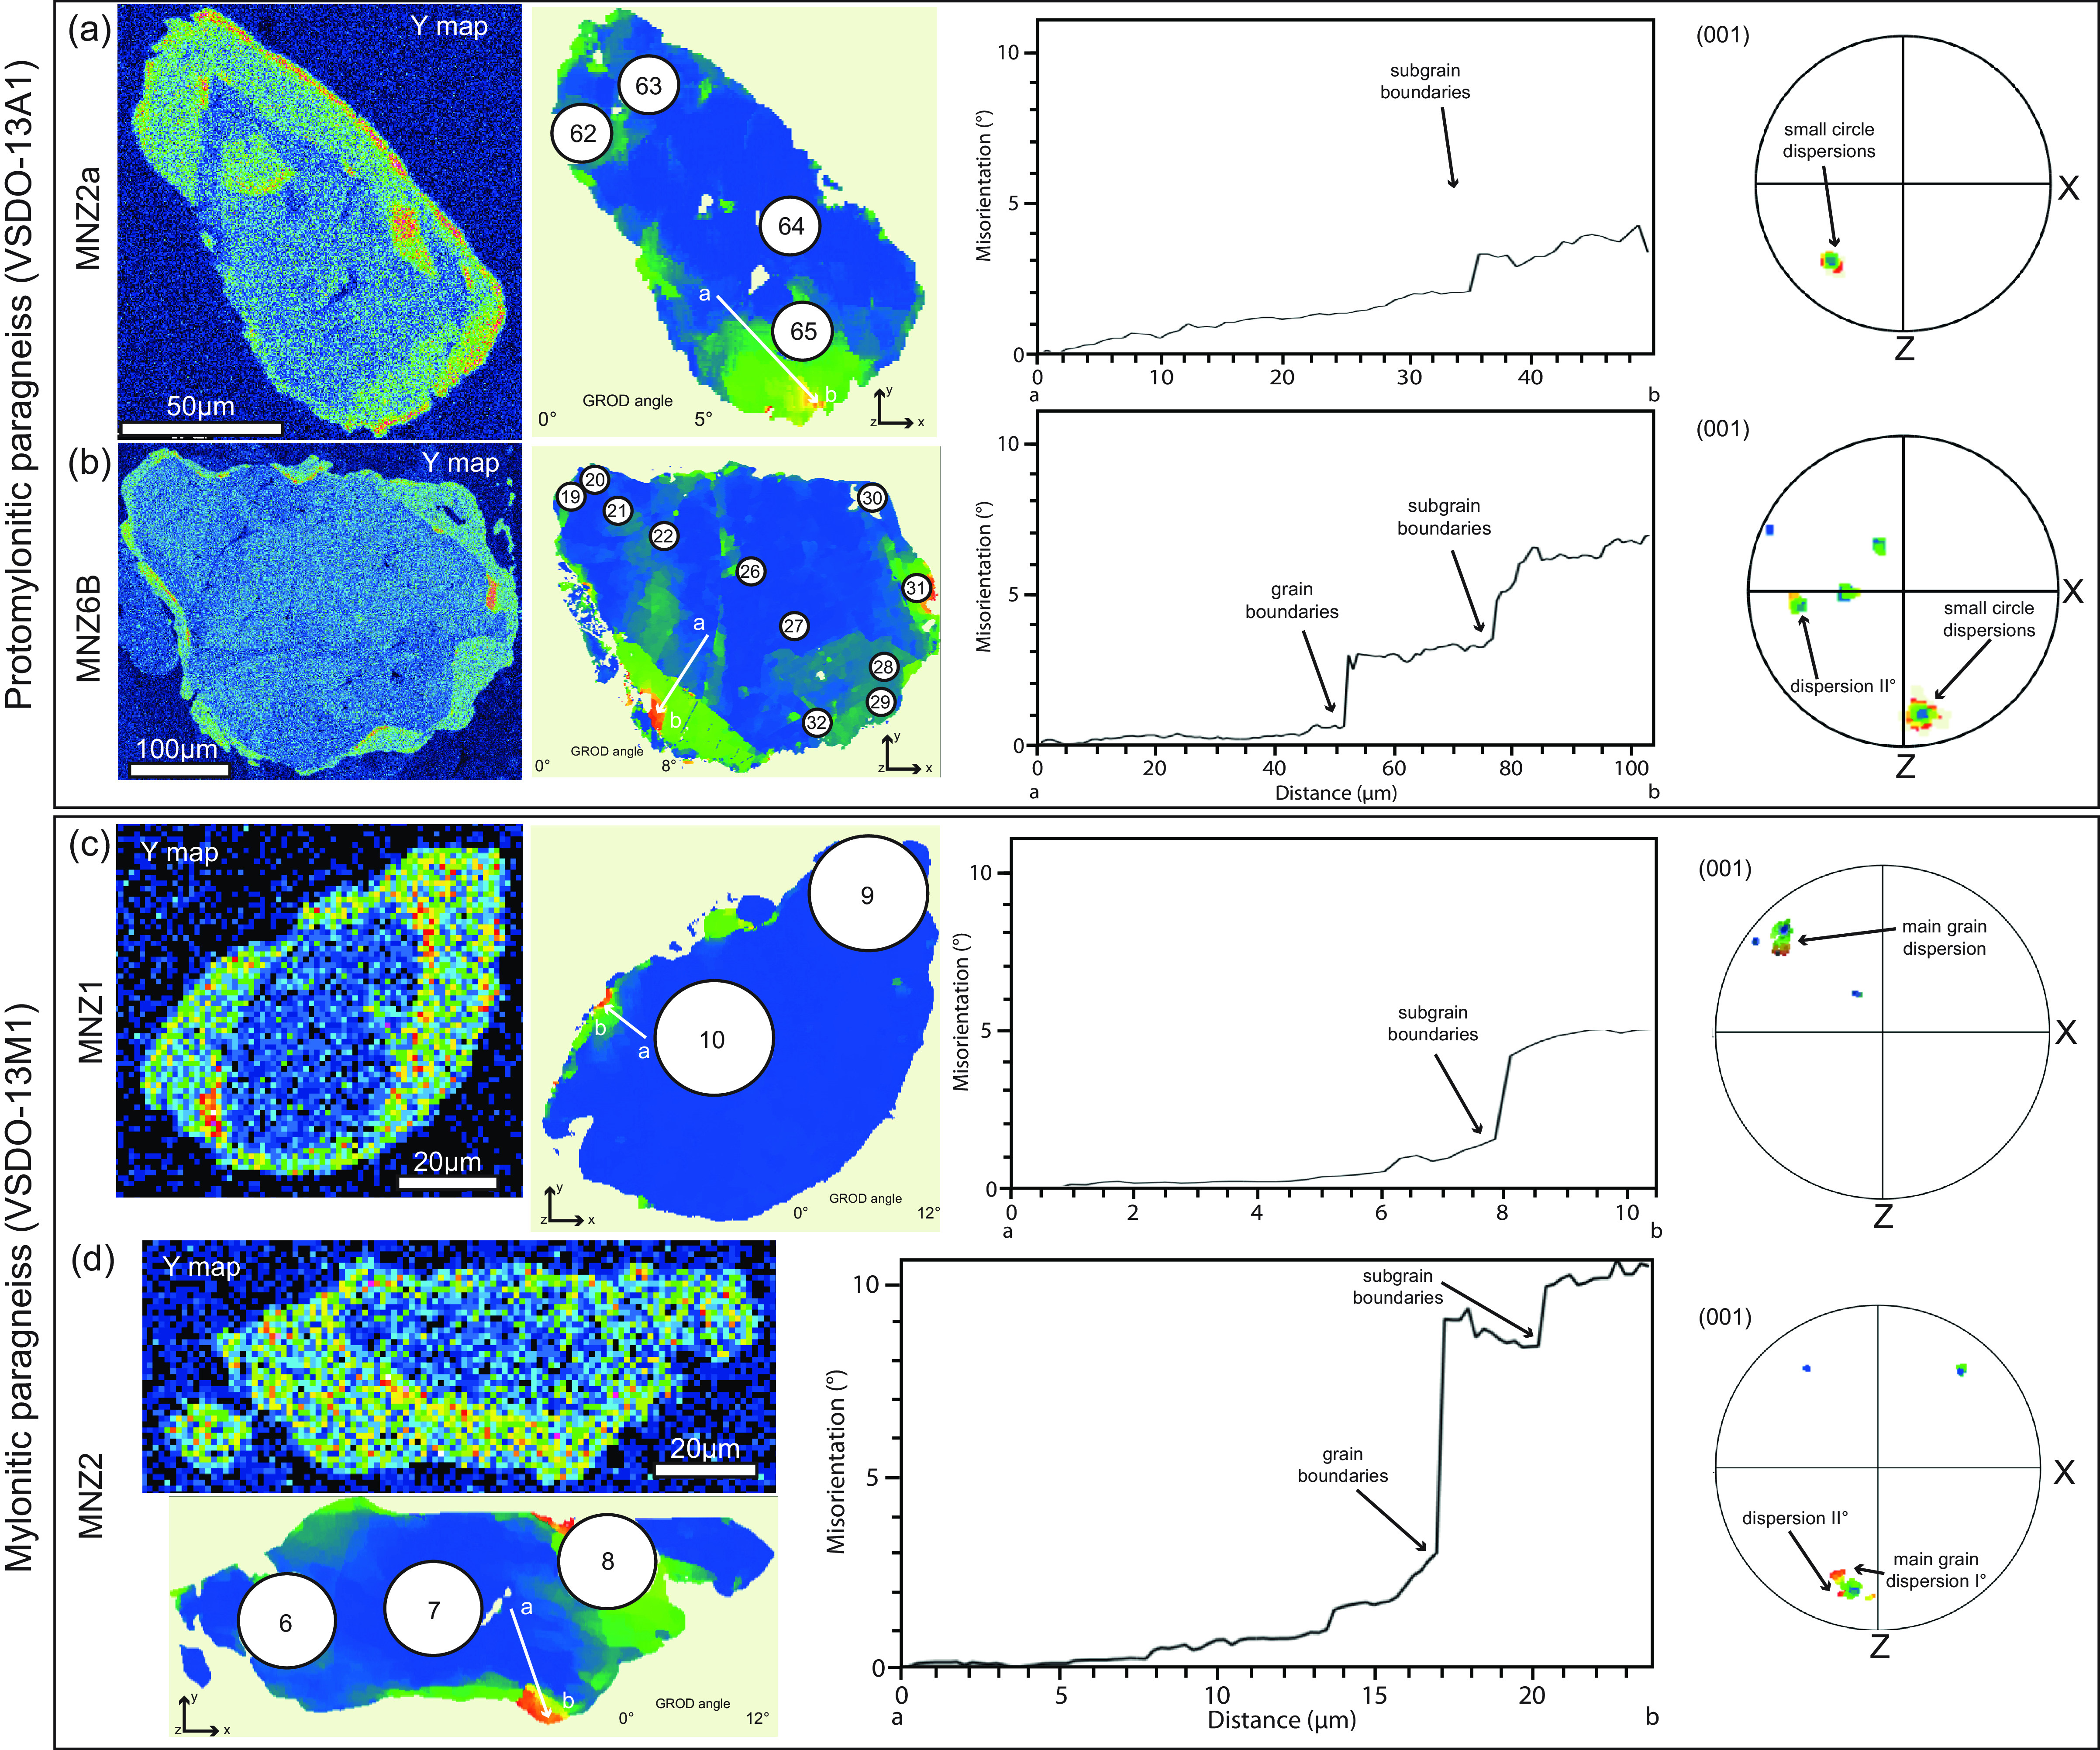
Figure 6. Representative Y maps and microstructural features of monazite within protomylonitic (a, b) and mylonitic (c, d) paragneisses. Microstructural features are shown as relative crystallographic orientation maps (GROD angle map), misorientation profile diagrams (from the point ‘a’ to ‘b’, reported in the GROD angle map as white arrow) and pole figure plots for (001) to highlight degrees of distortion across the monazite grain. The numbered white circles on the GROD angle maps represent the LA-ICP-MS spot locations performed on monazite grains numbered according to the U–Pb analyses reported in Supplementary Material Table S4. It is interesting to note that there is no overlap between Y-zoning and increasing distortions. Both maps and plots show the increasing distortions focused on the rim/tips of the grains. Pole figures are plotted in the lower hemisphere, equal area projections in the sample x-y-z reference frame. The colours of point in pole figures reflect the colours of the GROD angle map. Black arrows highlight the way of dispersions.
Monazite from the protomylonite (VSDO-13A1) shows slightly continuous and discontinuous increasing lattice distortions from core to rim (around 5–8°; Figure 6a,b). In these grains, the higher degree of distortion is focused on the rim/tips (Mnz2A; Figure 6a) and where the changes in orientation are due to the occurrence of grain boundaries (Mnz6B; Figure 6b).
Monazite from the mylonite (VSDO-13M1) presents significant lattice distortions especially focused on the rim/tips (up to 12°; Figure 6c,d). The accumulation of distortions locally develop into distinct neoblasts (Mnz1; Figure 6c).
5.d. Monazite U–Th–Pb dating
5.d.1. Protomylonites
A total of eighty-eight analyses were performed on 12 monazite grains within the protomylonites (4 grains from the biotite-poor sample; Figure 7a–b; Table S4, Supplementary Material). Sixty-three data resulted concordant (% of concordance >95%) for both 206Pb/238U vs 207Pb/235U and 206Pb/238U vs 208Pb/232Th systematics in the range of 314±6 Ma to 184±6 Ma. The dominant Carboniferous-Permian dates (57% of the total dataset) were obtained mostly from cores of monazite occurring within the foliation and from one grain enclosed within garnet. These grains are characterized by both cores to rim zoning features (low-Y cores or inner domains surrounded by high-Y rims and/or external domains) or patchy zoning (Figure 7b, Figure S3). The Triassic data (33% of the total dataset) were obtained mostly from high-Y external portions (Figure 7b) whereas the youngest Jurassic dates were obtained from one high-Y grain occurring as satellite around a larger grain (Figure S3), a high-Y rim of a monazite with patchy zoning and a Y-rich domain of a grain showing numerous fractures and pores (e.g. Mnz4a, VSDO13-B1).
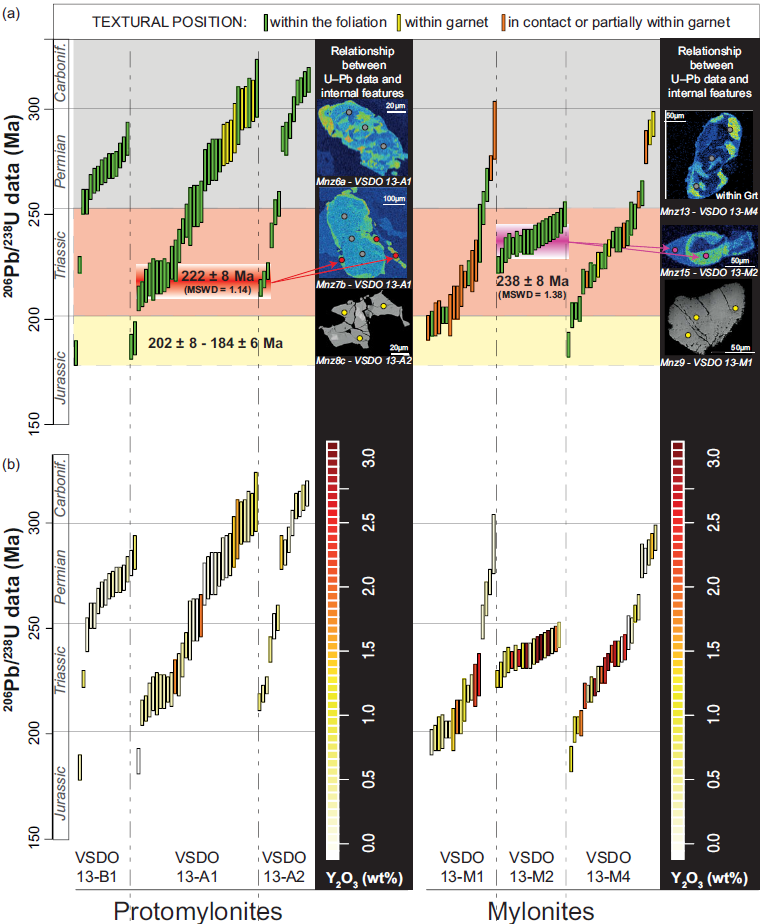
Figure 7. Summary of concordant monazite U–Th–Pb data for protomylonitic and mylonitic paragneisses organized in ascending order for each sample. The length of boxes represents the apparent ages with the 2σ uncertainty. Data are coloured as function of the textural position (a) and the Y content of the relative analytical spot (b). The weighted average of two clusters obtained from specific grains/domains is also reported in (a). The location of the analytical spots for some representative grains is shown on the X-ray maps and BSE images.
5.d.2. Mylonites
A total of eighty-eight analyses were performed on 21 monazite grains within the mylonites (Figure 7a–b; Table S4, Supplementary Material). Sixty-one 206Pb/238U data resulted concordant (% of concordance >95%) with respect to both 207Pb/235U and 208Pb/232Th data. Although dates show a huge spread from 290 ± 14 Ma to 188 ± 6 Ma they fall mostly in the Triassic period (36 data, 59% of the entire dataset). The minor Carboniferous-Permian dates (8 data, 13% of the entire dataset) were obtained mostly from cores of monazite occurring within the foliation and from two grains partially or totally enclosed within garnet. These grains are characterized by both cores to rim zoning features (low-Y cores or inner domains surrounded by high-Y rims and/or external domains) or patchy zoning. The Triassic and Jurassic dates (53 data, 87% of the entire dataset) were obtained from high-Y rims surrounding low-Y cores and from high-Y elongated or anhedral grains along the foliation (Figure 7b, Figure S4).
6. Titanite
6.a. Titanite textural position
Titanite is found generally as elongated grains aligned with the foliation (Figure 8) with dimensions up to 600x250 µm. Locally, small grains occur as satellites around larger titanite grains (Figure 8a,b). Rarely titanite is observed within clinopyroxene porphyroclasts (e.g. Ttn11; Figure 8h). Two sets of fractures were observed within titanite (Figure 8), one set is parallel to the cleavage and the second one is generally at high angle with respect to the foliation and crosscut the entire grains. In this latter case, fractures are filled by secondary minerals such as chlorite, albite, epidote and ilmenite. As inclusions titanite can host feldspars, calcite, chlorite, epidote, apatite, zircon and rarely rutile . Trails of small inclusions/pore are also common (Figure 8).
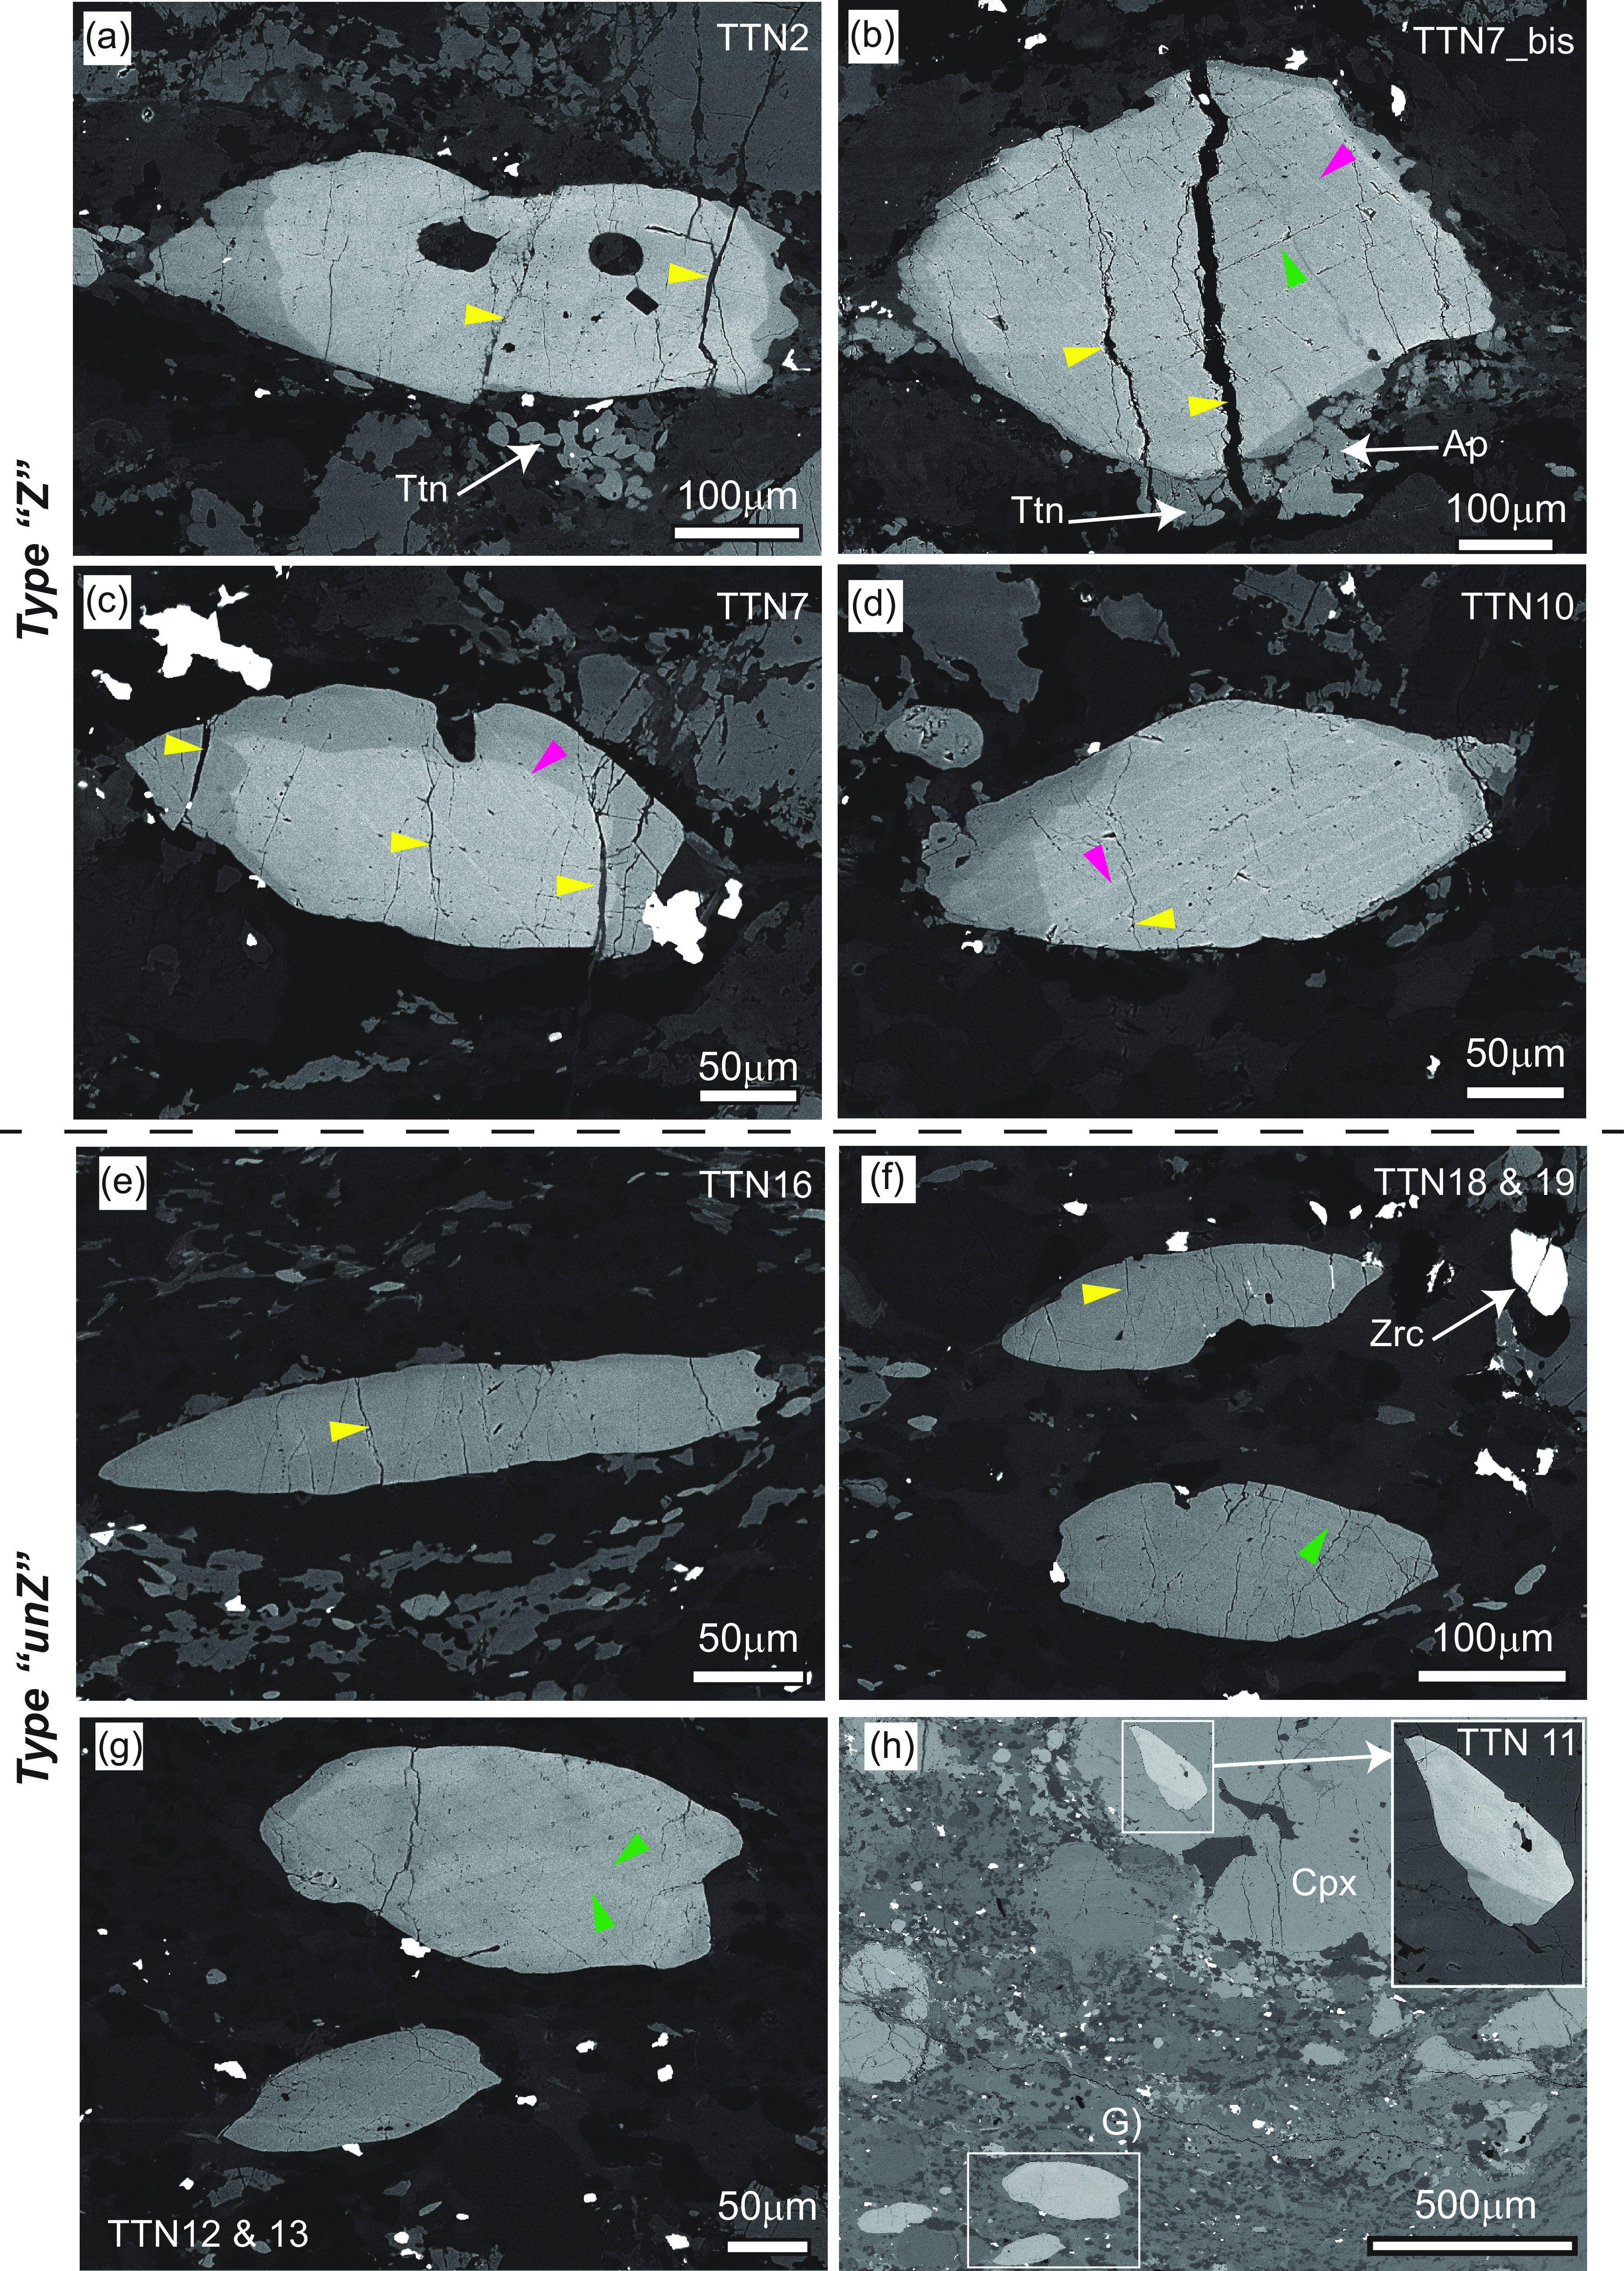
Figure 8. High contrast BSE images of titanite within calc-silicates showing textural and internal features. (a-d) Type ‘Z’ (Zoned) titanite consisting of large brighter cores surrounded by thin darker asymmetric rims. Small titanite grains occurring as satellites close to the large grains are shown in a and b. (e-g) Type ‘unZ’ (unzoned) titanite without apparent zoning. In both Types, fractures (yellow arrows) at high angle with respect to the foliation are common. Two sets of twins are highlighted by green and purple arrows and are more pronounced within the Type Z titanite. (h) BSE Image of a textural site showing the location of titanite grains within the matrix reported in (g), and a grain included within a clinopyroxene porphyroclast. The inset is the high-contrast BSE image of this included grain.
6.b. Titanite zoning, chemistry and thermometry
Based on textural and chemical features, titanite can be subdivided in two main types. Type ‘Z’ titanite is apparently zoned in BSE images with darker tips/terminations and brighter cores (Figure 8a–d). Rarely, the darker domains are more extended, partially enveloping the grain (Figure 8b–d). Locally, zoning features are crosscut by brighter parallel bands reflecting twins (Figure 8b–d). Type ‘Z’ titanite occurs generally within the silicate-rich layers. Type ‘unZ’ titanite is relatively unzoned in BSE images (Figure 8e–g) and occurs mostly within the calcite-rich layers. Both types can coexist within the same textural site within a distance of a few microns (Figure 8g,h) at the boundary between the two compositional layers (i.e. calcite-rich and silicate-rich layers). The apparent chemical differences between the two types of titanite have been further documented by X-ray maps of both types (Figure S5 and S6). According to the X-ray maps of two selected grains of type ‘Z’ titanite, large cores with higher La2O3, Ce2O3 and Nd2O3 and Nb2O5 are surrounded by thinner rims/tips with lower REE (Figure S5). The distribution of elements within the cores is indicative of a sector zoning.
Quantitative chemical analyses of titanite are reported in Supplementary Material Table S2 and Figure 9a–b. Type ‘unZ’ titanite grains have on average lower TiO2 (35.9±0.7 wt.%) and Fe2O3 (0.34±0.04 wt.%) contents with respect to zoned titanite (TiO2=36.6±0.6 wt.%; Fe2O3=0.39±0.05 wt.%) and higher Al2O3 content (2.5±0.3 vs 2.0±0.3 wt.%; Figure 9a). The CaO content of type ‘Z’ titanite is highly scattered and on average lower (27.8±0.5 wt.%) than the CaO content of unzoned titanite (28.2±0.2 wt.%; Figure 9b). Analogously, fluorine is on average higher for the type ‘unZ’ titanite with respect to type ‘Z’ (0.76±0.07 vs 0.59±0.07 wt.%; Figure 9b).
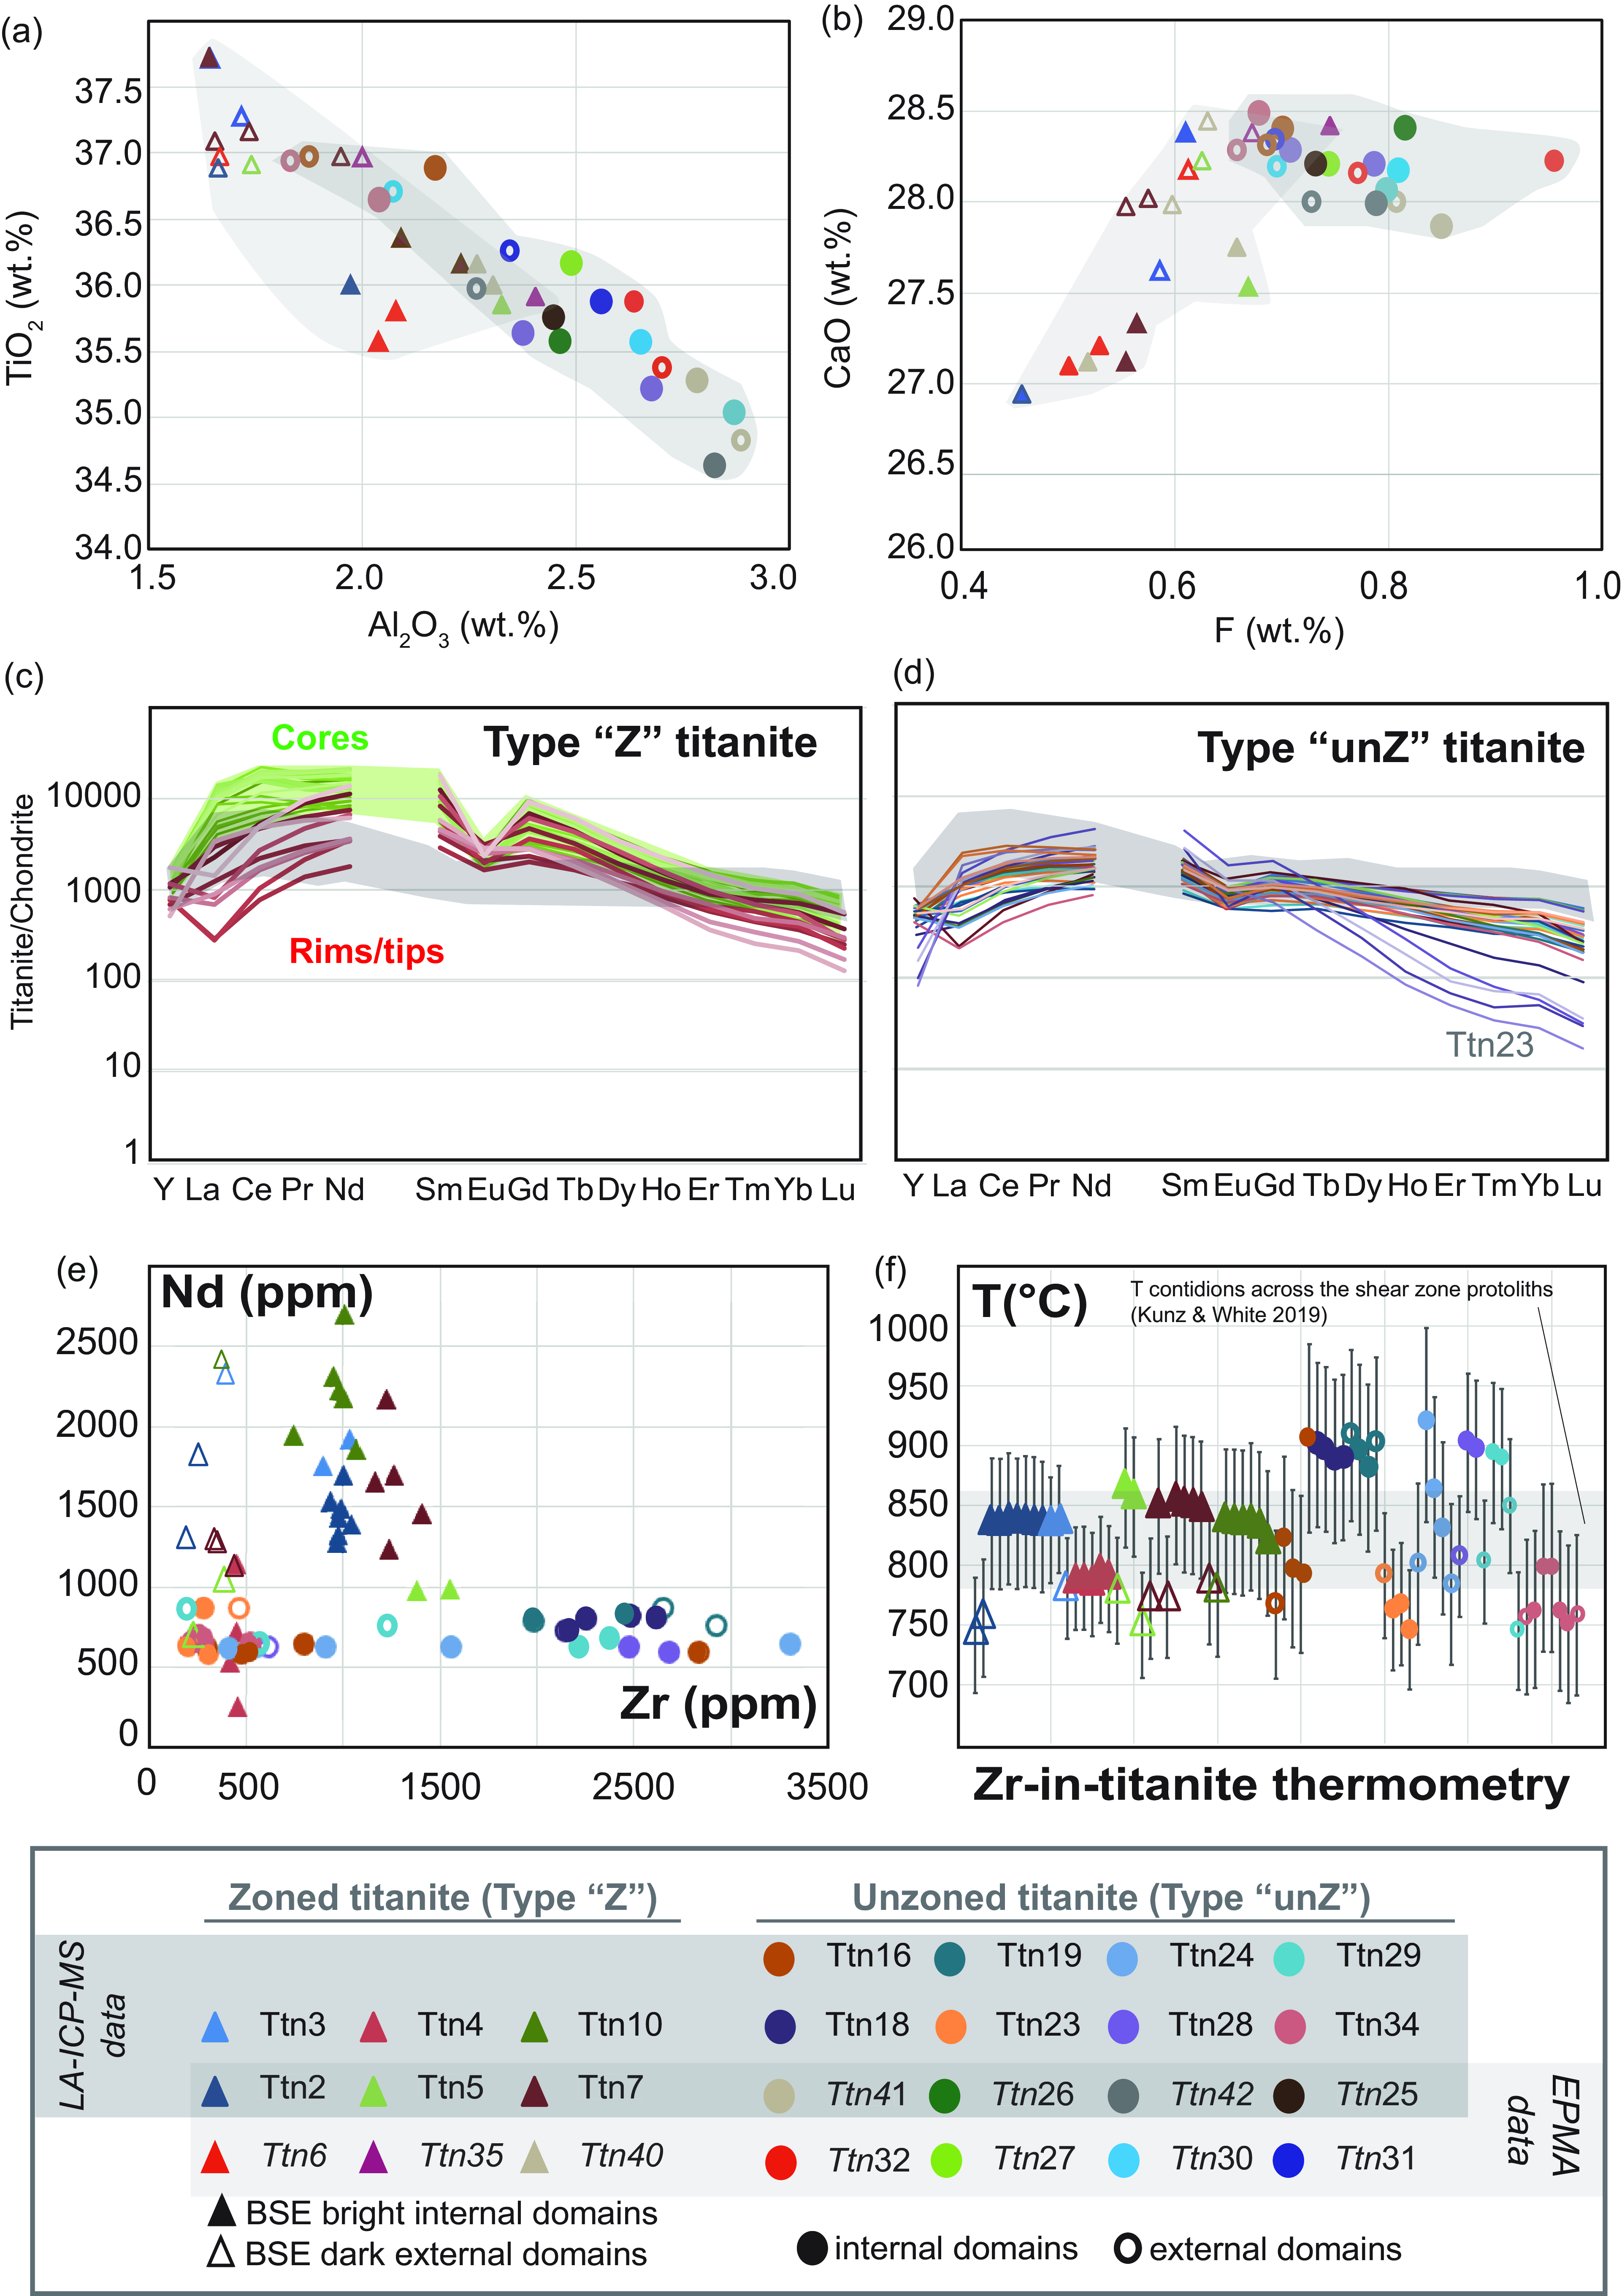
Figure 9. Diagrams of titanite chemistry showing the differences between the two main Types. (a) TiO2 (wt.%) vs Al2O3 (wt.%), (b) CaO (wt.%) vs F (wt.%). The grey areas enclose the data from the two Types. (c) and (d) Chondrite-normalized REE patterns of Type ‘Z’ and ‘unZ’, respectively (chondrite values from McDonough & Sun, Reference McDonough and Sun1995). For comparison, the Chondrite-normalized REE patterns of titanite grains from sheared amphibolite and calc-silicate layers from the Anzola Shear Zone are reported in grey (Corvò et al. Reference Corvò, Maino, Piazolo, Kylander-Clark, Seno and Langone2023). (e) Nd (ppm) vs Zr (ppm), (f) Temperature (°C) estimate according to the Zr-in-titanite thermometry (calibration of Hayden et al. Reference Hayden, Watson and Wark2008). The grey shaded box indicates the Temperature conditions for the regional metamorphism obtained by Kunz & White (Reference Kunz and White2019) with P-T pseudosection calculations for unsheared metabasic and metapelitic rocks at the boundary of the shear zone.
Fourteen titanite grains were analysed for trace element composition confirming significant differences between the two types of titanite (zoned vs unzoned) and from core to rims of zoned titanite grains. The normalized REE patterns reveal that the two different types of titanite show similar trends with LREE fractionated over HREE (Figure 9c–d). This is particularly apparent for type ‘Z’ titanite (Figure 9c), and one type ‘unZ’ grain characterized by a significant depletion of HREE (e.g. Ttn23; Figure 9d). Type ‘Z’ titanite differs also for a more pronounced negative Eu anomaly that is weak or absent for homogeneous titanite (Figure 9c,d). Type ‘Z’ titanite grains are characterized also by a more pronounced intragrain variation of the REE patterns (Figure 9c). Generally, the dark external domains have LREE lower than 10000 times CI whereas the bright inner domains have LREE higher than 10000 times CI (Figure 9c,e).
Zirconium has an opposite trend with respect to REE (Figure 9e) being on average higher within inner domains of type ‘unZ’ homogeneous titanite grains with respect to type ‘Z’ titanite (Zr<1600 ppm). This difference is much more apparent for the dark external domains of type ‘Z’ titanite where Zr is <500 ppm (Figure 9e). The two types of titanite are well distinguishable in terms of Nd contents. The type ‘unZ’ grains are generally poorer in Nd (<1000 ppm) with respect to type ‘Z’ titanite (Figure 9e).
By adopting the Zr-in-titanite thermometer of Hayden et al. (Reference Hayden, Watson and Wark2008), the obtained temperatures range from 741 to 866°C for type ‘Z’ titanite and from 744 to 919°C for type ‘unZ’ titanite. The external domains of both types of titanite are systematically poorer in Zr content and thus provide lower temperatures with respect to the internal domains (Figure 9f). The obtained temperature values overlap the peak temperature conditions estimated from the surrounding metabasite and metapelitic rocks equilibrated under high-grade metamorphic conditions (e.g. Kunz & White, Reference Kunz and White2019; Figure 9f).
6.c. Titanite quantitative orientation data
Seventeen titanite grains were analysed with EBSD; we present four representative grains in terms of deformation and type (type ‘Z’ Figure 10a–d, type ‘unZ’, Figure 10–h). Most of the analysed grains show at least one set of polysynthetic straight to slightly kinked twin lamellae (e.g. Figure 10). The twins have a thickness of about 0.5 μm, cross the grain and terminate against grain boundaries with a disorientation from the host grain by ∼74°/<102> in accordance with previous studies (Timms et al. Reference Timms, Pearce, Erickson, Cavosie, Rae, Wheeler, Wittmann, Ferrièere, Poelchau, Tomioka, Collins, Gulick, Rasmussen and Morgan2019; McGregor et al. Reference Mcgregor, Erickson, Spray and Whitehouse2021; Corvò et al. Reference Corvò, Maino, Piazolo, Kylander-Clark, Seno and Langone2023).
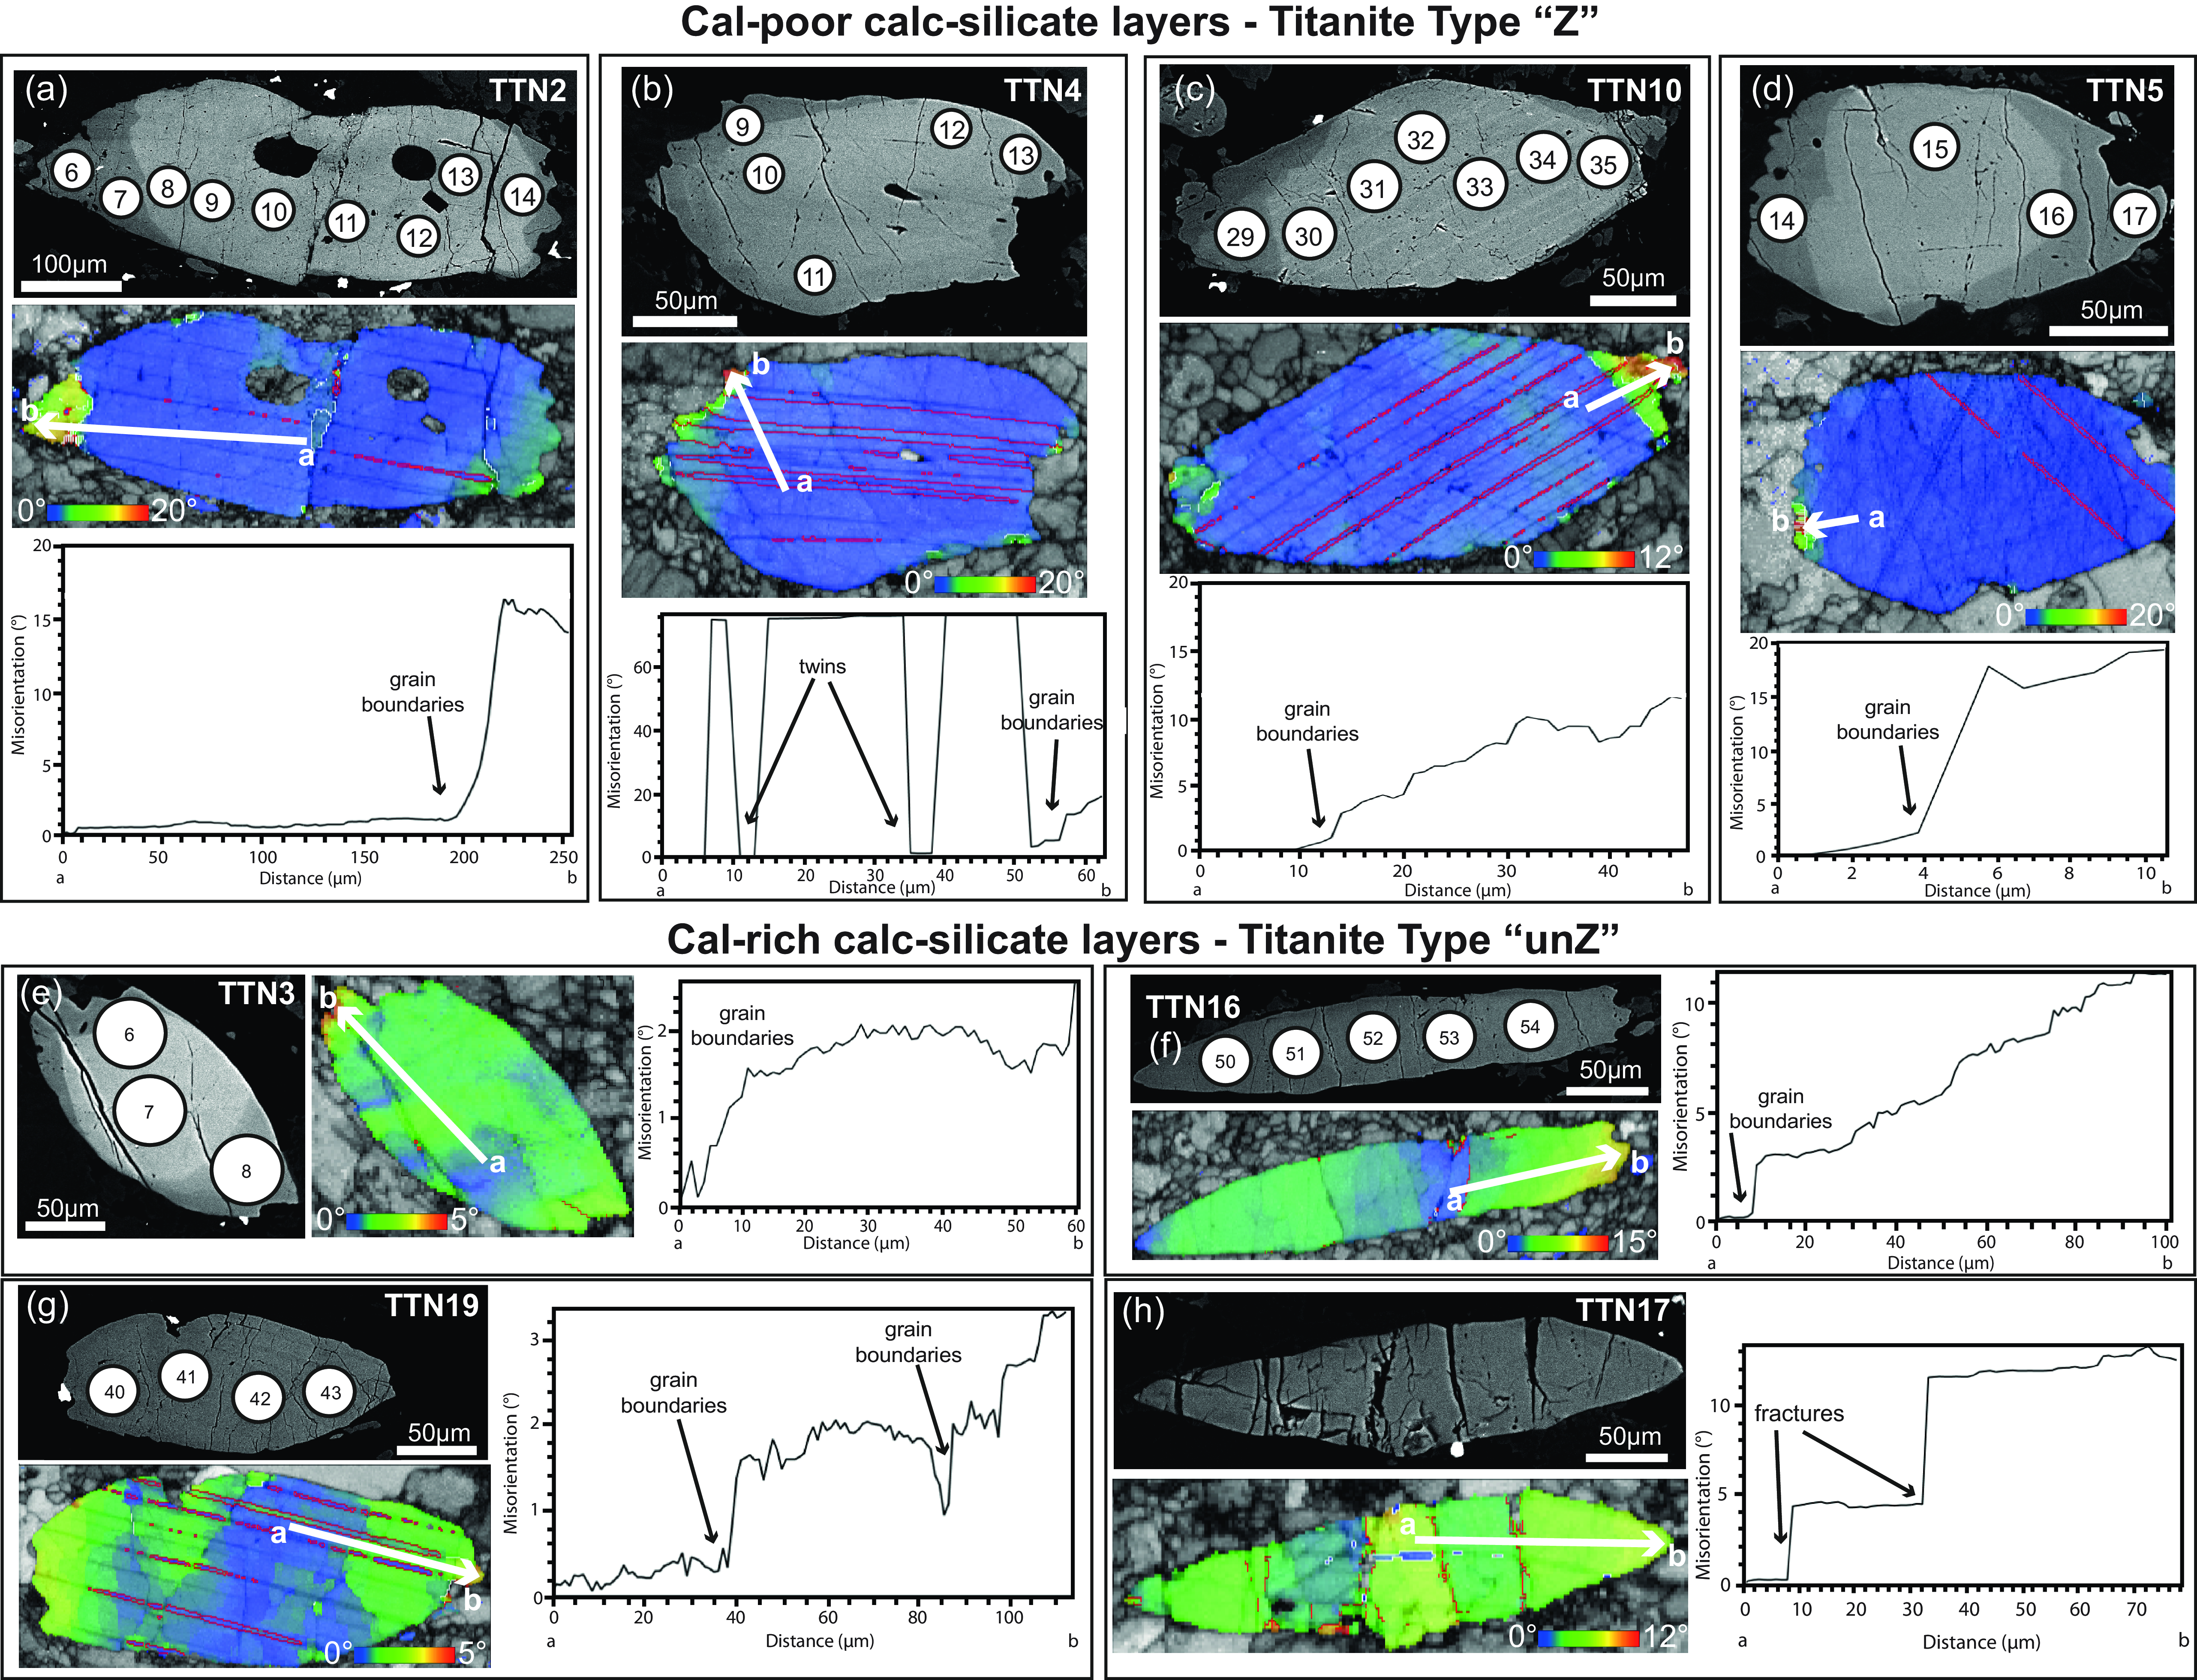
Figure 10. BSE and microstructural features of titanite within calc-silicates (sample VSDO-12R2) in Cal-poor calc-silicates (a-d; Type ‘Z’) layers and Cal-rich calc-silicates (e-h; Type ‘unZ’). Microstructural features are shown as relative crystallographic orientation maps (GROD angle map) and misorientation profile diagrams (from the point ‘a’ to ‘b’, reported in the GROD angle map as white arrow). The numbered white circles on the BSE images represent the LA-ICP-MS spots numbered according to the U–Pb analyses reported in Supplementary Material Table S5. It is interesting to note that there is no overlap between BSE-zoning and increasing distortions. While titanite Type ‘Z’ shows the increase of distortions focused on the rim/tips of the grains, titanite Type ‘unZ’ shows little degree of distortion spread across the whole grain.
While twins are common for the two studied titanite-type grains (‘Z’ and ‘unZ’), the other deformation features differ between them.
Type ‘Z’ titanite shows lattice distortions up to 21° focused to rims/tips (10 grains; ttn2, ttn4, ttn5, ttn7, ttn10, ttn23, ttn24 ttn34, ttn27 and Ttn40; Figure 10a–d), whereas type ‘unZ’ titanite has diffuse and weak (<5°) intracrystalline lattice distortions (six grains; ttn18, ttn19, ttn3, ttn16, ttn25 and ttn26; Figure 10e–h). One exceptional elongated grain (ttn17) exhibits fragmented (domino-like) texture with stepped variation of the distortion angle and minor subgrains (Figure 10h). Quantification of the local dislocation density (measured as Weighted Burgers vector, hereafter WBV) for type ‘Z’ and type ‘unZ’ grains provides average values for laser spot analyses of 0.0043 µm–1 and 0.0018 µm–1, respectively (Table S5, Supplementary Material). Overall, for both titanite types, deformation and orientation changes do not perfectly overlap the chemical zoning.
6.d. Titanite U–Pb dating
A total of 73 petrochronological analyses were performed on 14 grains within a mylonitic calc-silicate (VSDO-12R2B). Results are summarized in Supplementary Material Table S5 and Figure 11. The U–Pb data are dispersed on the Tera-Wasserburg diagram defining a large U–Pb field suggesting ternary mixing between different common Pb values and multiple radiogenic Pb components. In order to interpret the U–Pb data, we looked for alignment of the isotopic data correlated with the textural position, chemistry and/or deformation microstructure (i.e. dislocations density) for each titanite type, namely type ‘Z’ and type ‘unZ’ (Figure 11).
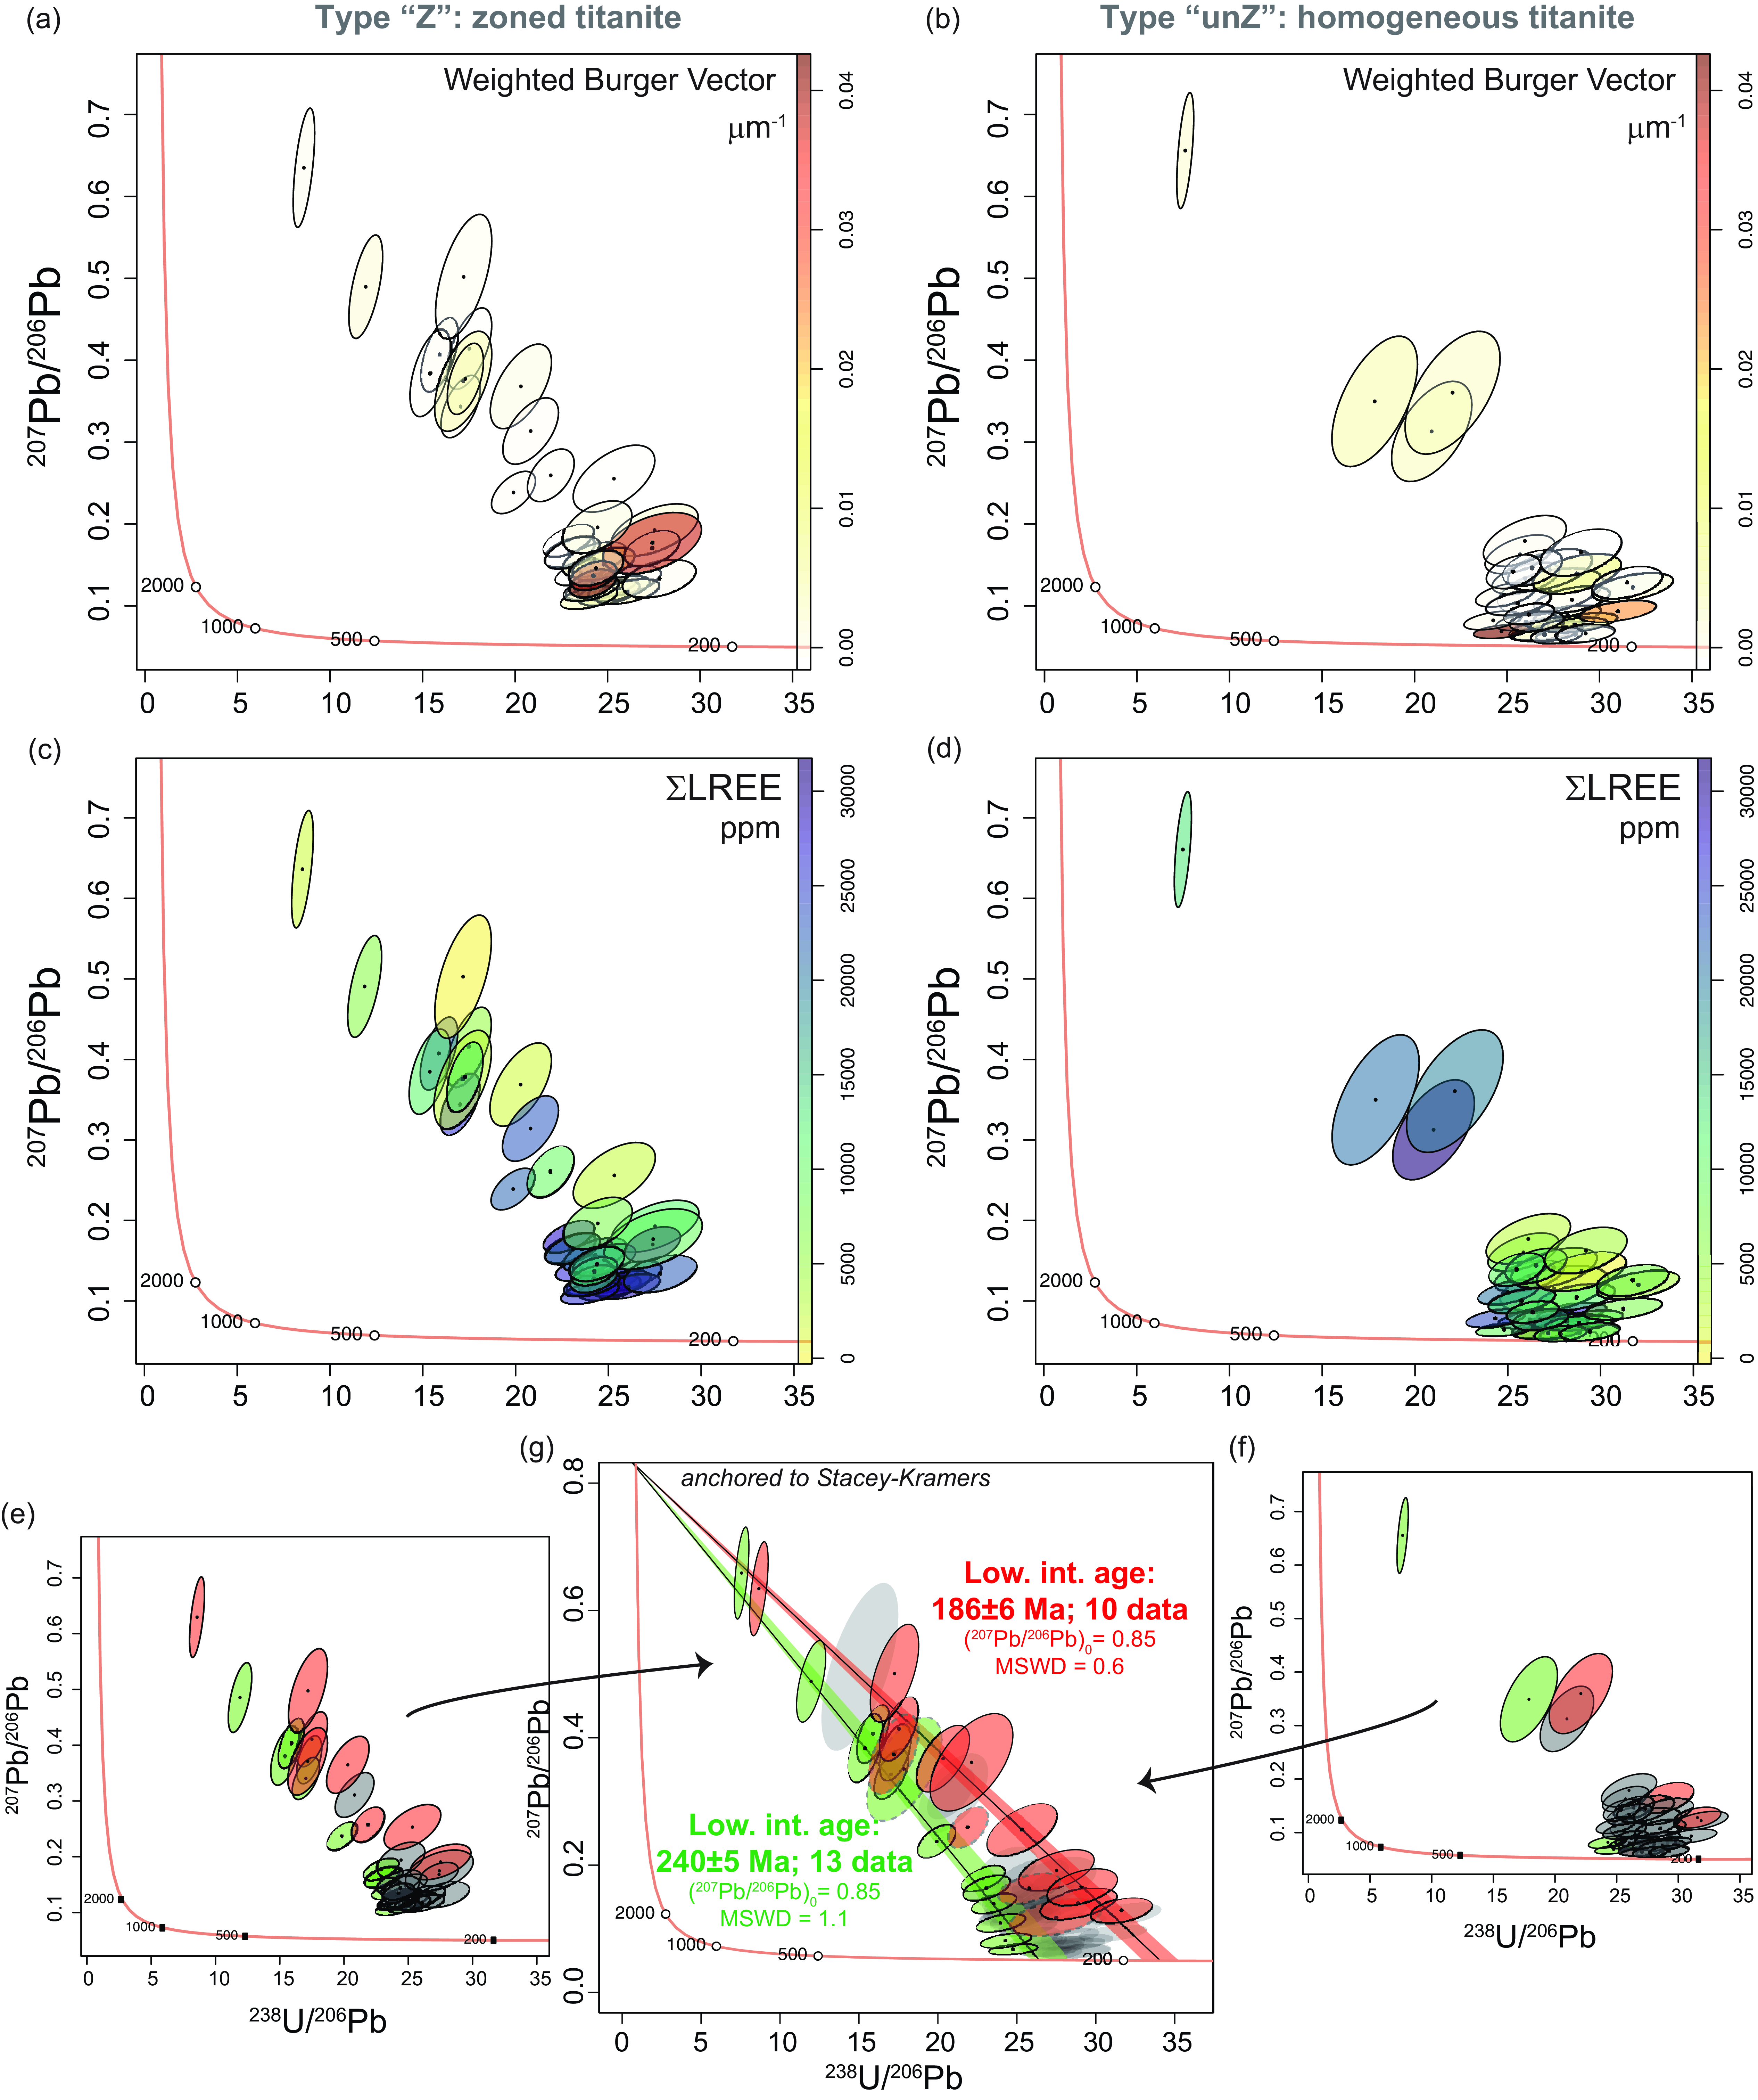
Figure 11. Tera-Wasserburg diagrams of titanite U–Pb data from Type ‘Z’ (a, c, e) and Type ‘unZ’ (b, d, f) from sample VSDO-12R2. Each ellipse represents a U–Pb data point and is coloured as function of: the relative microstructure, defined as the Weighted Burger Vector (a, b); the ΣLREE (c, d) and its position within the grain, i.e. core vs rim (e, f). (g) Cumulative Tera-Wasserburg diagram for both titanite types showing the regression lines anchored to Stacey & Kramers (Reference Stacey and Kramers1975) common Pb ratios considering the U–Pb data from the innermost cores (green filled ellipses) and outermost rims/tips (red filled ellipses) of titanite grains. The relative lower intercept ages are also reported. The data points delimited by a dashed line were not included in the calculation of the intercept ages.
By considering the average dislocation density calculated for each U–Pb analytical spot, no clear correlations are apparent (Figure 11a,b). A weak correlation with ΣLREE and isotopic data is appreciable, especially for zoned titanite (type ‘Z’; Figure 11c). The analytical spots collected from domains richer in LREE are generally located to the left of the data population (Figure 11c,d).
The location of the analysis spots shows a slight systematic in the TW diagram (Figure 11e,f): external domains/tips of both types show a good alignment on the TW defining a lower intercept at 186 ± 6 Ma (Figure 11g). The entire dataset is bounded by another regression line mostly coinciding with the innermost domains of both zoned and homogeneous titanite grains. This regression line has a lower intercept age at 240 ± 5 Ma. The U–Pb data between the two regression lines refer to cores and intermediate positions (Figure 11e–g).
7. Discussion
7.a. Behaviour of monazite as function of the deformation fabric
As shown in the Kernel Density Estimation plots of Figure 12a, the distribution of concordant data of monazite grains within protomylonites ranges broadly from Carboniferous-Permian (52% of the data) to Triassic (48% of the data) with rare Jurassic dates. This spread is partially overlapping the monazite radiometric data from unsheared metamorphic rocks collected along the Valle Strona di Omegna crustal section (Figure 12b; Henk et al. Reference Henk, Franz, Teufel and Oncken1997; Guergouz et al. Reference Guergouz, Martin, Vanderhaeghe, Thébaud and Fiorentini2018; Williams et al. Reference Williams, Kelsey and Rubatto2022; Wyatt et al. Reference Wyatt, Smye, Garber and Hacker2022). Conversely, the distribution of U–Th–Pb concordant data of monazite grains within mylonites is tighter being almost made by Triassic-Jurassic dates (85% of the data; Figure 12a) which are scarce in previous studies of unsheared metamorphic rocks from the same crustal section (Figure 12b).
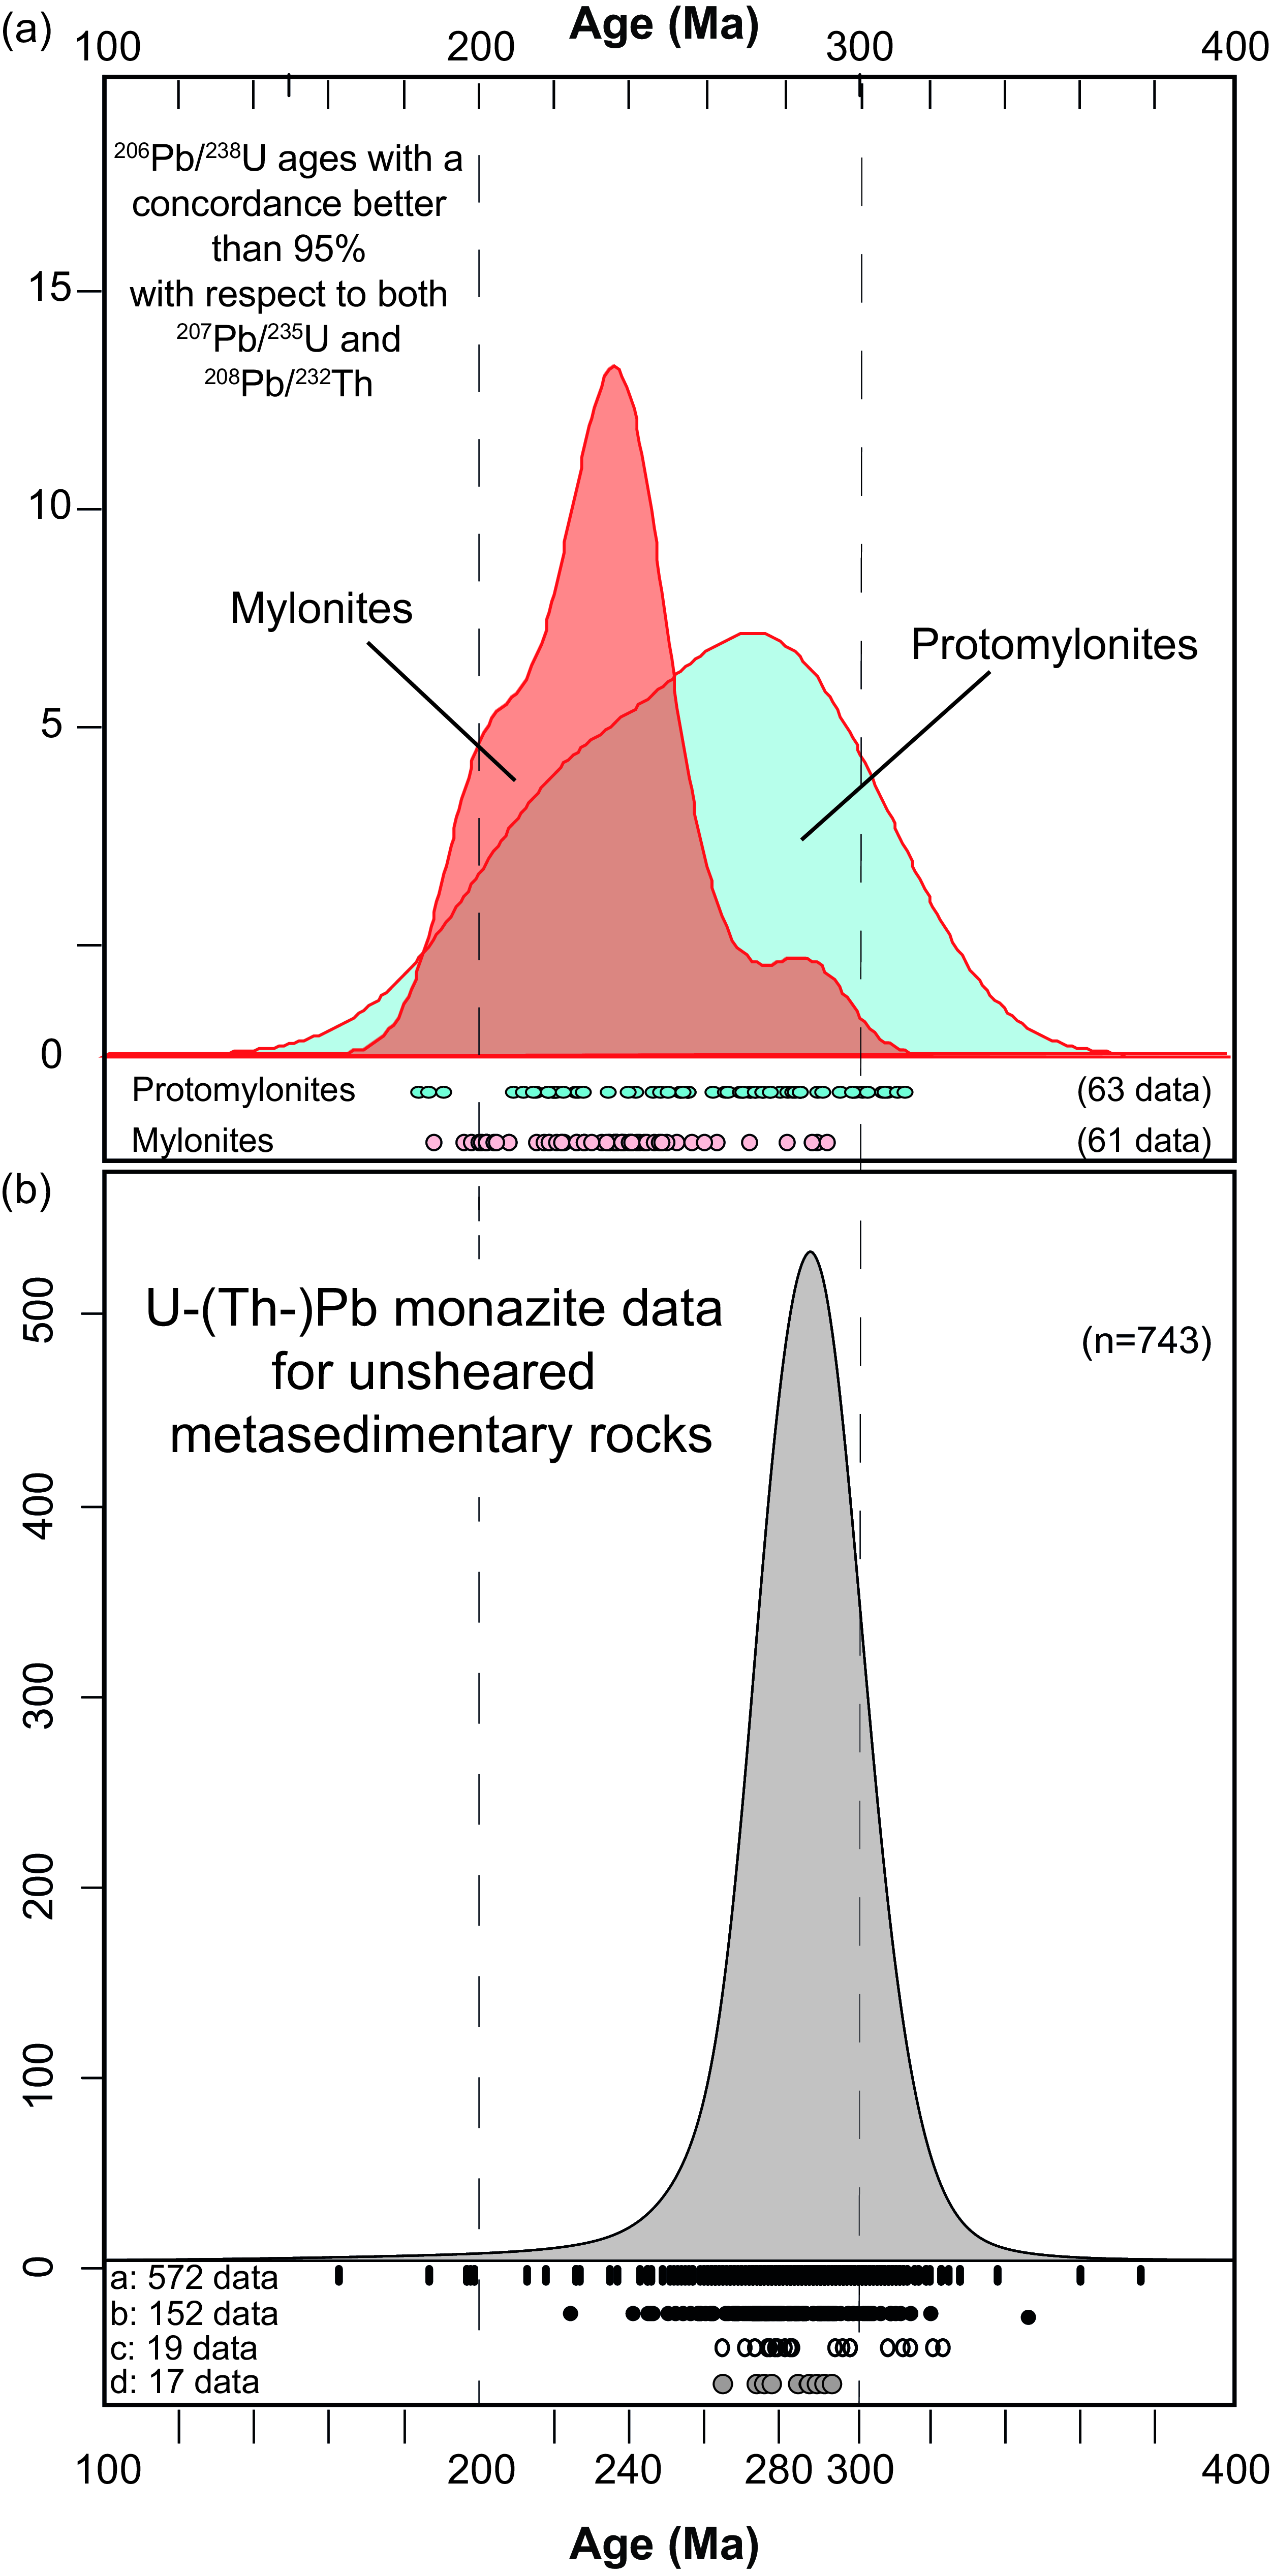
Figure 12. Kernel Density Estimation (KDE) of U–Th–Pb monazite data for sheared (a; this work) and unsheared (b; from literature data) metasedimentary rocks exposed in Val Strona di Omegna. (a) 206Pb/238U monazite dates for mylonitic (reddish-filled KDE curve and data points) and protomylonitic (bluish-filled KDE curve and data points) samples. Data points (small circles below the curve) in (b) refer to: (a)208Pb/232Th monazite dates from amphibolite- to granulite-facies metasediments, after Wyatt et al. (Reference Wyatt, Smye, Garber and Hacker2022); (b) 206Pb/238U corrected monazite dates from amphibolite- to granulite-facies metasediments, after Williams et al. (Reference Williams, Kelsey and Rubatto2022); (c) 207Pb/206Pb monazite data from amphibolite-facies metasediment, after Guergouz et al. (Reference Guergouz, Martin, Vanderhaeghe, Thébaud and Fiorentini2018); (d) monazite U–Pb ages, after Henk et al. (Reference Henk, Franz, Teufel and Oncken1997).
These different distributions of U–Th–Pb concordant data between monazite from protomylonites and mylonites are correlated with textures, microstructure and chemistry (zoning features). Monazite grains from protomylonites have stubby or rounded shapes (low aspect ratio) and are generally larger with respect to monazite from mylonites (Figure 5, Table S6, Supplementary Material). They are generally characterized by large homogeneous cores surrounded by thin rims with lobate boundaries towards the cores (Figure 5). Conversely, within mylonites, monazite grains show higher aspect ratios (highly elongated grains), and chemical zoning revealed more complex features with larger rims/tips over cores or and/or opposite chemical trends from core to rims with respect to monazite from protomylonites (Figure 5). These results are generally consistent with the microstructural results that show a higher degree of distortions strongly localized at the rims/tips of the monazite grains from mylonites with respect to those from protomylonites (Figure 6).
7.b. Presence of three distinct monazite generations
Combining textural features with chemical data, X-ray maps and isotopic data, we recognized three generations of monazite. The main features of the three different generations are schematized in Figure 13a.
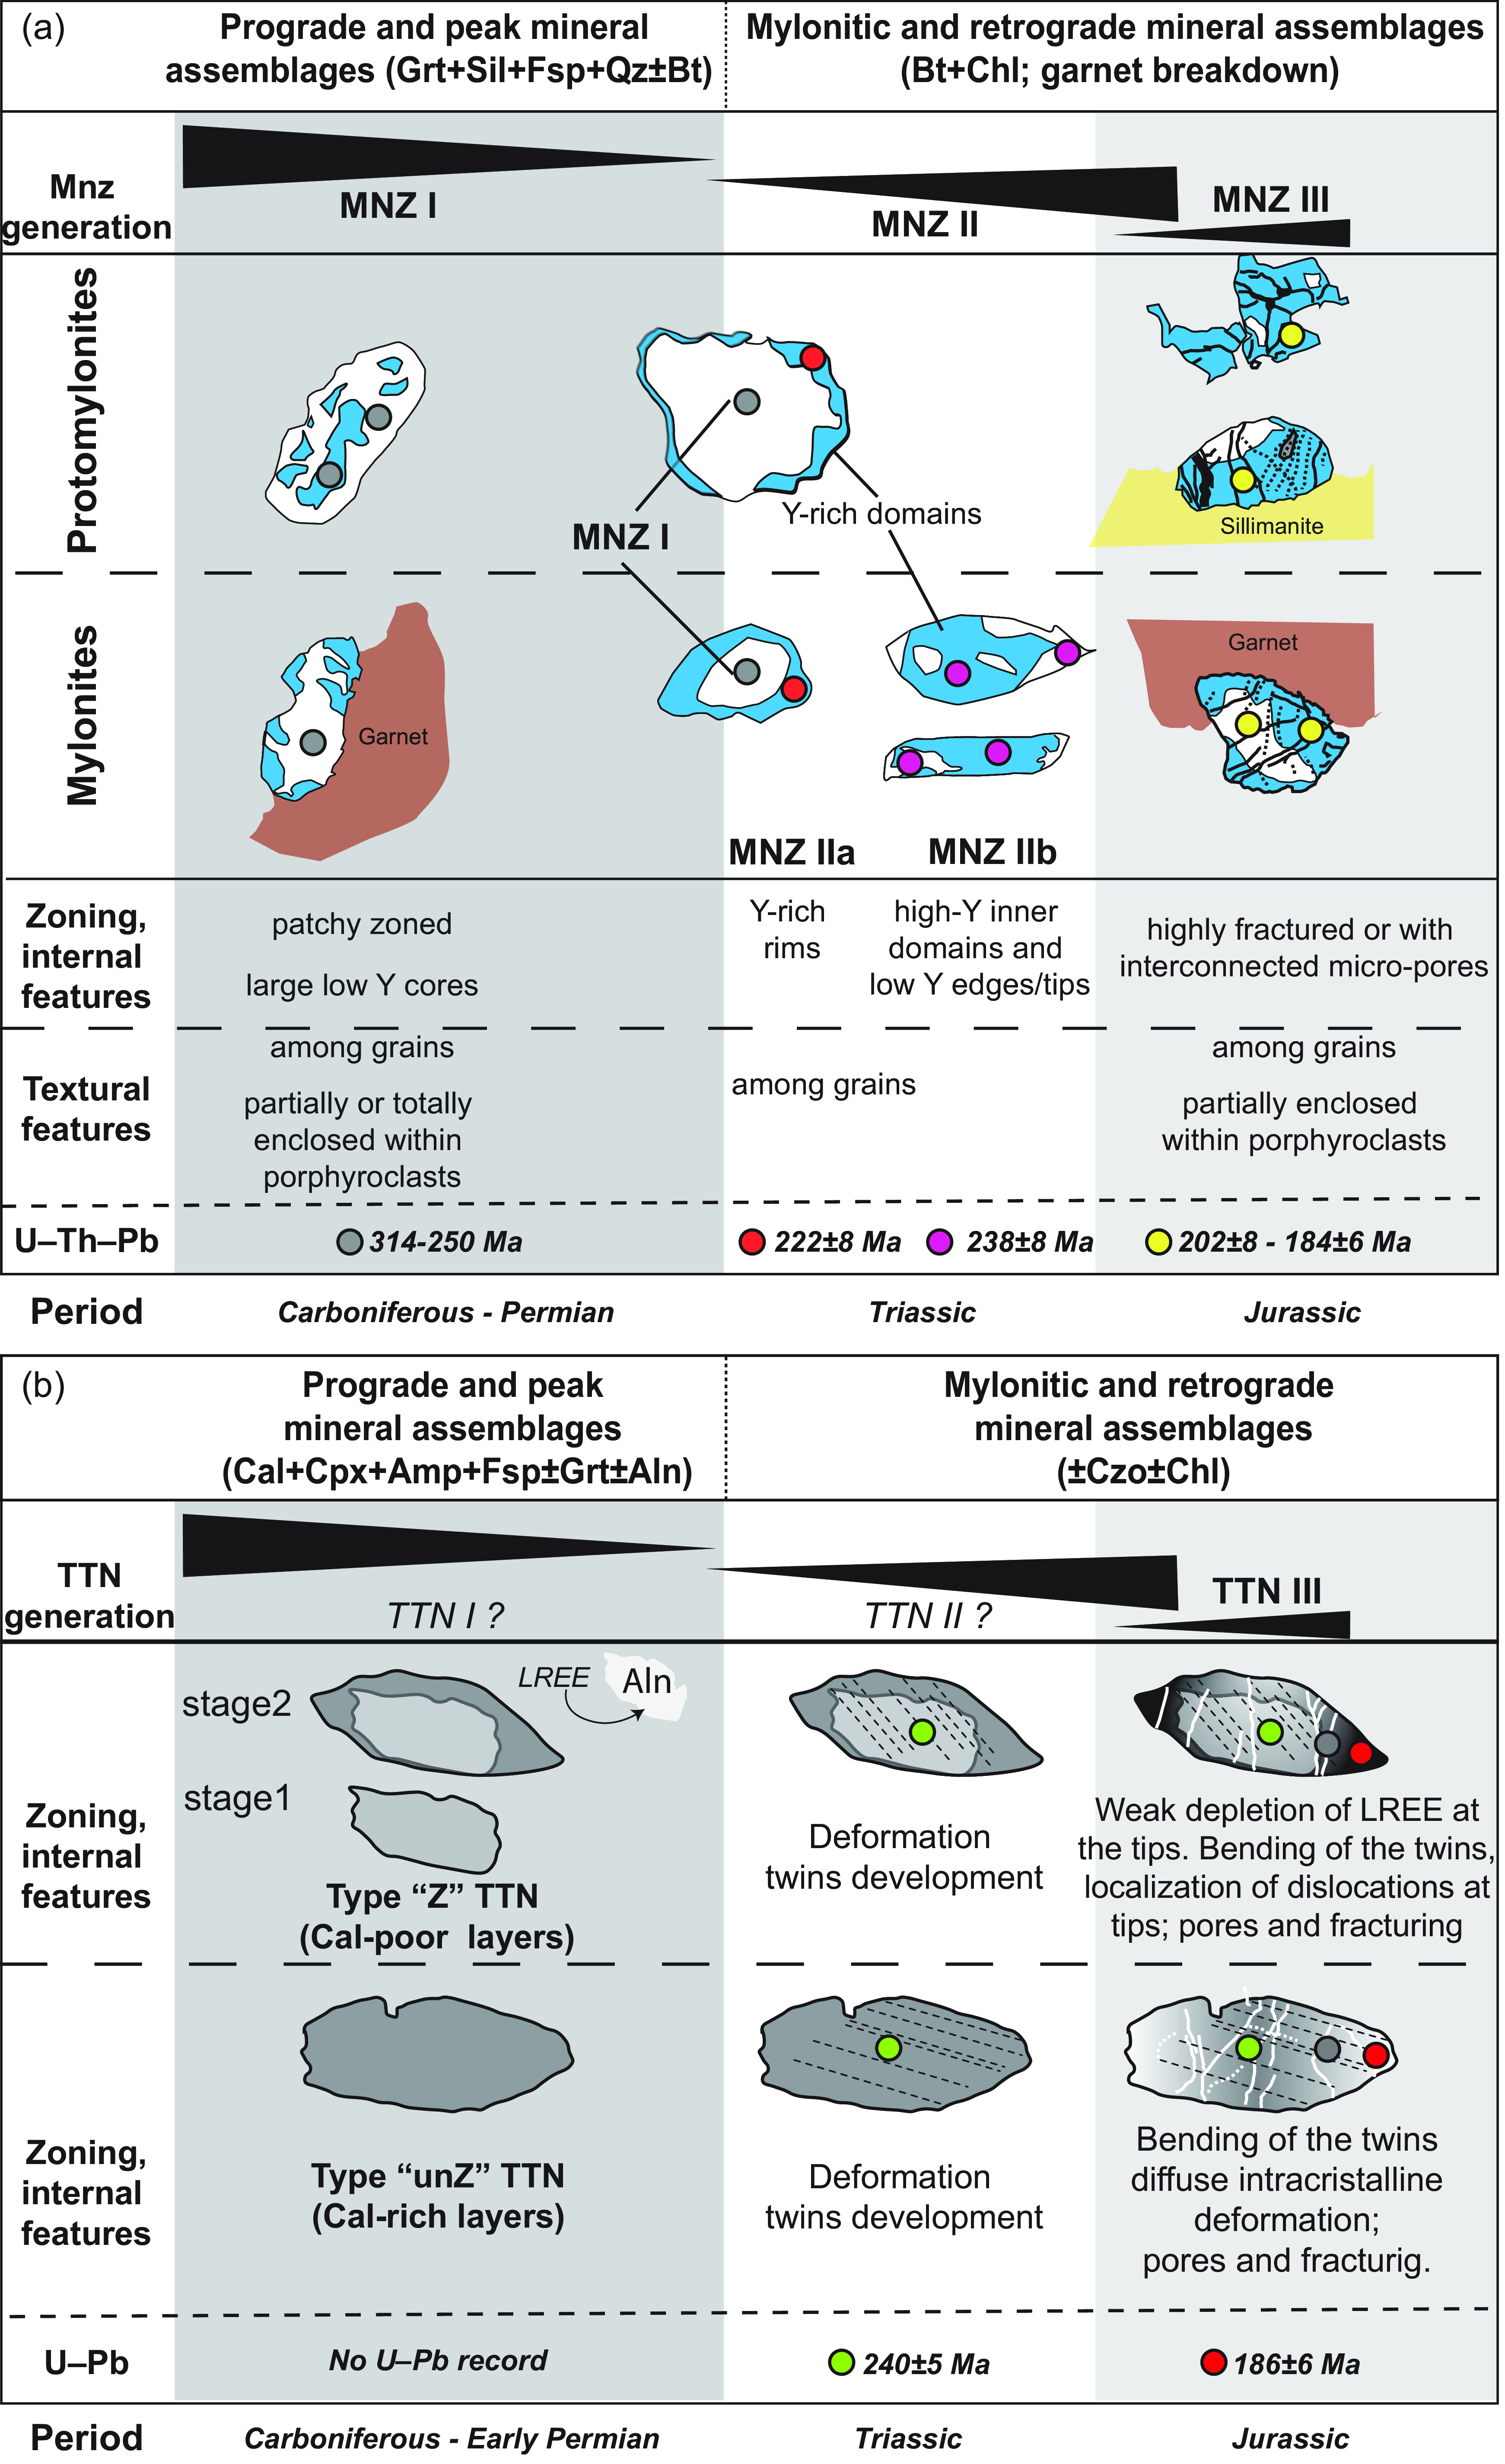
Figure 13. Synoptic summary of different generations of monazite (a) within protomylonitic and mylonitic paragneisses and titanite (b) within mylonitic calc-silicates. For each generation, the main microstructures, chemical zoning features and U–Pb data are reported as well as the main mineral assemblages.
The first generation of monazite (MNZI) is defined by grains partially or totally included within garnet porphyroclasts (shielding effect) and domains of monazite occurring along the foliation. MNZI grains/domains are more abundant within protomylonites (Figure 7,13a) and are associated with Carboniferous-Permian concordant dates (314–250 Ma). Monazite grains from mylonites partially enclosed within garnet were also able to locally preserve old dates but often discordant (e.g. Janots et al. Reference Janots, Engi, Berger, Allaz, Schwarz and Spandler2008). The preservation of old dates within the foliation is a common feature of sheared rocks (e.g. Langone et al. Reference Langone, Braga, Massonne and Tiepolo2011) and highlights the heterogeneous behaviour of monazite (or more generally of geochronometers) as a function of the hosting microdomain and shear partitioning. MNZI grains/domains are generally characterized by patchy zoning of both Th and Y and/or cores poorer in Y with respect to the rims/ external domains. The patchy zoning of both Th and Y is probably the result of an aggregation of small monazite grains in lower-amphibolite-facies rock, pseudomorph after (probable) allanite (e.g. Skrzypek et al. Reference Skrzypek, Kato, Kawakami, Sakata, Hattori, Hirata and Ikeda2018; Williams et al. Reference Williams, Kelsey, Baggs, Hand and Alessio2018). The low-Y cores of MNZI grains lying along the foliation or in contact with matrix-forming minerals (Figure 13a) formed likely during or after garnet growth that is able to fractionate Y as well as HREE (e.g. Rubatto et al. Reference Rubatto, Hermann and Buick2006; Taylor et al. Reference Taylor, Clark, Fitzsimons, Santosh, Hand, Evans and Mcdonald2014).
The second generation of monazite (MNZII) refers to rims/domains with higher Y concentrations (MNZIIa, Figure 13a) with respect to cores or adjacent domains (i.e. MNZI). MNZIIa domains are characterized by lobate, inward-penetrating shapes with sharp contact with the inner domains suggesting the migration of a reaction front. These features have been suggested as criteria to identify the Coupled Dissolution-Precipitation process (CDP; Putnis et al. Reference Putnis, Janssen, Jamtveit and Putnis2009; Harlov et al. Reference Harlov, Wirth and Hetherington2011; Varga et al. Reference Varga, Raimondo, Daczko and Adam2020) and have been attributed to the inward progression of fluids/melts changing chemistry and or isotopic record (Putnis et al. Reference Putnis, Janssen, Jamtveit and Putnis2009; Weinberg et al. Reference Weinberg, Wolfram, Nebel, Hasalová, Závada, Kylander-Clark and Becchio2020; Varga et al. Reference Varga, Raimondo, Daczko and Adam2020). MNZIIa rims/domains are common within protomylonites but are more developed within mylonitic samples where they can be the 2/3 of the grain (Figure 5,7,13a). The isotopic data relative to the MNZIIa define a Triassic cluster of concordant dates (weighted average of 222 ± 8 Ma). The second generation of monazite is not only restricted to domains of replacement but also is seen as whole grains with elongated shapes (high aspect ratio) and high-Y content almost homogeneously distributed along the grain or with low-Y ‘tips’ (MNZIIb on Figure 13a). Monazite grains with these features were observed exclusively within mylonites and provided Triassic dates (weighted average of 238 ± 8 Ma; Figure 7, 13a). The internal, external and isotopic features suggest a syn-kinematic development of MNZIIb grains/domains whose ages are related to a specific tectonic event (e.g. Williams & Jercinovic, Reference Williams and Jercinovic2002). The observed textural and internal features suggest that the Y-rich MNZIIb grains are probably the result of a more pervasive CDP process that, as well as for MNZIIa, may reflect a period of monazite formation coevally with the breakdown of garnet (releasing Y). The higher proportion of MNZII over MNZI within mylonites is correlated with a more intense garnet break-down (Figure 13a) as documented by grain-size reduction and shaping of garnet becoming smaller, elliptic or rounded. The Y released during garnet break-down is thus incorporated within the external domains (MNZIIa) and/or grains (MNZIIb) of monazite formed by CDP.
The last generation of monazite (MNZIII) is defined by a few grains/domains providing mostly Jurassic concordant dates (nine data; dates ranging from 202±8 to 184±6 Ma; Figure 13a). MNZIII grains/domains were observed mainly within protomylonites (e.g. Mnz4a, VSDO-13B1; Mnz6c, VSDO-13A1; Mnz8c, VSDO-13A2; Figure 5 and Figure S1) and rarely within mylonites (Mnz9, VSDO-13M1 in Figure S1; Figure 13a). MNZIII is mostly defined by small, isolated grains occurring as satellites around larger grains and by domains of grains characterized by (i) numerous fractures and/or (ii) anhedral shapes and/or (iii) numerous pores. The relatively large spread of dates and the presence of interconnected nano- and micro-porosity, as well as fractures, are markers that can indicate a late interaction with fluid (e.g. Harlov et al. Reference Harlov, Wirth and Hetherington2011) and/or a partial replacement of monazite by a nanomixture of the different monazite generations (e.g. Grand’Homme et al. Reference Grand’homme, Janots, Seydoux-Guillaume, Guillaume, Bosse and Magnin2016; Hentschel et al. Reference Hentschel, Janots, Trepmann, Magnin and Lanari2020).
The observed generations of monazite do not show well-defined age clusters being the concordant U–Th–Pb smeared from Carboniferous to Jurassic (Figure 7, 12a). This is more apparent for protomylonitic samples. In order to explain this continuous distribution of the concordant U–Th–Pb data, two possible phenomena can be argued: (i) the physical mixing of domains with different ages within the grain and/or (ii) the partial resetting of monazite during subsequent events. Weinberg et al. (Reference Weinberg, Wolfram, Nebel, Hasalová, Závada, Kylander-Clark and Becchio2020) studied monazite in migmatites and suggested that the physical mixing had no influence on the age spread that was mainly controlled by the fact that the radiogenic Pb was not completely removed during the CDP reactions occurred during the younger events (Seydoux-Guillaume et al. Reference Seydoux-Guillaume, Goncalves, Wirth and Deutsch2003). Therefore, we here interpret the observed dates distribution within sheared rocks as reflecting inheritance from the regional HT metamorphism (MNZI), the development of syn-shearing domains/grains by CDP during Triassic (MNZII, 238±8 – 222±8 Ma), the late alteration of monazite grains/domains (MNZIII) during Jurassic by interaction with fluids locally promoted by intracrystalline deformation.
7.c. Titanite heterogeneity controlled by the local environment
Two types of titanite were recognized within the calc-silicate sample: (i) titanite characterized by an apparent zoning, higher REE content and lying mostly within calcite-poor layers (type ‘Z’ titanite); (ii) homogeneous titanite with lower REE contents and occurring preferentially within calcite-rich layers (type ‘unZ’ titanite). The main features of the two titanite types are schematized in Figure 13b.
The occurrence of these two distinct types of titanite within the same thin-section suggests that the calc-silicate sample is made of different protoliths, i.e. siliciclastic/volcanoclastic and carbonate/marl (Figure 13b). The same observation has been recently made by Corvò et al. (Reference Corvò, Maino, Piazolo, Seno and Langone2022, Reference Corvò, Maino, Piazolo, Kylander-Clark, Seno and Langone2023) for titanite within mylonitic rocks from the Anzola Shear Zone from the adjacent Ossola valley (Figure 1a). In these rocks, the chemistry of titanite together with the mineral assemblages suggests the presence of alternating layers made of amphibolites and calc-silicates, i.e. former siliciclastic/volcanoclastic and carbonate/marl layers, respectively.
The local environment exerted a fundamental role also on the deformation features recorded by titanite (Figure 13b). While deformation twinning is common for both ‘Z’ and ‘unZ’ types, titanite grains from calcite-poor portions (type ‘Z’) show higher lattice distortions (up to 21°) focused on rims/tips with respect to ‘unZ’ titanite from calcite-rich portions. A similar correlation between microstructure and the composition of the microdomain hosting titanite has been described for the banded (amphibolites – calc-silicates) mylonites of the Anzola Shear Zone exposed in the adjacent Ossola valley (Figure 1a; Corvò et al. Reference Corvò, Maino, Piazolo, Kylander-Clark, Seno and Langone2023).
7.d. Petrogenesis of titanite vs U–Pb record: a decoupling between chemistry and isotopes
Figure 13b summarizes the suggested petrogenetic evolution of titanite as well as the observed microstructures and the isotopic record. Titanite is occurring within the matrix and is also included within clinopyroxene porphyroclasts (Figure 8h). In both cases, it shows the same zoning and chemical features. These observations suggest that titanite formed at least coevally with the peak metamorphic assemblage during the Permian high-temperature regional metamorphism. Since the occurrence of sphene in metamorphic rocks is strongly controlled by bulk composition (Frost et al. Reference Frost, Chamberlain and Schumacher2001), the composite nature of our sample, i.e. former siliciclastic/volcanoclastic and carbonate/marl layers, would imply different metamorphic reactions for the formation of titanite. According to the phase relations diagram for calcite-bearing rocks, titanite could be produced and stable at high temperatures and X(H2O) conditions during regional metamorphism by reactions involving calcite, quartz and rutile ± clino/zoisite (e.g. Frost et al. Reference Frost, Chamberlain and Schumacher2001; Kohn, Reference Kohn2017). Within the silicate-rich layers, the formation of titanite during metamorphism needs further reactants such as chlorite, clinopyroxene, amphibole, plagioclase and ilmenite (e.g. Frost et al. Reference Frost, Chamberlain and Schumacher2001; Kohn, Reference Kohn2017). The reactions involving the above-mentioned reactants may explain the formation of titanite observed within both calcite-poor and calcite-rich domains of the studied sample during the HT regional metamorphism. The apparent zoning consisting of a depletion of LREE, Y and Zr in the external portions of type ‘Z’ titanite can be explained by two alternative processes. This feature is compatible with the occurrence of large allanite (LREE-rich epidote) grains grown almost coevally with titanite within the silicate-rich layers (Figure 3g). Alternatively, the LREE depletion of the external domains for titanite could be related by the occurrence of clinozoisite developed during deformation (Figure 3h). The lack of an apparent zoning within type ‘unZ’ titanite and the occurrence of clinozoisite within both layers suggest that the observed zoning is a primary feature due to the formation of allanite almost coevally with titanite (stage 2 on Figure 13b).
The pre-shear mineral assemblages of both calcite-poor and calcite-rich layers contain garnet. The observed REE pattern for titanite may be useful to unravel the genetic relationships between garnet and titanite. The lack of a significant and general HREE fractionation for the analysed titanite grains (Figure 9c,d) indicates that titanite probably predates garnet formation. Alternatively, the possible HREE fractionation exerted by garnet coeval or predating titanite is extremely local (e.g. Ttn23, Figure 9d). According to the P-T-X(CO2) modelling of Rapa et al. (Reference Rapa, Groppo, Rolfo, Petrelli, Mosca and Perugini2017) for both calcite-poor and calcite-rich domains of calc-silicates from Himalaya, different episodes of titanite growth are predicted before the formation of garnet-bearing assemblages. These observations are more compatible with our first hypothesis of a garnet postdating titanite. Summarizing, the observed titanite grains are the result of different metamorphic reactions, as a function of the hosting microdomains, producing allanite almost coevally with titanite (stage 2 on Figure 13b) and predating garnet during regional HT metamorphism. This petrogenetic reconstruction is coherent with the Zr-in-titanite temperature estimates obtained for the internal domains of titanite indicating high-temperature conditions (919 ± 82 – 746 ± 50°C). These temperatures overlap, or are even higher than, the peak temperatures estimated from the adjacent mafic and pelitic metamorphic rocks (Figure 9; Kunz & White, Reference Kunz and White2019). Even though the titanite rims provided lower temperature with respect to the cores (850 ± 57 – 741 ± 49°C), these remain still significantly higher with respect to the qualitative (syn-kinematic mineral assemblages suggest epidote-bearing amphibolite-facies conditions) and quantitative estimates of temperature conditions of deformation (<700°C; Simonetti et al. Reference Simonetti, Langone, Bonazzi, Corvò and Maino2023).
Contrarily to monazite showing three distinct generations it has not been possible to define different generations for titanite combining U–Pb isotopes with chemistry and microstructures (Figure 13b). The U–Pb data obtained from titanite are bounded by two regression lines with lower intercept ages at 240±5 and 186±6 Ma (Figure 11, 13b). These two regression lines are correlated with textural position being the oldest related to the cores and the youngest linked to the rims/tips of titanite. The time interval framed by the two regression lines does not fit with (postdate) the main peaks of the Permian regional high-temperature metamorphism that has been constrained, in extreme detail, with zircon (Ewing et al. Reference Ewing, Hermann and Rubatto2013; Kunz et al. Reference Kunz, Regis and Engi2018), monazite (Williams et al. Reference Williams, Kelsey and Rubatto2022; Wyatt et al. Reference Wyatt, Smye, Garber and Hacker2022) and garnet (Connop et al. Reference Connop, Smye, Garber, Moser, Caddick and Vervoort2024; Bartoli et al. Reference Bartoli, Millonig, Carvalho, Marschall and Gerdes2024) along the same crustal section (Figure 12b).
The oldest possible intercept age from the innermost portion of titanite grains points to Triassic (TTNII? in Figure 13b) indicating that this accessory mineral was not able to clearly retain the age of crystallisation (TTNI? in Figure 13b). The Triassic lower intercept age obtained from the innermost titanite domains could thus reflect: (i) the crystallization/cooling age or (ii) a total reset of the isotopic system within a pre-existing grain. As discussed above, titanite formed during the Permiam regional metamorphism, coevally with the first generation of monazite (MNZI in Figure 13a), therefore, the first hypothesis is unlikely. The studied crustal levels experienced high-temperature conditions for a long-time interval causing a spread of the zircon (Ewing et al. Reference Ewing, Hermann and Rubatto2013; Kunz et al. Reference Kunz, Regis and Engi2018) and monazite ages (Williams et al. Reference Williams, Kelsey and Rubatto2022; Wyatt et al. Reference Wyatt, Smye, Garber and Hacker2022). At these temperatures, the U–Pb system of zircon and monazite was partially reset, whereas within titanite, it was completely open until the Triassic. Alternatively, a Triassic event caused a total reset of the titanite U–Pb record. The U–Pb data distribution strongly correlated with the position within the grain of titanite could reflect a volume diffusion process enhanced by deformation twins (e.g. Bonamici et al. Reference Bonamici, Fanning, Kozdon, Fournelle and Valley2015; Moser et al. Reference Moser, Hacker, Gehrels, Seward, Kylander-Clark and Garber2022; Corvò et al. Reference Corvò, Maino, Piazolo, Kylander-Clark, Seno and Langone2023; Kavanagh-Lepage et al. Reference Kavanagh-Lepage, Gervais, Larson, Graziani and Moukhsil2023) that are common features of both titanite types (Figure 13b). At the high-temperature stage of shearing, the development of deformation twins promoted the evacuation of the radiogenic ions (e.g. Kavanagh-Lepage et al. Reference Kavanagh-Lepage, Gervais, Larson, Graziani and Moukhsil2023). The oldest lower intercept age obtained from the inner portions of titanite is partially overlapping the age of syn-kinematic monazite (i.e. MNZII: 222±8 and 238±8 Ma). This observation supports the alternative interpretation of the old lower intercept age marks the beginning of deformation. The U–Pb lower intercept age obtained from the external domains (rims/tips) partially showing evidence for intracrystalline deformation (localized higher dislocation density) of both titanite types (TTNIII in Figure 13b) may thus reflect the end of volume diffusive loss of Pb and a localized deformation-induced isotopic reset (Stearns et al. Reference Stearns, Hacker, Ratschbacher, Rutte and Kylander-Clark2015; Moser et al. Reference Moser, Hacker, Gehrels, Seward, Kylander-Clark and Garber2022). Recently, Corvò et al. (Reference Corvò, Maino, Piazolo, Kylander-Clark, Seno and Langone2023) reported the same interpretation for titanite grains within the Anzola Shear Zone, which can be considered as the NE prolongation of the shear zone studied in this work.
In summary, titanite preserved the internal features (chemistry and zoning) from the Permian regional metamorphic event while the U–Pb data have no memory of it, recording mostly the deformation-induced resetting and volume diffusion. Several authors have recently described similar features studying titanite in sheared rocks (Kavanagh-Lepage et al. Reference Kavanagh-Lepage, Gervais, Larson, Graziani and Moukhsil2023; Corvò et al. Reference Corvò, Maino, Piazolo, Kylander-Clark, Seno and Langone2023): deformation influenced the U–Pb system without promoting significant modification of titanite chemistry (geochemical decoupling).
7.e. Complementary behaviour of monazite and titanite
Combining the chemical, isotopic and microstructural features, we recognized a contrasting behaviour of monazite and titanite that likely provided complementary information (Figure 11–13). The former experienced an intense reactivity (CDP) during Triassic with the involvement of garnet (e.g. Y-enriched rims/domains/grains; MNZII on Figure 13a). Locally, it developed internal features (chemistry, fractures and pores) suggesting a fluid-assisted phase of isotopic perturbance during Jurassic (MNZIII on Figure 13a). Monazite was also able to substantially preserve the age information relative to the prograde HT metamorphism, resulting thus partially resilient to the subsequent deformation events (MNZI on Figure 13a).
Titanite on the contrary was almost chemically unreactive during deformation preserving the zoning features developed during the prograde metamorphism (chemical resiliency). On the other hand, titanite has not retained the age of the Permian HT metamorphism (TTNI? on Figure 13b), as documented by monazite in this work and from literature (Bartoli et al. Reference Bartoli, Millonig, Carvalho, Marschall and Gerdes2024; Connop et al. Reference Connop, Smye, Garber, Moser, Caddick and Vervoort2024; Wyatt et al. Reference Wyatt, Smye, Garber and Hacker2022; Williams et al. Reference Williams, Kelsey and Rubatto2022; Henk et al. Reference Henk, Franz, Teufel and Oncken1997). A similar decoupling between chemistry and U–Pb isotopic data has been already described for titanite in amphibolite and calc-silicate (Holder & Hacker, Reference Holder and Hacker2019; Kavanagh-Lepage et al. Reference Kavanagh-Lepage, Gervais, Larson, Graziani and Moukhsil2023; Corvò et al. Reference Corvò, Maino, Piazolo, Kylander-Clark, Seno and Langone2023). Titanite demonstrated a more pronounced intracrystalline deformation, with respect to monazite, as documented by deformation twins across the grains and the localization of dislocations at rims/tips. These features could be responsible for the observed decoupling, allowing more efficiently the mobility of U and Pb isotopes (along the dislocation boundaries, e.g. Bonamici et al. Reference Bonamici, Fanning, Kozdon, Fournelle and Valley2015) with respect to the other trace elements. Moreover, in the presence of abundant silicates surrounding titanite, the deformation at the rim/tips is generally more intense, and thus, the U–Pb data of these domains might reflect both volume diffusion and recrystallization.
Combining the complementary information from the two investigated geochronometers and thanks to their different behaviour during shearing, it has been possible to reconstruct the timing of the shear zone activity otherwise only partially recorded.
7.f. Regional implications: rift-related shear zone activity from Middle Triassic (Ladinian) to Early Jurassic (Sinemurian)
The Forno-Rosarolo shear zone developed within metasedimentary rocks characterized by metamorphic conditions at the transition between granulite and amphibolite facies (Redler et al. Reference Redler, Johnson, White and Kunz2012; Kunz et al. Reference Kunz, Johnson, White and Redler2014; Kunz & White, Reference Kunz and White2019; Simonetti et al. Reference Simonetti, Langone, Bonazzi, Corvò and Maino2023). Deformation overprinted mainly paragneisses and metabasites, which experienced extensive partial melting during Permian time. Petrographic and microstructural observations on mylonitic paragneisses suggest that deformation developed under amphibolite-facies conditions (∼650°C and ∼0.55GPa; Simonetti et al. Reference Simonetti, Langone, Bonazzi, Corvò and Maino2023). The rare occurrence of chlorite at the expense of biotite and the sillimanite replacement by white mica indicate that mylonites were poorly affected by green-schist retrograde overprint (Simonetti et al. Reference Simonetti, Langone, Bonazzi, Corvò and Maino2023).
Integrating the U–Th–Pb data with textural, microstructural and chemical features of monazite, the activity of the shear zone can be constrained from two monazite generations. The main one, MNZII, documents the amphibolite-facies ductile shearing with the formation of tiny, syn-kinematic Y-rich monazite grains (238±8 Ma) and Y-rich rims (222±8 Ma) around old cores (MNZI: 314–250 Ma). This Triassic event represents the beginning of a syn-rift deformation that has been recorded at different crustal levels within the IVZ (e.g. Langone et al. Reference Langone, Zanetti, Daczko, Piazolo, Tiepolo and Mazzucchelli2018). During the late stage of the amphibolite-facies deformation, the interplay between deformation and fluids promoted the formation of the third generation of monazite (MNZIII; from 202±8 to 184±6 Ma) within sheared paragneisses and the formation of the rims/tips of titanite within the mylonitic calc-silicates (TTNIII; lower intercept age at 186±6 Ma). Both the last generation of monazite and the rim/tips of titanite can be attributed to the end of deformation under amphibolite-facies condition across the Triassic-Jurassic boundary. It is interesting to note that recently a similar conclusion has been suggested by Corvò et al. (Reference Corvò, Maino, Piazolo, Kylander-Clark, Seno and Langone2023) for the Anzola Shear Zone from the adjacent Ossola valley, i.e. a northeast prolongation of the studied shear zone.
8. Conclusions
The activity of the shear zone has been constrained at the Triassic-Jurassic time by combining geochemical and U–(Th)–Pb data from monazite and titanite within sheared migmatitic paragneisses and calc-silicates, respectively.
Monazite chemical and isotopic signature is directly affected by its deformation history. In protomylonitic paragneisses, monazite preferentially retained ages related to the regional HT metamorphism (resiliency), whereas in mylonites monazite was more able to record the deformation events (reactivity). The Y-rich syn-kinematic domains/grains of monazite formed during the Triassic (238 ± 8 – 222 ± 8 Ma) due to a CDP process coevally with the breakdown of garnet (releasing Y).
On the contrary, although titanite was almost chemically unreactive during deformation (resiliency), its U–Pb isotopic system was not able to retain the Permian regional metamorphism. The U–Pb data are correlated with textural and microstructural features. The titanite innermost domains provide a Triassic lower intercept age (240 ± 5 Ma) indicating a total isotopic reset at the beginning of deformation. This was favoured by the occurrence of deformation twins across the titanite grains acting as preferential pathways for the U and Pb isotopes. The rims/tips of titanite, partially overlapping the zone of accumulation of dislocations, define a Jurassic lower intercept age at 186±6 Ma. The entire U–Pb dataset is, thus, reflecting the combined effect of a deformation-induced volume diffusion and recrystallization.
The reconstructed timing of deformation suggests a strong causal relationship to the Triassic-Jurassic rifting event leading to the opening of the Alpine Tethys that affected the Adria continental crust. Hence, mid-crustal shear zones such as the one studied played a fundamental role in accommodating deformation.
Our study shows that combining age information from different geochronometers within different protoliths and/or showing different fabrics (i.e. protomylonitic and mylonitic) allows to unveil the details of shear zone activity.
Supplementary material
The supplementary material for this article can be found at https://doi.org/10.1017/S0016756825100022
Acknowledgements
The following projects partially funded this research: PRIN2017 ‘Micro to Macro - how to unravel the nature of the large magmatic events’ (20178LPCPW- Langone Antonio); Fondazione Cariplo, project ‘MADAM’, grant n° 2024-0348 (Stefania Corvò).


 Open access