


1. Introduction
Climate change is increasing Arctic air temperatures at a rate four times faster than the global average (Rantanen and others, Reference Rantanen2022), with this warming resulting in increased rates of surface melt on glaciers and ice caps (GICs) across the Arctic (Box and others, Reference Box2018), including the GICs of the Canadian Arctic Archipelago (CAA) (Sharp and others, Reference Sharp, Burgess, Cogley, Ecclestone, Labine and Wolken2011; Noël and others, Reference Noël, Van de Berg, Wouters, Vanden Broeke, Lhermitte and Schaffer2018; Burgess and Danielson, Reference Burgess and Danielson2022). There, rising air temperatures have driven a recent increase in surface runoff, resulting in negative surface mass balance (SMB), hence enhancing CAA glaciers’ contribution to global sea level rise (Noël and others, Reference Noël, Van de Berg, Wouters, Vanden Broeke, Lhermitte and Schaffer2018; Tepes and others, Reference Tepes, Gourmelen, Nienow, Tsamados, Shepherd and Weissgerber2021). For example, between 2010 and 2017, CAA glaciers contributed 0.186 (± 0.008) mm a−1 to global sea level rise, accounting for 77% of contributions to sea level rise from the Arctic, outside of the Greenland Ice Sheet and Alaskan glaciers (Tepes and others, Reference Tepes, Gourmelen, Nienow, Tsamados, Shepherd and Weissgerber2021). The CAA contains one of the largest stores of terrestrial ice outside of the Antarctic and Greenland ice sheets, accounting for 14% of the world GIC volume, and is projected to be the greatest contributor to sea level rise from GICs in the next century (Rounce and others, Reference Rounce2023). An important component of GICs is the firn layer, i.e. the snow that survives one melt season, which regulates the storage of meltwater on GICs. Therefore, understanding how the shallow firn (10 m) layer across this region evolves and modulates meltwater runoff is of paramount importance to accurately project future sea level rise contributions.
The firn layer is derived from the annual snowpack that survives one summer melt season and consists of metamorphosed and/or compacted ice crystals, which is a porous medium that is critical for retaining glacial meltwater and limiting runoff that would otherwise contribute to sea level rise (Alley and others, Reference Alley, Bolzan and Whillans1982; Noël and others, Reference Noël, Lenaerts, Lipscomb, Thayer-Calder and van den Broeke2022). Surface meltwater can create ice layers within the shallow firn pack (10 m) (Pfeffer and others, Reference Pfeffer, Meier and Illangasekare1991), due to meltwater percolation and refreezing as it reaches colder temperatures at depth. Ice layers can range in size from ice lenses (mm) to ice slabs (meters). During years of high surface melt, greater amounts of meltwater can be generated, which can create thicker ice layers (depending on lateral flow) within the firn, when more meltwater percolates and refreezes (Machguth and others, Reference Machguth2016). The formation of thick, low permeability ice layers can thus limit the amount of meltwater that can be stored within the firn over time by creating an impermeable layer that redirects meltwater to flow horizontally to lower elevations instead of residing at higher elevations in the firn layer (MacFerrin and others, Reference MacFerrin2019; Jullien and others, Reference Jullien, Tedstone, Machguth, Karlsson and Helm2023). Over time, ice lenses within the shallow firn layer grow as percolating meltwater refreezes and accretes onto existing ice layers. This process releases latent heat, warming the surrounding firn and consequently reducing its capacity to refreeze additional meltwater during future infiltration events. The distinction between growth and accretion lies in the energy source driving the process: accretion specifically refers to the addition of mass due to the refreezing of meltwater and the associated release of latent heat, which modifies the thermal state of the firn (Pfeffer and others, Reference Pfeffer, Meier and Illangasekare1991; Ashmore and others, Reference Ashmore, Mair and Burgess2019). Primarily, the evolution of the shallow firn conditions is a function of surface melt modulated by the underlying properties of the firn (i.e. how many impermeable layers are already present) at a given time, which is a product of previous melt seasons (Koerner, Reference Koerner1977) and high winds. Due to high-speed winds across the ice cap, dense wind slabs form at the surface and can act as semi-impermeable barriers for meltwater to flow through. During years of low surface melt and/or high snow accumulation, the firn layer can replenish, meaning that an expansion can occur and increase the subaerial pore space (horizontally and vertically), enhancing the capacity for meltwater absorption (Vandecrux and others, Reference Vandecrux2018; Rennermalm and others, Reference Rennermalm2022). In the CAA, a few cooler than average years (2013, 2018 and 2021) have been interspersed throughout the past two decades, resulting in a few years with a slightly positive or near-balance glacier SMB (Burgess, Reference Burgess2017; Maure and others, Reference Maure, Kittel, Lambin, Delhasse and Fettweis2023), especially on Arctic ice caps that have accumulation areas extending to relatively high elevations (i.e. 1500–1900 m a.s.l.), including Devon Ice Cap (DIC) (Maure and others, Reference Maure, Kittel, Lambin, Delhasse and Fettweis2023). Essentially, understanding current ice layering conditions within the shallow firn layer and projecting its evolution require knowledge of both the current climate and recent climatic events which may have pre-conditioned the firn pack for the formation of internal ice layers.
DIC, Nunavut (75.25∘N, 82.05∘W) is one of the largest ice caps in the CAA, with an area of ∼14 000 km2 (Burgess and Sharp, Reference Burgess and Sharp2004; Burgess, Reference Burgess2017) (Fig. 1a). The annual accumulation area, and therefore firn area, is a dynamic region that can change drastically from one year to the next depending on SMB conditions. In 2017, the accumulation area comprised 20% of DIC, with a long-term equilibrium line altitude (ELA) around 1360 m a.s.l. (Burgess, Reference Burgess2017). ELA is the altitude where the transition from ablation to accumulation occurs on the ice cap and can vary annually; for instance, in the northwest basin on DIC from 1961 to 2003, the ELA ranged between 579 and 1570 m a.s.l. (Koerner, Reference Koerner2005). The ice cap is characterized by four distinct glacier zones; (1) glacier ice zone (below ∼1000 m a.s.l.), (2) superimposed ice/saturation zone (∼1000–1200 m a.s.l.), (3) the wet snow zone (∼1200 to 1400 m a.s.l.) and (4) the percolation zone (above ∼1400 m a.s.l.) (Koerner, Reference Koerner1970) that includes the quasi dry snow zone (above ∼1600 m a.s.l.).
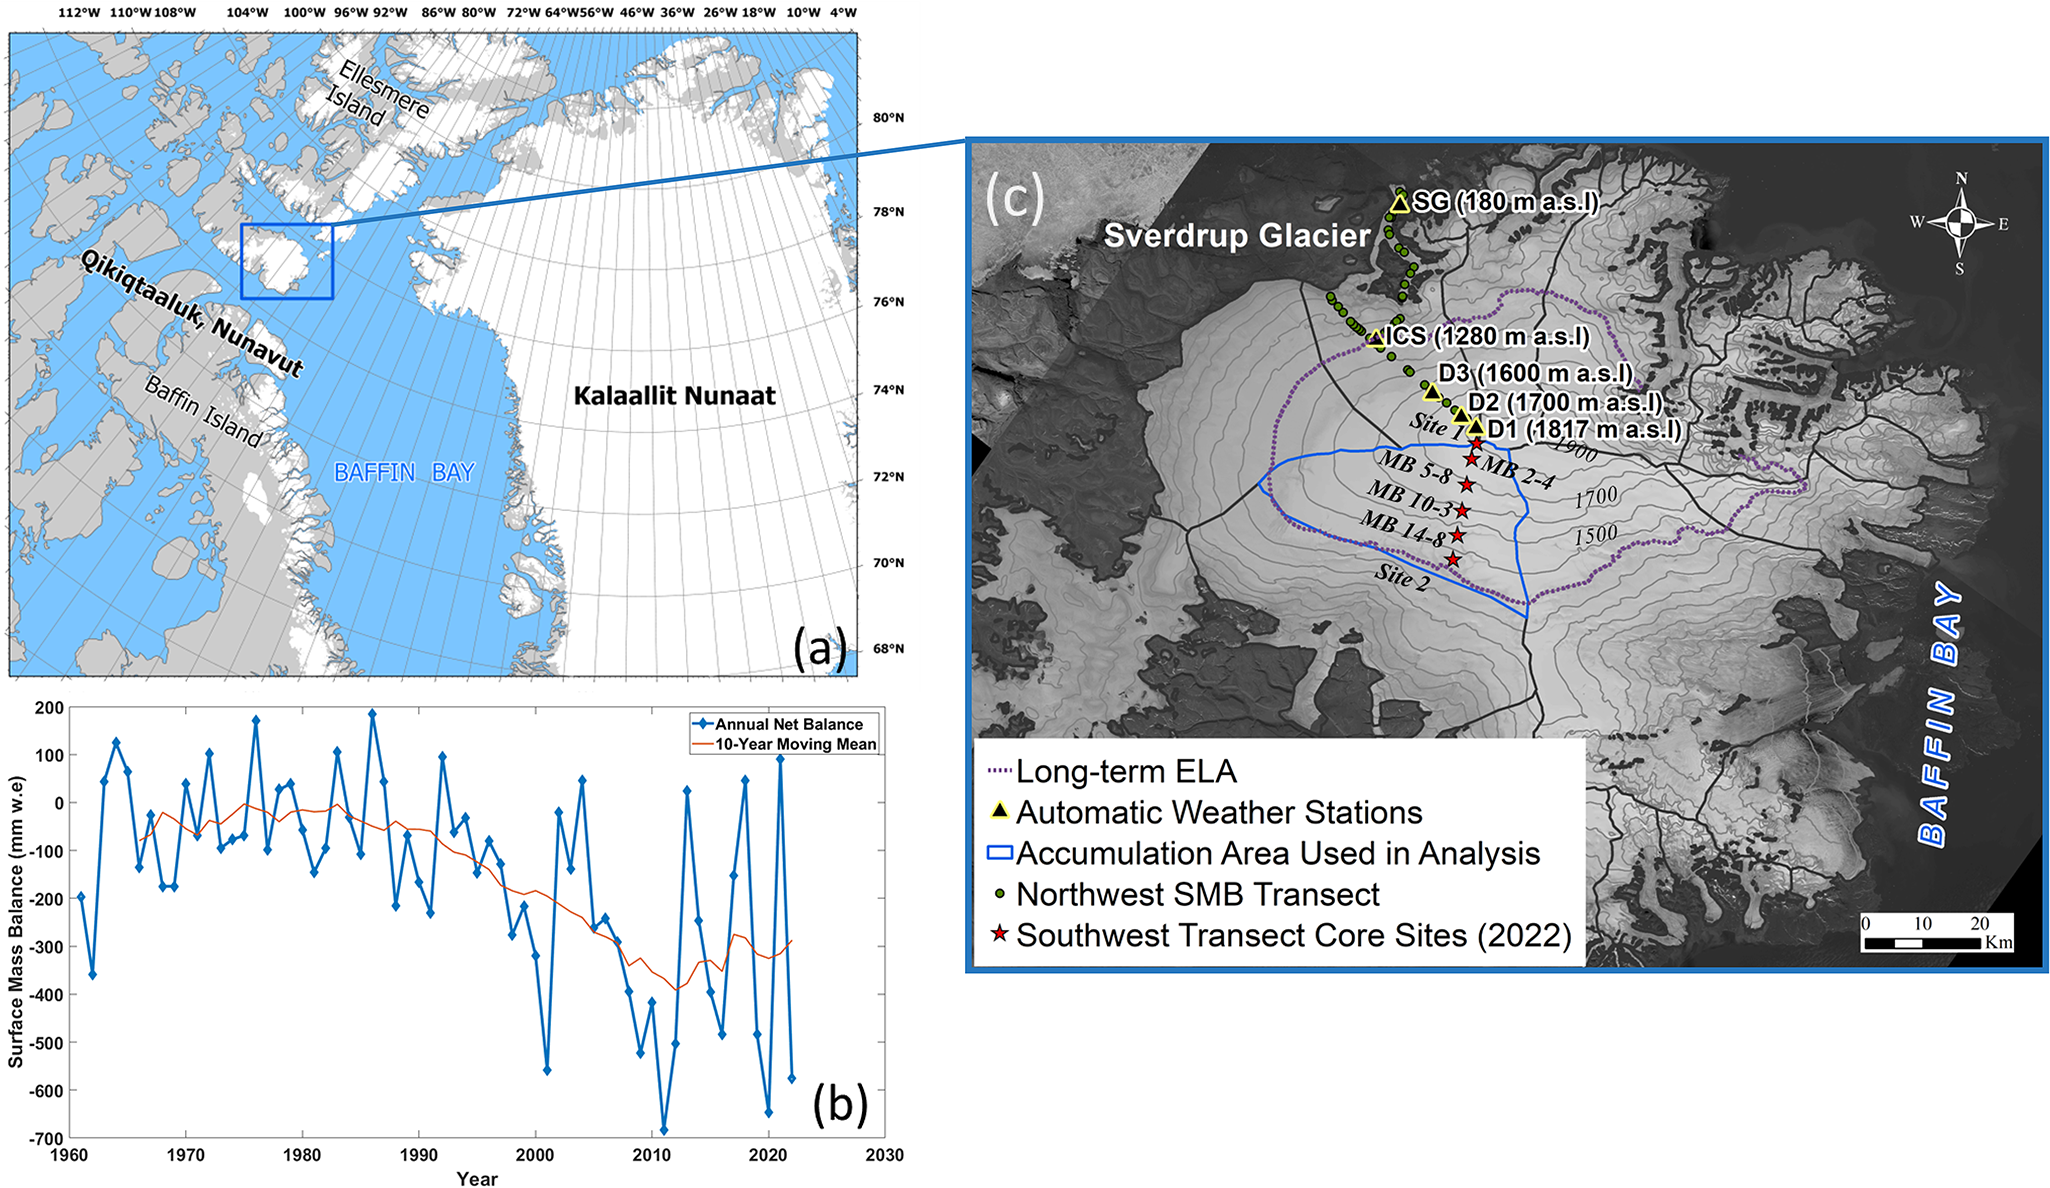
Figure 1. (a) Study area map of the Canadian Arctic Archipelago with DIC highlighted in the dashed black line. (b) SMB of the DIC in situ data collected by the Geological Survey of Canada since 1960 along the Northwest transect shown in green points (Burgess, Reference Burgess2017). (c) The map shows the points (in stars) on the DIC where the firn cores were drilled in this study, with the RGI glacier basin outlines delineated in black, contour lines of 100 m intervals are in grey and are overlaid on a mosaic from Landsat-8 July 2020. The long-term ELA is denoted in a purple dashed line and the blue outline denotes the accumulation area for the southwest transect. The black triangles with yellow highlights show the location of all the AWS on DIC, where only the AWS located in the accumulation area are used in this study.
More recently, Chan and others Reference Chan, Grima, Rutishauser, Young, Culberg and Blankenship(2023) used a combination of airborne- and surface-based radar in 2018 and 2019, to map surface characteristics across the DIC. Elevation boundaries between three firn zones across the entire ice cap were identified: from 1700 to 1800 m a.s.l. and consists of firn with thin ice slabs, 1300 down to 1700 m a.s.l. where the firn contains ice slabs up to 4.5 m thick and then primarily glacier ice below ∼1300 m a.s.l.
Previous work on DIC has been conducted to understand the impacts of climate on the firn layer. For instance, to study the paleoclimate on DIC, deep ice cores (300 m to bedrock) were drilled across the accumulation area in the 1960s to analyse variations and identify melt layers in glacier ice as analogues for warmer periods in the climate record (Koerner, Reference Koerner1977). Shallow firn cores (15–20 m) were drilled in 2000 by Mair and others Reference Mair, Burgess and Sharp(2005), and subsequently in 2004 and 2005 by Colgan and Sharp Reference Colgan and Sharp(2008), to study the mass balance conditions on DIC since the 1960s. The impacts of a warmer period (2000–11) on the shallow firn layer have been previously studied on DIC. In 2012, a firn core and ground penetrating radar (500 MHz) survey showed the development of large ice layers over the preceding decade (Bezeau and others, Reference Bezeau, Sharp, Burgess and Gascon2013; Gascon and others, Reference Gascon, Sharp, Burgess, Bezeau and Bush2013). These ice layers appear to have caused preferential lateral flow of meltwater that may be responsible for ponding in localized regions with concave topography (Gascon and others, Reference Gascon, Sharp, Burgess, Bezeau and Bush2013). Rapid firn densification was reported by Gascon and others Reference Gascon, Sharp, Burgess, Bezeau and Bush(2013) and Bezeau and others Reference Bezeau, Sharp, Burgess and Gascon(2013) due to the refreezing of meltwater, which thereby reduced the water storage potential and refreezing capacity of the percolation zone on DIC.
The objective of our study is to provide an update from previous work and to: (1) compare the stratigraphy, IF and density of the firn cores drilled between the past decades (2012–22) and (2) understand the connections to air temperature and SMB conditions since 2000 on the firn layer. We present findings from six shallow (2–3 m) firn cores drilled in spring 2022 along a southwest transect on DIC in the accumulation area (1400–1800 m a.s.l.) and compare them with previously reported firn cores drilled in 2012 (Bezeau and others, Reference Bezeau, Sharp, Burgess and Gascon2013). We then discuss the relationship between the evolution of IF and the corresponding air temperature and SMB conditions.
1.1. Background on DIC and study site: Southwest transect
DIC experiences a polar desert climate, with  $\sim$$ \lt $200 mm w.e. of solid precipitation per year and a mean June, July and August, air temperature of $-5 ^{\circ}\mathrm{C}$ at the summit weather station (Gardner and Sharp, Reference Gardner and Sharp2007). Accumulation rates vary across the ice cap, with high rates of accumulation in the southeast (500 mm w.e.) and low rates in the northwest (100 mm w.e.), due to differences in precipitation, that are driven by atmospheric circulation in the eastern CAA and due to the moisture source availability closer to Baffin Bay (Koerner, Reference Koerner1966).
Annual SMB monitoring of DIC was established in 1960 by the Arctic Institute of North America and is currently maintained by the Geological Survey of Canada (Fig. 1b). The primary SMB measurement transect runs from a point near the summit of the ice cap at ∼1800 m a.s.l. to the northwest margin of the ice cap at ∼800 m a.s.l., with a branching transect running from a point near the long-term ELA (∼1360 m a.s.l.) to the marine terminus of Sverdrup Glacier (Fig. 1c). Net SMB is calculated as a function of in situ measurement values and the area-elevation distribution across the northwest basin (Koerner, Reference Koerner2005; Burgess, Reference Burgess2017).
Ice cap-wide SMB across DIC between 1963 and 2000 has been estimated using various techniques: (a) flux divergence, where glacier thickness is compared at two points on the glaciers and loss is calculated from the difference in thickness between the upstream and downstream point, which indicated a mass decrease of −1.8 ± 7 Gt a−1 (Burgess and Sharp, Reference Burgess and Sharp2008); (b) SMB modelling, resulting in a loss of −1.6 ±0.7 Gt a−1 (Mair and others, Reference Mair, Burgess and Sharp2005) and (c) using the mass budget method, which compares the mass accumulation in the interior with runoff and ice discharge at the boundaries of the ice cap, with a loss rate of −1.08 ±0. 67 Gt a−1 (Shepherd and others, Reference Shepherd, Du, Benham, Dowdeswell and Morris2007). Collectively, these studies all indicate an ice cap-wide negative mass balance trend for DIC since the 1960s. More recently, modelled SMB results for DIC between 2000 and 2020 show a mean negative SMB of −6.5 ±3.8 Gt a−1 (Maure and others, Reference Maure, Kittel, Lambin, Delhasse and Fettweis2023).
In this study, firn cores were extracted from a transect in the southwest basin of DIC that has previously been termed the ‘Cryosat’ transect (Bell and others, Reference Bell2008) (basin highlighted in blue in Fig. 1c). The transect will be referred to as the ‘southwest transect’ when discussing where the firn cores were extracted for this study since we did not sample the entire transect. Specifically, we sampled the sites named: Site 1, MB 2-4, MB 5-8, MB 10-3, MB 14-8 and Site 2, as shown in Fig. 1(c). The Cryosat transect is 47 km long and runs along the southwestern side of the summit plateau, with an elevation range of 500–1800 m a.s.l and was established in 2005 as a calibration and validation study site for the European Space Agency’s Cryosat-2 mission (Gray and others, Reference Gray2013). From 2005 to 2011, SMB data were collected along the Cryosat transect and are used in our study to compare SMB values from the NW transect (Fig. 2) to approximate accumulation in the firn cores (see methods). In 2012, shallow firn cores were extracted, and ice stratigraphy was collected along the 20 km portion of this transect that lies in the accumulation zone (as shown in Fig. 1c) (Bezeau and others, Reference Bezeau, Sharp, Burgess and Gascon2013). In their study, Bezeau and others Reference Bezeau, Sharp, Burgess and Gascon(2013) extracted firn cores to quantify changes in ice fraction (IF) and firn density between the early 2000s and 2012. Here, we examine how the ice content, density and stratigraphy derived from firn cores collected at six locations along the southwest DIC transect (Bezeau and others, Reference Bezeau, Sharp, Burgess and Gascon2013) have changed within the near-surface firn over the intervening decade.
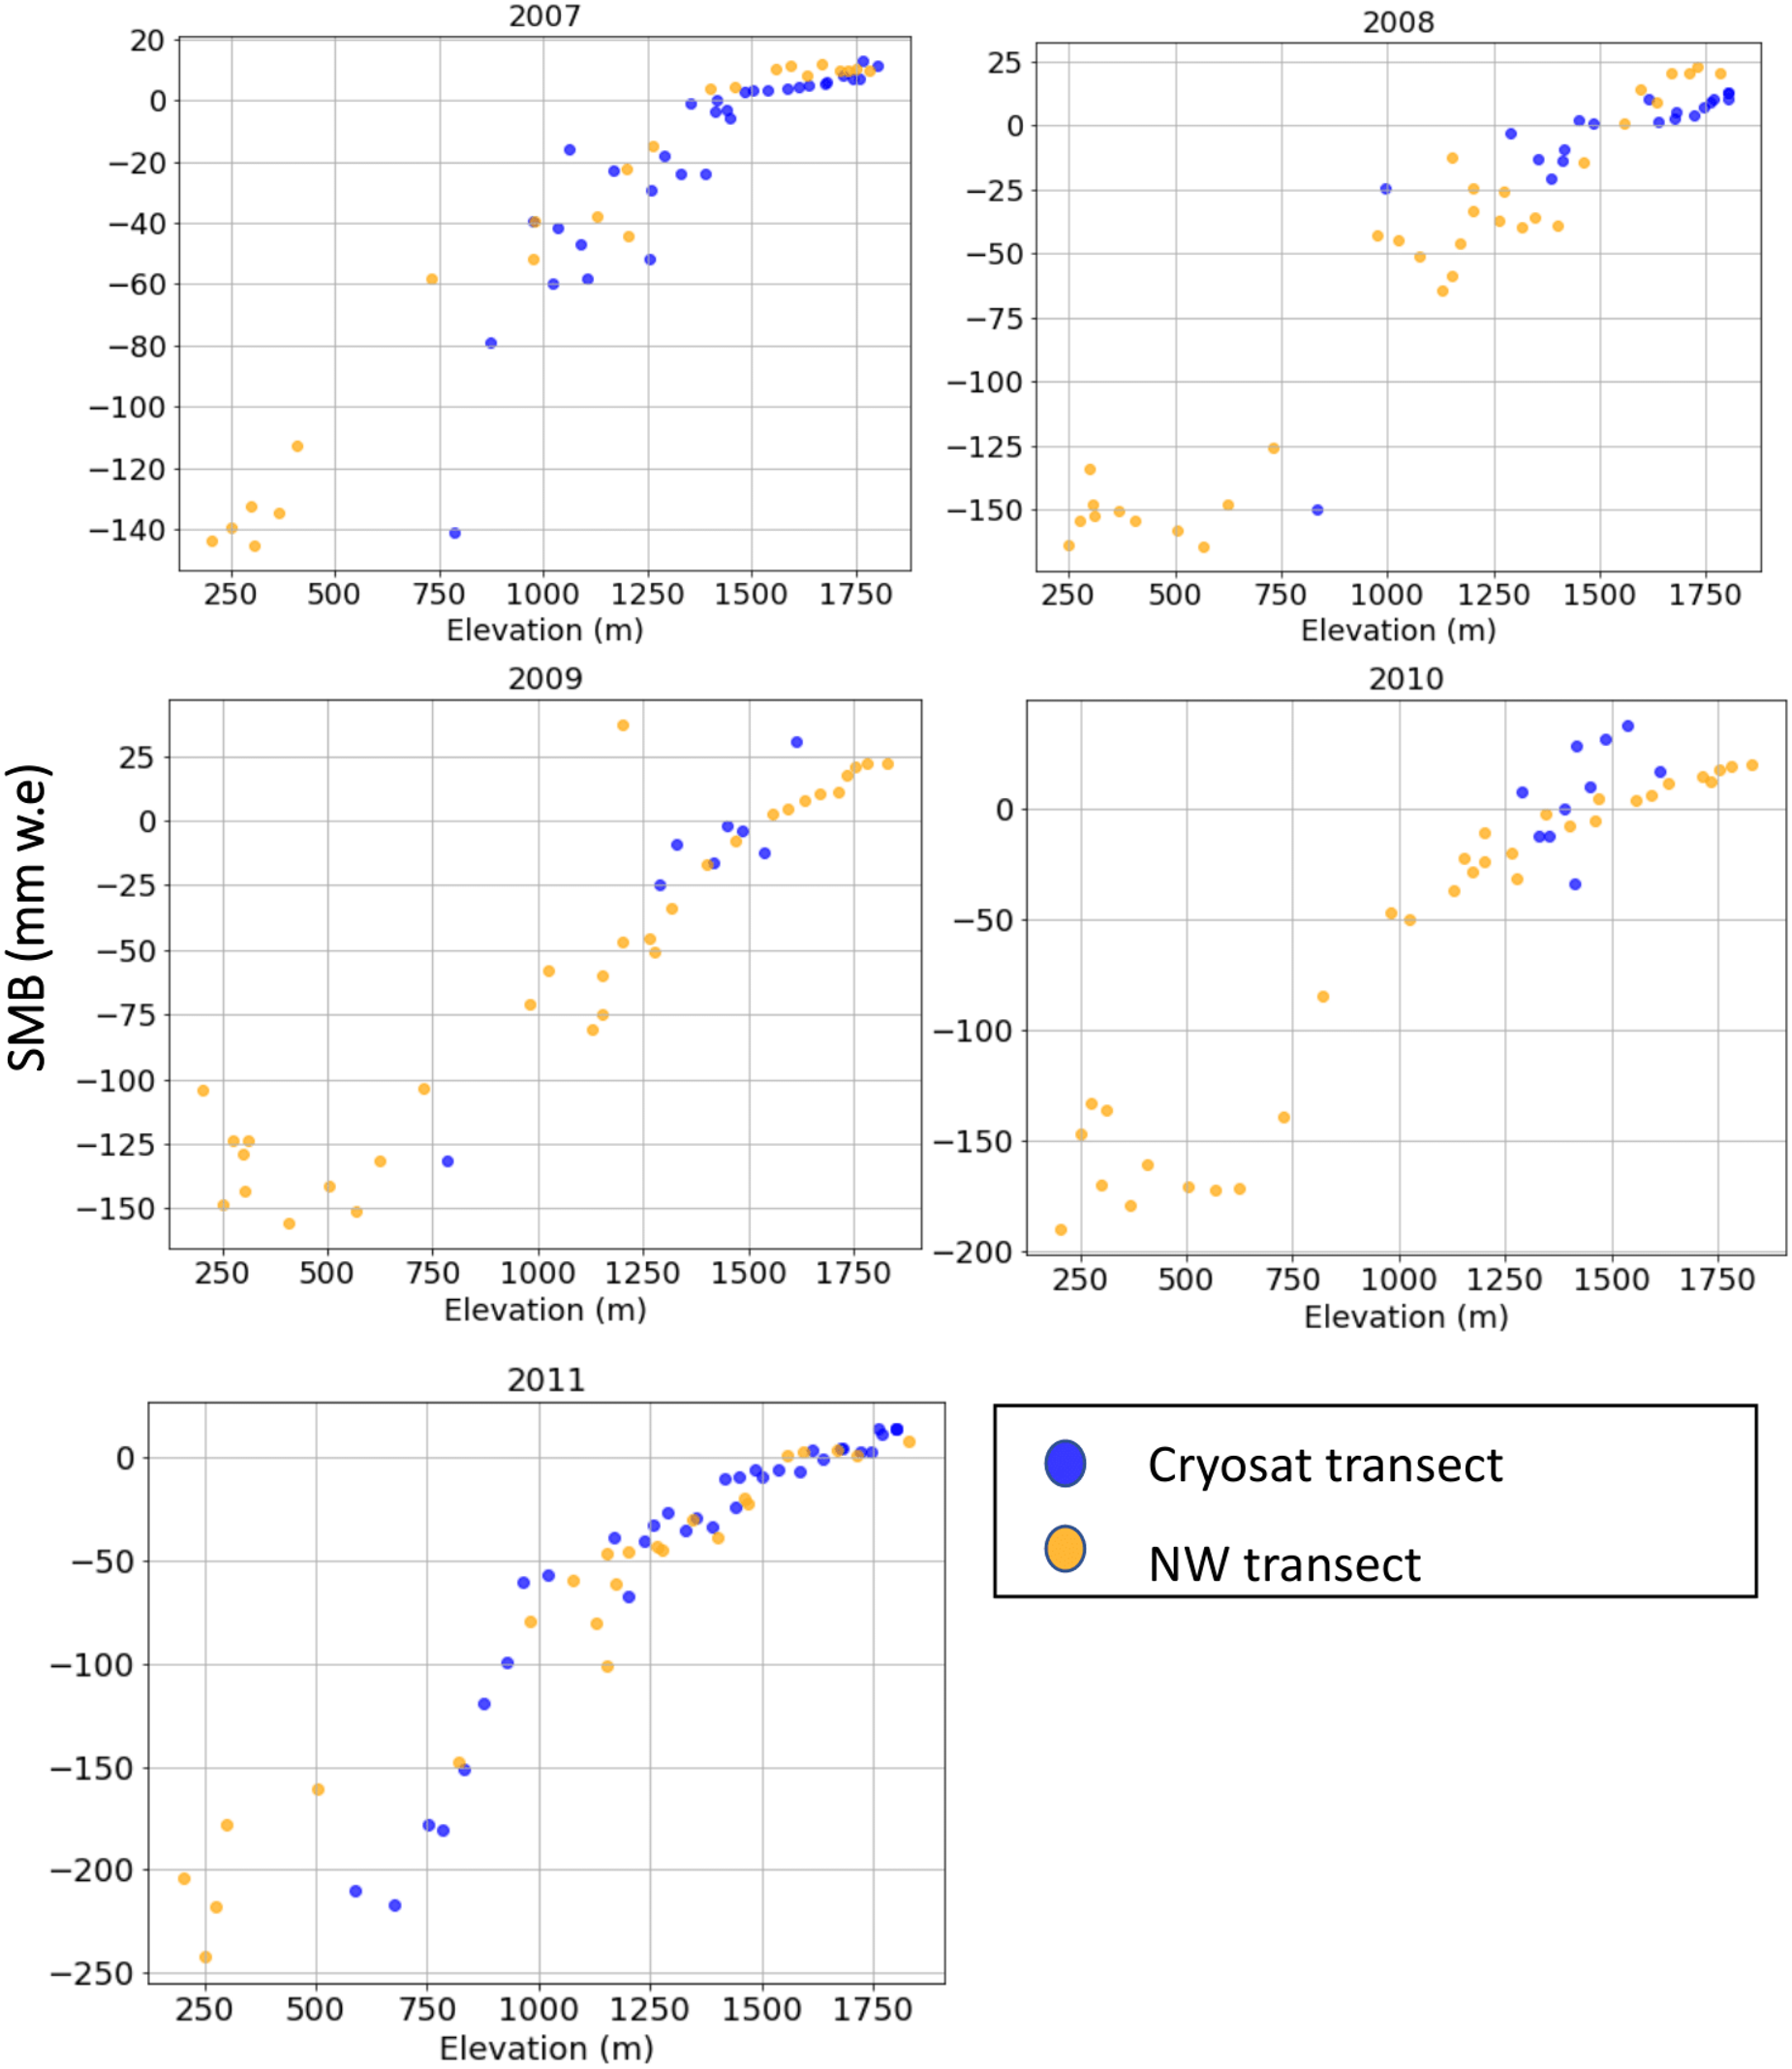
Figure 2. Annual SMB in mm w.e. plotted against elevation for both the Cryosat transect (blue dots) and the northwest transect (yellow dots). The plots represent yearly data from individual in situ SMB pole measurements from 2007 to 2011.
2. Data and methods
The present study utilizes shallow firn cores, climate model data from RACMO2.3 and in situ SMB and automatic weather station (AWS) data to interpret the changes in the firn layer of DIC between 2012 and 2022. The following section expands on methods for collecting the firn cores, uncertainty in the data collection and describes the variables used from RACMO2.3.
2.1. Shallow firn core extraction
In spring 2022, six shallow firn cores were extracted from the accumulation area along the southwest transect of DIC between 1400 and 1800 m a.s.l. (Fig. 1c). Snow pits were excavated at each site to remove the previous winter’s snow accumulation (20–70 cm) to a low-density depth-hoar layer, indicating the base of the surface winter snowpack. This layer is common across ice caps in the Canadian High Arctic (Koerner, Reference Koerner2005) and reliably identifies the post-melt season accumulation which occurs at the start of the new balance year beginning in late August to early September. Below the depth-hoar layer, the snow pit was expanded to roughly 1 m2, and a core was drilled directly into the prior year’s firn layer.
Shallow firn cores were drilled using a Kovacs MK II corer with an internal barrel diameter of 9 cm to a depth of 2–3 m (below the annual snowpack). Core segments were laid in sequence onto a tarpaulin, where they could be brushed clean of loose snow, aligned against a graduated measuring tape and then inspected and photographed. These cores were then documented through optical and infrared (IR) photography to preserve a record of the visual stratigraphy. Each core was photographed twice: once with a Canon Power Shot SX740 HS optical camera, and then with a Fuji FinePix S900 camera that was manually modified by Bezeau and others (Reference Bezeau, Sharp, Burgess and Gascon2013) to capture optical and IR wavelengths ranging between 330 and 1200 nm (Bezeau and others, Reference Bezeau, Sharp, Burgess and Gascon2013). The Fuji camera is identical to the one used by Bezeau and others Reference Bezeau, Sharp, Burgess and Gascon(2013) for the 2012 firn cores. Post-processing through visual inspection of the IR and optical photos of these data included visual characterization of distinct ice layers and discrimination between icy and fine grain firn layers in the cores. Discrimination between firn types and ice was undertaken based on the apparent visual structure (i.e. coarse or fine grain firn size), hardness and transparency of the layer. Hardness was tested in the field, for each layer with the hand hardness test (Armstrong and others, Reference Armstrong2009). More homogeneous transparent hard layers were identified as ice, while brittle and larger ice crystal sections were identified as firn. An example of the classification of the firn cores with the IR photos is shown in Fig. 3.
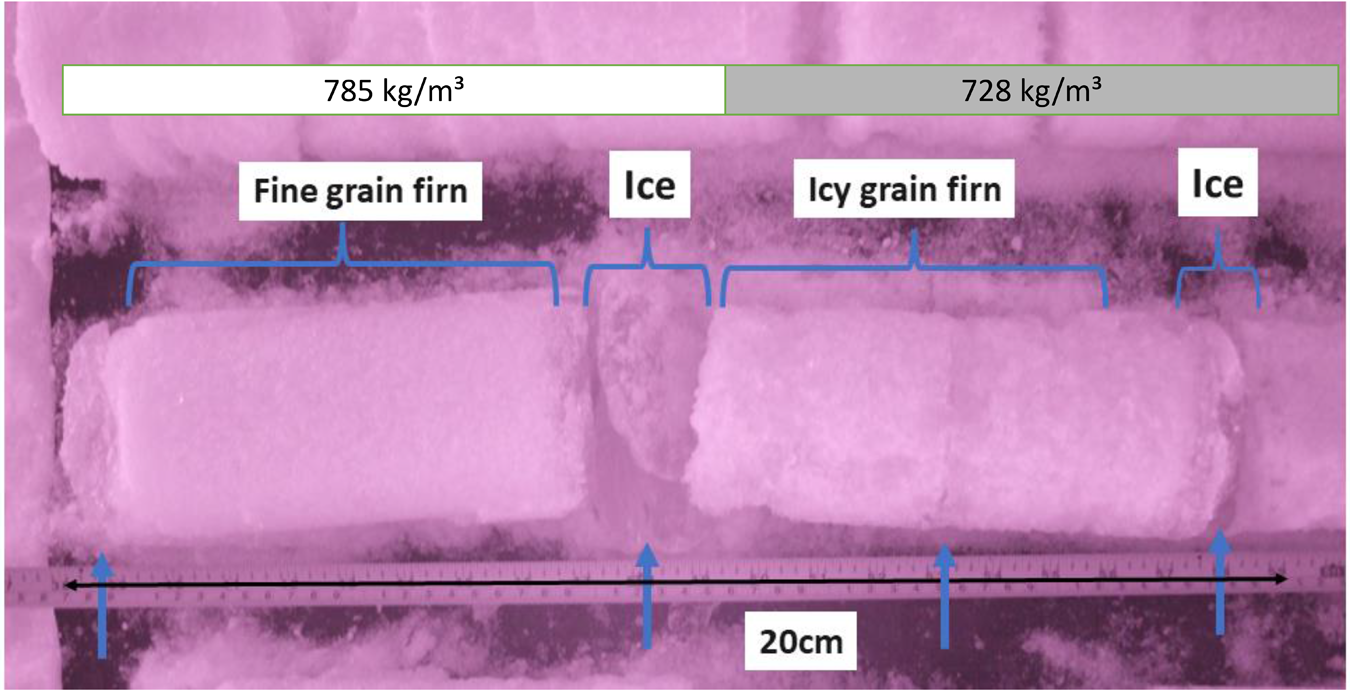
Figure 3. Example of the infrared photography and the classification of the firn core from May 2022 at Site 1 (1800 m a.s.l.) with the bulk density of the firn core sections superimposed on top.
The bulk density of the cores was measured in the field for the length of the auger segment drilled, which resulted in ∼60 cm segments of the firn core being weighted at once. In the field, we noted the intactness of the firn core segments to flag any sections with missing material in density measurements. Centimetre scale stratigraphy of the firn core layers was documented in the field by noting the depths at which an ice layer or a transition between grain sizes and hardness was visually observed (Fig. 3). Figure 4 contains the stratigraphy plots created by comparing field notes with the IR and optical photos. It should be noted that since the firn cores were recovered in 2022, the last melt and accumulation would be from 2021. Similarly, for the 2012 firn cores, the record of accumulation and melt would be up until 2011.
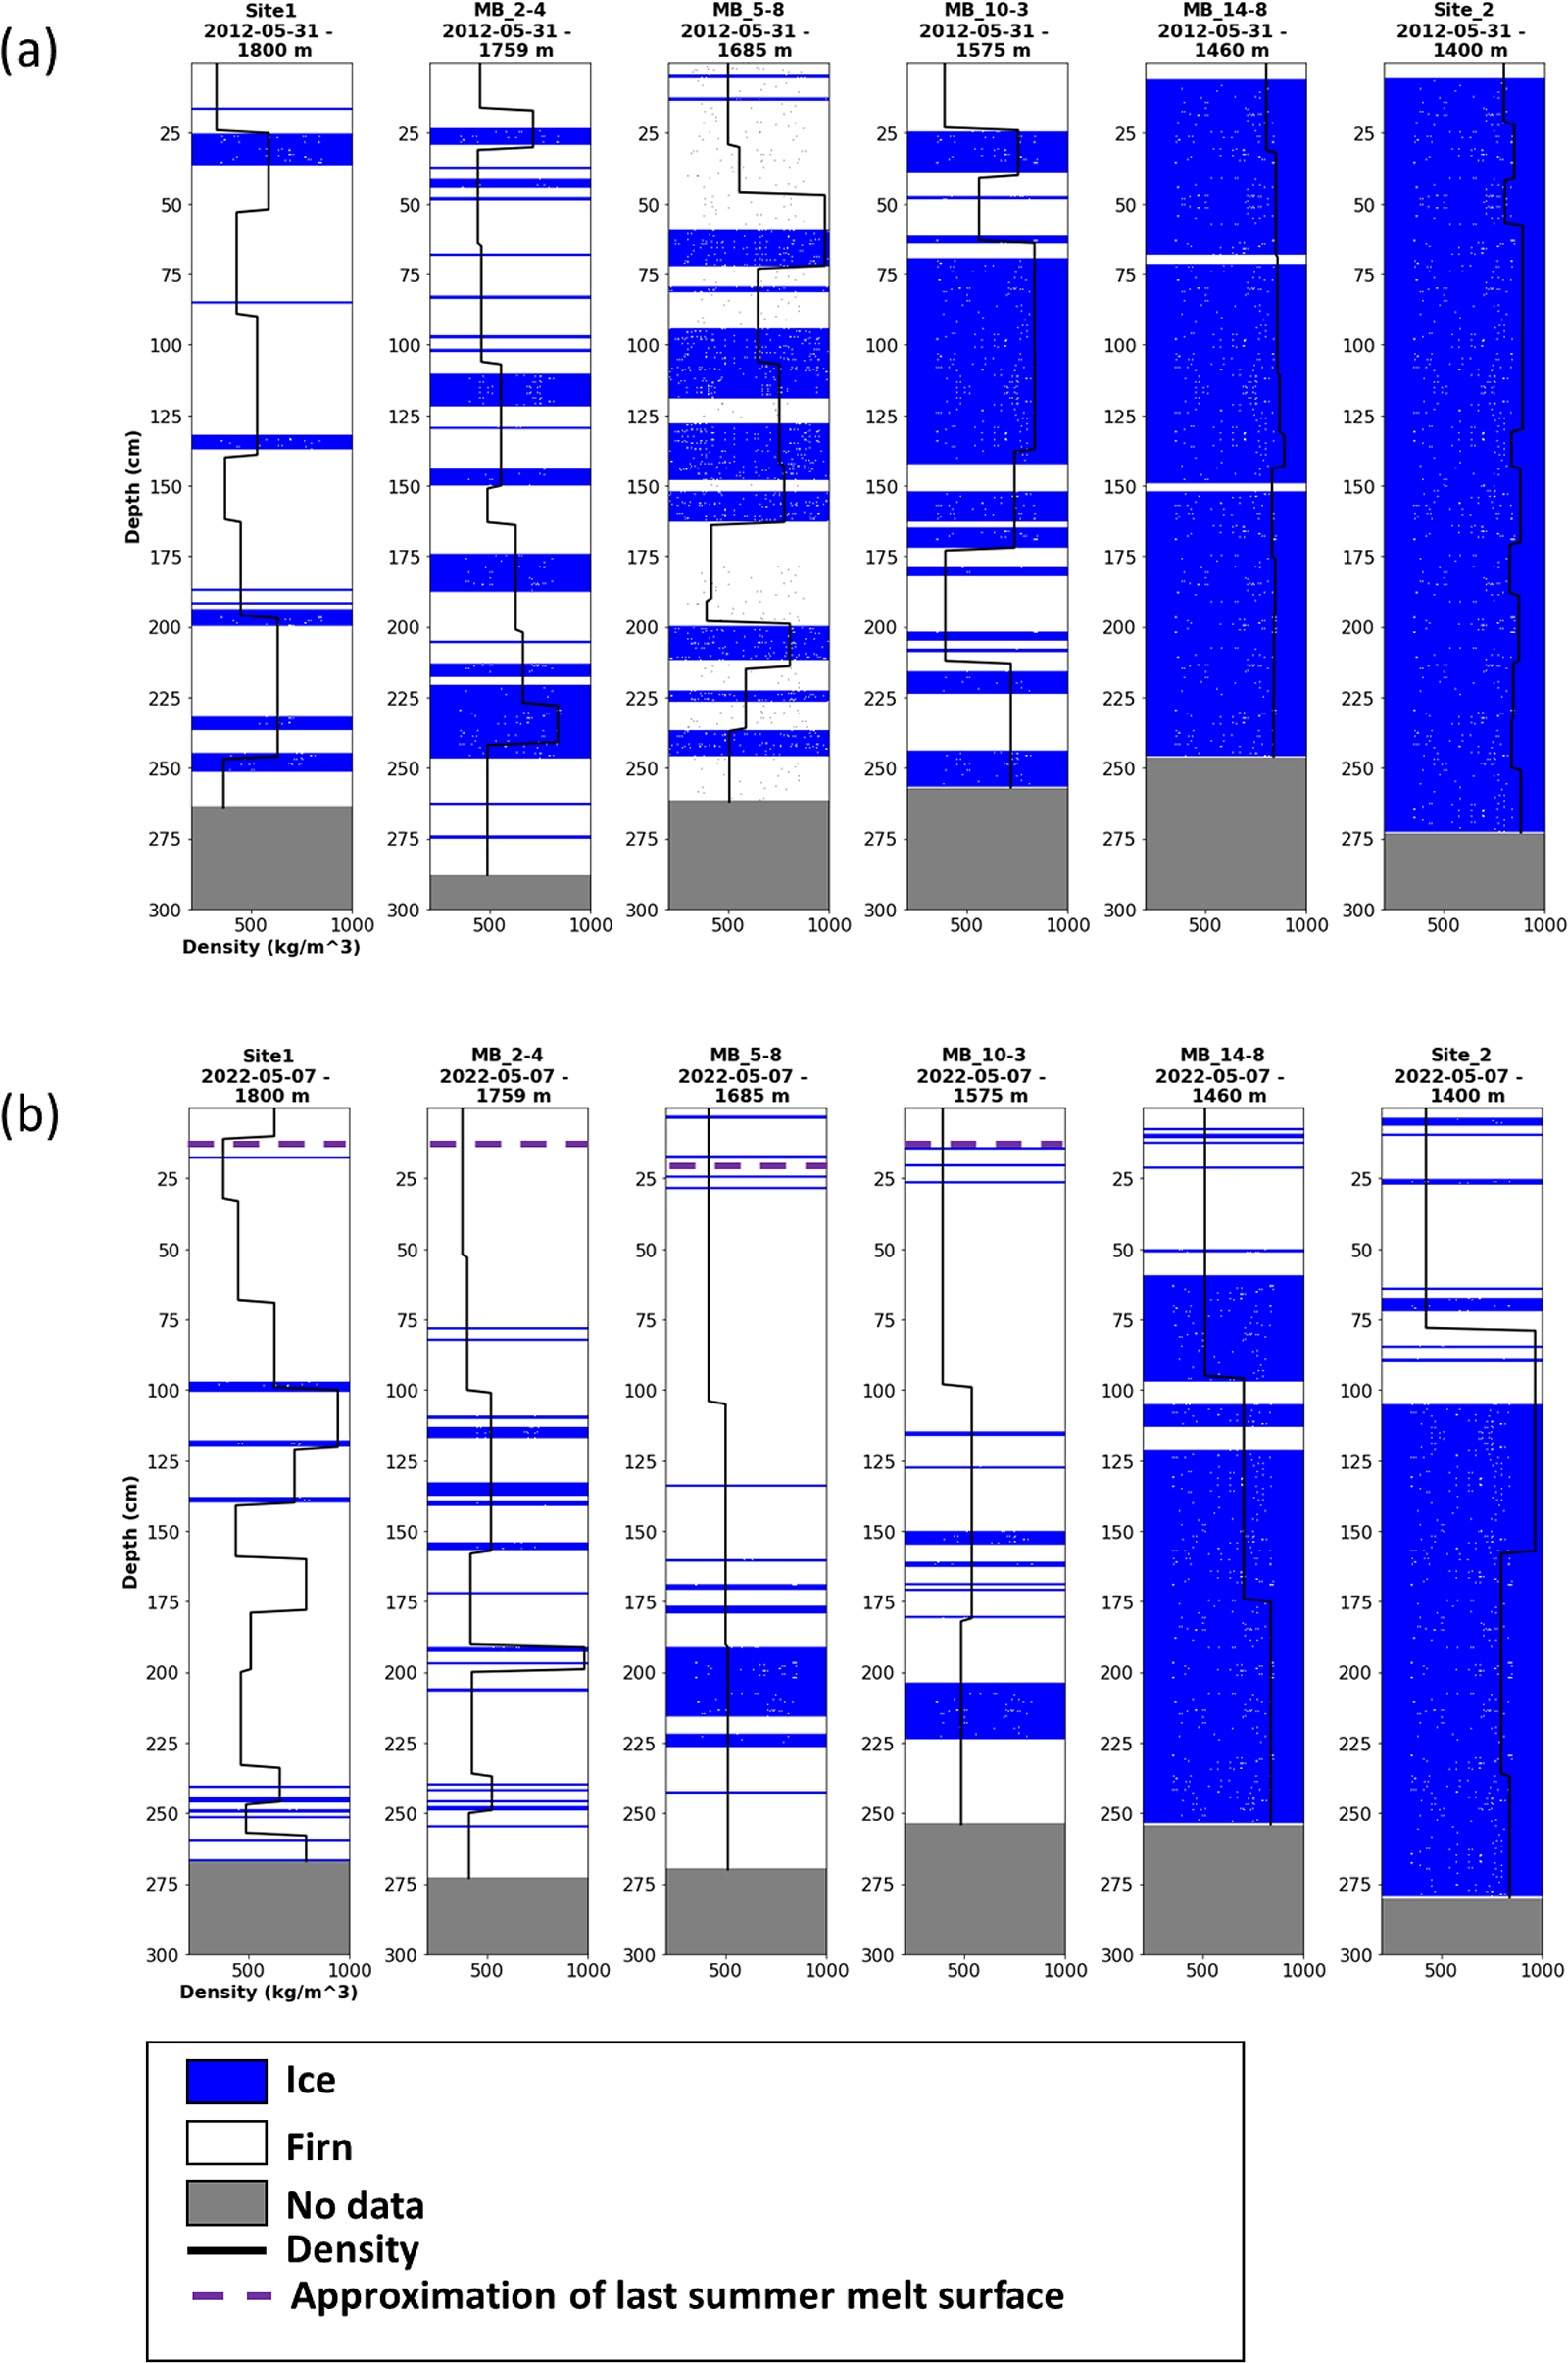
Figure 4. Firn core stratigraphy and density (kg/m3) from the southwest transect in 2012 (a) and 2022 (b) with elevation (m a.s.l.) and site names, date of extraction and elevation (m a.s.l.) above each firn core. Stratigraphy and density assessment in 2012 is from Bezeau and others (Reference Bezeau, Sharp, Burgess and Gascon2013). Approximation of the last summer melt surface is indicated in the dashed purple line where it was possible to identify (see methods).
2.2. Calculation of ice fraction
We calculate IF to quantitatively compare the changes in meltwater composition between the two study periods. As per Bezeau and others Reference Bezeau, Sharp, Burgess and Gascon(2013), per cent IF was calculated as the ratio between the total length L (cm) of the firn core and the sum of the total ice content  ${T_i}$ (cm):
 \begin{equation}
IF = \frac{\sum_{T_i}}{L} (100)
\end{equation}
\begin{equation}
IF = \frac{\sum_{T_i}}{L} (100)
\end{equation}Total ice content is the length of ice (refrozen meltwater or glacier ice) within the core section that was drilled and assumed to be homogeneous across the diameter of the core section. IF was calculated from each stratigraphic profile for the entire length of the cores collected in 2022. To enable comparison with results from previous shallow firn core studies, IF was calculated from the 2012 stratigraphic profiles (raw data provided from Bezeau and others Reference Bezeau, Sharp, Burgess and Gascon(2013)) for the equivalent lengths of the cores from 2022.
2.3. Uncertainty in firn stratigraphy
Clear identification of layering in a firn core (e.g. firn, vertical piping, saturated firn, icy firn and ice) from photography is a qualitative measurement technique that can introduce errors into subsequent analysis (Alley and others, Reference Alley1997). To minimize this error, IR photos from 2012 were provided and examined to compare the stratigraphy of the 2012 cores with those described in Bezeau and others Reference Bezeau, Sharp, Burgess and Gascon(2013). Examination of the IR photos from 2012 confirmed that the interpretation of the firn stratigraphy was very similar between interpreters, meaning that all layers were identified and labelled the same between operators, indicating the minimal impact of this potential error.
Ice layers on DIC have been reported to be continuous for distances of 100–200 m, with minimal spatial variations in terms of horizontal ice layer extent (Gascon and others, Reference Gascon, Sharp, Burgess, Bezeau and Bush2013). Xiao and others Reference Xiao(2022) identified differences of 12–19% in the 4.5 m section of cores drilled at the same site and year, accounting for differences in the local vertical scale, similar to Bell and others Reference Bell(2008), who showed variability of extent in ice layers on the decimeter scale. More recently, Xiao and others Reference Xiao(2022) showed that point sampling has a strong spatial representativeness within the percolation zone, demonstrating the effectiveness of using firn cores to interpret changes within the firn layer. Additionally, ice flow velocities in the accumulation area of DIC are ∼5 m/yr (Burgess and Sharp, Reference Burgess and Sharp2008; Van Wychen and others, Reference Van Wychen2017) suggesting a potential displacement of about 50 m (along the flowline) between the 2012 and 2022 sampling locations. This displacement indicates that while we are sampling the same nominal latitude and longitude, we are not sampling the same firn that would have been sampled in 2012. Instead, the focus is on documenting how the IF has evolved at specific sites on the ice cap over a decade. These sources of measurement uncertainty should be acknowledged; however, we have implemented steps to reduce the uncertainties in stratigraphy interpretation to minimize overall impacts on results.
2.4. Climate model and in situ air temperature data
The Regional Atmospheric Climate Model (RACMO2.3) simulates the climate and SMB of the Arctic, including glaciers of the CAA for the years 1958–2022 (Noël and others, Reference Noël, Van de Berg, Wouters, Vanden Broeke, Lhermitte and Schaffer2018). RACMO2.3 was developed and maintained at the Royal Netherlands Meteorological Institute (KNMI) and the Institute for Marine and Atmospheric Research at Utrecht University (IMAU) (Noël and others, 2015). RACMO2.3 combines the dynamical core of the High-Resolution Limited Area Model with the physics package of the European Centre for Medium-Range Weather Forecasts-Integrated Forecast System. The regional model is forced using climate reanalyses from ERA-40 for the years 1958–78, ERA-interim for 1979–2018 and ERA5 for 2019–22 and has been statistically downscaled from the original spatial resolution of 11 to a 1 km grid covering the northern region of the CAA (Noël and others, Reference Noël, Van de Berg, Wouters, Vanden Broeke, Lhermitte and Schaffer2018). Modelled SMB was evaluated in the supplementary information of Noël and others Reference Noël, Van de Berg, Wouters, Vanden Broeke, Lhermitte and Schaffer(2018), where they compared modelled data with in situ SMB data (using direct glaciological methods) from the Northern CAA and Southern CAA. For DIC, between 1958 and 2015, a root mean square error of 0.13 mm w.e./yr and a bias of −0.11 mm w.e./yr was determined from 31 data points from direct glaciological measurements of SMB. In general, the mean bias is 40 mm w.e. (0.04 m w.e.) and the RMSE is 380 mm w.e. (0.38 m w.e.), where the largest difference between the model and observations in the low ablation zone (4–5 m w.e. of surface mass loss) is 2 m w.e. (Noël and others, Reference Noël, Van de Berg, Wouters, Vanden Broeke, Lhermitte and Schaffer2018). An evaluation of the performance of the SMB variables from RACMO2.3 at 11 km resolution is evaluated in the northwest basin of DIC in Burgess Reference Burgess(2018) and shows reasonable agreement for the summer balance but proves problematic when compared with the net annual balance. An issue identified in that analysis is the unresolved geometry and elevation differences across the basin. Upon visual inspection of Fig. 5, RACMO2.3 is unable to capture the magnitude of the very positive SMB years but has a close agreement with replicating the interannual trends of the in situ SMB. Fig. 6 displays the variation in elevation of the in situ SMB along the northwest transect, which can explain the discrepancies between the modelled and in situ SMB if topography is not resolved in modelling efforts. In addition, we compared modelled air temperature to AWS data and found high correlations and low RMSEs at all stations (Supplementary material). Methods and results of the comparison are provided in supplementary material. RACMO2.3 monthly mean 2 m air temperature, precipitation, SMB, snowmelt (includes glacier ice melt) and refreezing statistically downscaled to 1 km are used here to interpret the characteristics of the shallow firn layer and their changes over time. 2 m air temperature data were extracted from RACMO2.3 for each firn core site, while precipitation, SMB, snowmelt and refreezing are summarized as annual totals for the accumulation area in the southwest transect basin in Fig. 7 and displayed as monthly anomalies in Fig. 8. We use the total values from the accumulation area in the basin to give a relative estimate of the changes in the accumulation area.
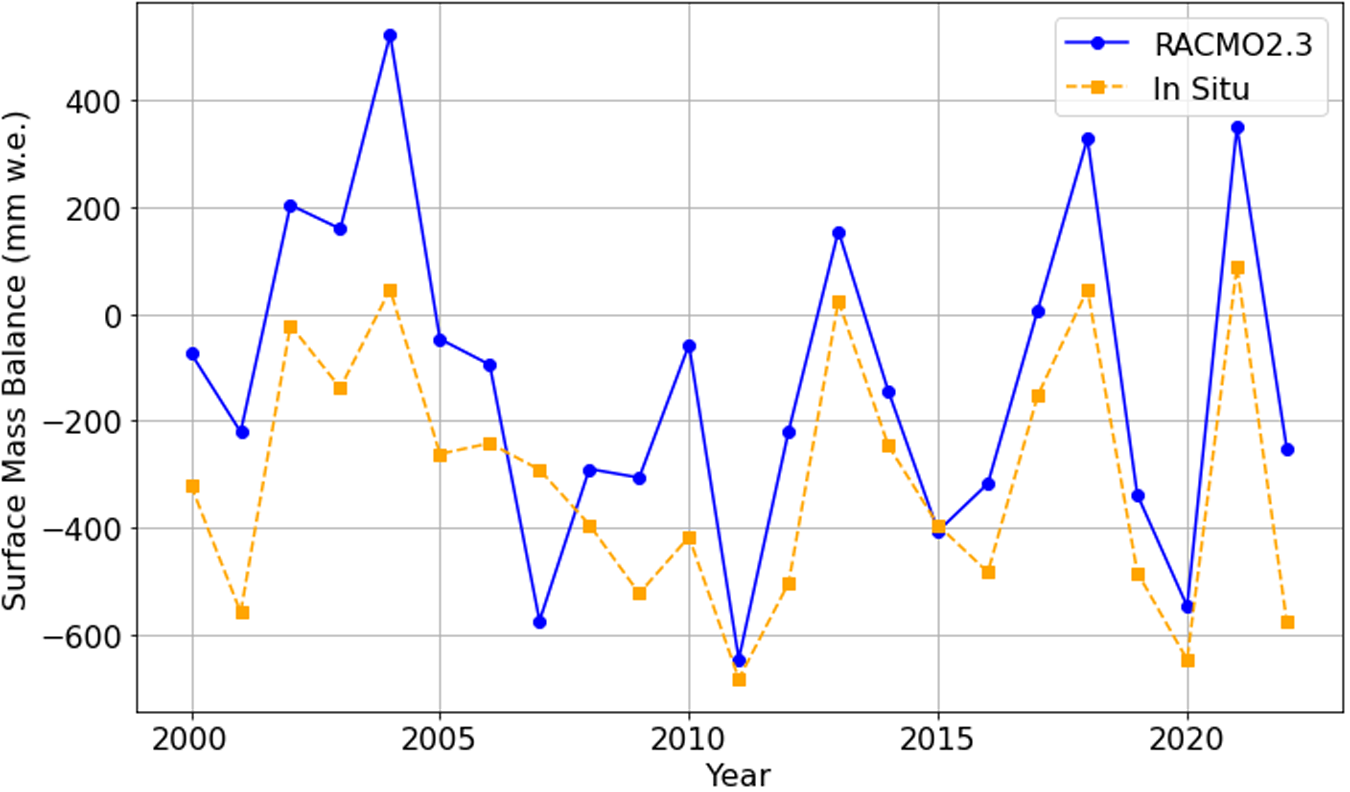
Figure 5. In situ SMB data along the northwest transect (yellow line) and RACMO2.3 SMB (blue line).
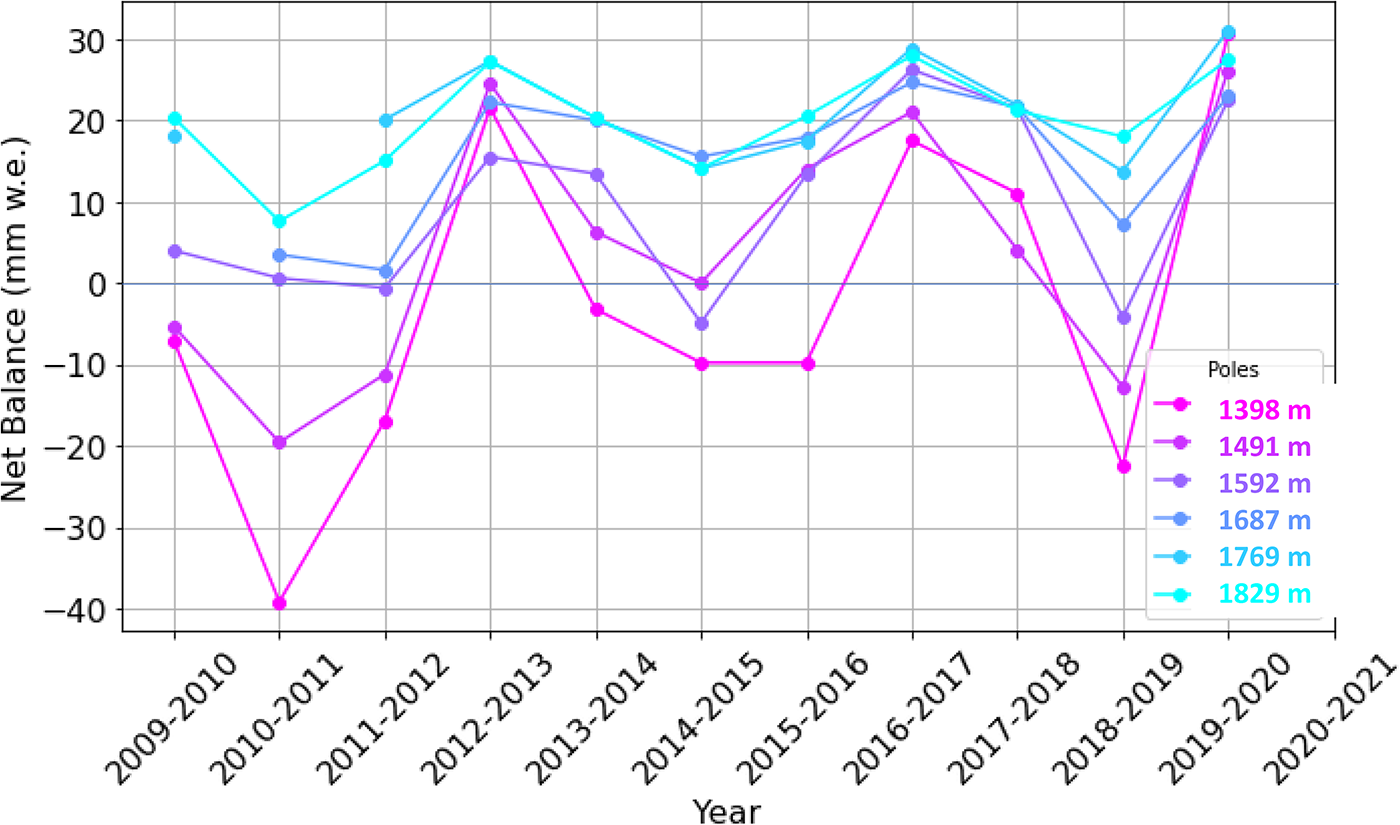
Figure 6. Annual SMB (mm w.e.) from the northwest transect at selected poles as denoted by their elevation from 2009 to 2021.
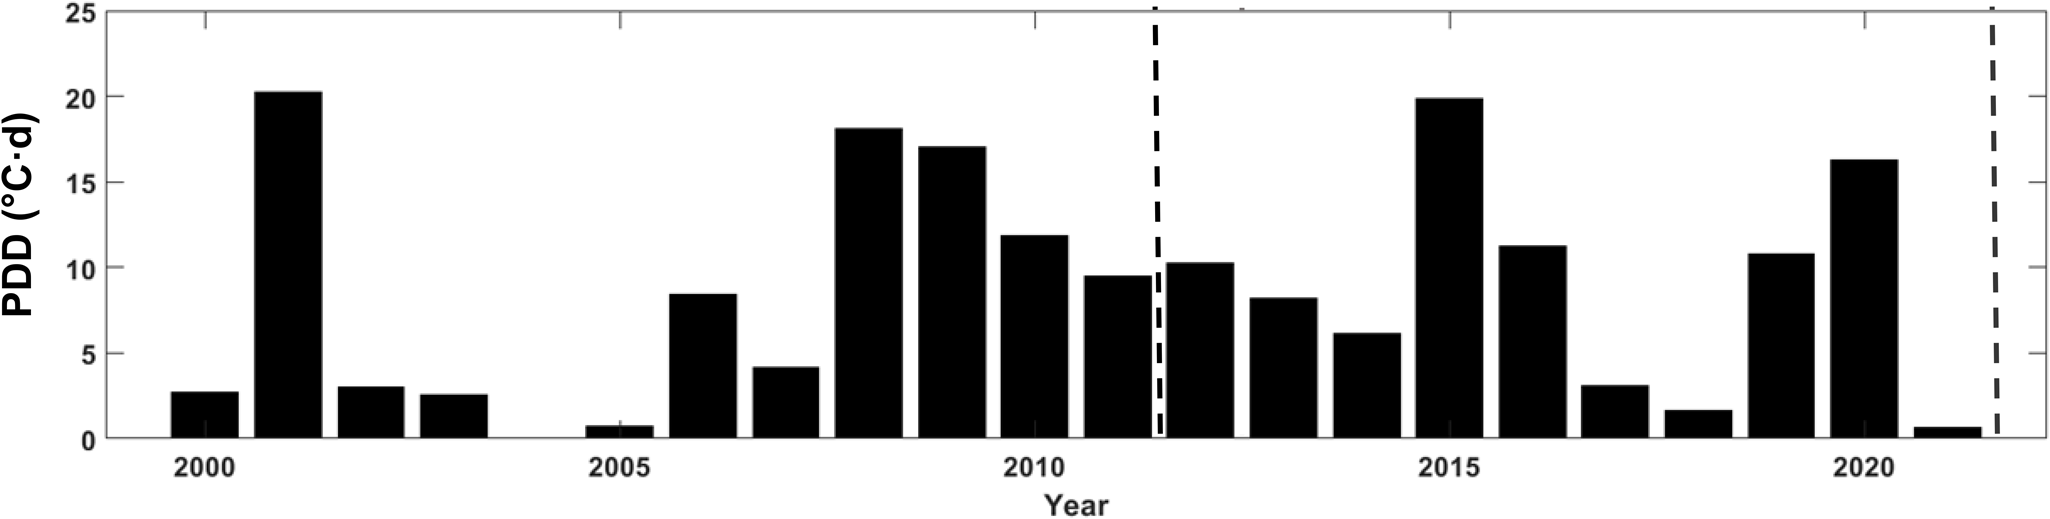
Figure 7. PDD ( $^{\circ}\mathrm{C}\cdot\mathrm{d}$) sums calculated from JJA daily air temperature averages measured at D1-1H station from 2000 to 2021. The dashed line indicates the firn core extraction year in 2012 and 2022.
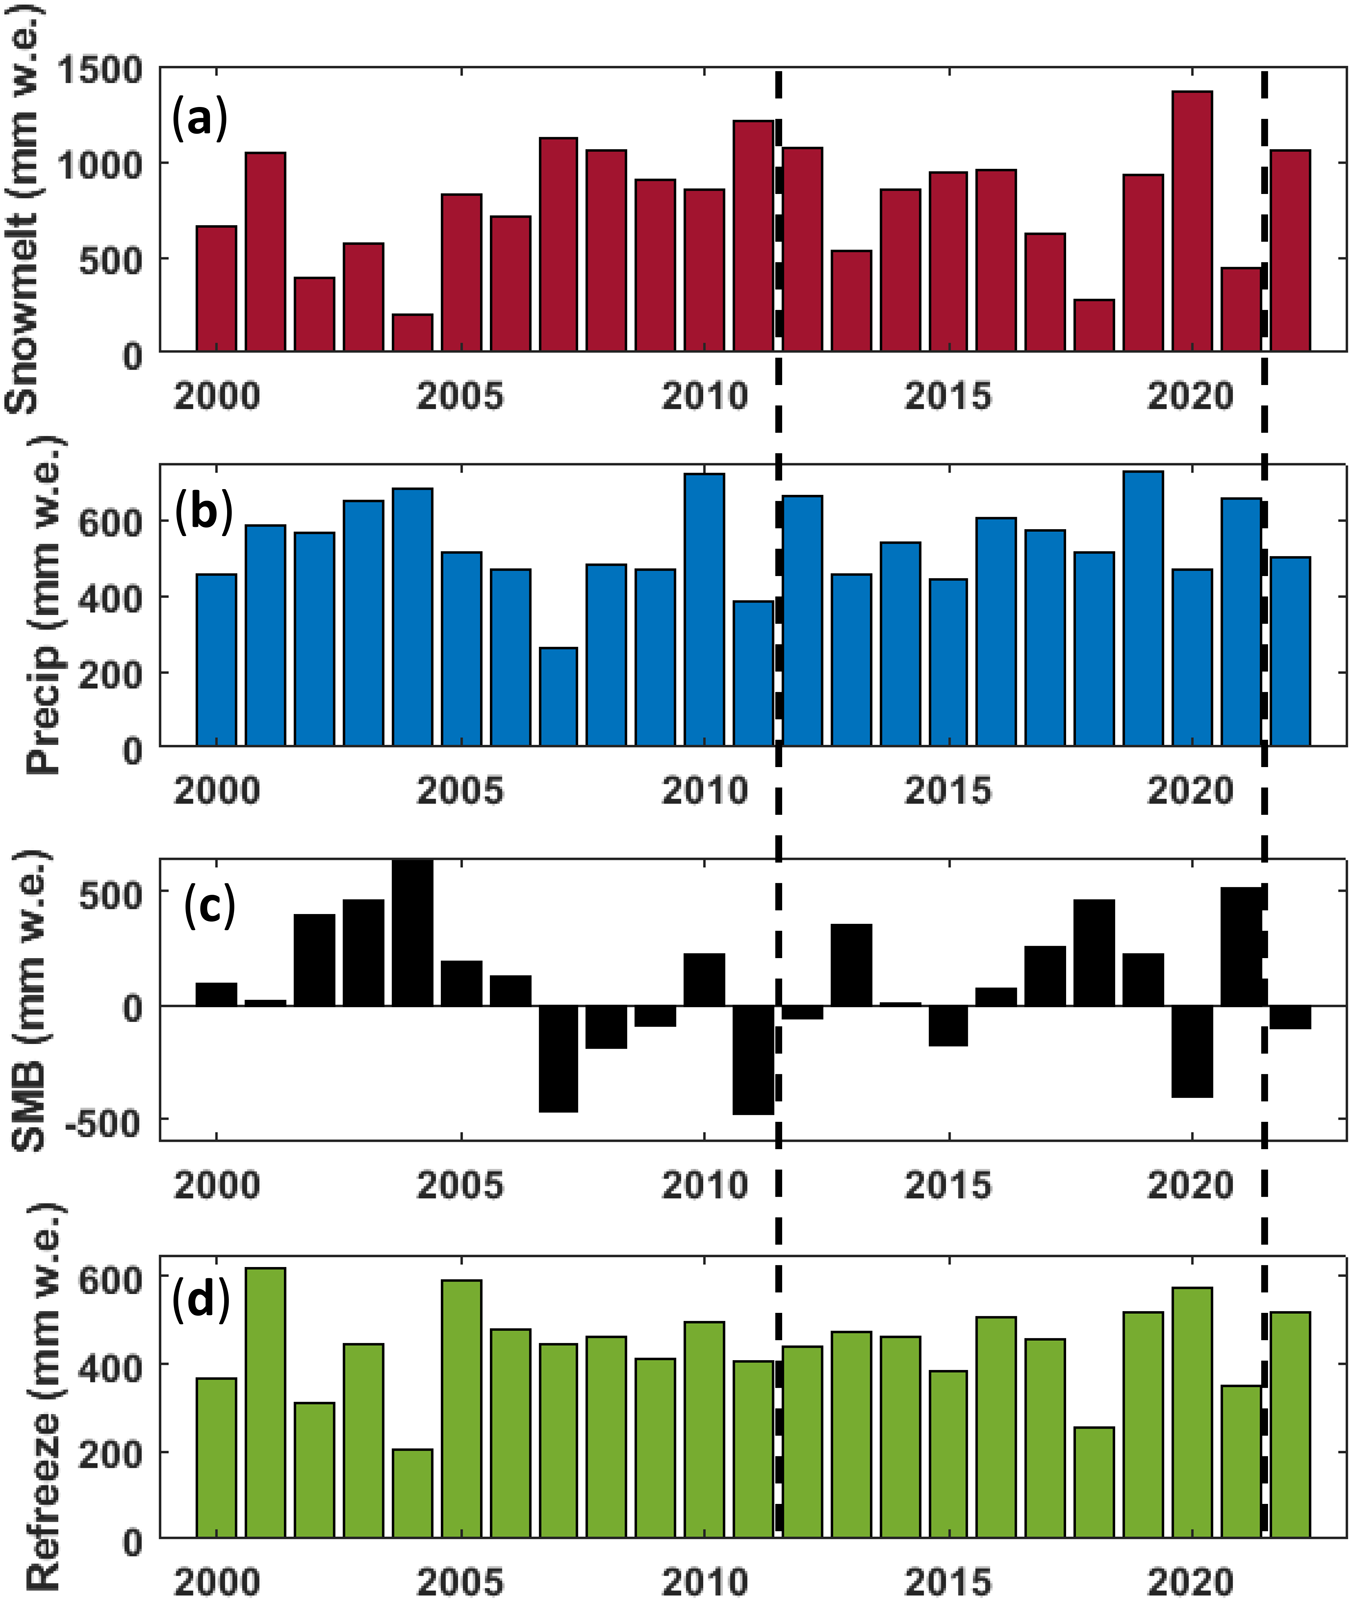
Figure 8. Annual sums of climate data from RACMO2.3 extracted within the accumulation area of the southwest DIC region (blue outline in Fig. 1c). The black dashed lines represent the year firn cores were extracted in 2012 and 2022. Annual sums of RACMO2.3 (a) snowmelt (including glacier ice), (b) precipitation, (c) SMB and (d) refreezing expressed in mm w.e. for the period 2000–22.
Modelled meltwater (snowmelt variable) produced at the surface can penetrate the firn layer following the tipping bucket model, where it is refrozen or stored depending on temperature and pore space. A more in-depth description of the processes occurring in the firn layer in RACMO2.3 can be found in Ettema and others (Reference Ettema, Broeke, Meijgaard, Berg, Box and Steffen2010), Ligtenberg and others (Reference Ligtenberg, Kuipers Munneke, Noël and van den Broeke2018).
AWS data provided by the Geological Survey of Canada is used for evaluating the accuracy of the RACMO2.3 air temperature modelled data and for calculating positive degree day (PDD) sums. PDD sums are calculated from the highest elevation AWS on DIC (D1-1H), where PDD sums are the JJA sum of the daily average temperatures exceeding the freezing point (0∘C). The PDD sums are plotted in Fig. 9 and are used as a proxy for summer air temperature.
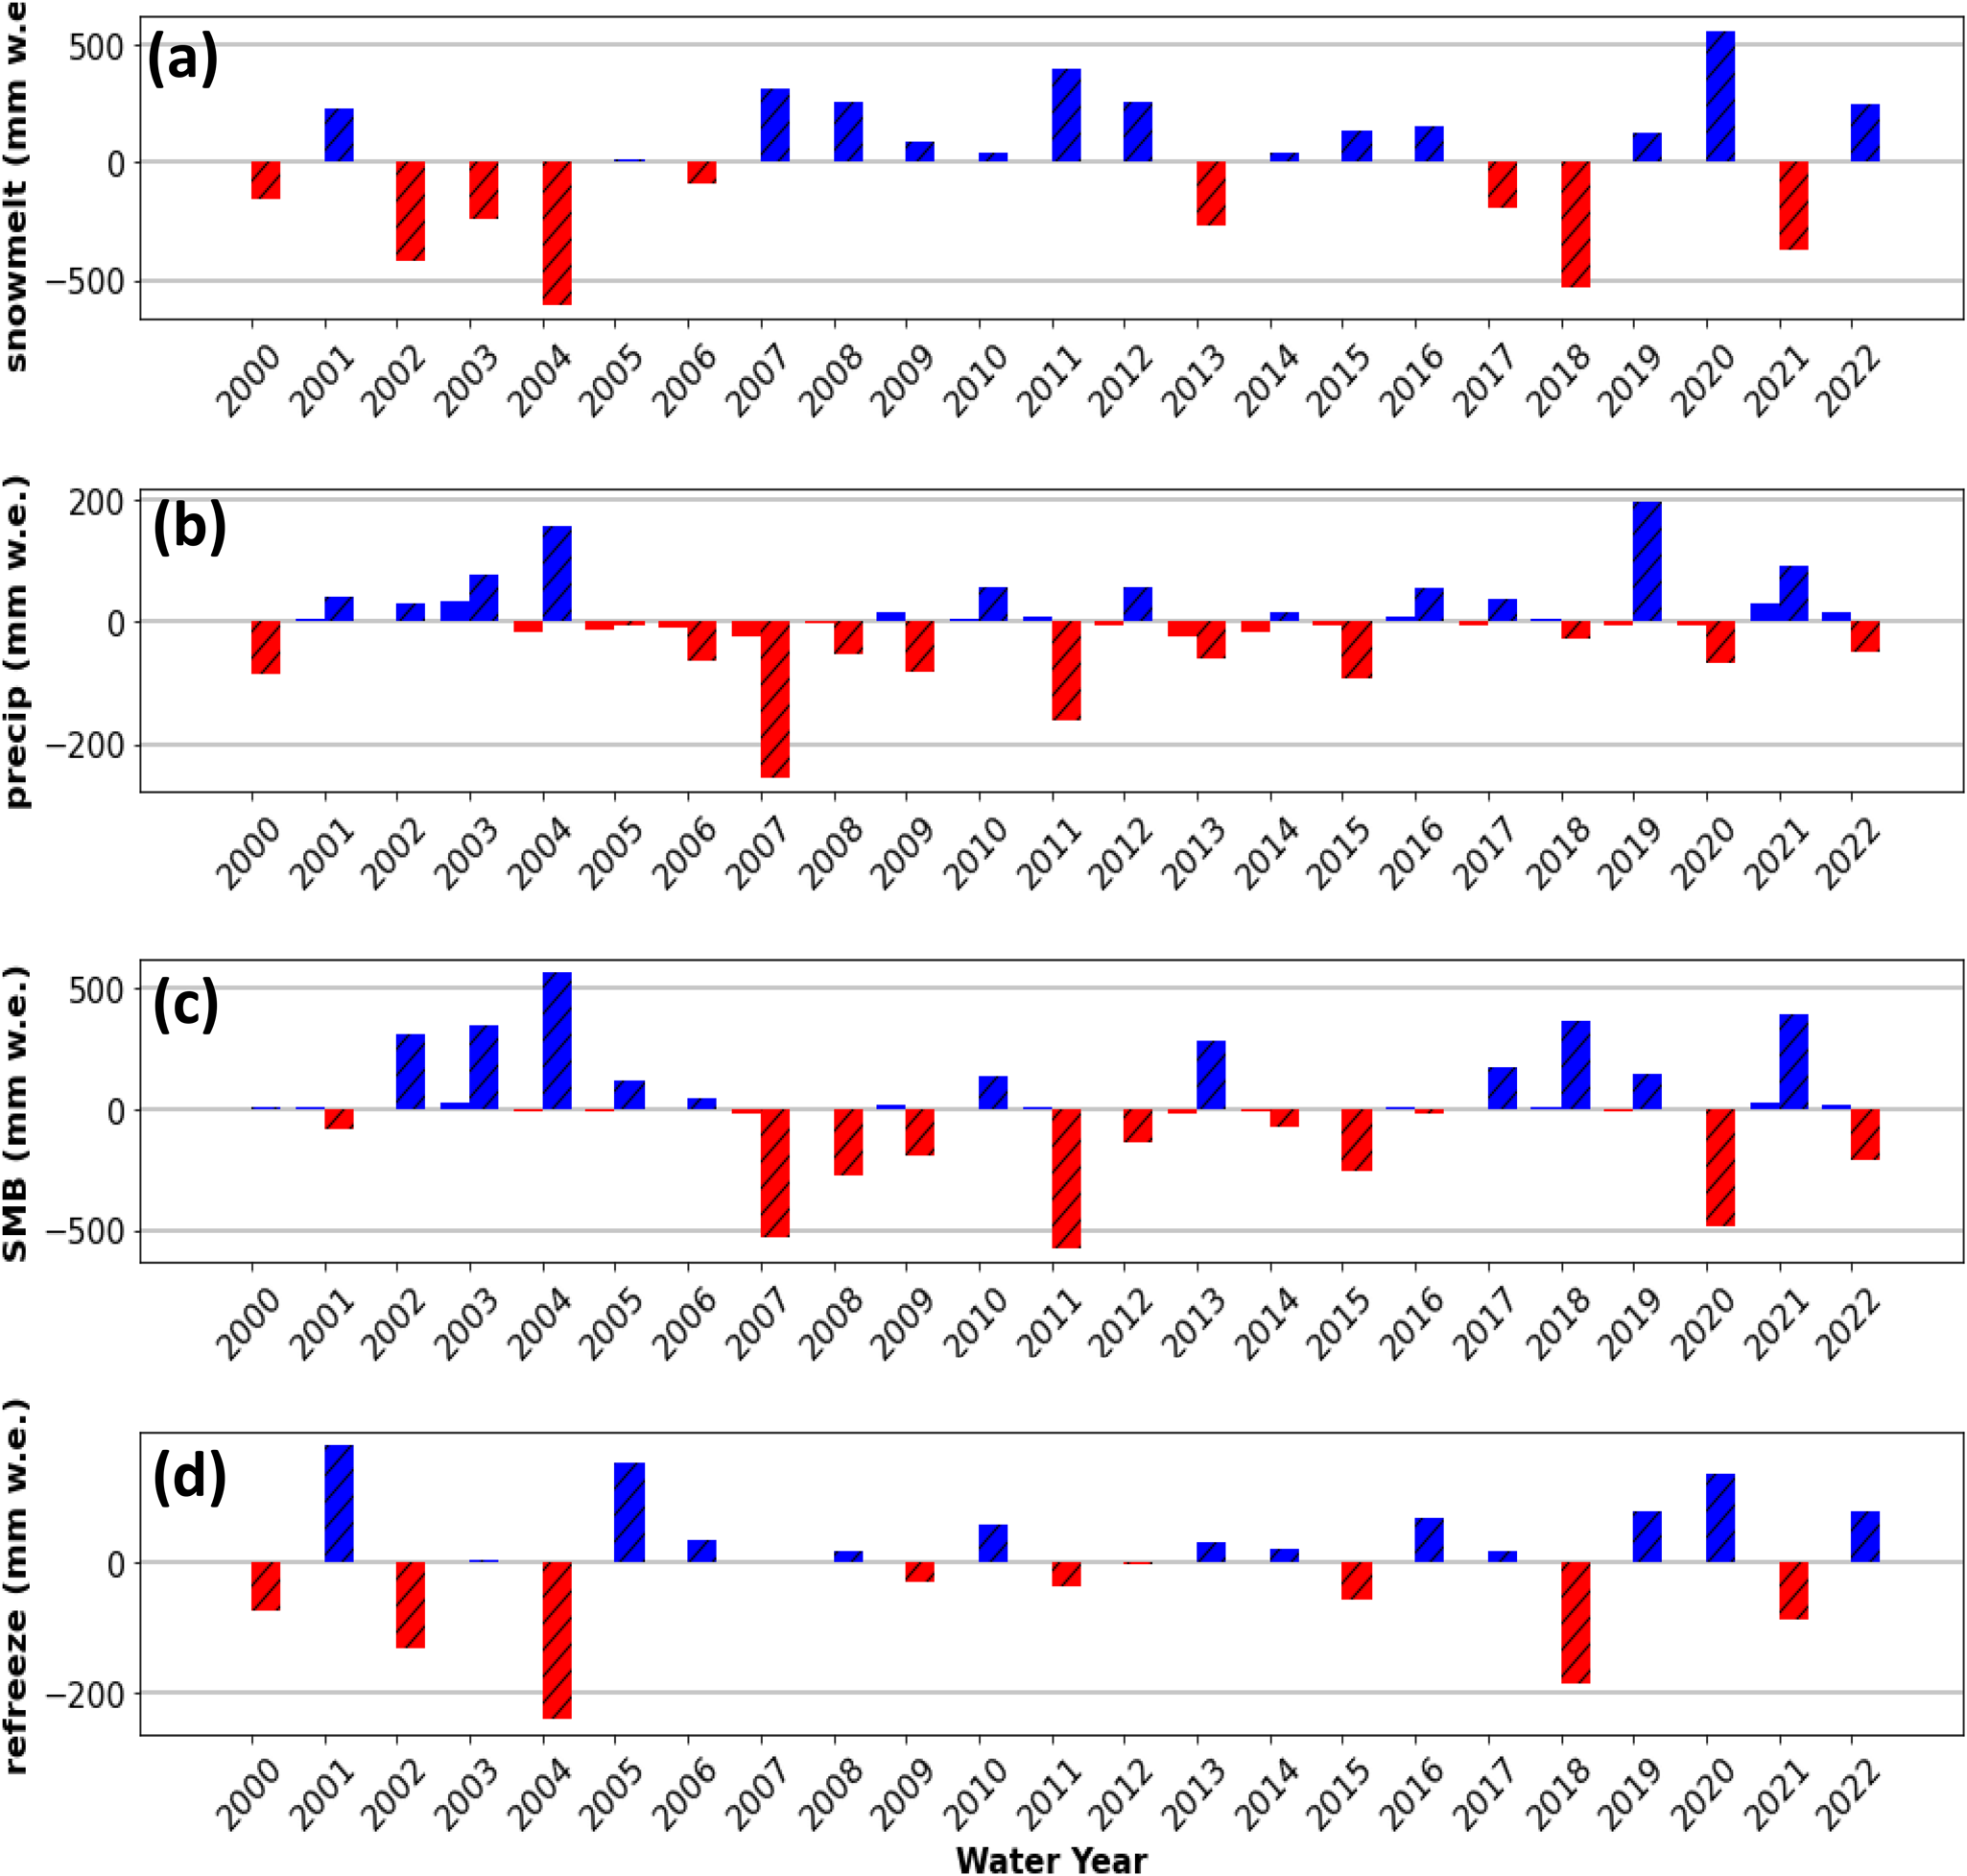
Figure 9. Anomalies of climate data from RACMO2.3 within the accumulation area of the southwest DIC region (blue outline in Figure 1c), plotted by melt season (solid colour bars) and non-melt (hashed pattern overlaid on the bar). Positive anomalies are blue and negative anomalies are red. Annual anomalies of RACMO2.3 (a) Snowmelt (including glacier ice), (b) precip, (c) SMB and (d) refreeze expressed in mm w.e. for the period 2000–22. All anomalies are respective to the 2000–22 average.
Three AWS are located in the accumulation area on the mass balance transect on DIC (Fig. 1). Each is equipped with a Campbell Scientific sonic distance ranger that measures surface changes every minute and the total over an hour. Near-surface air temperature is measured hourly with a Campbell Scientific thermilinear temperature probe located inside an RM Young radiation shield. The dataset begins in 1997 at site D1-1H, in 2000 at site D2-3F (with data gaps in 2002 and 2003,) and in 1999 at site D3-7D (with data gaps in 2003 and 2010) (Burgess, Reference Burgess2017). Gaps in these datasets were due to instrument failure or loss of station power. Due to the inconsistencies of the in situ dataset and distance from the southwest transect, climate model data from RACMO2.3 provide a consistent time series of near-surface air temperature (2 m) for the study period and for areas not covered by AWS.
3. Results
The following section presents the findings concerning the evolution of bulk density and IF between the firn cores extracted in 2012 and 2022.
3.1. Changes in average bulk density
Table 1 provides the measured bulk density of the cores collected. Since the length of the cores at the same location was not consistent for 2012 and 2022, bulk density was calculated for the shortest common length between the two pairs of cores at each location. The calculation of the bulk density provides quantitative evidence of the changes in density between the two-time points. All sites along the southwest transect showed a decrease in bulk density, except for Site 1. The average bulk density from all sites in 2012 was 670 kg m−3, while in 2022, the average was 582 kg m−3. Site 1 showed an increase in bulk density (comparing 264 cm core lengths) from  $460\,\mathrm{kg\,m}^{-3}$ in 2012 to 600 kg m−3 in 2022.
3.2. IF evolution from 2012 to 2022
Figure 4 shows the 2012 and 2022 firn stratigraphy plotted at the six sites along the southwest transect. Observations show that the location of the ice layers was present at greater depths in 2022 than in 2012 and a reduction in the thickness of ice layers, resulted in a lower IF between the two time periods.
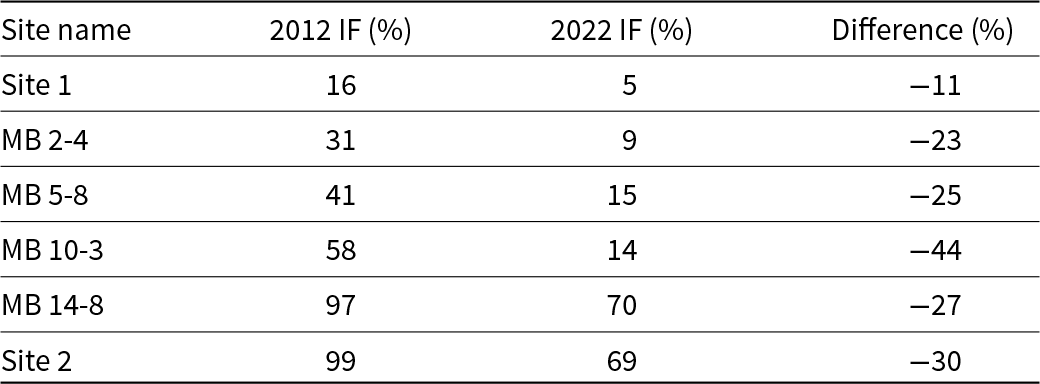
When comparing the lengths that were used (Table 1), the largest difference in IFs occurred at site MB 10-3 (1575 m a.s.l.), where the IF changed by 44% (Table 2). The second greatest change was observed at the lowest elevation site (Site 2, 1400 m a.s.l.), where the total IF changed from 99% in 2012 to 69% in 2022. Figure 10 also reflects the greatest changes taking place below elevations of 1575 m a.s.l. The least amount of change occurred at Site 1, where the ice content differed by 11% between 2012 and 2022.

Figure 10. Elevation vs IF for all sites from 2012 (orange) and 2022 (blue).
Table 1. Elevation (m a.s.l.), latitude/longitude (∘) in WGS 94 UTM Zone 17N coordinate system, core length (L) (cm), average bulk density (BD) (kg/m3) of firn cores from 2012 and 2022 and the difference (kg/m3) between the 2012 and 2022 bulk density
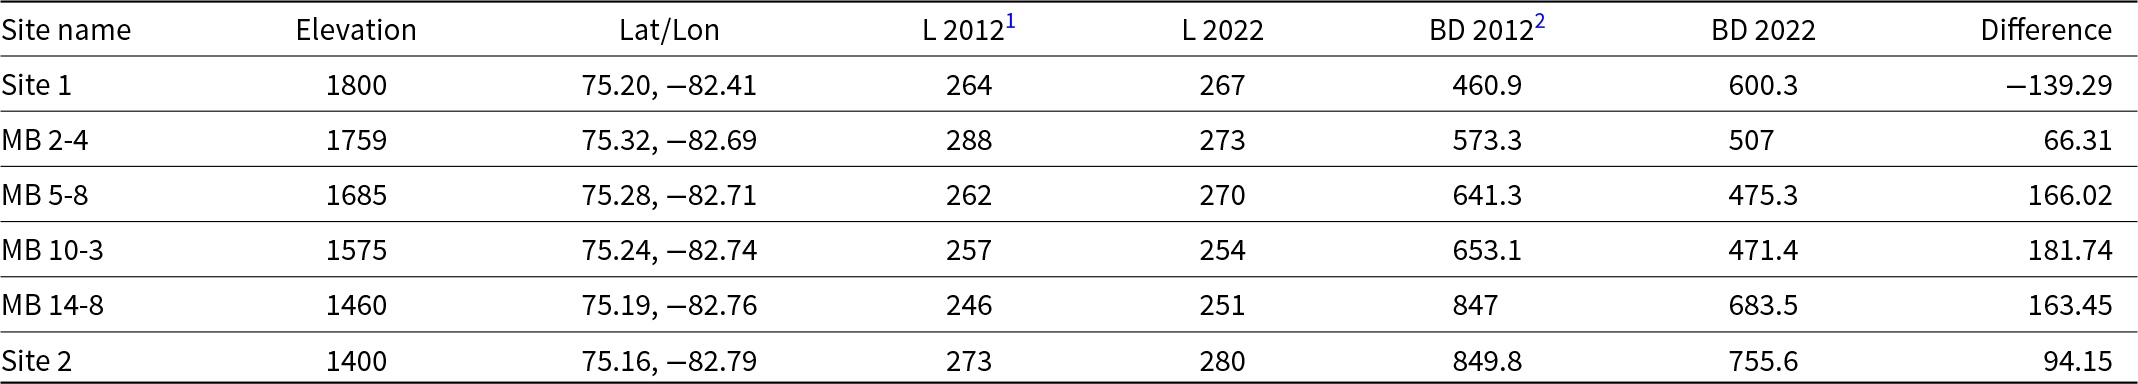
1 Core lengths from Bezeau and others (Reference Bezeau, Sharp, Burgess and Gascon2013) were used for comparison. 2Density values from Bezeau and others (Reference Bezeau, Sharp, Burgess and Gascon2013).
Table 2. IF (%) for all sites in 2012 and 2022 for the entire firn cores lengths (see Table 1 for lengths). The last column shows the difference between 2012 and 2022 IF, where negative values mean an increase in porous firn
3.3. Approximate time accumulated in firn cores
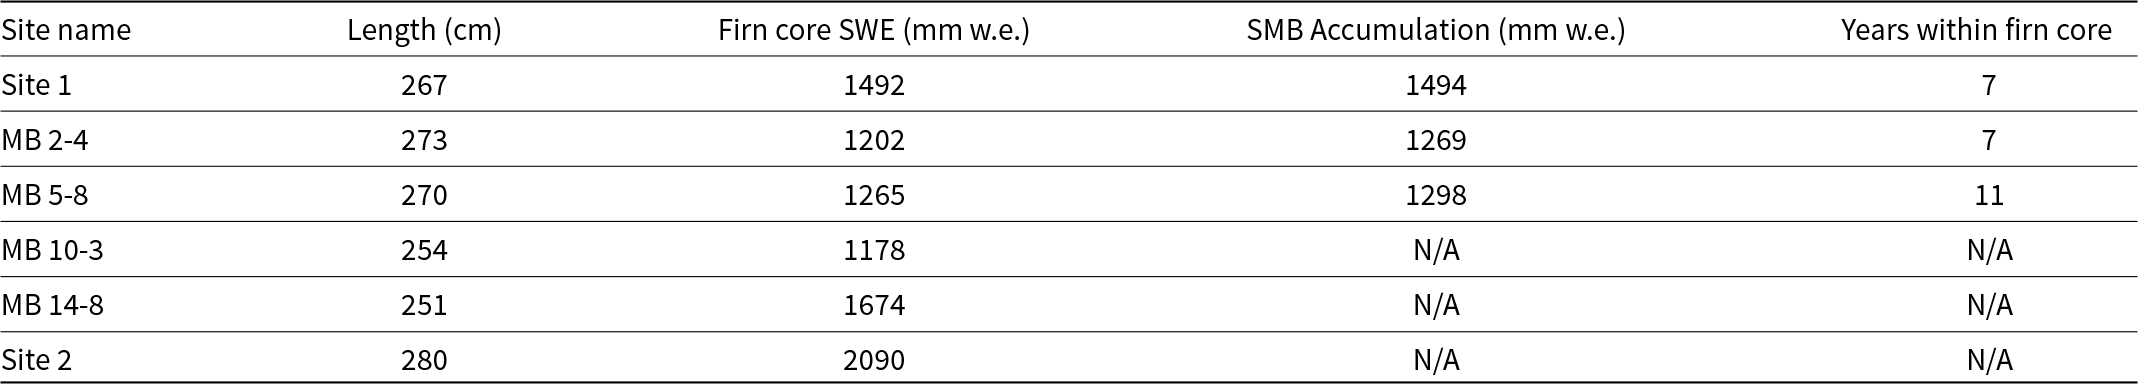
To estimate the time represented by the firn cores, we use SMB data from the NW transect, where the elevation closely matches that of firn cores from the southwest transect. We compare the net annual SMB at each pole to assess the relationship between the two basins, revealing a close agreement (standard deviation of ± 14 mm w.e.) at higher elevation poles (above 1300 m a.s.l.), indicating that the NW transect SMB data can represent accumulation within error at similar elevations along the Cryosat transect. We then plot the net annual SMB for each pole from the NW transect in Fig. 6 and use those yearly accumulation values to approximate the time-depth scale in each firn core. Additionally, last summer’s melt surface was identified by the depth-hoar layer in the stratigraphy (Fig. 4), but it could not be detected at sites below 1575 m a.s.l. and thus was not marked. Meltwater can affect the interpretation of time within the firn cores, making this more challenging at lower elevations along the transect. Table 3 summarizes the accumulation (in mm w.e.) from SMB data and estimates the corresponding years of accumulation within the firn cores, at sites with positive net SMB during the study period. At Site 1, the total accumulation from 2015 to 2021 was 1494 mm w.e., closely matching the 267 cm long firn core that accumulated 1491 mm w.e. of snow, representing ∼7 years of accumulation. From 2015 to 2021, total accumulation at MB 2-4 was 1269 mm w.e., with the 273 cm firn core containing 1202 mm w.e., representing roughly 7 years of accumulation. At MB 5-8, the 270 cm firn core contains 1265 mm w.e., corresponding to about 11 years of accumulation from a total of 1298 mm w.e.. Approximating time within the lower elevation firn cores is more challenging due to negative SMB, which obscures the accumulation signal. Previous work on the DIC has identified accumulation rates of 0.18 m w.e./yr (Gascon and others, Reference Gascon, Sharp, Burgess, Bezeau and Bush2013) and noted that the top 18.5 m is minimally influenced by deformation (Colgan and Sharp, Reference Colgan and Sharp2008).
Table 3. Firn core sites from 2022, their length (cm), snow water equivalent (mm w.e.), amount of accumulation from in situ SMB data on the NW transect and approximation of the time-depth scale of the firn cores from 2022. N/A values are for the sites where it was not possible to approximate time accumulated in the firn core
3.4. Positive degree days
In this section, we focus on JJA PDD sums plotted in Fig. 9. Between 2000 and 2011, the JJA PDD sums averaged 8.2 $^{\circ}\mathrm{C}\cdot\mathrm{d}$ with the fourth highest JJA PDD sum in 2008 (16 $^{\circ}\mathrm{C}\cdot\mathrm{d}$). The period between 2005 and 2011 contained the third lowest JJA PDD sum of 0.7 $^{\circ}\mathrm{C}\cdot\mathrm{d}$ in 2005. In comparison, between 2012 and 2021, the average JJA PDD sum per year is 8.8 $^{\circ}\mathrm{C}\cdot\mathrm{d}$. While between 2000 and 2021, the second and third highest JJA PDD sums were 2020 (16.3 $^{\circ}\mathrm{C}\cdot\mathrm{d}$) and 2015 (19.4 $^{\circ}\mathrm{C}\cdot\mathrm{d}$). Finally, 2021 was the second lowest JJA PDD sum year, with a total of 0.6 $^{\circ}\mathrm{C}\cdot\mathrm{d}$. Overall, the period post-2012 has on average higher JJA PDD sums than 2000–2012 but a low JJA PDD sum the year before the firn cores were extracted in 2022.
3.5. Changes in RACMO2.3 SMB components between 2000 and 2022
Here we compare the annual sums of SMB, refreezing, snowmelt and precipitation conditions between 2000 and 2022 for the accumulation area of the southwest transect. Figure 7a–d displays the RACMO2.3 modelled data from the southwest basin (blue contour in Fig. 1c), and Fig. 8a–d plots the anomalies for SMB and precipitation for all months of the year and the summer months of JJA for refreezing and snowmelt.
The six years from 2005 to 2011, leading up to the 2012 firn core stratigraphy were characterized by negative SMB and positive snowmelt anomalies for all summers. Where 2011 was the most negative SMB (−476.6 mm w.e.) and second highest snowmelt (1211 mm w.e.) year in 2000–22. Of that total modelled snowmelt, 406.4 mm w.e. refroze within the firn layer, while 386.2 mm w.e. of solid precipitation accumulated in 2011.
In comparing SMB, snowmelt, precipitation and refreezing conditions preceding 2022, the highest year of snowmelt is 2020 (1369.7 mm w.e.). In contrast, precipitation in 2020 is relatively low at 466.6 mm w.e. Following the intense melt year of 2020 is the low melt year of 2021 with negative anomalous values in JJA and a total melt of 440.9 mm w.e. Additionally, between 2015 and 2021, melt seasons of 2017, 2018 and 2021, all exhibited positive SMB anomalies during the melt season (Fig. 8a), a phenomenon that had not occurred in the southwest basin since 2002–04.
The first and second highest refreezing values occurred in 2001 and 2005, amounting to 621.2 and 593.3 mm w.e. of meltwater retained as internal accumulation, respectively. In 2020 and 2022, 576.2 and 517.9 mm w.e. refroze into the firn layer, respectively.
4. Discussion
4.1. Lower IF on DIC in 2022 than 2012
Our results (Fig. 4) demonstrate less IF at all sites on DIC between 2012 and 2022, in contrast to the findings of earlier work published in 2013 that studied the firn layer on DIC from 2004 to 2012. For example, Bezeau and others Reference Bezeau, Sharp, Burgess and Gascon(2013) collected firn core data in 2012 and compared them with similar measurements made in 2004/2005 and found an increase in IF of 13–80% across all higher elevation areas of the ice cap (1400–1800 m a.s.l.).
To compare the differences in SMB and air temperature for the two periods, we approximate the time-depth relationship within the firn cores and list the result in Table 3. We estimate ∼7–11 years are accumulated within the cores in 2022. Therefore, we examine the SMB components from the past 20 years, due to ∼10 years of accumulation of the firn cores in 2022 and investigating SMB components 10 years before 2012. The period preceding the 2012 firn core extraction was characterized by sustained and consistent negative SMB on DIC, with SMB conditions generally becoming increasingly negative year over year (Fig. 1b). In contrast, a comparison of our firn cores extracted in 2022 with those collected in 2012 reveals less IF at all sites (an average of 26% less) during a period where several summers were cool, resulting in less depletion of the firn layer compared to years before 2012. For example, near balance or positive SMB was observed on DIC in 2013, 2018 and 2021 (distinct from 2004 to 2011 period when no positive SMB was observed), while 2015, 2019 and 2020 were some of the most negative SMB years on record (Fig. 4a). High winter accumulation (positive SMB) and anomalously low summer melt are both conditions to increase firn pore space and lower the IF. However, we argue that the lower IF evident in our results is due to the presence of cooler summers on DIC, between the 2012 and 2022 periods of firn core extraction. As shown in Fig. 9, low PDD values were observed in 2013, 2018 and 2022 which contributed to low IF. This is supported by Fig. 8 which shows the positive SMB anomalies and negative snowmelt anomalies observed in the same years. This implies that a decrease in the IF of the firn layer is possible on DIC when cooler summer air temperatures occur, and this demonstrates the sensitivity of the IF within the firn layer to interannual variability of surface air temperature and SMB conditions. In addition, a positive precipitation anomaly in 2021 contributed to the lower IF in 2022, through increasing the firn pore space from accumulated snow (Vandecrux and others, Reference Vandecrux2018). The cold period identified here is congruent with Koerner Reference Koerner(1977) who recorded an absence of melt in the firn zone in the mid-1960s when the CAA was characterized by a lack of high summer air temperatures. Koerner (1977) similarly, quantified changes in IF and observed a decrease in firn density during the mid-1960s.
The most significant finding of our work is that there has not been an irreversible increase of IF on DIC, and a lower IF can occur in as little as one year of cooler and near positive SMB conditions. However, it should be noted that the occurrence of a lower IF in the shallow firn layer from one cooler summer could be interrupted through a subsequent warmer summer (Thompson-Munson and others, Reference Thompson-Munson, Kay and Markle2023). Therefore, by integrating both short-term (one year) and longer-term (multi-year) analysis, our findings emphasize the complex interplay between firn layer processes and climatic variability on DIC.
An unexpected result was observed at Site 1 in 2022, where the IF decreased while the bulk density increased compared to 2012, deviating from trends at other sites. We hypothesize that this could be attributed to changes in the microstructure of the firn, influenced by a two-way feedback mechanism between meltwater infiltration and firn properties. As shown by McDowell and others Reference McDowell, Keegan, Wever, Osterberg, Hawley and Marshall(2023), meltwater infiltration can modify the firn microstructure by promoting grain growth and altering stratigraphic transitions. This process can result in coarser grains and denser firn, even as IF decreases due to limited vertical percolation and heterogeneous meltwater retention. Field photos from 2022 (Fig. S6) qualitatively support this hypothesis, suggesting a transition from finer grains in earlier years to coarser grains more recently, consistent with processes from increased meltwater percolation and associated firn metamorphism. Air temperature data from D1-1H, a station at a similar elevation to Site 1 (Fig. 4), further supports this interpretation, showing an increased frequency of above-freezing temperatures post-2012, conditions conducive to meltwater infiltration and firn grain evolution. However, direct measurements of firn crystal sizes from both periods would be required to confirm this mechanism. This finding underscores the importance of the microstructure of the firn and the interactions with meltwater in shaping bulk density and IF.
4.2. Comparison to previous work on decrease in IF in firn
The lower IF of the firn layer reported here is not unique to DIC. Similar findings were observed along several transects on the southwest of the Greenland Ice Sheet from 1989 to 2019 (Rennermalm and others, Reference Rennermalm2022), where the firn layer has previously shown a long-term (1989–2012) trend of increasing bulk density and IF (Machguth and others, Reference Machguth2016; Mikkelsen and others, Reference Mikkelsen2016). However, when comparing firn core density and IF between 2013 and 2019, a decrease in density and IF of 7–18% was measured in the upper 3.75 m of the firn column. Consistent with our results, Rennermalm and others Reference Rennermalm(2022) show that within a trend of negative SMB and increasing glacier melt, a decrease in IF within the firn layer is possible and can temporarily build up firn pore space. Other studies from Greenland have found that replenishment of the firn layer can occur with an increase in snowfall and can explain up to 72–95% of the variance in density of firn in the near-surface (Vandecrux and others, Reference Vandecrux2018). In contrast, an increase in meltwater in one year can drastically alter the firn structure, density and air content due to changes in melt, resulting in a higher prevalence of ice lenses at higher elevations (Machguth and others, Reference Machguth2016; Mikkelsen and others, Reference Mikkelsen2016; Vandecrux and others, Reference Vandecrux2018). Our results reflect those of Thompson-Munson and others Reference Thompson-Munson, Kay and Markle2023, who also found that cooler air temperatures reduce surface runoff by increasing firn air content and meltwater storage on the Greenland Ice Sheet. However, they expand by saying that it does not buffer meltwater in the long term and that the firn layer on the Greenland Ice Sheet is more sensitive to warming than cooling. This means that on DIC, warmer summers will deplete more rapidly any pore space within the firn layer than that would be generated from a cooler summer.
Our results align with the modelled evidence of firn pore space replenishment on DIC, which found Ashmore and others Reference Ashmore, Mair and Burgess(2019). Their study modelled the vertical growth of the firn layer on DIC from 2001 to 2016 and showed that in years of negative SMB (2008 and 2011), decreased rates of refreezing were observed in subsequent years across all depths. Consistent with our study of the firn layer in 2022, Ashmore and others Reference Ashmore, Mair and Burgess(2019) showed that during a positive SMB year (2016), the firn layer’s pore space increases along the southwest transect through burying previously formed ice layers and from less melt occurring in the shallow firn pack.
4.3. Broader implications of firn layer depletion
In contrast to the firn conditions on glaciers in the Northern CAA, the firn buffers of GIC in the Southern CAA have been depleted (Noël and others, Reference Noël, Van de Berg, Wouters, Vanden Broeke, Lhermitte and Schaffer2018), offering insights into the potential evolution of the DIC firn layer under future climate warming. For example, Penny Ice Cap located in the Southern CAA is the largest ice cap on Qikiqtaaluk (Baffin Island) (6300 km2) and has a summit elevation of ∼1930 m a.s.l, which is comparable to the summit elevation of DIC. Penny Ice Cap experienced a near doubling of the volumetric percentage of ice content in the shallow firn layer between 2011 and 2013 (Schaffer and others, Reference Schaffer, Copland, Zdanowicz, Burgess and Nilsson2020) and an increase in firn densification that led to a 28% reduction in the refreezing capacity (Noël and others, Reference Noël, Van de Berg, Wouters, Vanden Broeke, Lhermitte and Schaffer2018). Recent work predicts that Penny Ice Cap will be nearly firn-free by 2100 (Schaffer and others, Reference Schaffer, Copland, Zdanowicz and Hock2023). These long-term trends in firn densification on Penny Ice Cap are primarily driven by increasingly positive air temperature anomalies in recent decades (Zdanowicz and others, Reference Zdanowicz, Smetny-Sowa, Fisher, Schaffer, Copland, Eley and Dupont2012). Between 2000 and 2020, a study on Qikiqtaaluk glaciers showed negative SMB conditions (−33.6 ±10.8 Gt yr−1) coupled with an increase in runoff (52.8 ±10.9 Gt yr−1), in comparison with 1975–95 when mean SMB was −18.9 ±10.8 Gt yr−1 and mean runoff was 36.8 ±11.2 Gt yr−1 (Maure and others, Reference Maure, Kittel, Lambin, Delhasse and Fettweis2023). Similarly, Maure and others Reference Maure, Kittel, Lambin, Delhasse and Fettweis(2023) shows that DIC has followed the same trend as PIC, where a decrease in SMB is a consequence of higher runoff. We have shown that cooler summers enable a lower IF, however, our results show that cooler summers are becoming less frequent (Fig. 9). Current projections of SMB do not account for diminishing firn pore space (Rounce and others, Reference Rounce2023) and there are fewer anomalously cool summers. We therefore may see more rapid mass losses on DIC and other high-latitude glaciers than is currently projected as the frequency of anomalously cool summers declines and firn is depleted faster.
It should be noted that the lower IF in the shallow firn layer can only increase the capacity for retention to a certain extent, due to pre-existing ice layers that have formed in years of high melt and low SMB years. Consequently, when meltwater reaches these buried ice layers, the meltwater can runoff horizontally instead of refreezing in the firn layer (MacFerrin and others, Reference MacFerrin2019). This suggests that the capacity for pore space regeneration in the firn layer is limited, as buried ice layers can act as barriers, preventing the retention and storage of additional meltwater. For instance, in warmer years with increased meltwater production, meltwater initially refreezes and is stored, but as ice layers fill all available pore space, retention capacity is exceeded, leading to runoff (Pfeffer and others, Reference Pfeffer, Meier and Illangasekare1991).
The future evolution of polar ice caps like DIC and their contributions to sea level rise, depend on their refreezing capacity and the point at which the firn layer can no longer store meltwater, known as peak refreezing (Noël and others, Reference Noël, Lenaerts, Lipscomb, Thayer-Calder and van den Broeke2022). Modelling scenarios for peak refreezing of the Greenland Ice Sheet conducted by Noël and others Reference Noël, Lenaerts, Lipscomb, Thayer-Calder and van den Broeke(2022) showed that under cooler climate scenarios, refreezing stabilizes, whereas under high-end warming scenarios, refreezing peaks and irreversibly declines by the mid-2100. Due to the hypsometry of DIC, the timing for peak refreezing could be reached much earlier than projected for the Greenland Ice Sheet, particularly under warmer climate scenarios. Therefore, years with cooler air temperatures interspersed within the overall warming trend in the Arctic are essential to enable the firn layer to act as a buffer against runoff contributions to sea level rise. Recent cooler air temperature trends in the CAA have been attributed to temperature variability driven by the meridionalization of atmospheric circulation patterns (Sasgen and others, Reference Sasgen2022) and may continue to persist within the near future. Considering these current climate patterns, IF on DIC in the shorter term (several decades) is likely to contain periods of decrease interspersed throughout an overall trend of increase in density and IF of the firn layer.
Since the study was limited to field data collection, it was not possible to conduct a full spatial and temporal assessment of the firn layer. This means that information concerning annual variations and local intricacies of changes in the firn layer over the 10-year study period was not possible but rather we provide a demonstration of the broad evolution of the firn layer on DIC from 2012 to 2022.
5. Conclusion
We investigate the evolution of the shallow firn layer on DIC through the analysis of six shallow firn cores collected in the field in 2012 and 2022. Our most significant finding shows that the IF of the shallow firn layer was less over this period, contrasting with previous literature that showed an increase in IF in the prior decade. This is the only empirical investigation into the impact of recent air temperature and SMB variability on DIC, combining field measurements with high-resolution RACMO2.3 climate model data and contributing to the understanding of the evolution of DIC shallow firn layer in a changing climate. Specifically, we demonstrate the non-linear characteristic of the firn layer to undergo a reduction in IF after several interspersed years of positive SMB conditions and negative air temperature anomalies.
Future work should focus on understanding larger climate patterns over DIC, which will be essential for understanding when cooler summers are expected to occur, to predict future buffering capacity of the firn layer, associated sea level rise and freshwater outputs from DIC. More data points from other CAA ice caps would help to establish the degree of spatial variability and impact on the shallow firn layer across this region during cold periods. Overall, this study contributes to our understanding of how the shallow firn layer in DIC has evolved in response to changing climate conditions. The findings emphasize the vulnerability and resiliency of Arctic GIC to ongoing climate change and provide valuable data points for future modelling and predictions of sea level rise in the CAA.
Supplementary material
The supplementary material for this article can be found at https://doi.org/.10.1017/jog.2025.39.
Data availability statement
The firn core data from 2022 is available online at the Polar Data Catalog: https://doi.datacite.org/dois/10.21963%2F13382.
Acknowledgements
The authors wish to acknowledge funding for D.H. from POLAR, Northern Scientific Training Program, Ontario Graduate Scholarship, University of Waterloo and W.v.W from the Canada Foundation for Innovation, Province of Ontario, NSERC Discovery Grant Program, Environment and Climate Change Canada. B.N. is a Research Associate of the Fonds de la Recherche Scientifique de Belgique F.R.S.-FNRS. We acknowledge three anonymous reviewers for their insightful and constructive comments that helped greatly improve this manuscript.
Competing interests
All authors declare there are no competing interests for the article.


 Open access