


Introduction
The policy: the two-child limit in eligibility for social security payments in the UK
In the UK, social security policy is a key means of redistributing resources to reduce and prevent poverty. This includes welfare payments, some of which include a component that pays a given amount for each child in a household, known as the ‘Child Element’. In its 2015 summer budget the UK government introduced the two-child limit to social security policy, which said that ‘[t]he Child Element of tax credits and Universal Credit will no longer be awarded for third and subsequent children born after 6 April 2017’ (HM Treasury, 2015). The policy did not affect Child Benefit, which is a smaller payment made to all parents with eligible immigration status in respect of all children.
Tax credits and Universal Credit (UC) are means-tested conditional cash transfers. The Child Element is currently worth £288 per month per eligible child, and the two-child limit amounts to a reduction of around £3,455 per third or higher-order child per year (originally £2,780 per child per year) (Kennedy et al., Reference Kennedy, Bate and Keen2017). There is clear evidence that the policy is associated with increasing already high levels of poverty among larger families in the UK (Chzhen and Bradshaw, Reference Chzhen and Bradshaw2024). Although there has been a recent change in UK Government, the new administration has thus far resisted calls from across the political spectrum to abandon the two-child limit to reduce child poverty (Johnson, Reference Johnson2024).
The reason for the policy
When announcing the two-child limit, the government stated that, to promote fairness, it ‘believes that those in receipt of tax credits [and Universal Credit] should face the same financial choices about having children as those supporting themselves solely through work.’ In 60 per cent of households that lose money through this policy, at least one adult is working (Department for Work & Pensions and HM Revenue & Customs, 2023).
Child-related welfare payments and fertility decisions
To meet its goal without increasing poverty, the two-child limit policy would have needed either to make parents on low incomes with two or more existing children less likely to have a further child or to increase earnings among those parents. All contraceptive methods except abstinence have a failure rate, and given that only 55 per cent of pregnancies in the UK are planned (Wellings et al., Reference Wellings, Jones, Mercer, Tanton, Clifton, Datta, Copas, Erens, Gibson, Macdowall and Sonnenberg2013), facing the same choices about having children includes the option to abort a pregnancy for parents who could not or did not increase their earnings prior to conception. Increased abortion would therefore have been an implied component of the success of the two-child policy.
Reader, Portes and Patrick’s analysis of fertility effects of the two-child limit showed a negligible decrease in fertility among larger families subject to the limit (Reader et al., Reference Reader, Portes and Patrick2022). This contrasted with studies in France (Guy and Bernard, Reference Guy and Bernard2014) and the UK (of social security reforms in 1999) (Brewer et al., Reference Brewer, Ratcliffe and Smith2012) that showed fertility levels were responsive to increases in social security support for children. A recent study from Germany of the effect on fertility of removing child-related social security payments found some fertility decrease in response to this change (Sandner and Wiynck, Reference Sandner and Wiynck2023), although this was not disaggregated by number of children. The fertility response to welfare payments was smaller than that typically seen in response to whole-population child-related payments.
Temporal association between the policy and number of abortions
Among the proximate determinants of fertility in the UK, investigating changes in sexual activity or the extent and quality of contraceptive practice in response to changes in policy is not possible owing to limitations of available routine data. (The National Survey of Sexual Attitudes and Lifestyles collects high-quality data but runs every ten years, meaning we cannot use it to explore acute policy responses.) By contrast, data on the number of abortions are reliable, as abortion is a legally regulated procedure in England, Scotland and Wales, with mandatory reporting by healthcare providers.
In England and Wales there was a large and sustained rise in the number of abortions annually that coincided with the two-child limit’s entry into force. From a plateau of around 185,000 abortions annually in 2012–2016, the number increased by around 5,000 each year from 2017 to 2021 (reproduced in Fig. 1) (Office for Health Improvement and Disparities, 2024). This notable change in trend was of a similar magnitude to the estimated small reduction in fertility observed by Reader et al. (Reference Reader, Portes and Patrick2022). The authors noted that there did not appear to be changes in the trend in abortions among people with two or more children, for whom ‘existing trends […] do not appear to have shifted substantially at the time of the policy change’ (p. 22). This conclusion was based on trends in aggregate data that did not allow for variation by socio-economic position and may have masked an association among a subset of the population.
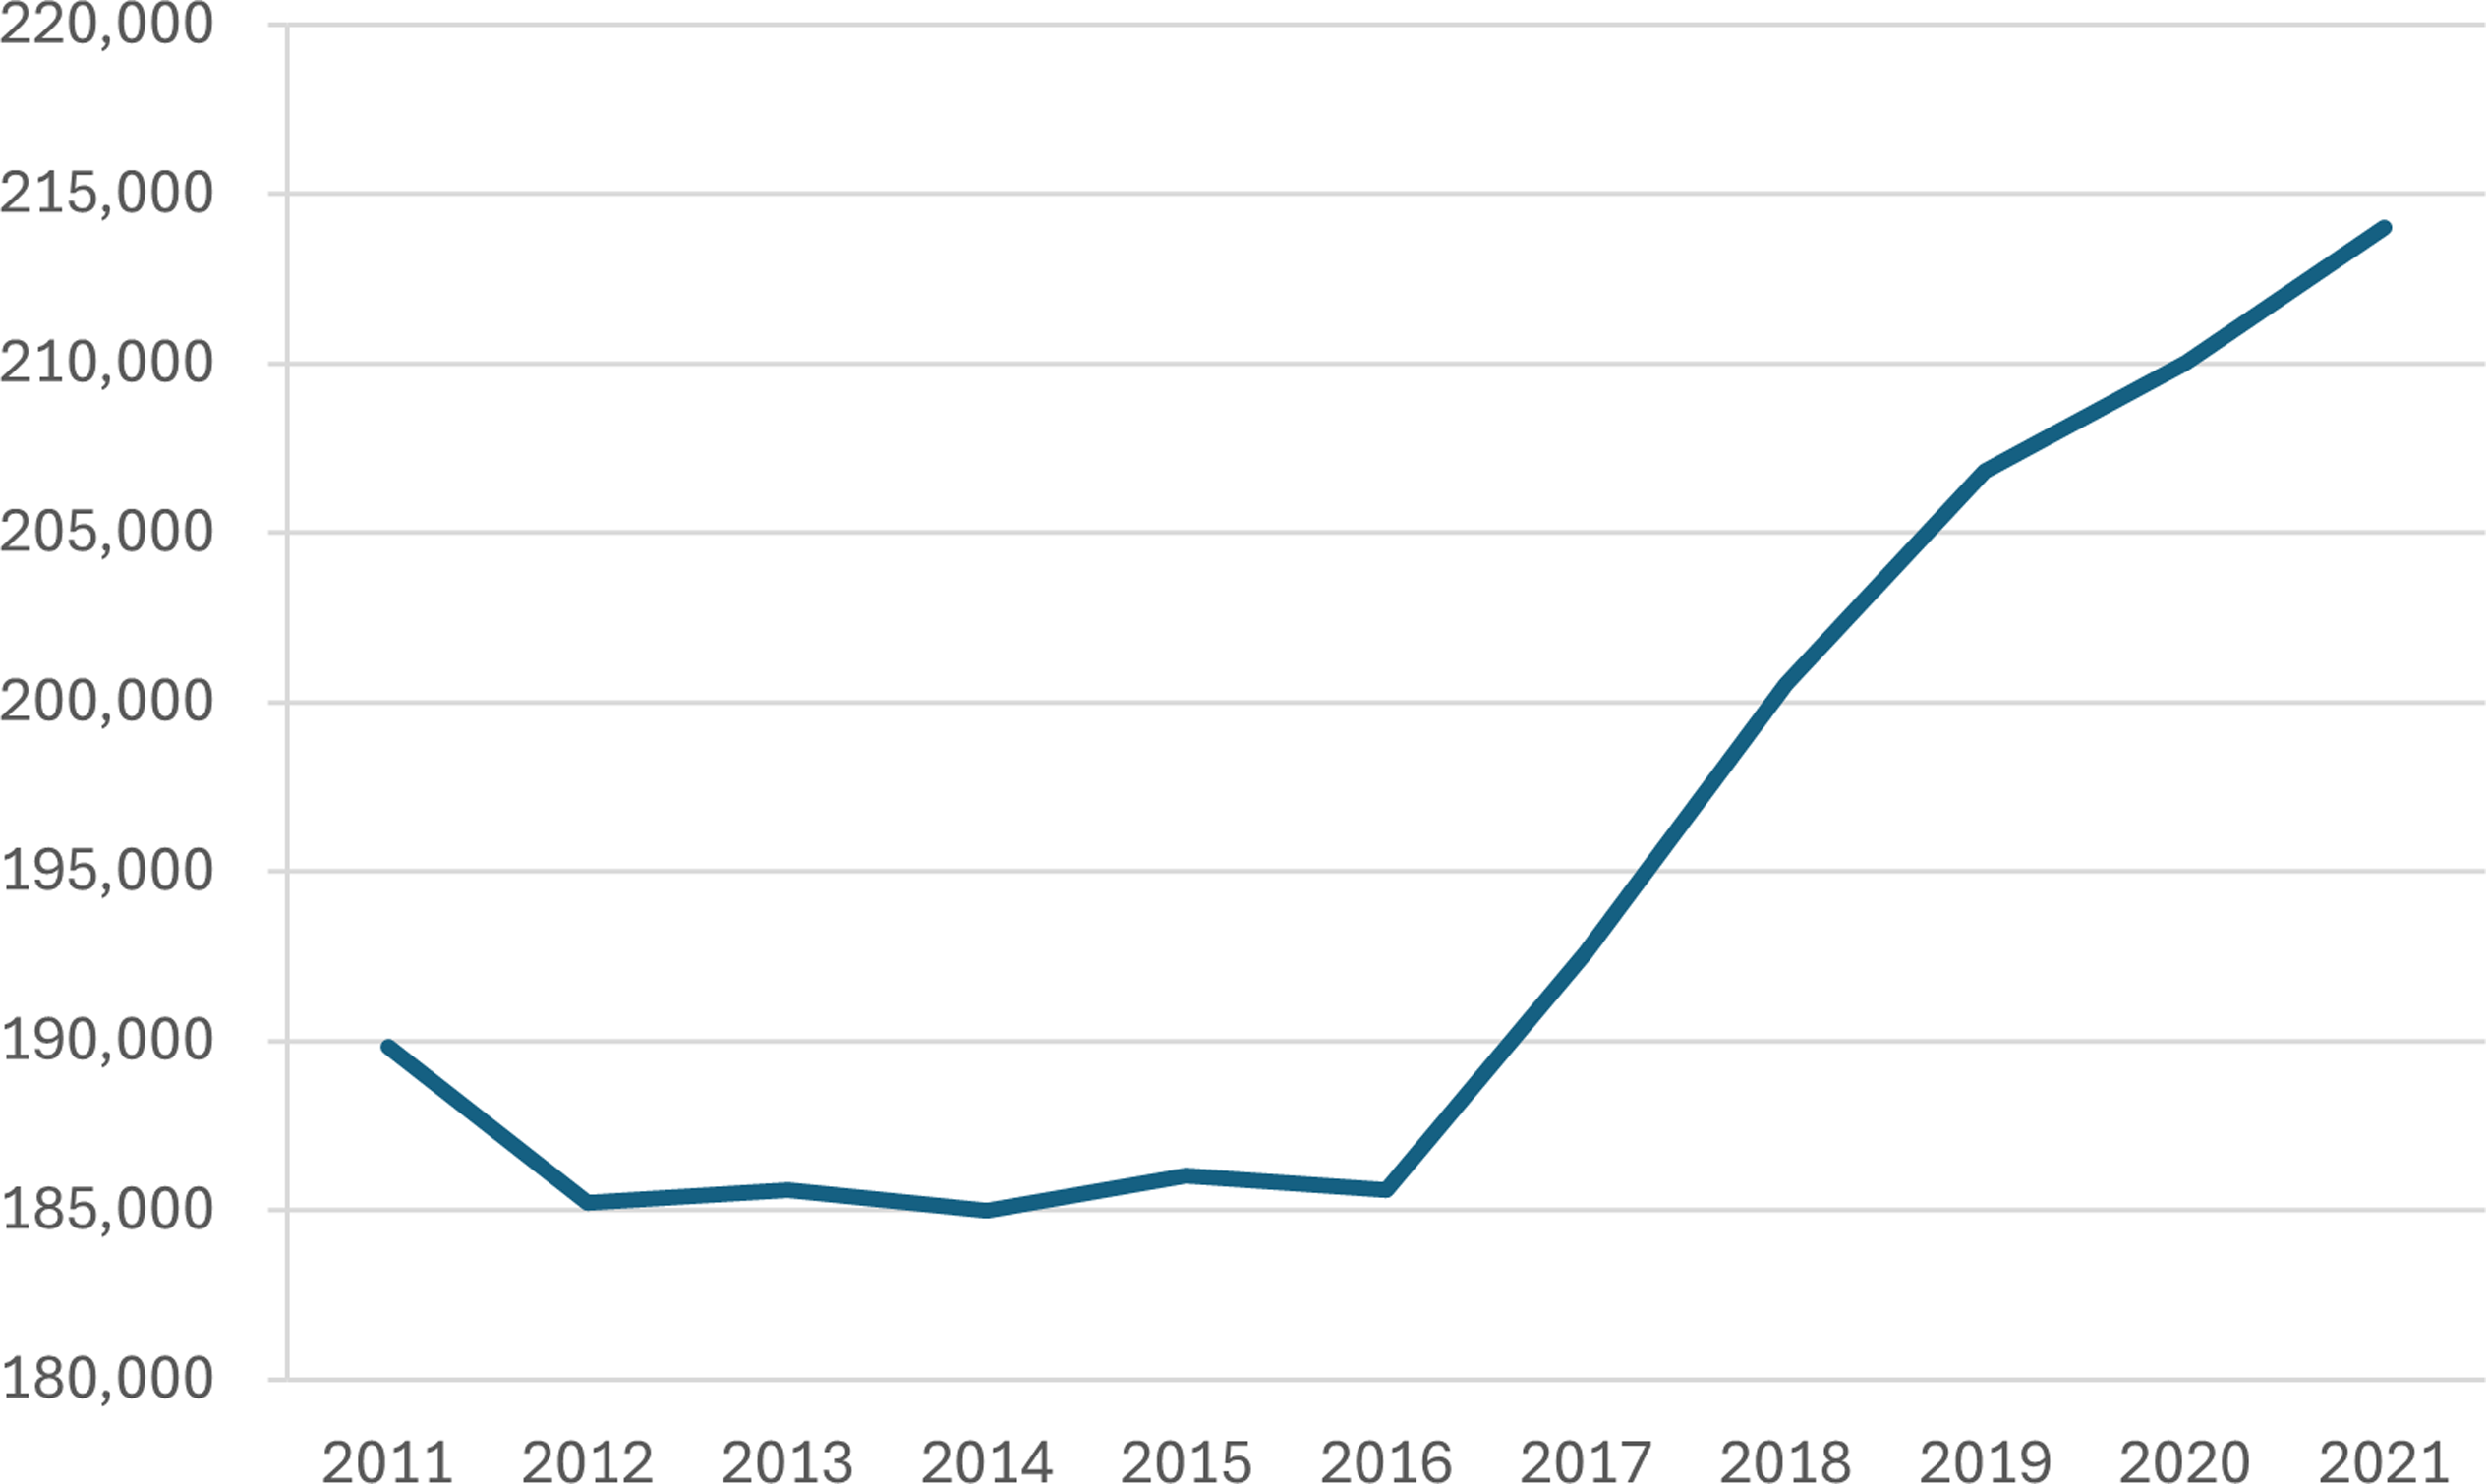
Figure 1. Number of abortions per year in England and Wales from 2013 to 2021.
Potential association between the policy and abortion numbers
For the policy to increase numbers of abortions requires conditions of motivation and awareness:
-
1. The policy must make some people choose to terminate a pregnancy that they would otherwise have carried.
-
2. People must be aware of the policy early enough in pregnancy that they are willing to terminate and it is legal.
There is also an awareness condition that could reduce the numbers of abortions:
-
3. Awareness of the policy (before conception) may make people avoid pregnancy in the first place.
In the first condition, the policy makes people choose to terminate by making more likely a lower future income beyond a level that is judged an acceptable sacrifice weighed against the wish to have the baby.
Awareness of lower future income does not necessarily increase the probability of termination of any given pregnancy – the relationship between childbearing and income is not straightforward. Brewer and colleagues found fertility to be responsive to working tax credits for families with children in the UK in the 2000s, but only for coupled women, who were not sole earners in their households and thus did not face the same trade-off between childbearing/childcare and work that faced single women (Brewer et al., Reference Brewer, Ratcliffe and Smith2012).
In aggregate, single women in Brewer et al.’s study decided not to have another child. Under the two-child limit policy, those who decide to terminate owing to the policy are those open to having another child for whom, facing an unintended pregnancy, the material downside of lost income in the context of the policy outweighs the wish to carry the pregnancy. The expectation of further money to support a further child (in Brewer et al.’s population) may not be the straightforward inverse of the expectation of no more money but a continuation of current income levels with another child – the values of ‘another child’ and a certain amount of money are not easily compared.
We presume that the policy is not likely to make anyone more likely to carry a pregnancy they would otherwise have terminated, so any effect of condition 1 being met could only be to increase numbers of abortions.
The second condition is that people are aware of the policy in time to decide whether to carry or terminate an unintended pregnancy. Almost all abortions occur before ten weeks of gestation, so in practice this means becoming aware of the policy prior to, or early during, the pregnancy. This will in part depend on the mechanisms by which people become aware, and whether they are made aware through information sought or received in relation to the fact of pregnancy. Many factors affect the decision on whether to carry or terminate a pregnancy, of which material factors are only one (important) part, and this policy change is only one material factor.
The third condition means that the policy would not lead to an increase in abortions if it made people reduce their chance of unintended pregnancy.
The second and third conditions taken together show that the expected effect of ‘awareness of the policy’ depends on when people become aware in relation to the timing of a potential pregnancy. Awareness could make abortions both less likely – by making people act to reduce their risk of pregnancy – and more likely, by encouraging abortion of unintended pregnancies. It is not possible to estimate the net result of these two effects.
The empirical evidence on awareness of the policy among people affected is mixed, and all sources have substantial risk of bias. In a survey of users of abortion services in Autumn 2020, the British Pregnancy Advice Service (BPAS) found that many people potentially affected by the policy were aware of it, and that, among those aware and likely to be affected (i.e. claiming Universal Credit or Child Tax Credit), the majority said the policy was important in their decision to terminate their wanted pregnancy (British Pregnancy Advisory Service, 2020). Other research has found limited awareness of the policy among those affected (Sefton et al., Reference Sefton, Monk-Winstanley and Howes2020; Patrick and Andersen, Reference Patrick and Andersen2023), which would limit how much it could encourage people to ‘face the same financial choices about having children’. About half of Patrick and Andersen’s thirty-three participants affected by the policy were unaware prior to conception: ‘The knowledge of the policy was often acquired later in the pregnancy or at birth’. Sefton et al. found awareness among 536 users of an online benefits calculator to have increased from 39 per cent in early 2018/2019 to 58 per cent in late 2019/2020. Although none of these three studies had methodologies designed to give robust estimates of population-level awareness, they suggest that awareness was increasing over time but that at least a substantial minority of people likely to be affected by the policy were not aware in time to change their behaviour (regarding conception or termination) in response.
The increase in the number of abortions began before the legal change in 2018 that allowed the first pill in an early medical abortion to be taken at home (Ewbank and Maguire, Reference Ewbank and Maguire2021), so we do not consider service availability a likely alternative explanation at least prior to 2019.
Our hypothesis
We aimed to find out whether the introduction of the two-child limit was associated with an increase in abortions among population groups affected by the policy using abortion-level data. Our hypothesis was that the increase in population-level abortion numbers from 2017 onwards was caused by the two-child limit and that increases would therefore be primarily observed in population groups affected by that policy: people who were on low incomes, were eligible to claim an affected social security payment and already had two or more children.
Methods
The data
We used Department of Health and Social Care (DHSC) data on all abortions in England and Wales from 2013 to 2021, including information on number of previous births, age group (younger than eighteen years, eighteen to nineteen years, twenty to twenty-four years, twenty-five to twenty-nine years and thirty years or older), marital status (single with a partner, single without a partner, single and partnership status unknown, married/in a civil partnership, divorced/widowed/separated and marital status unknown), ethnicity (Asian, Black, Mixed, White and Chinese/other), local authority and index of multiple deprivation (IMD) decile. From local authority we derived Classification of Territorial Units for Statistics (NUTS)-1 regions for England. Owing to differences in the construction of IMD in England and Wales, we only analysed the data for the abortions that occurred in England.
Definitions
Policy exposure
We classified records by whether a woman having an abortion was exposed to the policy, defined by eligibility for social security payments and by number of children.
Eligibility for social security payments: small area deprivation as a proxy for low-income household status
To be eligible to claim Universal Credit you must be a UK-resident adult below pension age with a qualifying immigration status and less than £16,000 in savings. To receive a payment you must have a low enough income, and your payment reduces incrementally as you earn income over an allowed level. This level varies according to your circumstances (including being ill or disabled, having dependent children and whether you claim for housing costs). In the absence of data on individual- or household-level income, we used area-level deprivation as a proxy for exposure to the policy owing to low income. This was defined as IMD decile of the postcode of residence, assigned at the lower super-output area level. Decile 1 has the most deprived 10 per cent of areas and decile 10 the least deprived 10 per cent. We expected to see a greater association of the policy with abortion numbers among residents of more deprived areas.
Number of previous births
The DHSC data contain the number of previous live or stillbirths for each person having an abortion. We took this number as our measure of number of existing children to establish whether a person’s household could be affected by the two-child limit. In some instances, the number of previous live or stillbirths will slightly overestimate the number of children eligible for social security because it includes stillbirths and liveborn children who subsequently died, children who are no longer under the care of the woman having the abortion, those who are over nineteen years and those aged sixteen to nineteen and not in education. The stillbirth rate in England and Wales is around 3.5 per thousand births, although there is a social gradient (in 2021 it was 5.6 per thousand in the most deprived IMD decile and 2.7 in the least deprived decile). These approximations mean we have treated a small proportion of people as having more UC-eligible children than they do, and that (given the social gradient in the stillbirth rate) more people living in more deprived areas will be treated as having eligible children than people living in less deprived areas. If anything, this would dilute any association observed, as people who truly have one child are being treated as though they have two, and diluting the disparity in the trend between low- and high-parity groups. Conversely, the data will underestimate the number of children in households where not all children are biological children of the woman having the abortion. Around 9 per cent of dependent children live in stepfamilies, although over 80 per cent of step-parents are male (Office for National Statistics, 2024). We consider these approximations, for our purposes, not to affect the validity of our conclusions, as the under- and overestimations are small in scale and are unlikely to mask or distort a general effect.
Timing of policy exposure
For modelling purposes, we defined 2016 as the starting year of the policy, between its announcement in 2015 and its entry into force in 2017. Births following conceptions in the second half of 2016 would have been affected by the policy. This enabled us to compare trends in the pre-policy period (2013–2015) to those in the policy period (2016–2021).
Region
We also stratified our analyses by region on the basis of local authority of residence, as we are interested in regional inequities.
Analysis methods
Our main analysis explored the numbers of abortions by year and number of children and IMD decile, between 2013 and 2021, using descriptive charts.
We used interrupted time series modelling (ITS) to investigate the change between the pre-policy period and the policy period. Our primary hypothesis in the modelling was of a change in the level of abortions following the start of the policy, concentrated in more deprived, higher-parity groups, as more people chose to terminate a pregnancy that they would otherwise have carried. In this level change model, the term for the policy took a value of zero before 2016 and a value of one in the years 2016–2021. Our secondary hypothesis was that the change would not be uniform across time but would increase each year against a background of austerity and stagnating incomes, and increased awareness of the policy (without direct estimation of the latter). In this slope change model, the term for the policy took a value of zero before 2016 and a value from one to six in the years 2016–2021.
We fitted generalised linear models with a Gaussian distribution. For the level change model we modelled the annual number of abortions as a function of time (in years, to account for the pre-policy trend) and the presence of the policy. For the slope change model, we modelled the annual number of abortions as a function of time (in years) and policy-time (years the policy had been in place). We separately modelled each combination of number of previous births (zero/one/two/three/four or more) and IMD decile.
In all our main analyses we investigated numbers of abortions rather than rates because denominator data for subpopulations disaggregated by number of previous births were not available. There was little change during the period in the underlying population age structure, which is the variable that could most plausibly give rise to inaccurate estimates using count data.
Sensitivity analyses
We conducted two sensitivity analyses. First, we used rates rather than counts of abortions for analyses where we could find adequate denominators (by maternal age group and by IMD decile). Second, we considered the announcement year (2015) and enforcement year (2017) as alternative starting years for policy exposure.
Post hoc descriptive analyses
To aid interpretation of our primary results, we undertook additional descriptive analyses in which we plotted number of abortions by age group, ethnicity and region.
Ethics
We obtained approval for this secondary data analysis from the Institute of Population Health Research Ethics Committee at the University of Liverpool. The Health Research Authority decision tool indicated that the study did not need National Health Service (NHS) research ethics clearance. The data owner effectively anonymised the data, avoiding small counts, prior to providing them to us, and there is no risk of reidentification.
Results
DHSC provided data on 1.62 million abortions in England and Wales over the period 2013–2021, and we analysed data for the 1.55 million abortions that took place in England.
Findings by number of previous births
From 2016 to 2021 the number of abortions increased for all numbers of previous birth categories (Fig. 2). Among people who had two or more previous births, numbers of abortions increased annually from the beginning of our data series in 2013. The change that coincided with the introduction of the two-child limit policy (i.e. occurring from 2017) was that the number of abortions increased among those with fewer than two previous births, which had previously been declining. These groups are not impacted by the policy.
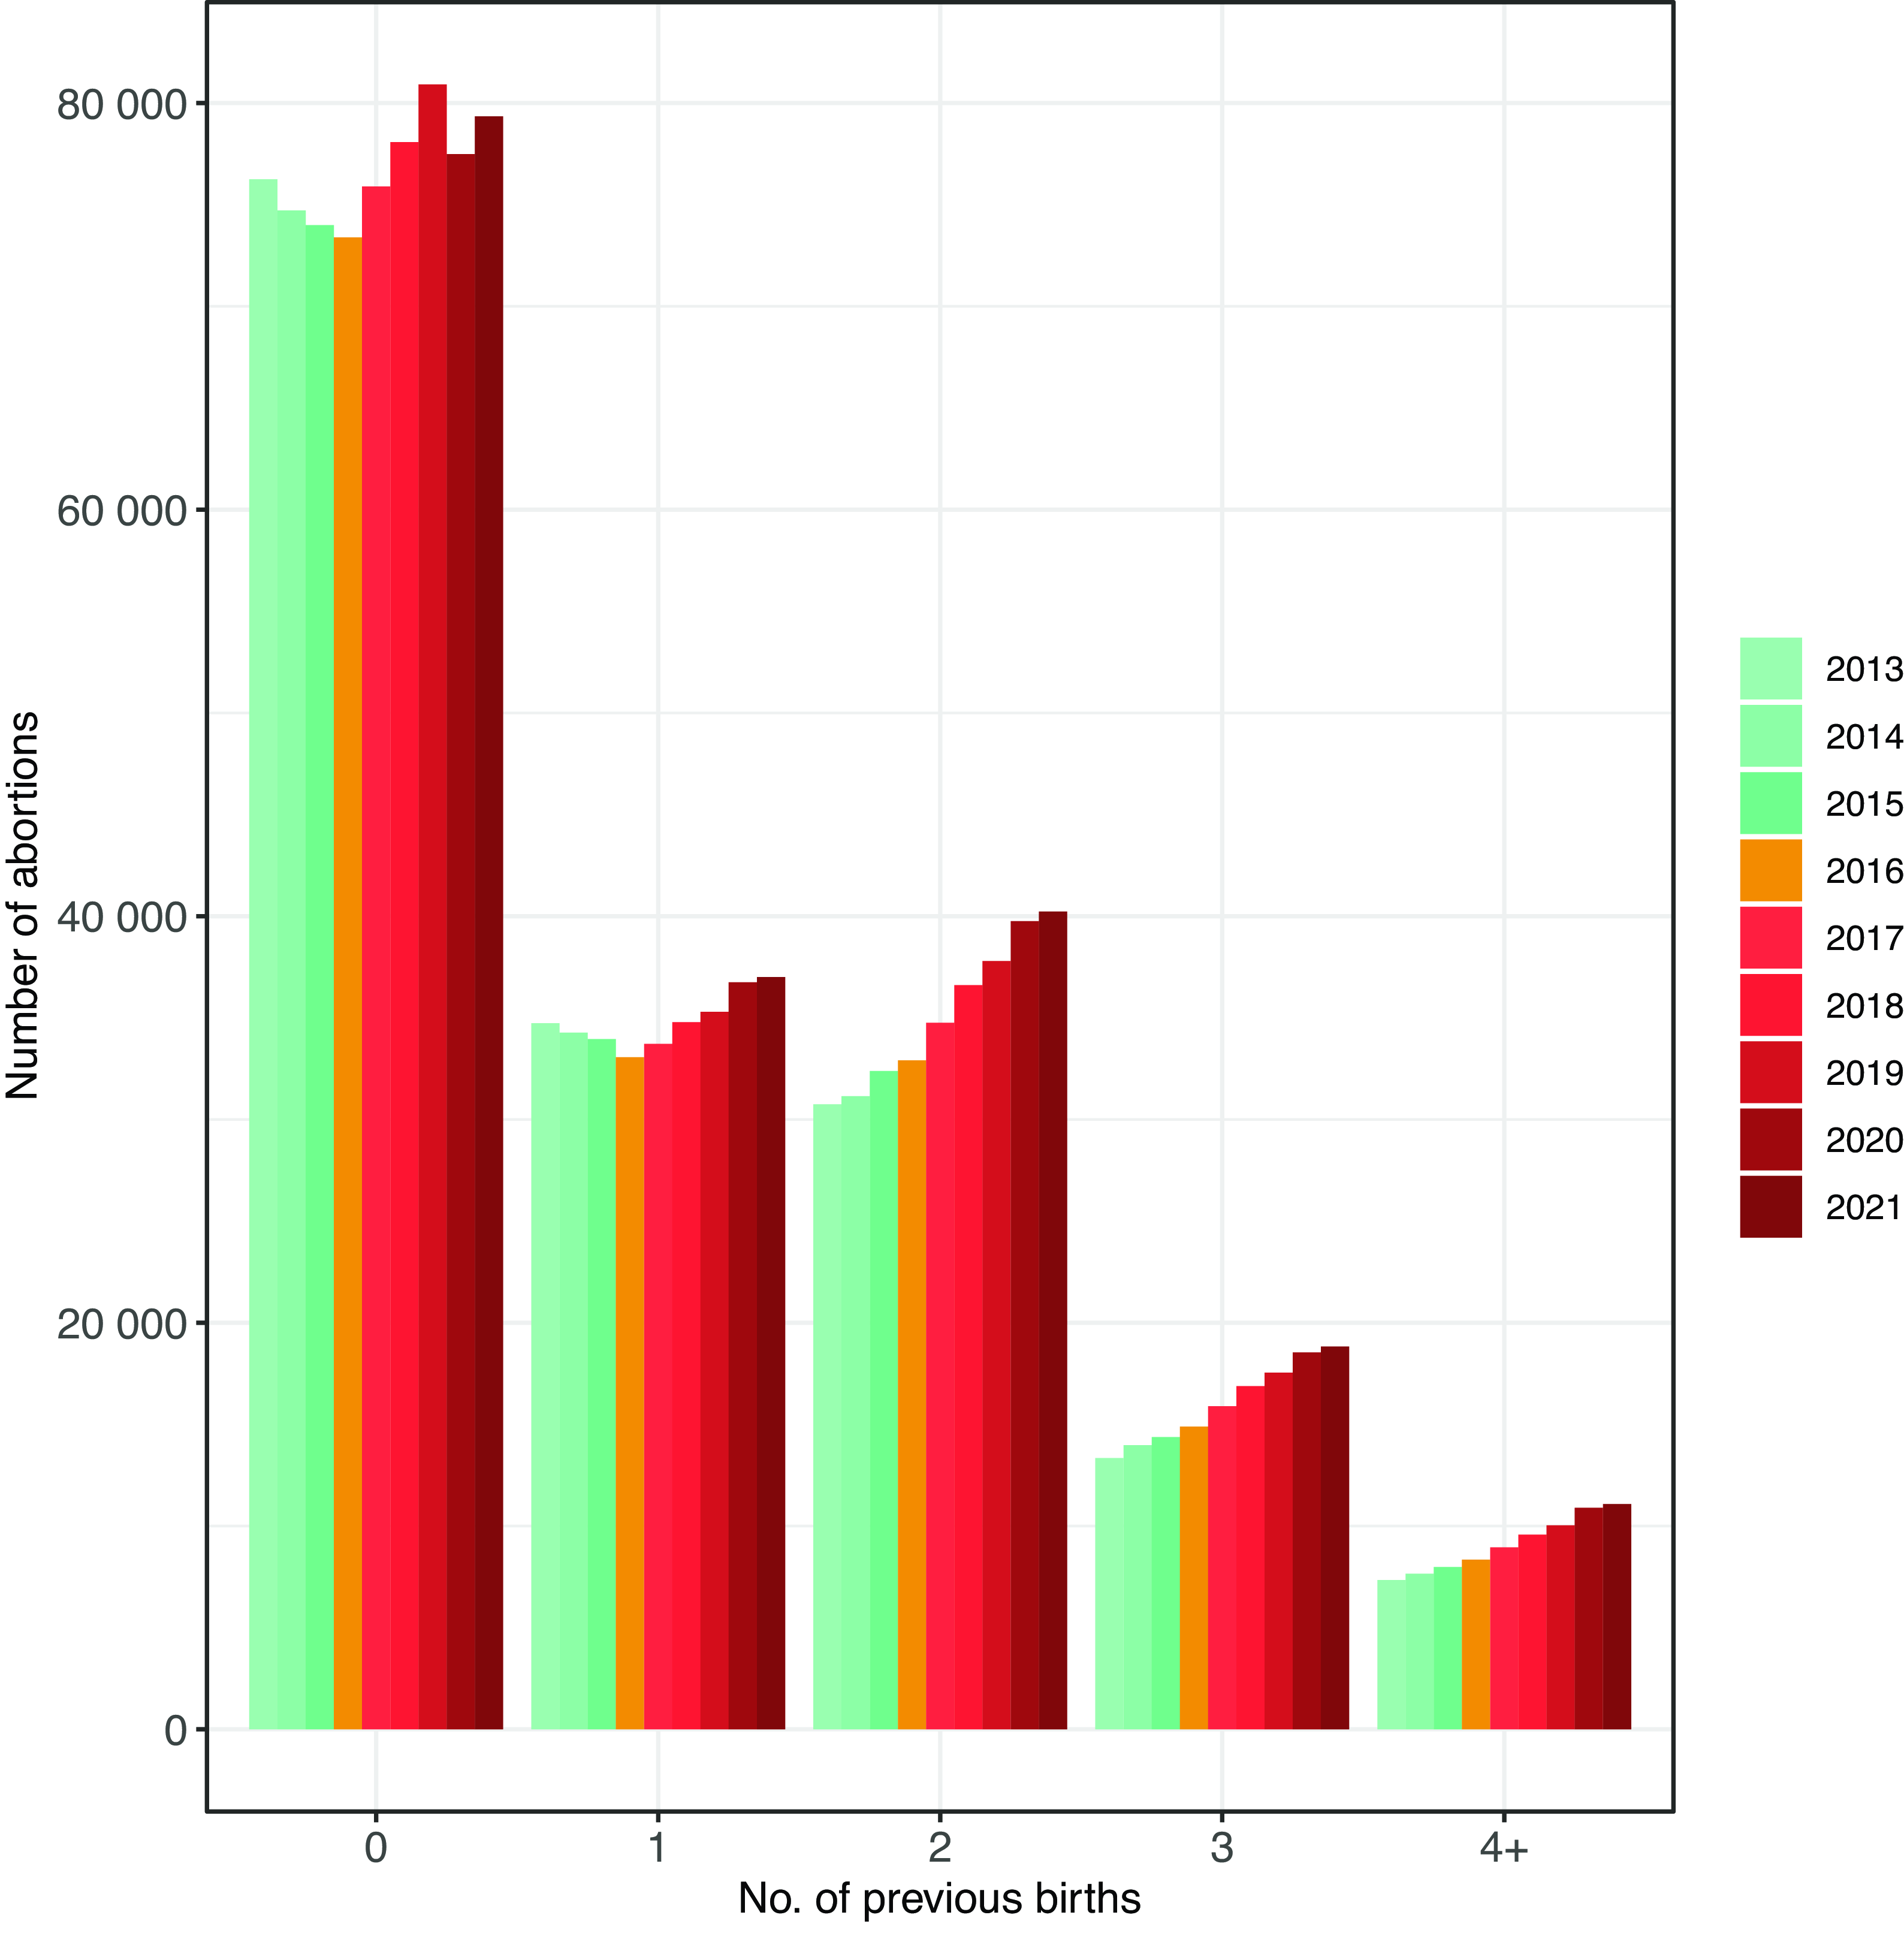
Figure 2. Number of abortions in England from 2013 to 2021, by number of previous births.
Findings by area-level deprivation
Numbers of abortions are clearly associated with area-level deprivation, with the highest number of abortions in the most deprived areas. Across all IMD deciles there was a substantial increase in the annual number of abortions following the introduction of the policy. However, the pattern of the increase was similar across deciles, with numbers largely flat from 2013 to 2016 and increasing in the following years. In the most deprived decile, the number of abortions was already increasing before the limit was introduced, albeit this accelerated after 2016 (Fig. 3); otherwise, the pattern over time in each IMD decile looks very similar to the pattern seen nationally.
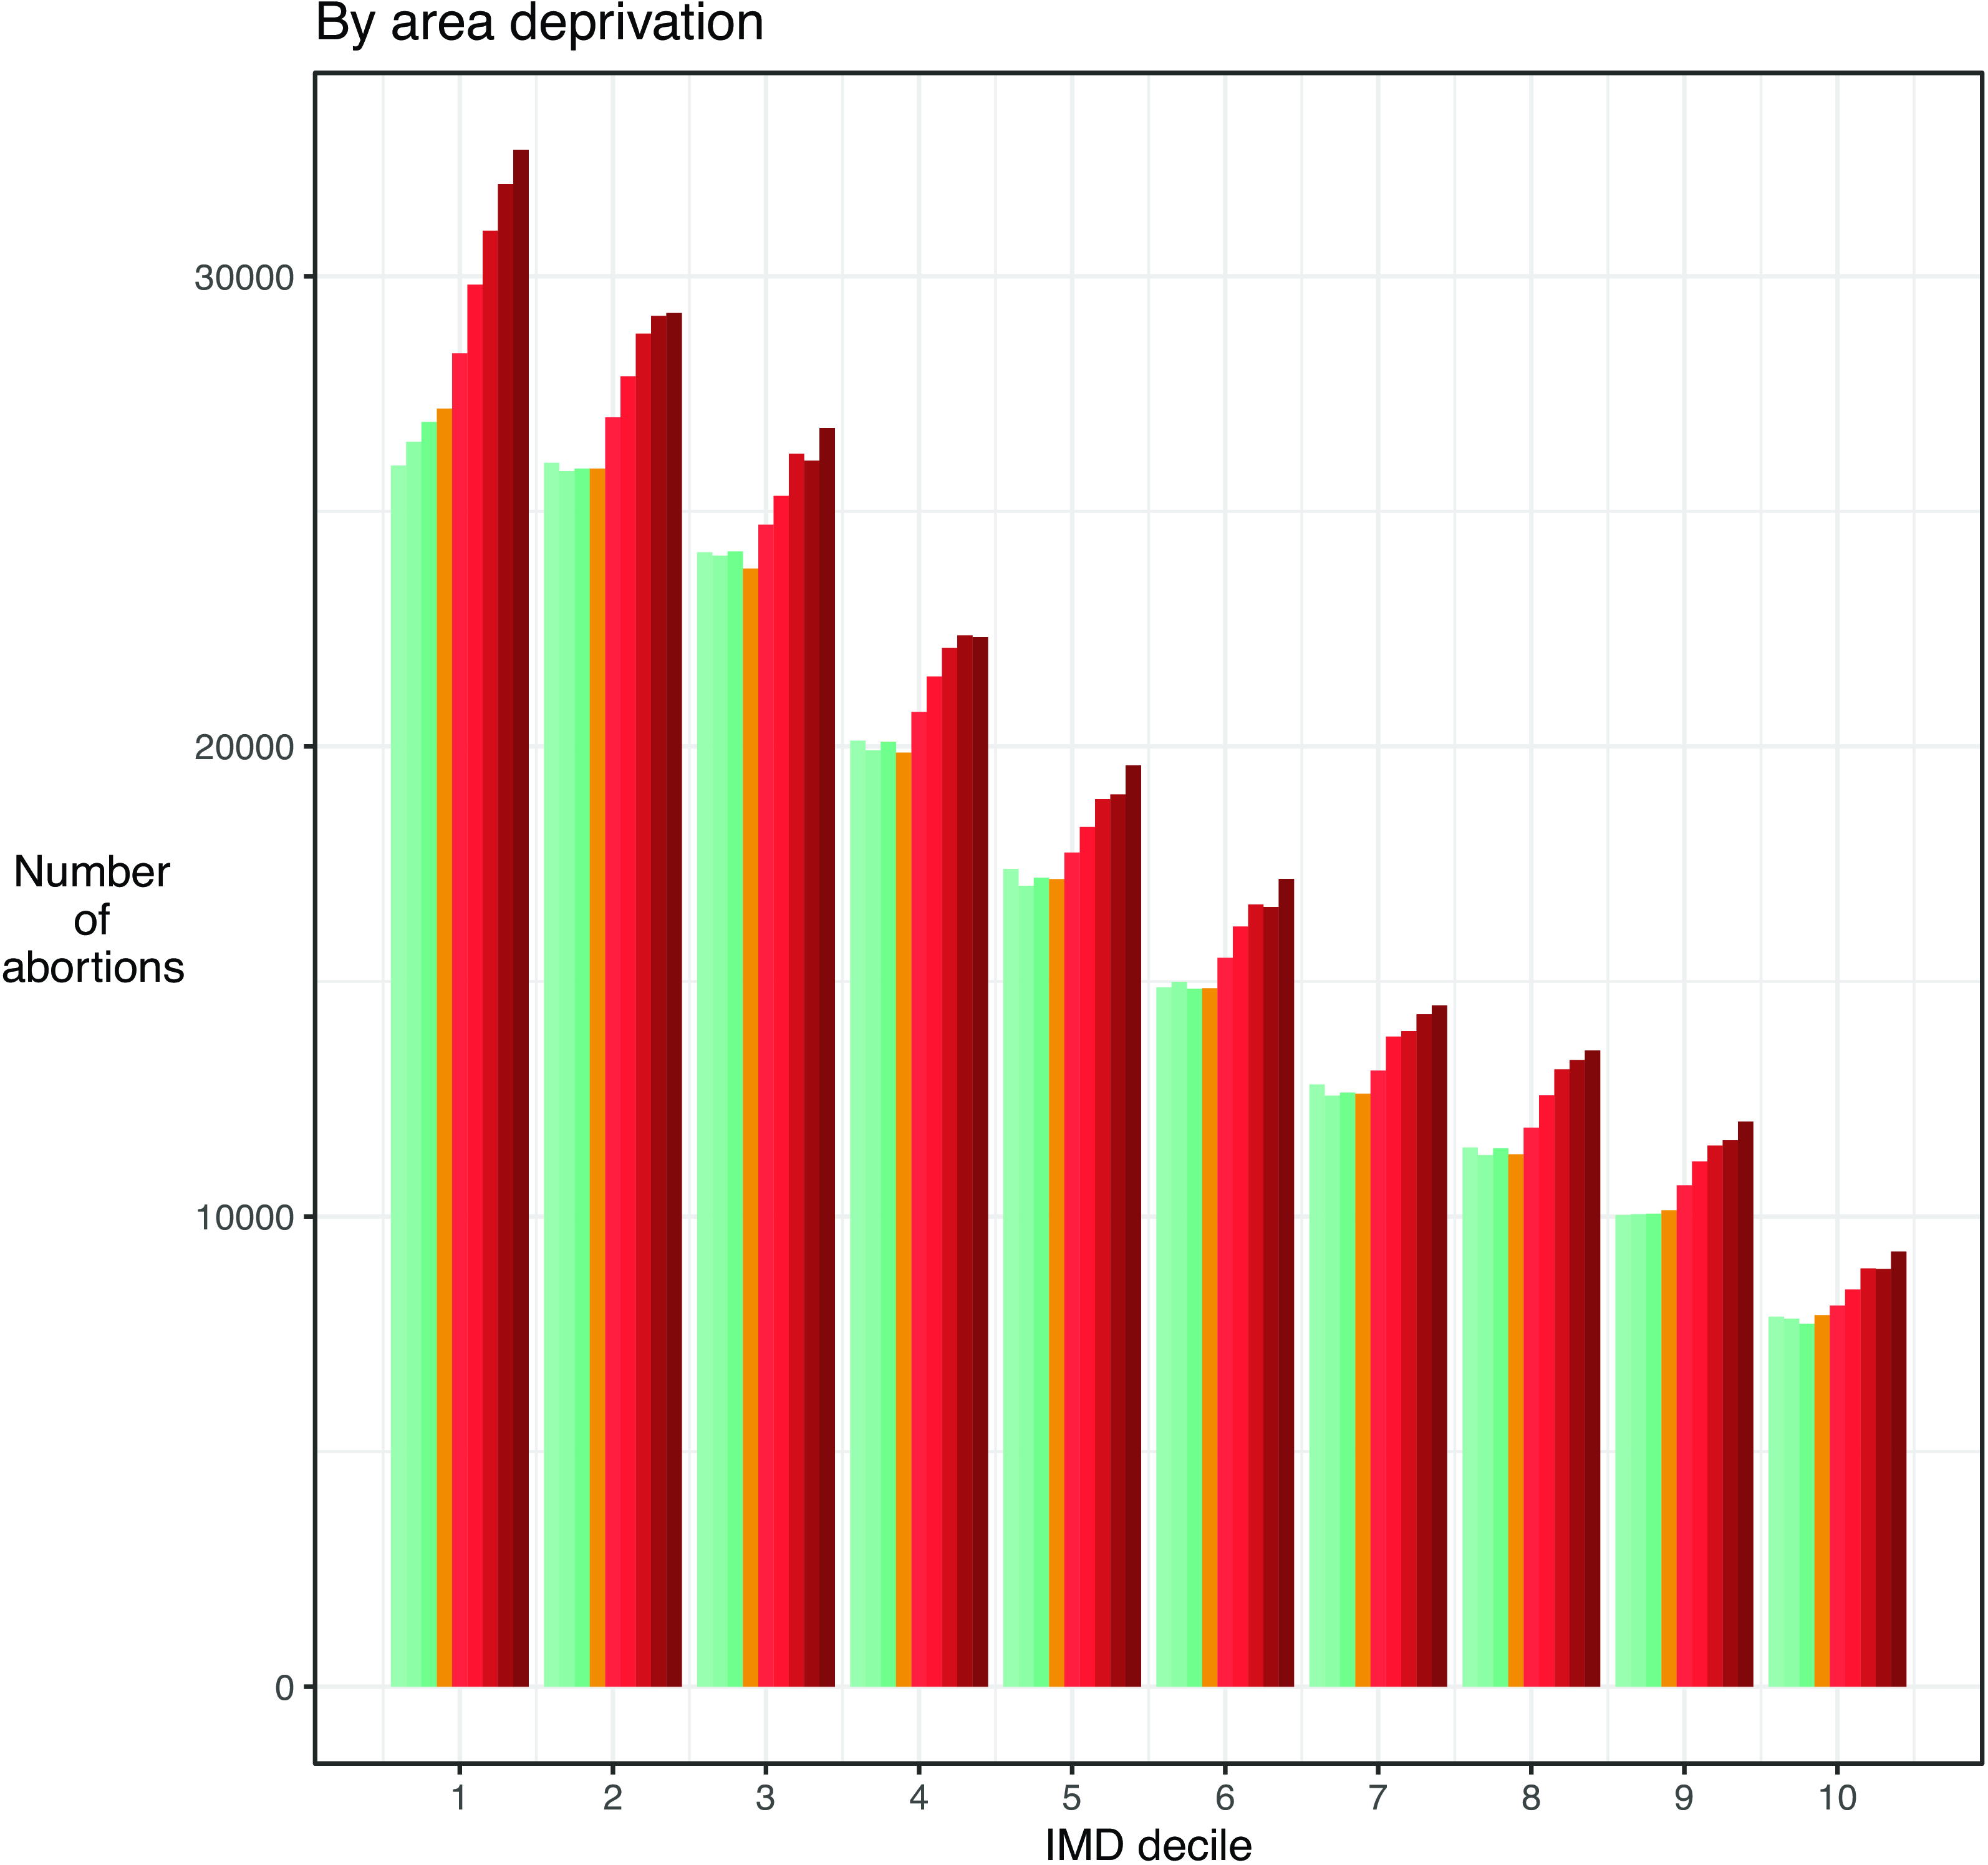
Figure 3. Number of abortions in England from 2013 to 2021, by IMD decile.
Further descriptive findings: age, ethnicity and region
Having found no difference in the trend according to area-level deprivation and an unexpected increase among women with fewer than two previous births, we plotted further descriptive analyses to help understand the change seen in the overall data.
The starkest findings there were that the change in trend after 2016 was primarily seen among twenty- to twenty-four-year-old women, among whom a declining trend from 2013 to 2016 was reversed. In absolute numbers the largest increases were among the thirty years and older group, continuing a trend of increasing numbers of abortions annually (Fig. 4).
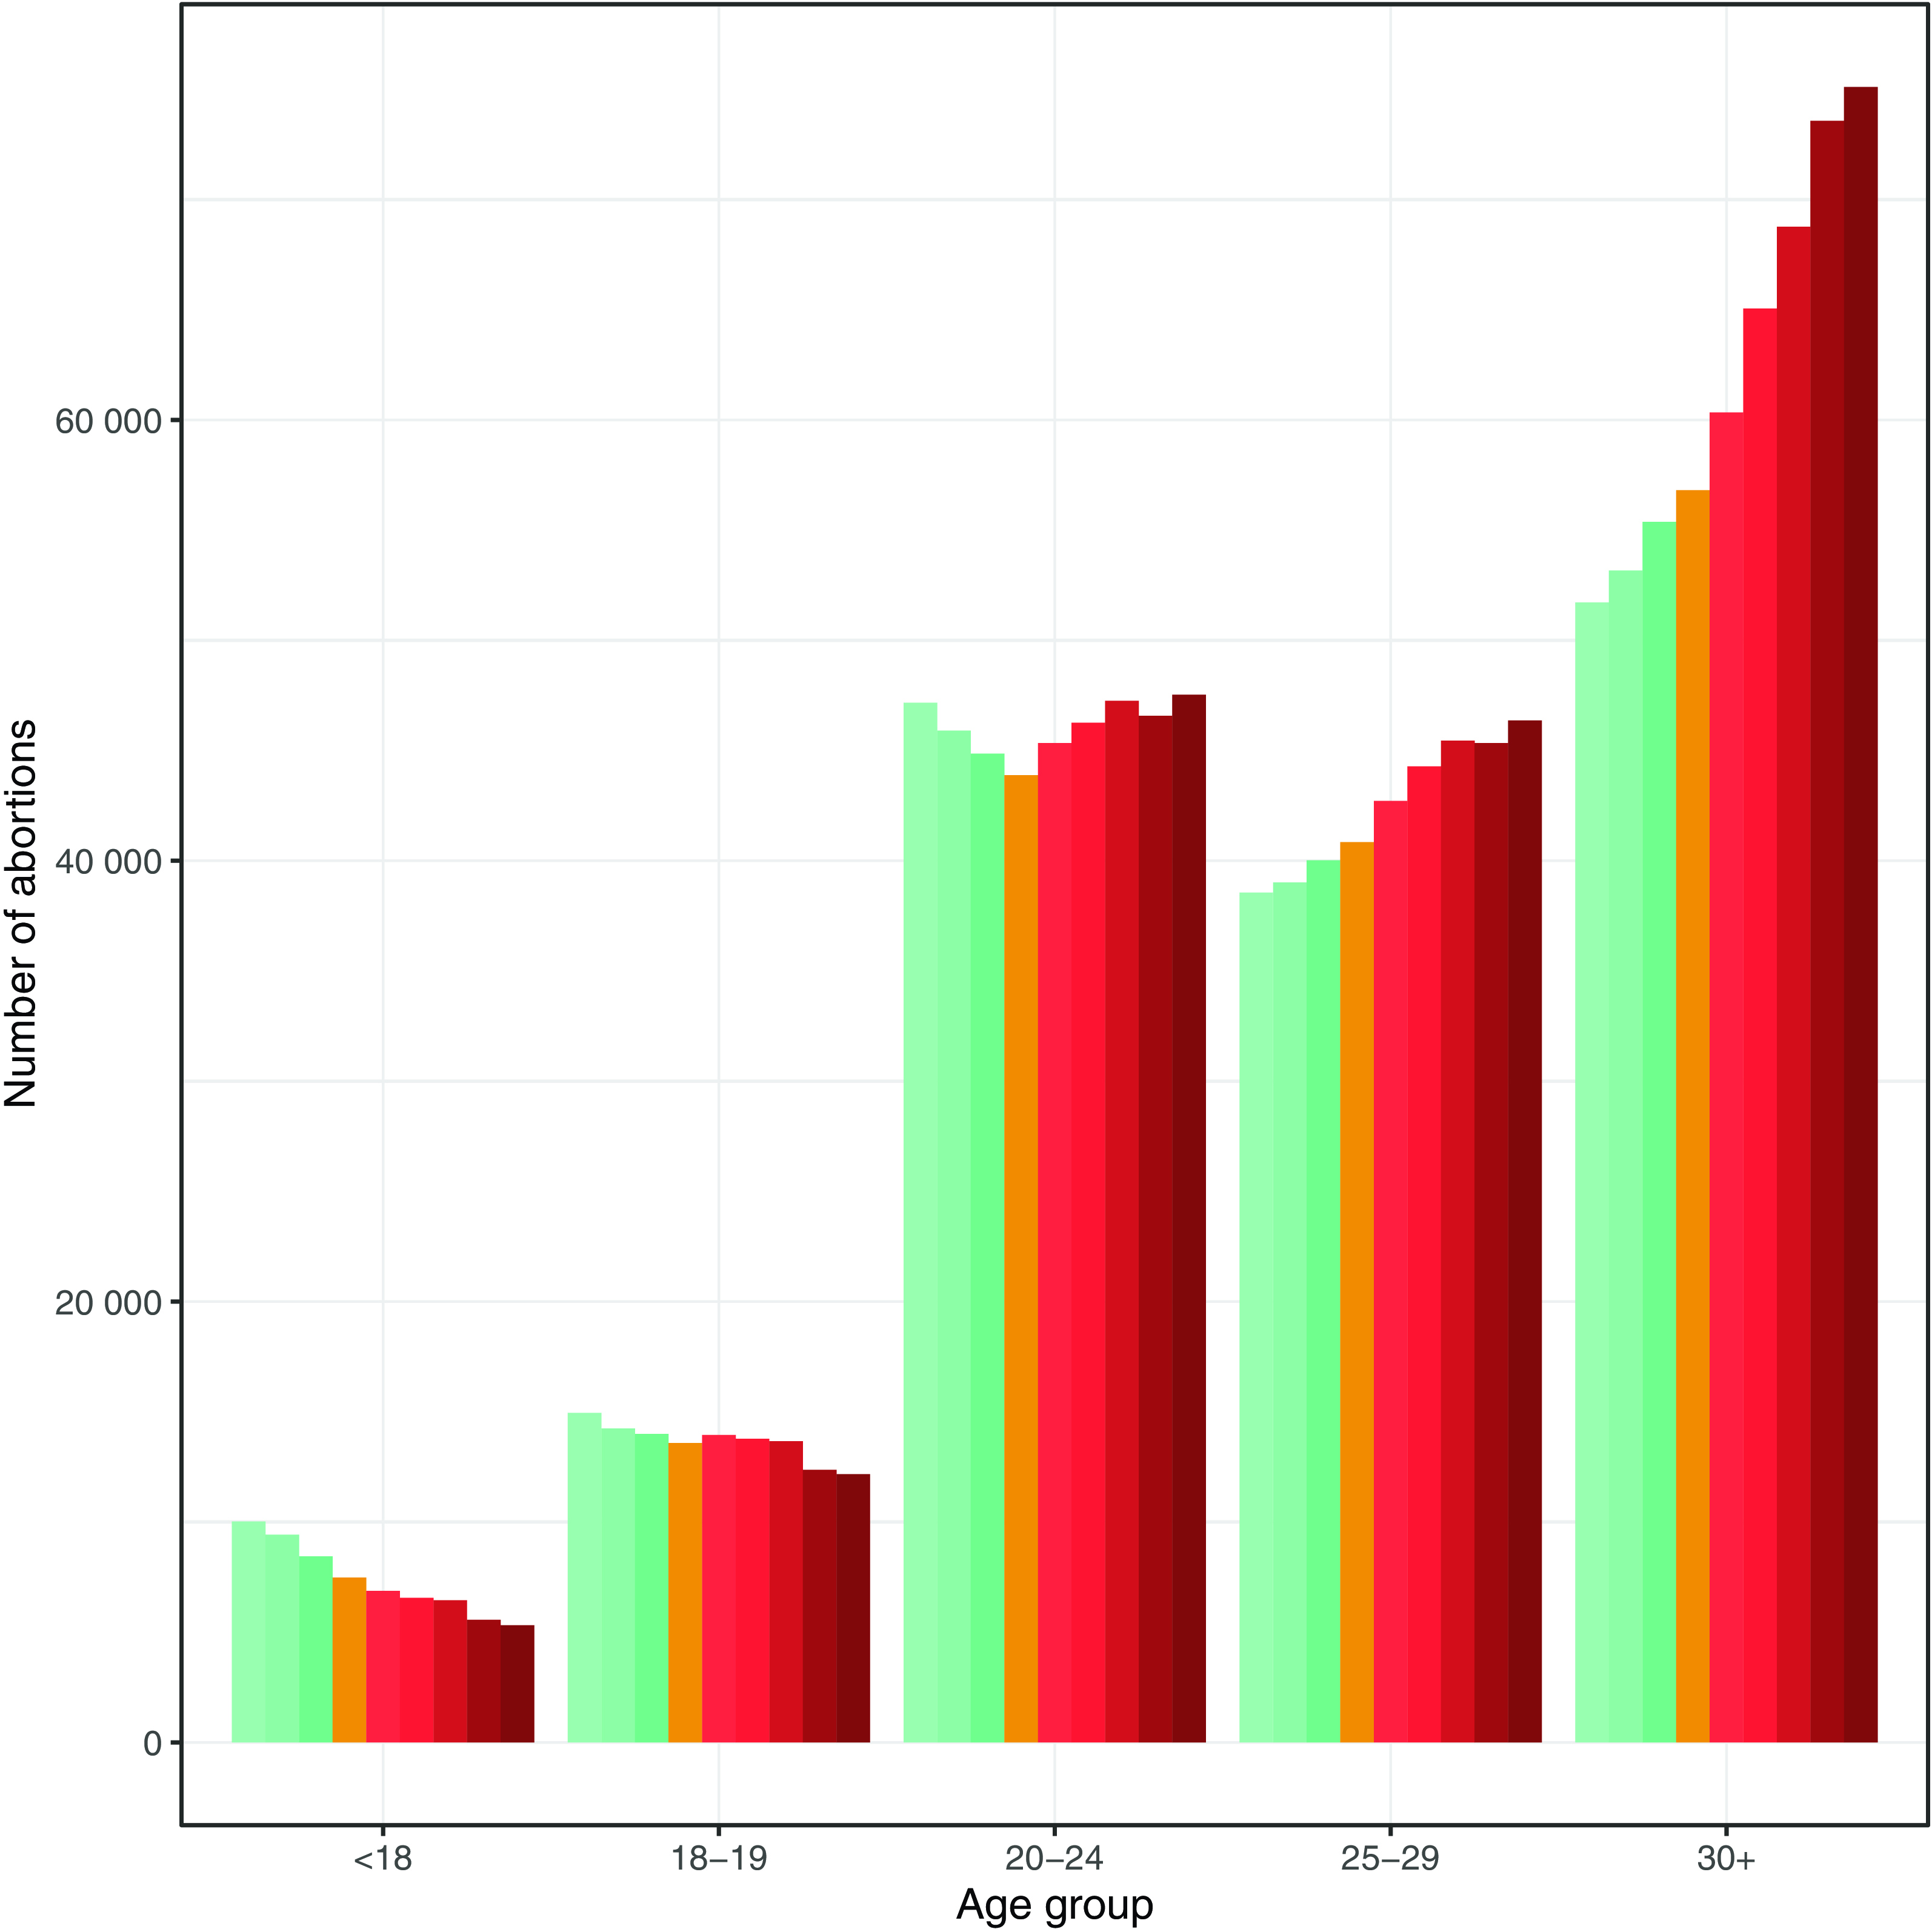
Figure 4. Number of abortions in England from 2013 to 2021, by age group.
Similar reversals – from decline to increase – occurred in the Asian and Black ethnic groups, while there were large increases among women of White and Mixed ethnicity that continued previous trends. Reflecting the composition of the population, the increase in absolute terms was concentrated among White women (Supplementary Figure 1).
All regions of England apart from London followed similar patterns of flat or slowly rising numbers of abortions prior to 2017, and some increase thereafter. In London, where absolute numbers were highest, the number of abortions was falling from 2013 to 2016, rose from 2016 to 2019 and then fell again from 2019 to 2021 (Supplementary Figure 2).
The sensitivity analyses gave the same results as were seen in the main analysis.
Findings of interrupted time series modelling
Our modelling output was consistent with the descriptive analysis: there was no effect of the policy or time under the policy in any group, in any model specification. In the level change model, calendar time was strongly associated with increases in numbers of abortions for people with two or more children, reflecting the increasing trend across the entire study period (Fig. 5; Supplementary Table 1). The trends for people with two, three and four or more previous births were almost identical and are grouped together in Fig. 5.
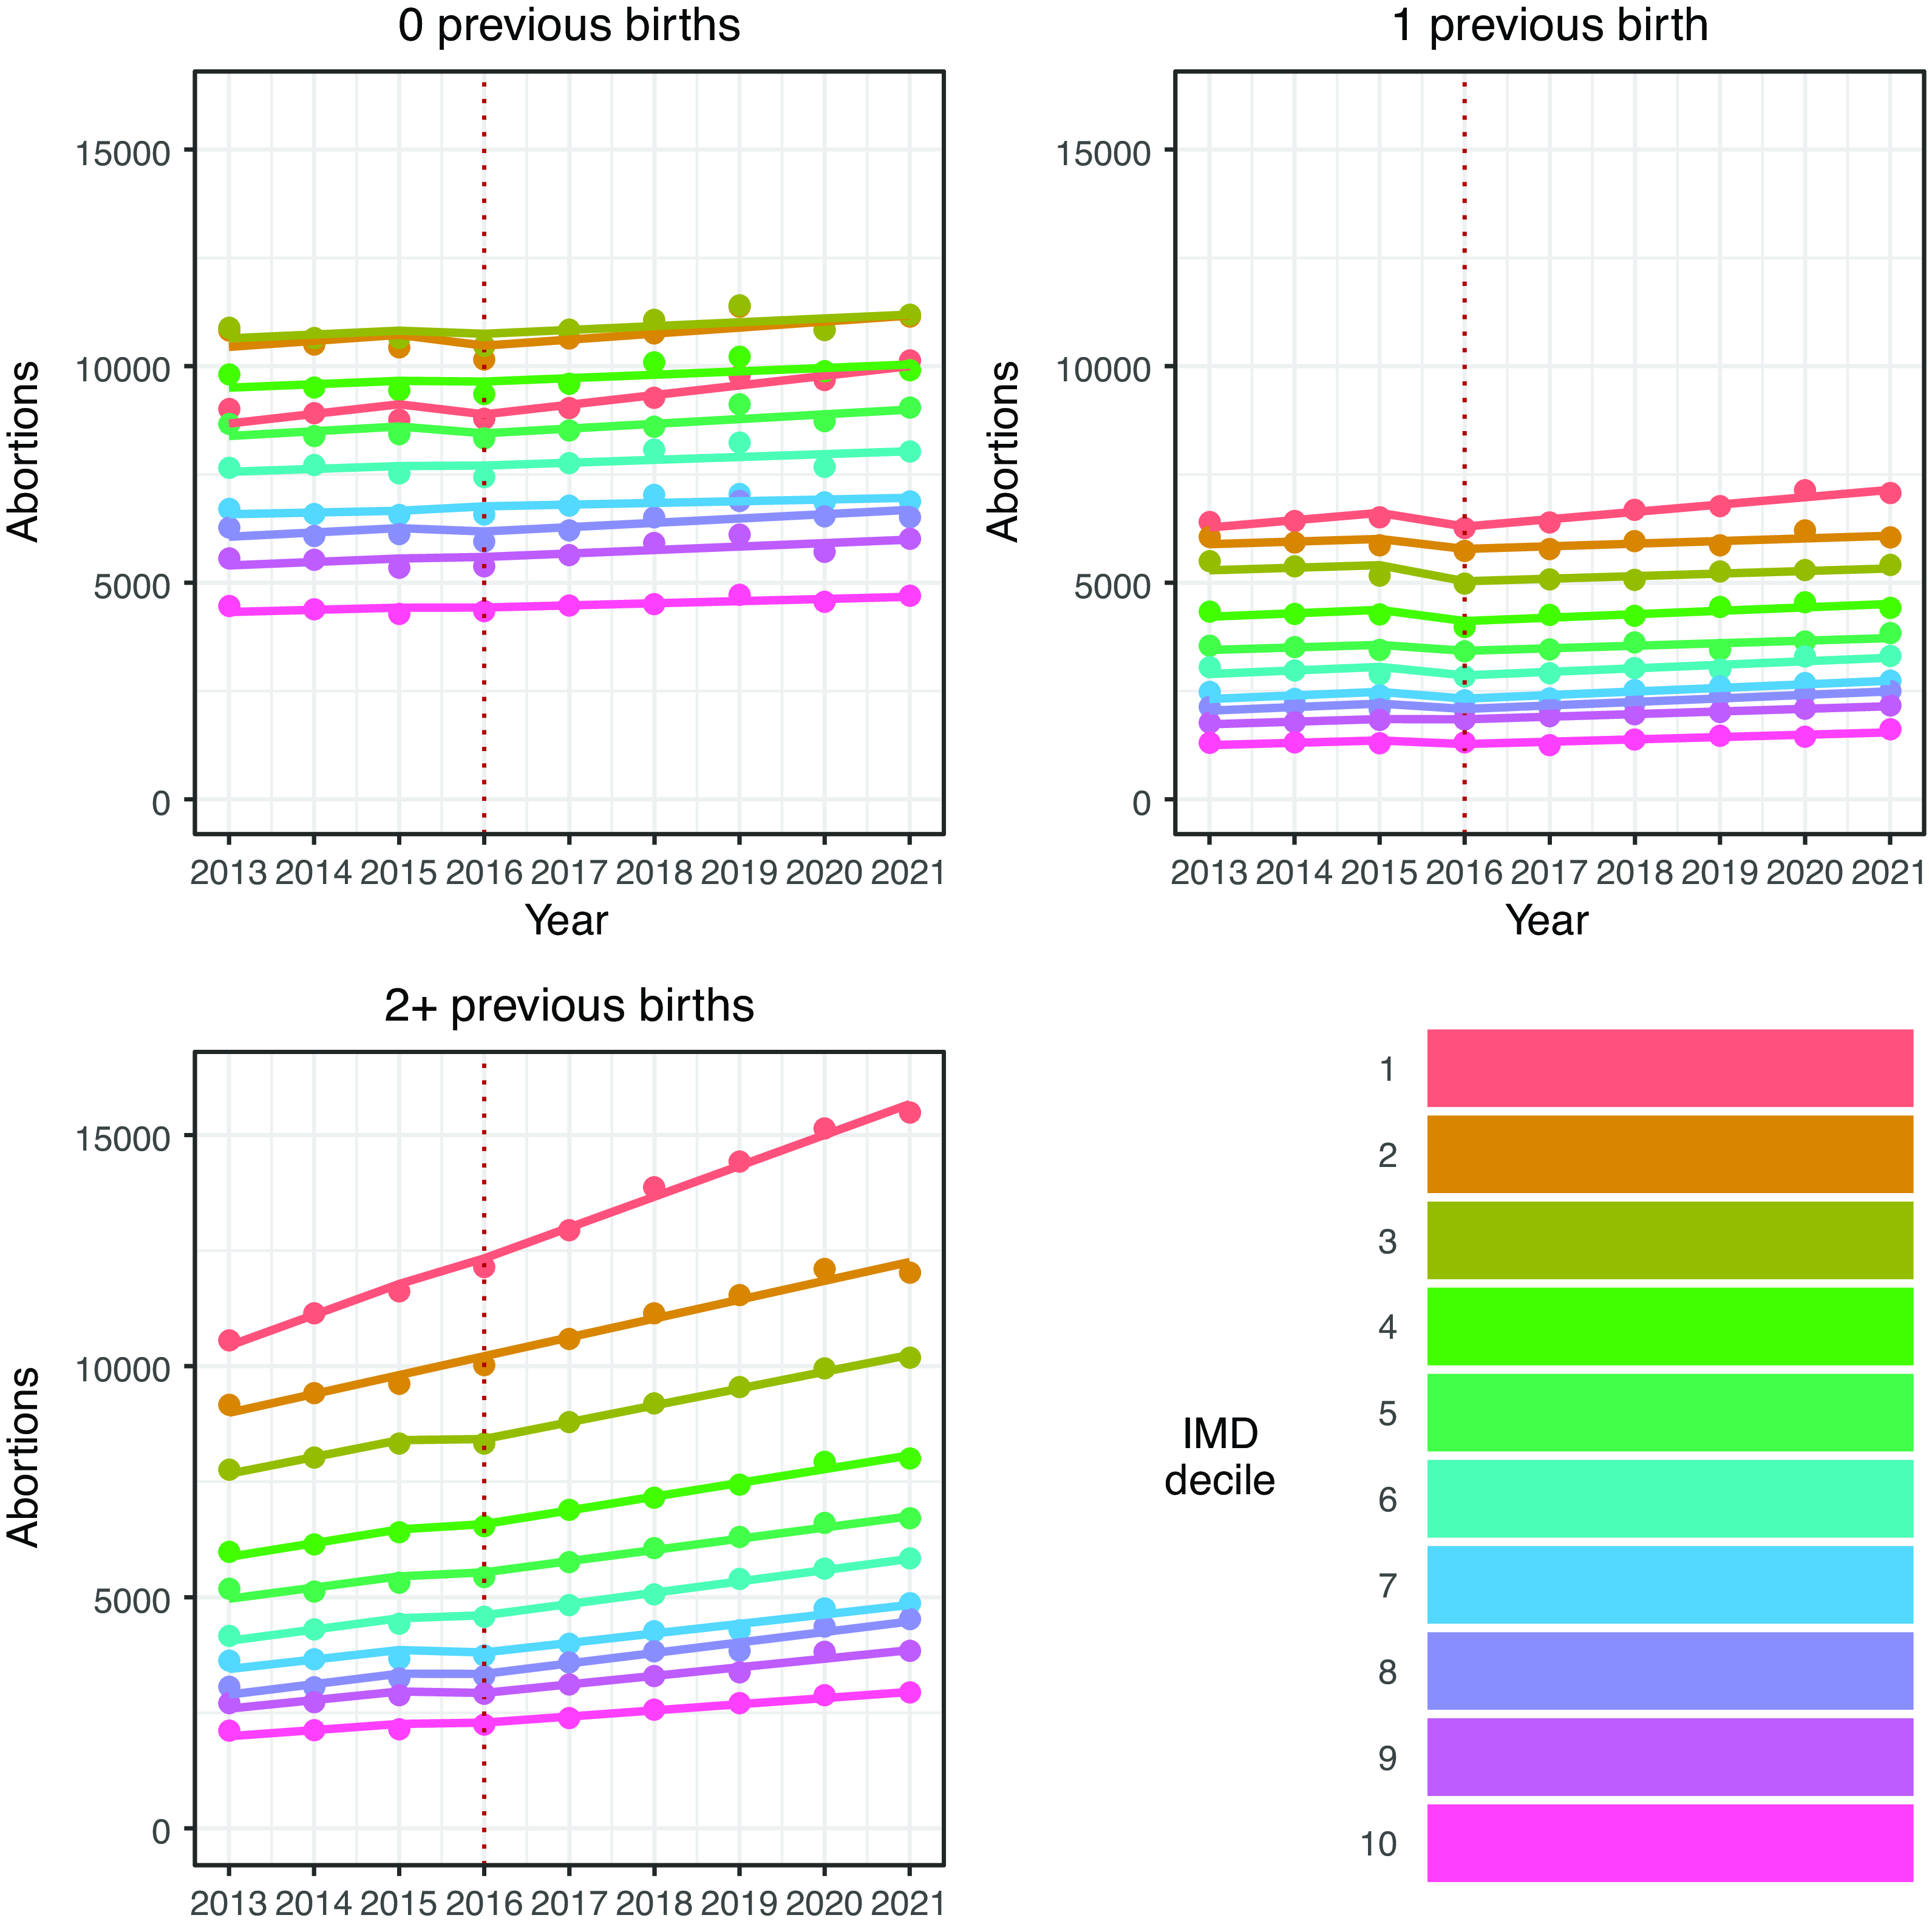
Figure 5. Modelled numbers of abortions by parity and area-level deprivation, in England from 2013 to 2021.
Note: Dotted lines show the beginning of the policy period.
In the slope change model, time was significantly associated with increased numbers of abortions in most groups with two or more previous births, and policy-time had no significant association with numbers of abortions among people with two or more previous births (Supplementary Table 1).
Discussion
Summary of findings and implications for the hypothesis
From 2013 to 2021 there were absolute increases year-on-year in the number of abortions among virtually all population groups. The findings by number of previous births and by local-area deprivation, as well as those by age group, add important detail to the previously observed overall increase nationally from 2017 onward. The two-child limit and associated financial stress were clearly important factors in the decision to terminate for some people (British Pregnancy Advisory Service, 2020). However, this analysis shows that the increase nationally is not attributable to increases concentrated among people affected by the two-child limit policy.
Although there were large increases in the numbers of abortions annually among people with two or more existing children, our modelling shows these were a continuation of pre-policy trends. When plotted descriptively, these increases appeared to accelerate following the policy; however, the modelling found no discernible statistical evidence of an association between the policy and either the number of abortions or acceleration in that number. While this disproves the hypothesis of an association with the policy, in absolute terms increased numbers among women with two or more children of course contributed to the overall national increase from 2017.
There was a largely uniform trend in numbers of abortions across IMD deciles. It is possible that this results from multiple social forces, related to both deprivation and non-material factors, acting simultaneously. We cannot tell from the data, but on the face of it the simplest interpretation is that the almost identical pattern of increases regardless of area-level deprivation provides evidence that the change was not primarily driven by financial considerations.
We can note that the stable number of abortions between 2012 and 2016 was the result of offsetting changes in different parts of the population: in those years there was an increase among women aged twenty-five years and older, and a decrease among individuals under twenty-five years. After 2016, the decreases among twenty- to twenty-four-year-olds reversed, while among women aged twenty-five years and older the increase accelerated. Explanations based in material circumstances, as determined in part by access to and levels of social security payments, would have to account for these age-based differences, as well as for the near-identical dynamics across deciles of area-level deprivation.
Our findings are consistent with previous findings that the policy had a negligible effect on fertility, offering a detailed treatment of abortion levels by population groups to add to that previously presented (Reader et al., Reference Reader, Portes and Patrick2022). The lack of association between reduced social security support and fertility is in turn consistent with the continuing rise in child poverty in the period since the two-child limit began (Stewart et al., Reference Stewart, Patrick and Reeves2023), which has primarily occurred among children in larger families. As Chzhen and Bradshaw put it, ‘If there were indeed fewer births of third and subsequent children in lower income families than would have occurred in the absence of the two-child limit, the reform’s effects on family incomes would be lower. Yet as the evidence on fertility is mixed and inconclusive, we would expect greater consequences for child poverty.’ (Reference Chzhen and Bradshaw2024, p. 4).
Our analysis had some limitations: IMD is an area-level rather than individual-level measure and is potentially subject to the ecological fallacy. It is also a composite measure (DHSC could not provide the income domain of IMD in time for analysis). However, the stark uniformity of the pattern by IMD decile allays this concern as area-level deprivation aggregates household level deprivation, and we would expect to see at least some patterning by IMD if household-level deprivation were important in the relationship between the policy and abortion numbers. There are also no data on awareness of the policy over time, which would have been a useful covariate for more precise investigation. Overall though, the clarity of the results by parity and the results across levels of deprivation leave us confident in our conclusions.
How may austerity have nonetheless contributed to the findings?
Austerity policies had huge impacts on household finances over the period we have studied. The two-child limit was one of many changes to social security policy that had a potential negative financial effect on low-income households with children (Pennington et al., Reference Pennington, Wickham, Mason, Grollman and Geary2025). Current and anticipated finances are important factors in the decision to terminate a pregnancy, so these impoverishing policies probably played some role in increasing numbers of abortions even if the effects of individual policies such as the two-child limit may have been ‘lost in the flood’ of the overall austerity programme. Since the early 2010s, overall poverty in the UK has remained fairly stable at around 20 per cent of households (after housing costs), but this masks a deepening at the poorest end of the income distribution, whereby the poorest 5–10 per cent have fallen deeper into poverty (Edmiston, Reference Edmiston2022).
However, if the increase in abortions were driven primarily by financial considerations we would expect to have already seen some trend in national-level data prior to 2017: beginning in 2013, when the Conservative–Liberal Democrat coalition severely curtailed social security protections, and under subsequent Conservative governments, there was a sustained increase in child poverty in larger families that was not seen in smaller families (Stewart et al., Reference Stewart, Patrick and Reeves2023). Universal Credit itself is associated with disadvantage in specific domains, including lower food quality (Power et al., Reference Power, Pybus, Pickett and Doherty2023), increased food bank use (Reeves and Loopstra, Reference Reeves and Loopstra2021), worse life satisfaction (Thornton and Iacoella, Reference Thornton and Iacoella2024) and insecure housing (Williams et al., Reference Williams, Bell, Garratt and Pryce2024). A 2023 narrative review of children’s experiences of poverty showed the wide-ranging ways that economic deprivation negatively affects children’s health and wellbeing (Bidmead et al., Reference Bidmead, El Zerbi, Cheetham and Frost2023). Perhaps the policy, being explicitly focused on childbearing rather than just having more general impoverishing effects, gave young people without children (yet) a message that their future reproductive careers would not be supported by the state, meaning that they were affected by the policy despite not being its target audience. Similarly, it may have affected the decision-making of people whose income means they are not currently subject to the policy. However, we would be surprised if these indirect effects were more pronounced than an immediate effect on childbearing of people directly affected.
Numbers of births and fertility rates in England and Wales fell with the introduction of Conservative–Liberal Democrat austerity policies. Following a fall in the 1990s, the total fertility rate (TFR) rose from 1.63 in 2001 to plateau above 1.9 from 2008 to 2012. From 2013, when the Welfare Reform Act came into force, TFR declined to 1.44 in 2023, the lowest value since records began in 1938 (Office for National Statistics, 2024). It may be that any impact of the two-child limit itself on numbers of abortions was negligible against this background of fertility decline, associated with the ‘reproductive injustice’ of broader austerity policies (Sochas and Chanfreau, Reference Sochas and Chanfreau2024) and occurring for several years prior to the two-child limit.
One aim of the policy and other measures in the 2015 Summer budget was to increase earned income among low-income parents, via increased working hours and increased employment. Reader and colleagues found that the two-child limit had no association with increased employment among adults in larger low-income families (Reader et al., Reference Reader, Andersen, Patrick, Reeves and Stewart2023). That analysis found that the labour market activity of adults in larger low-income families was not responsive to income reductions, probably owing primarily to caring commitments for children. The competition between time spent on childcare and on paid work is consistent with the earlier finding of Brewer and colleagues (Reference Brewer, Ratcliffe and Smith2012) that increased child-related welfare support (Working Families’ Tax Credit from 1999) was associated with increased births among coupled women but not among single women. This competition can only have sharpened since 2012 as the cost of professional childcare has risen faster than incomes (Farquharson and Olorenshaw, Reference Farquharson and Olorenshaw2022; Orso, Reference Orso2023). This tension is reflected in the fact that half of households that lose support for one or more children under the policy are single-parent households (Department for Work & Pensions and HM Revenue & Customs, 2023).
Has the policy been a success?
We agree with what others have concluded: that since the two-child limit appears to have had minimal or no effects on fertility, abortions or earnings among adults in larger low-income families, it can only work to reduce already low incomes and increase poverty (Reader et al., Reference Reader, Andersen, Patrick, Reeves and Stewart2023). This was not the stated aim of the policy. Do the accumulated findings related to fertility, employment and poverty suggest that the policy met or did not meet its stated aim to achieve ‘fairness’ by making people receiving tax credits or Universal Credit ‘face the same financial choices about having children as those supporting themselves solely through work’? Does that aim make sense?
Assessing ‘fairness’ requires contrasting people on low incomes and those on incomes high enough (or with enough savings) that they are not eligible for welfare support. The question of the fairness of income inequality per se is beyond the scope of our discussion here, but in a situation of income inequality, to what extent is it a reasonable policy to try to make people on higher and low incomes ‘face the same financial choices about having children’? We see two reasons that this is an incoherent policy aim.
First, not all reductions in income are equal: less income only means impoverishment for those on lower incomes to begin with. The idea that there is a minimum income necessary for a dignified life, below which society should not let its members fall, underlies the concept of a ‘living wage’ (Loughborough University Centre for Research in Social Policy, 2024), a version of which was in fact mandated nationally (under the banner of ‘fair pay’) by the same Conservative budget that introduced the two-child limit (HM Treasury, 2015). It would have been incoherent for the government to have meant that people on low incomes even could, by definition, face the same financial choices as people on higher incomes ineligible for social security.
Second, even if parents are currently earning too much to qualify for low-income support, this may not be true for the full eighteen years of legal responsibility. People’s incomes can fall. The most extreme example of this financial vulnerability was the massive increase in UC claims following the first coronavirus lockdown: the number of UC claims for households with at least one child rose by 24 per cent from March 2020 to April 2020, from 1.24 million to 1.55 million households. This 300,000 increase included over 50,000 households with three or more children, of which over 18,000 were ineligible for support for at least one child (DWP Stat-Xplore, author’s calculations). These households were ‘supporting themselves solely through work’ in March 2020, yet by April 2020 only two of their children were eligible for support.
It is not straightforward to make ‘financial choices’ that create resilience to economic shocks years in the future. To replace the money removed from people on low incomes through this policy, such resilience would require savings of nearly £300 per child per month of future unemployment. This level of saving is difficult to achieve in the lower half of the income distribution: from already low levels, savings among the households with the lowest incomes fell during the pandemic (Handscomb et al., Reference Handscomb, Henehan and Try2021). The challenge of saving on a low income is compounded by the gradual reduction of UC once savings reach £6,000, before becoming ineligible at £16,000. Analysis by the National Institute of Economic and Social Research suggested this would worsen considerably in the following years in the bottom half of the income distribution and that many households including a majority of those in the bottom three income deciles have less than two months of (relatively low) income in savings (National Institute of Economic and Social Research, 2022). Thus, even if the policy did compel people to defer a further child until their income had increased above the level at which they would receive UC, they would remain vulnerable and be punished in future if their income fell back. In fact, for those on the lowest pay, the ability to move out of the lowest decile of income has declined markedly since 2015, after some years of improvement (Wadsworth, Reference Wadsworth2024).
Possible explanations beyond austerity
We do not consider there to be a desirable or undesirable level of abortion. There are a wide range of circumstances in which an individual chooses to terminate their pregnancy; at the same time, individual decisions in aggregate may indicate something about the social forces operating in a shared social context, compelling some women to terminate otherwise wanted pregnancies. As such, our main aim was not to explain abortion numbers per se but rather to assess their association with the two-child limit. Given our findings, we wonder whether social forces other than social security policy may have driven the sharp rise after 2016. Whether these abortions represent people deciding not to have (more) children at all, or deferring that decision, the increase occurred across socio-economic levels and particularly among young people without children. An unprecedented proportion of eighteen- to twenty-five-year-olds in the UK intend to remain childless (Berrington et al., Reference Berrington, Kuang and Perelli-Harris2024), although growing up under austerity may have influenced this intention.
Studies suggest that perceived economic and social uncertainty is associated with lower fertility intentions (Vignoli et al., Reference Vignoli, Guetto, Bazzani, Pirani and Minello2020; Comolli, Reference Comolli2023; Raybould et al., Reference Raybould, Mynarska and Sear2023). The obvious event causing uncertainty in the UK coinciding with the rise in abortions was the Brexit referendum. Even prior to the vote in 2016, a large poll found that ‘the referendum itself and the uncertainty that it causes seems to have made voters claim to be far less likely to start or extend a family regardless of the result’ (Opinium and LSE, 2016). The Brexit vote also caused widespread uncertainty in social phenomena more obviously connected to the referendum, such as foreign investment (EY, 2022).
The number of abortions in England has continued to rise since 2021. The most recent figures, for 2022, show that the increase from 2021 to 2022 was larger than the total increase from 2016 to 2021. This coincides with major events related to both financial difficulties (the ‘cost of living crisis’ in the UK) and social uncertainty (the start of the war in Ukraine); there were similar large increases in 2022 in Germany, the Netherlands and France (especially among those under thirty years), having not seen an increase from 2013 to 2021 (Destatis (Federal Statistical Office of Germany), 2023; Inspectie Gezondheidszorg en Jeugd, 2023; Institut National d’Etudes Demographiques, 2024). Dedicated research would be needed to investigate this further.
Although concern about the climate crisis may be a growing influence on fertility decision-making, this is unlikely to explain the sudden uptick after 2016 or the patterning by parity and age in our data. Data from the Generations and Gender Survey 2022–2023 show that, in the UK, planned childlessness is only associated with environmental concerns among thirty-six- to forty-one-year-olds and, that among under-twenty-five-year-olds, people with the greatest climate concerns also have the highest fertility intentions (Berrington et al., Reference Berrington, Kuang and Perelli-Harris2024).
Conclusion
The increase in abortions in England that followed the introduction of the two-child limit was not concentrated among larger families in poorer areas, suggesting the policy was not associated with the observed rise in abortions from 2017 and that that rise was not primarily due to financial reasons. The two-child policy, which is associated with large increases in the numbers of children living in poverty, did not achieve lower fertility among larger low-income families, via abortion or other means.
Supplementary material
The supplementary material for this article can be found at https://doi.org/10.1017/S004727942500011X.
Acknowledgements
We are grateful to the Department for Health and Social Care for facilitating access to the abortion microdata. The paper is the product of the authors alone and does not represent the views of the Department for Health and Social Care.
Funding statement
This study was funded by the Economic and Social Research Council under the Secondary Data Analysis Initiative, grant reference ES/W013177/1.
S. W. was also supported by a Wellcome Trust Society and Ethics Fellowship (200335/Z/15/Z) and the National Institute of Health Research Public Health Research Programme (NIHR131709).
Competing interests
The authors declare none.


 Open access