


1. Introduction
Overconfidence is one of the most prominent and pervasive of all cognitive biases (Bazerman and Moore, Reference Bazerman and Moore2012; Kahneman, Reference Kahneman2011). It is the first bias that Daniel Kahneman said he would eliminate if he could (Shariatmadari, Reference Shariatmadari2015). Considering the ubiquity and impact of overconfidence, it is natural to ask whether certain people are more overconfident than others. Lawson et al. (Reference Lawson, Larrick and Soll2023) report ‘strong evidence for stable, individual differences in overconfidence’. Binnendyk and Pennycook (Reference Binnendyk and Pennycook2024) concluded that ‘some individuals consistently overestimate their abilities’ and that this overestimation predicted their endorsement of conspiracy theories, overclaiming, and receptivity to bullshit.
These claims are bolstered by studies reporting relationships between overconfidence and other traits. For example, researchers have claimed that ‘narcissists have higher levels of confidence’ (O’Reilly and Hall, Reference O’Reilly and Hall2021); that ‘men are more overconfident than women’ (Bengtsson et al., Reference Bengtsson, Persson and Willenhag2005); and that some CEOs are more overconfident than others (Malmendier and Tate, Reference Malmendier and Tate2005). If some people are consistently more overconfident, it follows that certain professions, such as entrepreneurship, might select the most overconfident, whereas other professions, such as reinsurance or disaster preparedness, might select against them (Hogarth and Karelaia, Reference Hogarth and Karelaia2012; Larkin and Leider, Reference Larkin and Leider2012). All of this is premised on the claim that overconfidence is a stable trait that varies between people—that some people are consistently more overconfident than others.
We ask whether overconfidence is consistent within a person. Put another way, is overconfidence more similar to intelligence or risk preferences? General intelligence is generally accepted as an individual difference; one’s intelligence is somewhat consistent from one situation to the next (Spearman, Reference Spearman1961), though scholars have identified multiple types of intelligence (Gardner and Hatch, Reference Gardner and Hatch1989) and some continue to argue that it is not a trait but rather an interaction between a person and situation (Sternberg, Reference Sternberg2021).
Conversely, evidence suggests that risk preferences are not stable across situations (Weber et al., Reference Weber, Shafir and Blais2004). Some skydivers invest conservatively and some gamblers drive cautiously (Weber and Johnson, Reference Weber and Johnson2009). Nevertheless, some researchers have treated risk preferences as if they represented traits (Holt and Laury, Reference Holt and Laury2002). We ask whether overconfidence is more like intelligence or risk preferences; in other words, whether there is evidence of some general overconfidence trait that is observable across situations and tasks.
1.1. Prior findings
Overconfidence is being more confident than is justified or deserved (Moore and Dev, Reference Moore, Dev, Zeigler-Hill and Shackelford2017). We distinguish overconfidence from constructs such as confidence and optimism; overconfidence compares subjective beliefs with the truth. For example, someone who is confident in their performance on a math test may not be overconfident if, in reality, they perform very well; if they perform badly despite their confidence, we would call them overconfident. Scholars have examined three primary forms of overconfidence, each form distinguished by its truthful benchmark (Moore and Schatz, Reference Moore and Schatz2017): overestimation is thinking that you are better than you are (e.g., thinking that you answered 5 questions correctly when you only got 3); overplacement is the exaggerated belief that you are better than others (e.g., thinking that you were in the top 10% of the class when you were in the bottom 10%); overprecision is being too sure you know the truth (e.g., being 100% certain that you answered 5 questions correctly when you answered 8). Although one could conceive of overprecision as a specific instance of overestimation—overestimating your ability to identify the truth—we distinguish them by operationalizing overprecision as relating to certainty in judgment, and overestimation as relating to performance on a task.
What would it mean for there to be some general overconfidence trait? Overconfidence would have to persist across forms, times, or measures within individuals. Empirically, we would expect to observe correlations between overconfidence measures across tasks and time, at least within the same form of overconfidence. We would also expect that at least one related stable trait measure would predict overconfidence in at least one form and potentially point toward why some people might be more overconfident than others. For example, if overconfidence was at least partially caused by a failure to evaluate contradictory evidence, we might expect actively open-minded thinking to correlate with overprecision when contradictory evidence is within reach. Actively open-minded thinkers are better-calibrated forecasters (Mellers et al., Reference Mellers, Stone, Atanasov, Rohrbaugh, Metz, Ungar, Bishop, Horowitz, Merkle and Tetlock2015), while those who are less open-minded tend to favor information that confirms preexisting beliefs (Stanovich et al., Reference Stanovich, West and Toplak2013), that is, are susceptible to myside bias. It could also be the case that meta-reasoning ability—the ability to monitor one’s own reasoning, including feelings of being right or wrong (Ackerman and Thompson, Reference Ackerman and Thompson2017)—is related to general intelligence or cognitive ability, in which case we might expect more intelligent people to also be better calibrated. Previous research has suggested that people with higher reasoning abilities are less susceptible to common heuristics and biases (Jackson et al., Reference Jackson, Kleitman, Howie and Stankov2016) so we might expect them to also be less susceptible to overconfidence. If, on the other hand, individuals construct confidence judgments at the moment, then situational influences will prevail. For example, people will think they are better than others on easy tasks but worse than others on hard tasks, inserting situational variation that diminishes any stability from an individual difference (Moore and Small, Reference Moore and Small2007).
We take two approaches to reviewing the published literature. First, we ask whether overconfidence correlates with individual traits or with demographics; such evidence would point towards overconfidence resulting from within-individual stability. Second, we review studies that consider correlations between similar measures of overconfidence across different contexts. If overconfidence is an individual difference, we would expect to see stability within individuals across different contexts, such as domains and time. Our results leave us concerned about the strength and consistency of the evidence.
We start by considering the relationship between overconfidence and demographics. Perhaps the most high-profile claim is that men are more overconfident than women; indeed, stereotypes hold that men are excessively certain of their views (which is why they ‘mansplain’). Barber and Odean (Reference Barber and Odean2001) find that men invest more than women but have lower returns, and Niederle and Vesterlund (Reference Niederle and Vesterlund2007) find that men overplace their performances on arithmetic tasks more than women. However, it seems that these gender differences may be task-dependent (Beyer, Reference Beyer1990; Dahlbom et al., Reference Dahlbom, Jakobsson, Jakobsson and Kotsadam2011; Lundeberg et al., Reference Lundeberg, Fox and Punćcohaŕ1994); for example, Exley and Kessler (Reference Exley and Kessler2022) find gender gaps in self-evaluations on male-typed subjects (math and science) but not in female-typed subjects (verbal skills). Further, several studies have failed to replicate gender differences in overconfidence even on similar finance-related tasks (e.g., Acker and Duck, Reference Acker and Duck2008; Deaves et al., Reference Deaves, Lüders and Schröder2010). Finally, while there is some evidence that certainty might increase with age (Crawford and Stankov, Reference Crawford and Stankov1996), this does not seem to hold for overestimation or overplacement (Prims and Moore, Reference Prims and Moore2017), and may be dependent on specific measures of precision (Hansson et al., Reference Hansson, Rönnlund, Juslin and Nilsson2008).
Similarly, evidence is inconsistent on whether personality traits correlate with overconfidence. For example, some scholars have found a positive association between narcissism and overconfidence (Ames and Kammrath, Reference Ames and Kammrath2004; Binnendyk and Pennycook, Reference Binnendyk and Pennycook2024; Campbell et al., Reference Campbell, Goodie and Foster2004), perhaps because narcissists possess a grandiose self-assessment which makes it difficult for them to admit their own shortcomings or uncertainty; however, others have failed to replicate this claim (Moore and Swift, Reference Moore, Swift, Van Dick and Murnighan2010). Results testing whether thinking styles are related to overconfidence are also contradictory; research on conspiracy beliefs (Pennycook et al., Reference Pennycook, Binnendyk and Rand2022) and bullshit receptivity (Littrell et al., Reference Littrell, Risko and Fugelsang2021) report that these traits correlate with overestimation of cognitive abilities, while Hoppe and Kusterer (Reference Hoppe and Kusterer2011) report no predictive effect of cognitive reflection on overestimation. Recent research on intellectual humility reports inconsistent relationships with overconfidence that are measure-dependent for both intellectual humility and overconfidence (Bowes et al., Reference Bowes, Ringwood and Tasimi2024). Spiller (Reference Spiller2024) notes that some of these inconsistencies may be due to correlations between measures of overconfidence and ability. The results are mixed, to say the least, and the literature has not achieved consensus around any one of these traits consistently predicting overconfidence. Publication bias would also predict that null relationships between overconfidence and trait measures are less likely to be present in the published literature than positive ones.
The second kind of evidence we review asks whether similar measures of overconfidence correlate with each other across performance domains. This is a low bar, which only seeks test-retest reliability. While there seems to be evidence for within-individual stability of confidence (Pallier et al., Reference Pallier, Wilkinson, Danthiir, Kleitman, Knezevic, Stankov and Roberts2002; Stankov and Crawford, Reference Stankov and Crawford1996), evidence for overconfidence is less consistent. The strongest case for overestimation comes from Klayman et al. (Reference Klayman, Soll, González-Vallejo and Barlas1999)’s assessment of overestimation of performance on various tests, such as people’s estimates of life expectancies in various countries around the world; they report within-person correlations in the neighborhood of .5. However, West and Stanovich (Reference West and Stanovich1997) report lower correlations between .07 and .24 between overestimation on a general knowledge test and overestimation on predicted performance on a motor task in which participants slid pennies into a target zone. Bornstein and Zickafoose (Reference Bornstein and Zickafoose1999) found a correlation of 0.3 between overestimation on a general knowledge task and overestimation on an eyewitness memory test. The strongest evidence of test-retest reliability for overprecision is Moore and Healy’s (Reference Moore and Healy2008) high reliability (α = 0.95) within participants on a particular measure of the certainty (overprecision) with which they estimated quiz scores; however, they found lower reliability for overestimation (α = 0.21) and overplacement (α = 0.29).
Given the inconsistencies in prior research, the present research confronts at least three issues. First, we test domain generality. If there are robust individual differences in overconfidence, then those differences must be generalized across domains. Second, we test the persistence of overconfidence over time. Most of the studies examining domain generality measured overconfidence at a single time point. There are a few exceptions; Glaser et al. (Reference Glaser, Langer and Weber2005) find weak pairwise correlations between overprecision on stock market forecasting tasks spaced 2 weeks apart; Jonsson and Allwood (Reference Jonsson and Allwood2003) report consistent confidence calibration on verbal and visual reasoning tests spaced 2 weeks apart. In addition, data from Massey et al. (Reference Massey, Simmons and Armor2011) reveal modest correlations from week to week in sports fans’ optimism about their team’s chances of winning, though these relationships were not the focus of the article. Aside from these studies, there is little data on whether overconfidence persists over time.
The third issue arises from a basic omission in the published literature: Do different measures of the same form of overconfidence even correlate with one another? The best hope to find a stable individual difference would seem to be overprecision, given the alpha reliability of .95 in Moore and Healy’s (Reference Moore and Healy2008) data. However, the question remains whether this reliability generalizes to other measures of overprecision. Researchers have employed many measures of overprecision including confidence interval widths (Langnickel and Zeisberger, Reference Langnickel and Zeisberger2016), Likert-scale confidence (Brewer and Sampaio, Reference Brewer and Sampaio2012), and belief distributions (Haran et al., Reference Haran, Moore and Morewedge2010). If there are reliable differences between people in their overconfidence, different approaches to measuring the same construct must correlate with one another if each measure is reliable and valid. To our knowledge, research has not tested correlations between various measures of precision. If there are several valid approaches to eliciting certainty, then assessing the degree to which different measures correspond with one another is crucial to understanding the underlying phenomenon.
1.2. Overview of the present research
Study 1a assesses the within-individual stability of each form of overconfidence across three different tasks. Study 1b is a replication of Study 1a with the same participants as in Study 1a, 10 months later; thus, Study 1b serves the dual purpose of measuring test-retest reliability and the persistence of overconfidence across time. Study 2 assesses the within-individual stability of each form of overconfidence on a similar task at two different time points with less attrition than Studies 1a and 1b. Studies 3a and 3b test the degree to which different measures of overprecision correlate with one another. In sum, these studies test the stability of overconfidence the within-individual between different task domains, time points, and measures.
In addition to measures of overconfidence, we also measure the following traits (see Table 1 for a list of measures by study for a summary of our measured correlations with overconfidence): gender, age, the Big Five personality traits (Schaefer et al., Reference Schaefer, Williams, Goodie and Campbell2004), narcissism (O’Reilly and Hall, Reference O’Reilly and Hall2021), intellectual humility (Krumrei-Mancuso and Rouse, Reference Krumrei-Mancuso and Rouse2016), actively open-minded thinking (Haran et al., Reference Haran, Ritov and Mellers2013), need for cognition (Lins de Holanda Coelho et al., Reference Lins de Holanda Coelho, HP Hanel and J Wolf2020), and need for cognitive closure (Webster and Kruglanski, Reference Webster and Kruglanski1994). We selected some of these because of existing published claims, e.g., on gender differences in overconfidence (Niederle and Vesterlund, Reference Niederle and Vesterlund2007). We selected other traits due to their seeming conceptual overlap with overconfidence. Scholars have theorized that overprecision is a result of error neglect, that is, simply not knowing the ways in which one is wrong (Moore, Reference Moore2023), and empirical evidence has suggested that forcing people to consider alternative possibilities—that is, ways in which they are wrong—can reduce overprecision (Koriat et al., Reference Koriat, Lichtenstein and Fischhoff1980; Walters et al., Reference Walters, Fernbach, Fox and Sloman2017). If actively open-minded thinking is a ‘summary measure…on the decisions to remain open to further thinking’ then one might speculate that actively open-minded thinkers who are more likely to weigh contrary evidence would also be more aware of the possibilities of contrary evidence, and therefore, be less likely to overestimate their performance and be less overprecise. Conversely, people who have a high need for cognitive closure and value identifying one specific answer might be more overprecise.
Table 1 Summary of confidence and trait measures collected by study
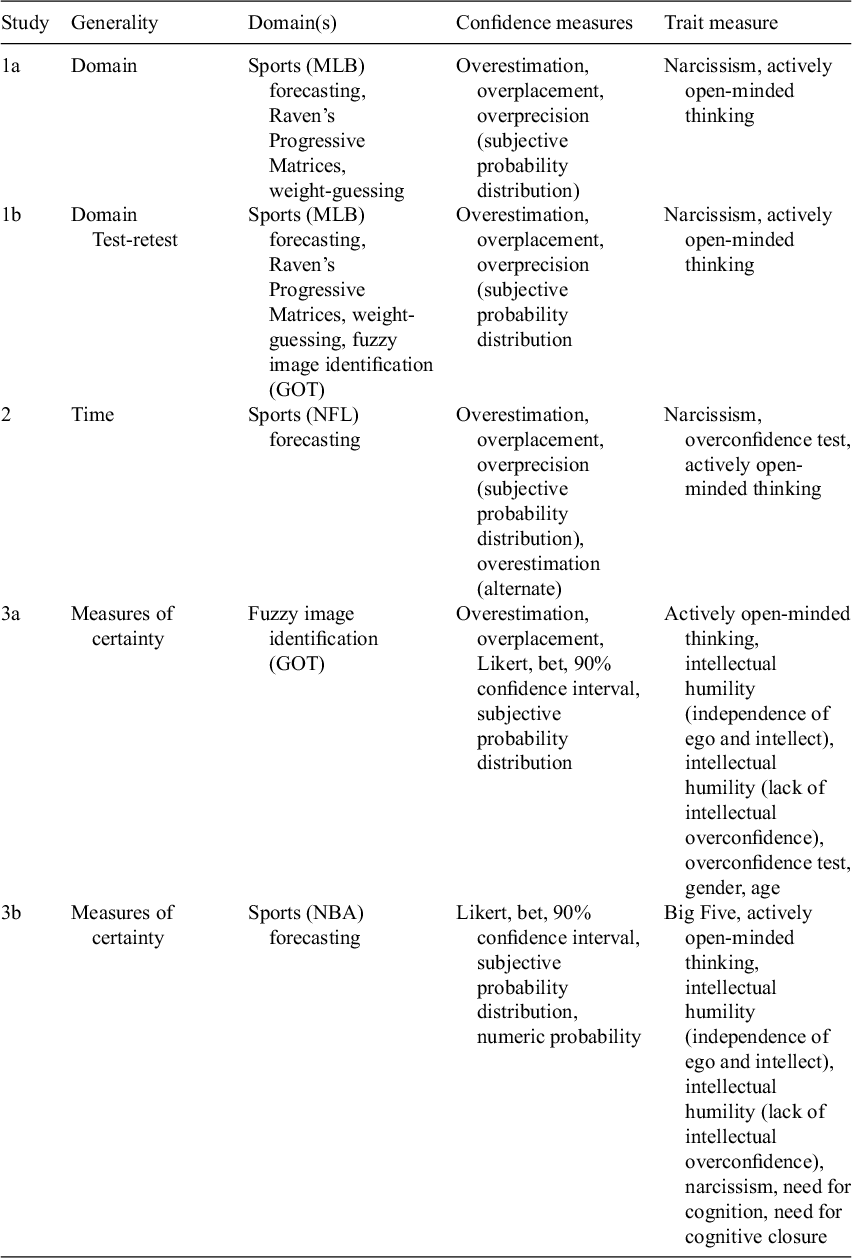
Our article makes several contributions. First, we test the consistency of different forms of overconfidence across task domains. Second, we examine the intertemporal consistency of all three forms of overconfidence. Third, we elicit several different measures of overconfidence within the same study. Fourth, we collect a comprehensive (though non-exhaustive) suite of trait measures throughout our studies for which there are mixed or reasonably hypothesized claims of relationships with overconfidence.
Our data are correlational. We offer our own interpretation of the correlations, but we invite our readers to come to their own conclusions. We would offer a few numbers to put our results in context: Mischel’s (Reference Mischel1968) conclusion that correlations between behaviors in different situations below .4 should be interpreted as poor consistency; Fleeson and Gallagher’s (Reference Fleeson and Gallagher2009) observations of the correlation between personality traits and their behavioral manifestations around .4; the interpretation of Pearson correlation coefficient of .3 for individual differences using personality measures as ‘weak’ (Evans, Reference Evans1996) or ‘small’ (Cohen, Reference Cohen1988) to ‘moderate’ (Funder and Ozer, Reference Funder and Ozer2019; Gignac and Szodorai, Reference Gignac and Szodorai2016).
1.3. Transparency and openness
We preregistered all of our studies and reported deviations from those preregistrations in the main text. We report how we determined our sample size, all data exclusions (if any), all manipulations, and all measures in the study. All preregistered analyses, including secondary ones, are reported either in the main text or in the Supplementary Material. The Supplementary Materials, data, and code for all studies are available online at https://osf.io/tb2me/?view_only=77b881f0b92647689270ed3b485366f9.
2. Study 1a: Overconfidence across domains
Study 1a tests whether each of the three forms of overconfidence is consistent across domains. Specifically, we measured each of the three forms of overconfidence in participants’ performance in three different domains: predicting winners of Major League Baseball games, Raven’s Progressive Matrices, and a weight-guessing task. Participants completed a ten-item test in each of the three domains; then, they reported their confidence about their own performance (estimation and overplacement), others’ performance (placement), and their certainty about the score distribution of all participants (precision). We would interpret high correlations between overconfidence measures across tasks and forms of overconfidence as evidence in favor of a general overconfidence trait. Further, we elicited measures of narcissism and actively open-minded thinking; we would interpret positive correlations between narcissism and measures of overconfidence—particularly overestimation and overplacement if narcissists have excessively positive views of themselves and their skills—and negative correlations between actively open-minded thinking and overconfidence (most likely overprecision), as evidence in favor of a general overconfidence trait.
2.1. Method
We preregistered this study at https://aspredicted.org/MZ5_5ZX on July 12, 2023 before data collection began on July 13, 2023.
2.1.1. Participants
We noted in the consent form and advertisement on Cloud Research that we were looking for Major League Baseball (MLB) fans to complete the survey. In addition, participants had to pass three screening questions at the beginning of the survey. First, we asked participants ‘Do you identify as an MLB fan?’ and stopped those who answered ‘No’ from completing the survey. In addition, we asked participants two multiple-choice questions about the champion and runners-up of the prior year’s World Series; only those who answered both correctly could proceed. These screening criteria excluded 118 potential participants. We selected this sports forecasting context based on a pretest (see the Supplementary Material), where laypeople suggested the sports forecasting context as most likely to reveal stable overconfidence within individuals.
Four hundred and two participants from CloudResearch passed the screening criteria. We excluded nine participants who straightlined (answered every item with the same response) the actively open-minded thinking scale and 12 participants whose reported estimates for the average of other scores’ differed by more than 2 from the mean of their reported subjective probability distributions for the same estimate, leaving us with a final sample of 381 participants. Our participants were 46.19% male, 53.28% female, 0.52% other gender; 70.6% White / 6.04% Asian / 10.76% Black / 6.3% Hispanic / 6.3% other race; ${M}_{age}$
= 35.16,
${M}_{age}$
= 35.16, $S{D}_{age}$
= 10.46; with a median education level of a Bachelor’s degree in college. Participants earned $3.00 for the study, which took 19.34 min on average.
$S{D}_{age}$
= 10.46; with a median education level of a Bachelor’s degree in college. Participants earned $3.00 for the study, which took 19.34 min on average.
This study required two rounds of data collection because we failed to attain the planned sample by the time the forecasted games began. The first round of data came in between July 13 and July 21, 2023 with participants forecasting MLB games that took place on July 21. The second round came in between July 27 and July 31, 2023 with participants forecasting MLB games that took place on August 4.
2.1.2. Procedure
Participants each completed three tasks, presented in a randomized order: forecasting the outcomes of 10 regular-season MLB games that would take place on July 27 or August 4, 2023 by predicting the winner (binary choice) of each game; 10 of the eight-choice questions from the short form of the Advanced Progressive Matrices (specifically questions 3, 12, 15, 16, 18, 21, 22, 28, 30, and 34; Bors and Stokes, Reference Bors and Stokes1998), a more difficult version of Raven’s Progressive Matrices (RPM); and a ten-question weight-guessing task (WGT) in which participants gave point estimates (in pounds) of the weights of photographed individuals.
After each task, participants reported confidence. Specifically, they estimated their score (out of 10), the percentage of other participants in the study they believed they outperformed (0–100%), the average score for all participants (out of 10), and the distribution of scores for all participants, measured via a subjective probability distribution (SPD). Participants then completed two trait measures: narcissism (NPI) and actively open-minded thinking (AOT). Finally, participants reported gender, age, education, and ethnicity.
2.1.3. Measures
Actual Scores (Accuracy). Participants’ actual scores (MMLB = 5.02, SD = 1.55; MRPM = 4.38, SD = 2.15; MWGT = 1.85, SD = 1.54) were calculated as follows: for MLB forecasting, participants received 1 point for every game whose winner they predicted correctly; for Raven’s Progressive Matrices, participants received 1 point for every question answered correctly; for weight-guessing, participants received 1 point for every weight was within 10 pounds of their guess.
Confidence (Estimation). After each test, participants estimated their scores out of 10, for example, ‘How many questions out of 10 do you think you got correct on this visual reasoning test?’ (MMLB = 5.49, SD = 1.72; MRPM = 4.21, SD = 2.06; MWGT = 5.40, SD = 2.16). For the weight-guessing task, we also informed participants that ‘a guess counts as ‘correct’ if your estimate falls within 10 lbs (above or below) the person’s actual weight’.
Confidence (Placement). For our primary measure of overplacement, we asked participants to estimate the average score of all participants in the study, e.g., ‘Several hundred other participants also completed this test. What do you think the average score of all participants in the study will be?’ (MMLB = 5.36, SD = 1.35; MRPM = 4.74, SD = 1.48; MWGT = 5.28, SD = 1.46). We calculated placement, that is, the degree to which participants think they are better than others, by subtracting participants’ estimates of the average of others scores from their estimates of their own scores (MMLB = 0.13, SD = 1.87; MRPM = −0.53, SD = 2.12; MWGT = 0.13, SD = 1.83). Our secondary measure of placement was based on an estimate of percentile and directly asked participants, ‘What percentage of other participants in this study do you think you scored higher than?’ (MMLB = 42.45, SD = 21.30; MRPM = 38.46, SD = 25.18; MWGT = 41.97, SD = 23.23).
Confidence (Precision). We asked participants to complete a subjective probability distribution for the distribution of all participants’ scores on each test, e.g., ‘For each row, estimate the percentage of other participants who scored that many points on this MLB Prediction test’ (from 0 to 10). Participants then adjusted a series of 11 slider bars to indicate the percentage for each score. We calculated variance from participants’ subjective probability distributions of the score distribution by (a) calculating the mean of the distribution by summing the product of each score and its probability, and (b) squaring the distance from the mean for each score and summing each squared distance with its associated probability (MMLB = 5.58, SD = 2.67; MRPM = 5.24, SDRPM = 2.65; MWGT = 5.40, SD = 2.65).
Overestimation. For each of the three tests, we calculated overestimation as the participant’s estimated scores minus their actual score (MMLB = 0.47, SD = 2.22; MRPM = −0.18, SD = 2.265 MWGT = 3.56, SD = 2.69). Calculating overestimation by subtracting a participant’s actual score follows prior literature, e.g., Moore and Healy (Reference Moore and Healy2008).
Overplacement. For each of the three tasks, we calculated overplacement as (estimated own score − estimate of mean score of all participants) − (actual own score − actual mean score of all participants) (MMLB = 0.12, SD = 2.36; MRPM = −0.58, SD = 2.39; MWGT = 0.10, SD = 2.41). Calculating overplacement using this formula follows prior literature, e.g., Logg et al. (Reference Logg, Haran and Moore2018). We also calculated a secondary (percentile-based, sometimes known as direct overplacement) measure of overplacement as (estimated own percentile rank − actual own percentile rank) (MMLB = 1.34, SD = 36.18; MRPM = −5.78, SD = 33.16; MWGT = 1.29, SD = 38.53). For the secondary measure of placement and overplacement, we include results but do not discuss them. In general, their inter-task and inter-time correlations are weaker than those of the indirect measure based on average score estimates.
Overprecision. For each of the three tasks, we calculated overprecision by calculating (actual variance of participants’ scores − variance of subjective probability distribution) (MMLB = −3.18, SD = 2.67; MRPM = −0.61, SD = 2.65; MWGT = −3.02, SD = 2.65)Footnote 1. Calculating precision and overprecision based on the variance of a subjective probability distribution follows previous literature (Haran et al., Reference Haran, Moore and Morewedge2010; Moore, Carter, et al., Reference Moore, Carter and Yang2015). Although there are many possible measures of precision and overprecision, as employed in Studies 3a and 3b, we selected subjective probability distribution because of evidence suggesting these histogram elicitations result in better-calibrated judgments than point estimates or confidence intervals (Goldstein and Rothschild, Reference Goldstein and Rothschild2014). Further, this measure allows us to capture overprecision (not just precision) with only one measure per task, as compared to methods such as several different estimates and confidence intervals to measure calibration.
Narcissism. Participants completed the 16-item Narcissistic Personality Inventory (Ames et al., Reference Ames, Rose and Anderson2006); each item presented two contrasting statements and participants were instructed to choose ‘the statement (left or right) that best describes you,’ for example, ‘I really like to be the center of attention’ versus ‘It makes me uncomfortable to be the center of attention,’ α = 0.73, M = 12.40, SD = 2.96.
Actively open-minded thinking. Participants completed the 7-item actively open-minded thinking scale (Haran et al., Reference Haran, Ritov and Mellers2013), for example, ‘People should take into consideration evidence that goes against their opinions’, 1 = ‘strongly disagree’ to 5 = ‘strongly agree’ α = 0.74, M = 3.76, SD = 0.53.
2.2. Results
2.2.1. Correlations across domains
This study’s key analyses are the pairwise correlations of each type of overconfidence between tasks (see Table 2). The average (across task domains) inter-task correlations for each form of overconfidence were relatively weak on overestimation (0.12) and overplacement (0.10), and higher on overprecision (0.68). Despite the correlations being relatively low in absolute value, several pairwise correlations were significantly >0. Overestimation on the MLB forecasting task was correlated positively with both overestimation on Raven’s Progressive Matrices, r = .22, p < .001, and overestimation on the weight-guessing task, r = .15, p = .004; however, overestimation on Raven’s Progressive Matrices was uncorrelated with overestimation on the weight-guessing task, r = −.01, p = .921. Overplacement on the baseball forecasting task was positively correlated with overplacement on Raven’s Progressive Matrices, r = .19, p < .001, and on the weight-guessing task, r = .12, p = .021, but overplacement on Raven’s Progressive Matrices was not correlated with overplacement on the weight-guessing task, r = .01, p = .862. We obtained high correlations between overprecision measures for each pair of tasks, rs > .6, ps < .001, all dfs = 379.
Table 2 Studies 1a and 1b inter-task correlations for accuracy, confidence, and overconfidence

Note: Asterisks denote results of two-tailed tests comparing the correlations to 0, *p<.05, **p<.01, ***p<.001.
Although the focus of this article is on overconfidence rather than confidence, some have argued that subtracting accuracy from confidence may mostly add noise (Binnendyk and Pennycook, Reference Binnendyk and Pennycook2024). In this study, one could make this argument for both the MLB forecasting task and the weight-guessing task, as confidence (score estimate) was not correlated with accuracy (actual score) on either task, rMLB = .08, p = .125, rWGT = −.03, p = .596. Thus, we report correlations between confidence measures in addition to overconfidence measures in Table 2. Strikingly, participants’ confidence as measured by their score estimates, score estimates minus estimates of others’ average scores, and narrowness of their subjective probability distribution of others’ scores, are all positively correlated with each other across tasks (with the exception of the relationship between score estimation on the RPM and weight-guessing tasks, r(377) = .09, p = .078).
2.2.2. Correlations between overconfidence and trait measures
We report all correlations between overconfidence measures and trait measures in Table 3, and all correlations between trait measures and confidence and accuracy in the Supplementary Material. Actively open-minded thinking was negatively correlated with both overestimation, r = −.15, p = .004, and overplacement, r = −.11, p = .029, on Raven’s Progressive Matrices. Notably, actively open-minded thinkers were also more accurate on this task, r = .21, p < .001, but did not estimate their performance significantly more highly, r = .07, p = .196, or place, r = .10, p = .059. Surprisingly (to us), actively open-minded thinking was positively correlated with precision on all three tasks, significantly on the MLB forecasting and weight-guessing tasks and directionally on Raven’s Progressive Matrices. In other words, actively open-minded thinkers had narrower subjective probability distributions; given that our participants were on average underprecise with regard to the score distribution of all participants, actively open-minded thinkers were actually better calibrated.
Table 3 Studies 1a and 2: Correlations between overconfidence and trait measures
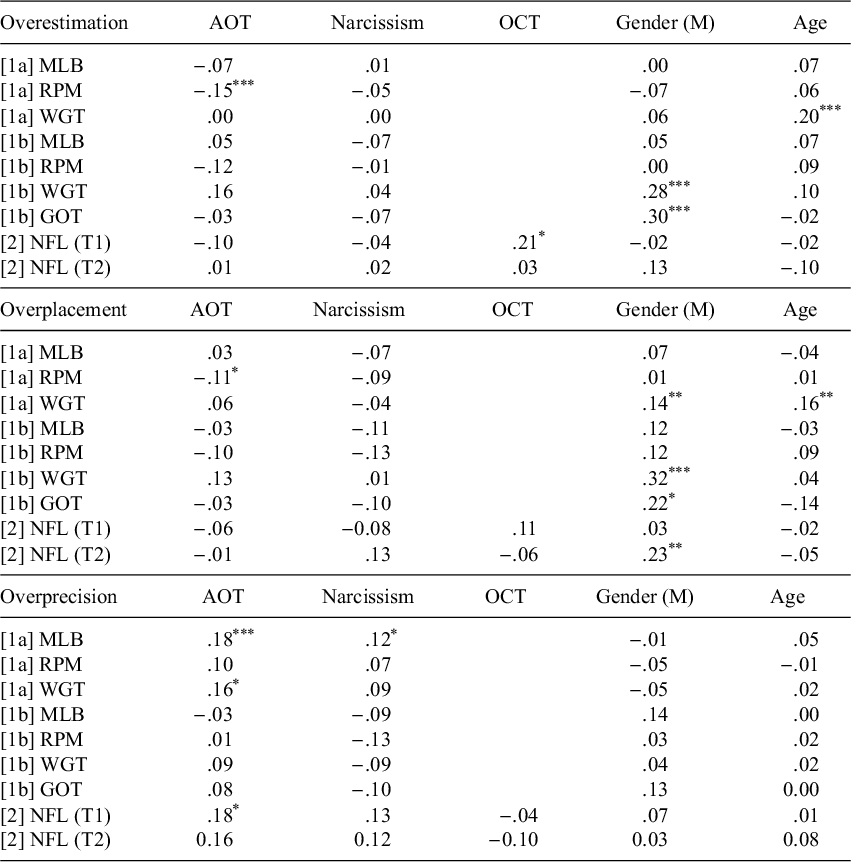
Note: Asterisks denote results of two-tailed tests comparing the correlations to 0, *p<.05, **p<.01, ***p<.001.
Male gender correlated with overplacement only on the weight-guessing task, r = .14, p = .007. However, gender was actually correlated with placement on all three tasks, rMLB = .24, p < .001, rRPM = .17, p < .001, rWGT = .13, p = .012; in other words, men thought they would perform better than other participants in the study on all three tasks, compared to women. However, it seems that being male was actually correlated with better performance on both the MLB forecasting task, r = .17, p = .001, and Raven’s Progressive Matrices, r = .16, p = .002, so only overplacement on the weight-guessing task remains significantly positive after subtracting performance.
Finally, we note that age was positively correlated with overestimation on the weight-guessing task, r = .20, p < .001. Interestingly, this is driven by both a positive relationship between age and score estimation, r = .13, p = .013, and a negative relationship with accuracy, r = −.18, p < .001. We do not have strong hypotheses about why age would increase overestimation on this task alone nor does this relationship replicate in Study 1b.
2.3. Discussion
Our observation that overprecision correlates across tasks is consistent with previous literature; for example, Moore and Healy (Reference Moore and Healy2008) report an alpha of 0.95 when looking at overprecision across a set of trivia tests. Our inter-task correlations for overestimation and overplacement vary between .03 and .25, similar to the range West and Stanovich (Reference West and Stanovich1997) report and lower than the .50 reported by Klayman et al. (Reference Klayman, Soll, González-Vallejo and Barlas1999). While some of these inter-task correlations are positive, in absolute terms it seems that only our measurement of overprecision is consistently correlated between tasks. We acknowledge that all of the correlations are positive; we interpret this as weak (but nonzero) support for within-individual stability of overconfidence as a trait. Further, we note that the inter-task correlations between confidence measures are all positive. However, because we are studying overconfidence, we believe that subtracting accuracy or otherwise adjusting for it is necessary by definition.
Interestingly, we do observe some correlations between trait measures and overconfidence, though they appeared to be task-specific. Actively open-minded thinkers overestimated themselves less on Raven’s Progressive Matrices, which is a task where it is relatively easier to know when you have arrived at the correct answer. Men placed themselves higher than women on all three tasks, though they only overplaced more on the weight-guessing task as they performed better on the MLB forecasting and Raven’s Progressive Matrices task.
3. Study 1b: Overconfidence across domains and time
In Study 1b, we followed up with the participants from Study 1a after 10 months with a nearly identical survey; the only difference was that we added a fourth task to elicit overconfidence measures—the Generalized Overconfidence Task from Binnendyk and Pennycook (Reference Binnendyk and Pennycook2024). The two primary purposes of this study were to replicate findings from Study 1a on weak cross-domain relationships and relationships with other trait measures and determine test-retest reliability for the three measures of overconfidence on Raven’s Progressive Matrices and the weight-guessing task.
3.1. Method
We preregistered this study at https://aspredicted.org/MNZ_W2V on May 21, before data collection began on May 22, 2024.
3.1.1. Participants
We recruited as many of our original Study 1a participants as possible before the forecasted events (professional baseball games) passed. 151 of our original 381 participants entered the survey. We excluded five participants who straightlined the actively open-minded thinking scale, one who straightlined the narcissism scale, two participants whose reported estimates for the average of other scores’ differed by more than two from the mean of their reported subjective probability distributions for the same estimate on all four tasks, and five participants who failed one of our two bogus-item attention checks, leaving us with a final sample of 138 participants who had usable data at both time points. Our participants were 49.69% male, 49.07% female, 1.24% other gender; 68.32% White / 4.35% Asian / 14.29% Black / 5.59% Hispanic / 7.45% Other, ${M}_{age}$
= 38.45,
${M}_{age}$
= 38.45, $S{D}_{age}$
= 11.36. Participants earned $6.00 for participating in the study, which on average took 27.91 min.
$S{D}_{age}$
= 11.36. Participants earned $6.00 for participating in the study, which on average took 27.91 min.
We compared those who did and did not return on the following data from Study 1a: demographics (age, gender), actively open-minded thinking, and each measure of accuracy and confidence. We note that the 153 participants who returned for Study 1b were significantly older than those who did not return (M 1b = 38.07, SD = 11.76; M 1a only = 33.51, SD = 9.27), t(234.18) = 3.92, p < .001, d = 0.45, and overplaced less on Raven’s Progressive Matrices than those who did not return (M 1b = −0.49, SD = 2.25; M 1a only = 0, SD = 2.24), t(283.65) = 2.07, p = .039, d = 0.22. These two groups of participants did not significantly differ on any other demographics, confidence, or overconfidence measures (see the Supplementary Material for details).
3.1.2. Procedure
Study 1b was similar to Study 1a, with the following changes. For the MLB forecasting task, participants predicted the outcomes of 10 MLB games that occurred on June 2, 2024. We added a fourth task, Binnendyk and Pennycook’s (Reference Binnendyk and Pennycook2024) Generalized Overconfidence Task, in which participants try to guess which of two choices is pictured in a fuzzy image. Participants see 10 nearly indiscernible blurred images, each for 0.25 s, and guess whether the image is one of two options (e.g., a chimpanzee or a baseball player). Participants answered the same set of 10 questions for the Raven’s Progressive Matrices and saw the same 10 images for the weight guessing task.
3.1.3. Measures
Actual Scores (Accuracy). As in Study 1a, we measured accuracy the same way in Study 1a (MMLB = 4.85, SD = 1.41; MRPM = 4.29, SD = 2.04; MWGT = 1.59, SD = 1.48; MGOT = 5.57, SD = 1.61).
Confidence (Estimation). As in Study 1a, we measured estimation as participants’ estimates of their own scores (MMLB = 5.08, SD = 1.77; MRPM = 3.99, SD = 2.09; MWGT = 5.18, SD = 1.84; M GOT = 2.36, SD = 1.97).
Confidence (Placement). As in Study 1a, we measured placement primarily by asking participants to estimate the average score of all participants in the study (MMLB = 5.22, SD = 1.27; MRPM = 4.65, SD = 1.40; MWGT = 4.95, SD = 1.34; MGOT = 3.94, SD = 1.67) and then subtracting participants’ estimates of others’ average score from their estimates of their own score (MMLB = −0.14, SD = 1.72; MRPM = −0.66, SD = 2.04; MWGT = 0.23, SD = 1.54; MGOT = −1.61, SD = 2.20), and secondarily by measuring their estimate of their score’s percentile (MMLB = 38.29, SD = 23.20; MRPM = 35.32, SD = 24.46; MWGT = 37.55, SD = 22.70; MGOT = 29.15, SD = 27.93). These two measures of placement were correlated with each other on all three tasks, rMLB = .46, rRPM = .53, rWGT = .45, ps < .001.
Confidence (Precision). As in Study 1a, we measured precision as the variance of participants’ subjective probability distributions (MMLB = 5.23, SD = 2.47; MRPM = 5.23, SD = 2.70; MWGT = 5.47, SD = 2.61; MGOT = 5.16, SD = 2.94).
Overestimation. As in Study 1a, we measured overestimation by subtracting actual from estimated scores (MMLB = 0.23, SD = 2.16; MRPM = −0.30, SD = 2.06; MWGT = 3.59, SD = 2.53; MGOT = −3.21, SD = 2.53).
Overplacement. As in Study 1a, we calculated overplacement primarily by subtracting other-placement from self-placement (MMLB = −0.16, SD = 2.17; MRPM = −0.80, SD = 1.95; MWGT = 0.22, SD = 2.26; MGOT = −12.77, SD = 2.81), and secondarily by subtracting actual percentile rank from estimated percentile rank (MMLB = −2.60, SD = 35.61; MRPM = −10.00, SD = 30.85; MWGT = −3.68, SD = 39.79; MGOT = −11.43, SD = 38.24).
Overprecision. As in Study 1a, we measured overprecision by subtracting the variance of participant’s subjective probability distributions of others’ scores from the actual variance (MMLB = −3.12, SD = 2.47; MRPM = −0.92, SD = 2.70; MWGT = −3.33, SD = 2.61; MGOT = −2.55, SD = 2.94).
Narcissism. We used the same scale for narcissism as in Study 1a (α = 0.75, M = 12.32, SD = 3.10), except that we added one ‘bogus’ measure to serve as an attention check (‘I am paid bi-weekly by leprechauns’) which was not included in the scale calculation.
Actively open-minded thinking. We used the same scale for AOT as in Study 1a (α = .72, M = 3.79, SD = 0.54), except that we added one ‘bogus’ measure to serve as an attention check (‘I have had a fatal heart attack’) which was not included in the scale calculation.
3.2. Results
3.2.1. Correlations across time
First, we calculated cross-time correlations for each measure of accuracy, confidence, and overconfidence that were in both Studies 1a and 1b (Table 4). All nine measures of overconfidence (three measures on three tasks) were significantly positively correlated between time points; in general, cross-time correlations were higher on Raven’s Progressive Matrices and the weight-guessing task (perhaps unsurprisingly since they were the exact same questions).
Table 4 Study 1a–1b test–retest reliability for accuracy, confidence, and overconfidence
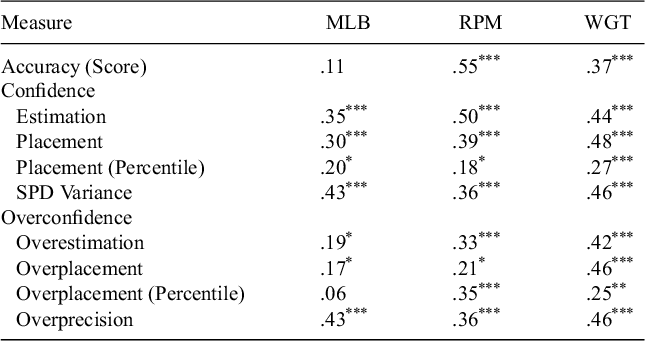
Accuracy was correlated across time points on both Raven’s Progressive Matrices, r = .55, p < .001, and the weight-guessing task, r = .37, p < .001, but not on the MLB forecasting task, r = .11, p = .209. With the exception of placement on the MLB forecasting task, all measures of confidence were also positively correlated with themselves: score estimation, r MLB = .35, r RPM = .50, r WGT = .44, ps < .001; the difference between self-score estimation and the average of others’ score estimation, r MLB = .05, p = .535, r RPM = .30, p < .001, r WGT = .17, p = .046, percentile estimates of scores, rMLB = .30, r RPM = .39, r WGT = .48, ps < .001, and variance on subjective probability distributions of other’s scores (same correlations as inter-time correlations of overprecision, since we are simply subtracting constants).
3.2.2. Correlations across domains
We report all correlations between tasks for confidence, accuracy, and overconfidence in Table 2. In general, we observe similar patterns and magnitudes of results as in Study 1a. Average inter-task correlations for each form of overconfidence are r = .15 for overestimation, r = .19 for overplacement, and r = .65 for overprecision. In fact, the inter-task correlations for overconfidence were higher than in Study 1a. Overestimation was again significantly positively correlated between the MLB and RPM tasks, r = .19, p = .026, and the MLB and weight-guessing tasks, r = .20, p = .017. Overplacement was positively correlated between all pairs of tasks (insignificantly between the GOT and RPM and the GOT and WGT, but we note we may be underpowered in Study 1b to detect such correlations). As in Study 1a, inter-task correlations between overprecisions, all rs > .60. We also note that inter-task correlations for each confidence measure are all positive, rs > .15, though accuracy was not correlated between any of the six pairs of tasks.
3.2.3. Correlations with trait measures
We report all correlations between overconfidence and trait measuresFootnote 2 in Table 3. For the most part, we did not find statistically significant replications of most of the relationships that we observed in Study 1a. However, we note that we have significantly less power to detect these relationships than in Study 1a and thus we should expect statistically weaker results. Interestingly, we did find some differences by gender; men overestimated more on both the weight-guessing task, r = .30, and the GOT, r = .28, ps < .001. They also overplaced more on the same two tasks, rWGT = .32, p < .001, rGOT =.22, p = .011. This is driven by men estimating that they would score more highly on these two tasks, rWGT = .19, p = .025, rGOT = .21, p = .015, but in reality scoring worse, rWGT = −.24, p = .005, rGOT = −.21, p = .015. As in Study 1a, men placed themselves relatively higher than women did on the MLB task, r = .22, the RPM task, r = .24, and the weight-guessing task, r = .24, however, this only manifested into greater overplacement on the weight-guessing task.
3.3. Discussion
Study 1b seems to provide evidence for the reliability of the measures across time on accuracy, confidence, and overconfidence. As expected, we observe stronger inter-task consistency for overprecision than for overestimation and overplacement. All nine overconfidence measures in Studies 1a and 1b were positively correlated with themselves after 10 months (rs 0.17–0.46), though their inter-time correlations were weaker than other measures (e.g., the inter-time correlation for AOT was r = 0.71). When examining inter-task correlations using only data from Study 1a, we replicate the patterns of results from Study 1a demonstrating positive but weak correlations between task domains for overestimation and overplacement, and stronger positive correlations between overprecision on different task domains as measured by subjective probability distribution spread. Interestingly, we did replicate results from Study 1a suggesting that men place (and perhaps) overplace themselves higher than women.
4. Study 2: Overconfidence across time
Study 2 examines whether overconfidence measures are consistent across time on a smaller scale than Study 1a; we use a single task (professional football forecasting) over the course of 1 week. However, we told participants that there would be a second part of the study so there would be significantly less attrition than in Study 1b. We also derived an exploratory measure of overestimation specific to the context (sports fans making predictions about their teams).
4.1. Method
We preregistered this study at https://aspredicted.org/HLV_TB8 on November 1, 2023 before data collection started on November 2, 2023.
4.1.1. Participants
We initially distributed the survey to 257 English-speaking CloudResearch participants located in the US, with an approval rating >95% and <1000 HITs. Participants then answered three screening questions; the first question asked whether they followed the National Football League (NFL), and the next two questions asked about the results of the most recent NFL Championship. Participants who answered ‘No’ to the first question or answered any of the other two questions incorrectly could not proceed with the survey. 73 participants failed these screening criteria, an additional 12 began the survey after some of the forecasted games had started, and we excluded one participant who straightlined the 16-item narcissism scale, leaving us with 171 participants at Time 1. 36 of these participants did not complete the follow-up survey, leaving us with a final sample of 135. Our participants were 42.69% male, 69.01% White / 4.09% Asian / 11.7% Black / 5.85% Hispanic / 9.36% other race; ${M}_{age}$
= 35.93,
${M}_{age}$
= 35.93, $S{D}_{age}$
= 9.77; with a median education level of an Associate’s degree in college. Participants earned $1.20 for participating in the first study, which on average took 10.69 min, and $1.50 for participating in the second part of the study, which on average took 6.05 min.
$S{D}_{age}$
= 9.77; with a median education level of an Associate’s degree in college. Participants earned $1.20 for participating in the first study, which on average took 10.69 min, and $1.50 for participating in the second part of the study, which on average took 6.05 min.
While participants who did and did not return did not significantly differ on gender, age, narcissism, accuracy, or any of our primary confidence and overconfidence measures (see the Supplementary Material for details), the 36 participants who did not return for the follow-up survey picked their favorite teams as winners marginally more often (M = 1.61, SD = 2.05) than those who did return (M = 0.98, SD = 1.00), t(39.52) = 1.80, p = .079, d = .49, and overestimated the game wins of their favorite teams (M = 0.5, SD = 0.81) more than those who did return (M = 0.2, SD = 0.73), t(51.19) = 2.01, p = .049, d = 0.40. In addition, the participants who returned were marginally more precise—that is, had less variance—in their subjective probability distributions of the overall score distribution (M = 5.22, SD = 2.15) than those who did return (M = 5.91, SD = 2.16), t(54.86) = 1.70, p = .096, d = 0.32.
4.1.2. Procedure
We distributed the two surveys 1 week apart. For each survey, participants guessed the winners of 10 NFL games that would take place the following Sunday. They then provided the following confidence measures (analogous to those in Studies 1a and 1b): an estimate of how many game winners they predicted correctly, an estimate of the average number of game winners other participants predicted correctly, an estimate of their own score’s percentile, and a subjective probability distribution for the distribution of all participants in the study.
In the first survey, participants then indicated their favorite NFL teams (‘Which of the following NFL Teams do you consider yourself a fan of? (Mark all that apply)’) and completed the following trait measures: narcissism (same scale as Studies 1a and 1b), four items from the actively open-minded thinking (AOT) scale, and Overconfidence Test (Lawson et al., Reference Lawson, Larrick and Soll2023). Lastly, they reported their demographics.
In the second survey, participants then completed the remaining three items of the actively open-minded thinking (AOT) scale that they did not complete in the first survey.
4.1.3. Measures
Actual Score (Accuracy). As in previous studies, we calculated participants’ scores (out of 10) as the number of game winners forecasted correctly. Performance was significantly above chance at Time 1 (M T1 = 5.67, SD T1 = 1.57), t(134) = 4.98, p <0.001, d = 0.43, but not at Time 2 (M T2 = 4.96, SD T2 = 1.47).
Confidence (Estimation). As in previous studies, participants estimated their scores out of 10 (M T1 = 6.54, SD = 1.49; M T2 = 5.79, SD = 1.69). We also constructed an exploratory measure of estimation by counting the number of times participants predicted that one of their favorite teams would win (MT1 = 0.98, SD = 1.00; MT2 = 0.86, SD = 0.84).
Confidence (Placement). As in previous studies, participants estimated the average score of all participants in the study (MT1 = 6.02, SD = 1.31; MT2 = 5.54, SD = 1.33), which we subtracted from their estimates of their own scores for a measure of placement (MT1 = 0.52, SD = 1.97; MT2 = 0.25, SD = 1.82). Our secondary measure of placement asked participants to estimate their percentile rank among participants in the study (M T1 = 49.79, SD = 20.11; M T2 = 43.40, SD = 19.30). These two measures of placement correlated with each other, rT1 = .35, r T2 = .33, ps < .001.
Confidence (Precision). As in previous studies, we calculated the variance of participants’ subjective probability distributions of the scores of all participants in the study (MT1 = 5.22, SD = 2.15; MT2 = 4.91, SD = 1.99).
Overestimation. As in previous studies, we calculated overestimation by subtracting participants’ actual scores from their estimated scores (MT1 = 0.87, SD = 2.00; MT2 = 0.83, SD = 2.22). We also constructed an exploratory measure of overestimation only using predictions about games where participants indicated they were a fan of one of the teams playing; we counted the number of times participants predicted that one of their favorite teams would win and subtracted the number of times one of their favorite teams actually won.
Overplacement. As in previous studies, we calculated overplacement as (estimated own score − estimate of mean score of all participants) − (actual own score − actual mean score of all participants) (MT1 = 0.52, SD = 2.30, MT2 = 0.25, SD = 2.30). Our secondary measure of overplacement subtracted participants’ actual percentile rank from their estimated percentile rank (MT1 = 8.49, SD = 33.14; MT2 = 3.19, SD = 33.30). These two measures of overplacement correlated with each other, rT1 = .60, rT2 = .62, ps < .001.
Overprecision. As in previous studies, we calculated overprecision by subtracting the variance of participants’ subjective probability distributions of all participants’ scores from the true variance of all participants’ scores (MT1 = −2.74, SD = 2.15; MT2 = −2.75, SD = 1.99).
Actively Open-Minded Thinking (AOT): We used the same scale as in prior studies ( $\alpha$
= 0.75, M = 3.29, SD = 0.43). However, we split this scale into two parts with four items being answered at Time 1 and the remaining three at Time 2.
$\alpha$
= 0.75, M = 3.29, SD = 0.43). However, we split this scale into two parts with four items being answered at Time 1 and the remaining three at Time 2.
Narcissism (NPI): We used the same scale as in prior studies ( $\alpha$
= 0.65, M = 12.99, SD = 2.44).
$\alpha$
= 0.65, M = 12.99, SD = 2.44).
Overconfidence Test (OCT): We used the 3-item Overconfidence Test (OCT) (Lawson et al., Reference Lawson, Larrick and Soll2023). Each item ranges from 0 to 100%, e.g., ‘One hundred people are guessing the number of jellybeans in a jar. The closest 10 guesses win $100. How likely are you to be one of the winners?’, $\alpha$
= 0.45, M = 33.81, SD = 13.42).
$\alpha$
= 0.45, M = 33.81, SD = 13.42).
4.2. Results
4.2.1. Correlations between time points
All three inter-time correlations between the primary overconfidence measures were positive and significant: r overestimation = 0.29, p < .001; r overplacement = .21, p = .015; r overprecision = .49, p < .001. The inter-time correlation for the exploratory measure of overconfidence based on whether participants thought their favorite teams would win was also positive, r = .22, p = .010. The secondary percentile-based measure of overplacement was not significantly correlated between time points, r = 10, p = .227.
These positive correlations were driven more by inter-time correlations in confidence than accuracy. Participants’ scores at time 1 were not significantly correlated with their scores at Time 2, r = .14, p = .117. However, their confidence was correlated on all three primary and both secondary measures of confidence: self-score estimations, r = .46, the number of favorite teams they predicted winning, r = .39, the difference between self-score estimates and all-participant-average estimates, r = .39, estimates of own score percentiles, r = .35, and subjective probability distribution of all participants’ scores, r = .49, ps < .001.
4.2.2. Correlations between overconfidence measures and trait measures
Table 3 shows correlations between the three primary overconfidence measures at both time points and the stable trait measures (actively open-minded thinking, narcissism, Overconfidence Test, gender, and age). Participants who scored higher on the overconfidence test were also more likely to overestimate their scores at Time 1, r = .21, p = .016, though not at Time 2, r = .03, p = .705. Participants who scored higher on actively open-minded thinking seemed to again have narrower confidence intervals at Time 1, r = .18, p = .032, and directionally at Time 2, r = .16, p = .061.
We also found that males were more likely to overplace at Time 2, r = .23, p = .009, but not at Time 1, r = .03, p = .69. Digging into the precise components of overplacement, we find that males estimated that they would score higher than non-males at both Time 1, r = .20, and Time 2, r = .31, and that they would score higher relative to other participants in the study (estimated self-score minus estimated all-participant-score) at Time 1, r = .22, and even more so at Time 2, r = .42. They did in fact score higher than non-males at both Time 1, r = .22, and Time 2, r = .17.
Interestingly, we observed multiple statistically significant correlations between the exploratory measure of overestimation based on participants’ favorite teams at Time 1. Participants who overestimated the performance of their favorite teams scored lower on actively open-minded thinking, r = −.20, p = .07, higher on the Overconfidence Test, r = .23, p = .008 and were younger, r = −.22, p = .011. None of these correlations showed up at Time 2, but we then observed that men overestimated their favorite teams less, r = −.24, p = .006. We find these results interesting but note that because the participants who most overestimated their favorite teams were also more likely to attrit, we interpret these results with caution.
4.3. Discussion
Overconfidence measures seemed durable across time within individuals. As one might expect given the shorter timespan (1 week vs. 10 months), these correlations were stronger than those in Studies 1a and 1b on the most analogous task, the baseball forecasting task. The positive correlations seemed to be driven by consistency in confidence rather than accuracy. Still, the strength of correlations we observed between time points for overestimation (r = .29) and measures of overplacement (r = .22) differ dramatically from other personality measures taken a week apart, such as the Big-Five: extraversion (r = .92), agreeableness (r = .92), conscientiousness (r = .92), openness (r = .93), and emotional stability (r = .91) (Kurtz and Parrish, Reference Kurtz and Parrish2001), or from our measures of AOT (r = .71) or narcissism (r = .73) 10 months apart in Studies 1a and 1b. Although overestimation and overplacement demonstrated some consistency across time, we interpret the strengths of these correlations as too low to qualify as stable traits. By contrast, overprecision correlated across time points at r = .49, again demonstrating that the most stable form of overconfidence of our current measures is overprecision.
Interestingly, we did observe positive correlations between overprecision and actively open-minded thinking, which is directionally consistent with Study 1a. As in Study 1a’s sports forecasting task, we found that males were both more confident and more accurate in their forecasts. Although we did observe some statistically significant correlations between the overconfidence measures and trait measures, we note that they were inconsistent between the two-time points in our data and that some could be spurious given a large number of correlation tests.
5. Study 3a: Multiple measures of precision
Study 3a examines the relationship between different measures of confidence—specifically precision, or certainty that a belief is correct—on the same Generalized Overconfidence Task (Binnendyk and Pennycook, Reference Binnendyk and Pennycook2024) from Study 1b. Given that our prior studies point towards overprecision potentially being the most reliable form of overconfidence, we wanted to test how reliably different measures of precision—and presumably overprecision—correlated with each other. We selected a wide range of precision measures, with the intent of testing the degree to which different elicitations of ‘How certain are you?’ correlate with each other; we selected classic measures of Likert scales and confidence interval widths, coupled with the more modern subjective probability distribution and an incentive-compatible bet. In addition, this study employs a measure of precision that is directly related to participants’ predictions (estimates of their own scores), rather than a second-order belief about other participants’ scores.
The studies we have reported thus far found some mixed and ambiguous evidence for trait-like consistency. Study 3a sought to establish clearer benchmarks by which we can assess the consistency of these precision measures; we attempt to ask not only the degree to which different measures of precision correlate with each other, but also whether these correlations are lower than one might expect or lower than they should be if they were tapping the same underlying trait, even accounting for noisiness in the data. In other words, we ask whether participants’ reports of precision seem to vary more as a function of the elicitation method or situation than as a function of some consistent internal trait. With this goal in mind, we collected two benchmarks: expert predictions and simulated data. We provide more detail on both of these below.
Finally, Studies 3a and 3b employ a wider range of additional trait measures than Studies 1a–2; in addition to actively open-minded thinking and the overconfidence test from Study 2, we also test whether certainty measures correlate with factors of intellectual humility.
5.1. Method
We preregistered this study at https://aspredicted.org/blind.php?x=Z29_FCB on October 3, 2023 before data collection started on October 4, 2023.
5.1.1. Participants
We recruited 326 participants from Cloud Research. We excluded 66 participants who answered fewer than three out of five comprehension questions about subjective probability distributions correctly (see below), 13 additional participants whose 90% confidence interval endpoints were out of order (i.e., lower bound higher than upper bound), two participants who straightlined the actively open-minded thinking scale, and three participants for whom both of their reported score estimates (for self and average of all participants) was more than two away from the mean of the corresponding subjective probability distribution. This left us with a final sample of 242. Our participants were 32.92% male, 67.9% White / 2.88% Asian / 11.11% Black / 3.7% Hispanic / 14.4% Other, M age = 35.84, SD age = 9.78, with median education level a Bachelor’s degree in college. Participants earned $1.45 in addition to a $1.00 bonus that they could choose to bet. The median completion time was 14.22 min.
5.1.2. Procedure
Participants learned that they were going to ‘play a game where they identify the objects in a scrambled image (10 images total),’ and then completed the Generalized Overconfidence Task. On average, participants identified 6.53 (SD = 1.50) out of 10 images correctly.
Afterward, participants answered a five-question comprehension check (M = 3.82 among participants we included, with 41 participants answering all five correctly), assessing their understanding of subjective probability distributions. They were asked what the most likely score would be if someone guessed for all 10 questions in the image task (answer: 5/10), what the summed probability across bins in the subjective probability distribution should equal (answer: 100%), and three multiple-choice questions where they identified the pictured subjective probability distribution that best fit a belief written in words (e.g., ‘I think that I correctly guessed the objects in eight out of the 10 images. Which of the tables below best captures my beliefs?’). After each of the five questions, participants learned which answer was correct along with an explanation.
Participants then estimated their own score out of 10 on the task (M = 4.39, SD = 1.29), and reported their confidence in that prediction with each of the following elicitation methods in a randomized order: a Likert scale, an incentivized bet, a 90% Confidence Interval, and a Subjective Probability Distribution. See ‘Certainty Measures’ below for more details. Participants also reported their predictions about the performance of other participants in the study as a point estimate (M = 4.53, SD = 1.08) and in a Subjective Probability Distribution. See ‘Other Overconfidence Measures’ below.
Finally, participants completed the following trait measures: actively open-minded thinking (Haran et al., Reference Haran, Ritov and Mellers2013), intellectual humility—Factor 1, independence of ego and intellect, intellectual humility—Factor 4, lack of intellectual overconfidence (Krumrei-Mancuso and Rouse, Reference Krumrei-Mancuso and Rouse2016), the Overconfidence Test (Lawson et al., Reference Lawson, Larrick and Soll2023), and demographic measures (gender, age, and race).
5.1.3. Measures
Likert. Participants indicated their certainty that their actual score was within one point of their estimate (above or below) with a 7-point scale, from 1 = ‘Not confident at all’ to 7 = ‘Certain’ (M = 3.59, SD = 1.50). Greater confidence scores correspond to higher precision.
Bet. Participants learned that they would receive a $1.00 bonus, which they could choose to keep or bet any amount up to the full $1 on the accuracy of their estimate (M = $0.39, SD = $0.35). If their estimate was within 1 point of their actual score, the money they bet was doubled, otherwise it was lost. The more money a participant bet on the accuracy of their estimate, the higher their implicit certainty. About 56 participants chose to bet nothing, 40 chose to bet the full $1.00, 47 chose to bet $0.50, and the others bet something else.
90% Confidence Interval. Participants indicated endpoints of a 90% confidence interval; they were instructed to ‘identify two numbers: one BELOW your estimate and another ABOVE your estimate. These numbers should be far enough apart that you are 90% sure your true score is between them’. We reverse-scored interval widths (M = −5.01, SD = 2.30) so that higher numbers, that is, narrower intervals, would correspond to higher certainty.
Subjective Probability Distribution (own scores). Participants reported a probability, from 0 to 100, for each of 11 mutually exclusive and exhaustive bins (e.g., 0/10, 1/10,… 10/10). For analysis, we calculated two measures of precision from these subjective probability distributions. First, we calculated peak probability (M = 0.54, SD = 0.18) by normalizing the probability distribution, finding the leftmost bin with the highest probability assigned, and summing the probability of that bin, the bin immediately below, and the bin immediately above. Second, we calculated variance (M = 4.86, SD = 2.49) as in prior studies.
We also calculated the same measures of overestimation (M = −2.14, SD = 1.89), indirect overplacement based on estimating the average of all participants’ scores (M = −0.15, SD = 2.02), and overprecision (M = −3.32, SD = 2.98) as in prior studies.
Trait Measures. We collected the following trait measures.
Actively open-minded thinking. We used the same scale as in prior studies, $\alpha$
= 0.76, M = 4.15, SD = 0.47.
$\alpha$
= 0.76, M = 4.15, SD = 0.47.
Intellectual humility, independence of intellect, and ego factor. We used the first factor of the Comprehensive Intellectual Humility Scale: independence of intellect and ego (Krumrei-Mancuso and Rouse, Reference Krumrei-Mancuso and Rouse2016), five items, for example, ‘When someone disagrees with ideas that important to me, it feels as though I’m being attacked’ (reverse-scored) from 1 = ‘strongly disagree’ to 5 = ‘strongly agree’, $\alpha$
= 0.91, M = 3.45, SD = 0.94.
$\alpha$
= 0.91, M = 3.45, SD = 0.94.
Intellectual humility, lack of intellectual overconfidence. We used the fourth factor of the Comprehensive Intellectual Humility Scale: lack of intellectual overconfidence (Krumrei-Mancuso and Rouse, Reference Krumrei-Mancuso and Rouse2016), five items, for example, ‘I feel small when others disagree with me on topics that are close to my heart’ (reverse-scored) from 1 = ‘strongly disagree’ to 5 = ‘strongly agree’, $\alpha$
= 0.75, M = 3.40, SD = 0.61. We note that the items for intellectual humility on both factors most often refer to reactions or comparisons to other people, and would thus likely be most related to overplacement if it were related to any of the three forms.
$\alpha$
= 0.75, M = 3.40, SD = 0.61. We note that the items for intellectual humility on both factors most often refer to reactions or comparisons to other people, and would thus likely be most related to overplacement if it were related to any of the three forms.
Overconfidence Test (OCT): We used the same scale as in Study 2, $\alpha$
= 0.42, M = 31.43, SD = 13.38.
$\alpha$
= 0.42, M = 31.43, SD = 13.38.
5.1.4. Benchmarks
We compare each pairwise correlation between confidence measures to two preregistered benchmarks.
Expert Predictions. We asked 27 attendees at an October 13, 2023 conference on the Social Science Prediction Platform (SSPP) to make predictions for the strengths of our correlations between precision measures. The respondents mainly consisted of academics, ranging from pre-doctoral research associates to tenured professors, in fields including economics, information science, and psychology. The 27 attendees learned the definition of overprecision, and saw an example of one of the 10 questions from the image-guessing task in Study 3a. Then they learned about four key precision measures—Subjective Probability Distribution Peak, Likert, Bet, and Confidence Interval Width—including the exact wording of how each one would be elicited and coded for analysis. Then, respondents predicted the correlation between Bet confidence and Subjective Probability Distribution Peak confidence. Finally, they were invited (but not required) to make predictions about the other five pairwise correlations. Table 5 shows the averaged predictions, along with the number of people who made each prediction; most of them made all six predictions.
Table 5 Study 3a: Correlation tests comparing observed correlations to rational simulated benchmarks and expert-predicted benchmarks

Note: Correlations between pairs of confidence measures, compared to benchmarks via a Fisher’s z-transformation. Expert predictors from SSPP were only required to predict the correlation between Bet and Subjective Probability Distribution Peak (SPD Peak), and were not required to predict the other five pairwise correlations. Confidence Interval Width is reverse-scored.
Simulated Benchmarks. We also simulated data to compute benchmarks for what each of the six correlations between the four confidence measures should be for a rational agent. We represented each agent i as follows. An agent’s belief A about their performance was modeled as a truncated normal distribution with mean M—a random variable drawn uniformly from the interval [0, 10]—and standard deviation S—a random variable drawn uniformly from the interval [0, 10]. The resulting distribution was truncated within the interval [0, 10]. We represented the means and standard deviations of agent’s beliefs as random variables to represent participants with many different beliefs—those who believed they did better or worse, and those who were more or less confident in their predictions. A normal distribution reasonably captures the general shape of a belief distribution that is centered at some value and monotonically decreasing on either side; in a truncated normal distribution, the probability mass between the interval (in this case, 0–10) is scaled up to take into account probability mass that would fall outside the bounds of the interval in a normal distribution (Johnson et al., Reference Johnson, Kotz and Balakrishnan1995).
 $$\begin{align*}\mathrm{Ai}\sim \mathrm{TN}\left(\mathrm{M},\mathrm{S}2,0,10\right),\mathrm{where}\;\mathrm{M}\sim \mathrm{Unif}\left(0,10\right)\;\mathrm{and}\;\mathrm{S}\sim \mathrm{Unif}\left(0,5\right)\end{align*}$$
We calculate each precision measure as follows. We abbreviate the cumulative distribution function of this normal distribution as CDF. Let p i be an agent’s subjective belief that they are correct (within 1 point of their estimated score).
pi = CDF(M + 1) − CDF(M − 1)
Likert = 1 + pi * (7 − 1)
Bet = 1 if pi > .5, 0 if pi < .5
Peak Bini = CDF(ceiling(M) + 1) − CDF(floor(M) − 1)
CI Width = CDF−1(95) − CDF−1(5)
We calculate pi by finding the probability mass within the mean +1 and the mean −1. Likert confidence is a simple rescaling of probabilistic confidence, where 1 on the Likert scale corresponds to 0% probability and 7 on the Likert scale corresponds to 100%. For Bet, we assume that a rational agent bets to maximize their expected value; this is 1 if pi > .5 and 0 if pi < .5Footnote 3. Peak Bin corresponds to the probability assigned to the mean’s bin (where each bin represents a possible score between 0 and 10) and the two neighboring bins; we can calculate this by finding the probability mass between the score below the integer floor of the mean and the score above the integer ceiling of the mean. For a 90% confidence interval, we calculated the distance between the 95th percentile and the 5th percentile of the distribution. We then injected noise into these measures by adding a normally distributed random variable centered at 0 with standard deviation equal to the standard deviation in the data for that measure of precisionFootnote 4. Readers may find the code for this simulation in our online repository: https://osf.io/tb2me/files/osfstorage?view_only=77b881f0b92647689270ed3b485366f9.
5.2. Results
5.2.1. Correlations between confidence measures
Table 5 shows the results of each test comparing our observed correlations to each of the two preregistered benchmarks using correlation significance testing and Fisher’s z-transformation. Our observed correlations between precision measures are significantly lower than both the rational simulated benchmarks and the expert-predicted benchmarks for all these correlations. The fact that the average correlation between items in Study 3a’s empirical data (average r = .11) remains so much lower than in the (similarly noisy) simulated data (average r = .46) strongly suggests that the difference is not solely attributable to noise.
5.2.2. Correlations between certainty measures and trait measures
Finally, we report correlations between our certainty measures and trait measures in Table 6. We do not find significant correlations between the majority of pairs of certainty measures and trait measures, with the following exceptions: people who scored higher on the Overconfidence Test were more confident on the Likert scale, r = .24, p < .001 and bet more of their bonus, r = .15, p = .024. People who scored higher on actively open-minded thinking had wider confidence interval widths, r = −.18, p = .004, and older people were slightly less confident on the Likert scale, r = −.14, p = .017, dfs = 240.
Table 6 Study 3a: Correlations between certainty measures and trait measures
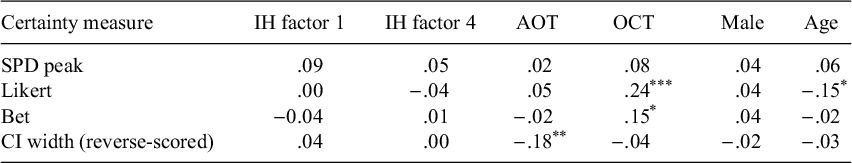
Note: Pearson correlations. IH F1, independence of intellect; IH F4, lack of intellectual overconfidence; AOT, Actively Open-minded Thinking; OCT, Overconfidence Test. Asterisks denote results of two-tailed tests comparing the correlations to 0, *p<.05, **p<.01, ***p<.001.
5.3. Discussion
Correlations between different measures of certainty (average r = .11) are lower than both experts and simulations suggest they should be if they were all tapping the same underlying trait. Instead, we contend that the low correlations between different measures of certainty highlight a fundamental difference between the simulated and empirical data: the simulated data derive from a coherent underlying understanding of uncertainty. That is, the simulated rational agent holds a subjective probability distribution. Our results suggest that few of our participants build their certainty judgments on such a solid foundation. Instead, people cobble together rough and ready responses to individual responses based on a vague subjective sense of certainty that is not nearly as clear or coherent as a subjective probability distribution. Consequently, small differences in question wording or context can affect responses, making them appear inconsistent. Further, none of the trait measures (actively open-minded thinking, intellectual humility, overconfidence test, demographics) correlate consistently with multiple measures of certainty.
6. Study 3b: Multiple measures of precision
One potential concern about Study 3a is that participants were indifferent about guessing fuzzy images and how many they guessed correctly. If motivation or emotion contributes to confidence and overconfidence, then a trivial task might not be sufficiently ego-involving. Study 3b seeks to address this potential concern. We selected this domain based on the results from the pretest, which identified lay theories that confidence in sports predictions may improve our chances of detecting individual differences in overconfidence; professional sports predictions have also been used in research on related subjects, such as optimism (Simmons and Massey, Reference Simmons and Massey2012). In addition, Study 3b uses a more comprehensive suite of trait measures than in Studies 1a–3a, including the Big Five, the need for cognitive closure, and the need for cognition along with measures from previous studies.
6.1. Method
We preregistered this study at https://aspredicted.org/blind.php?x=3DY_792 on May 31, 2023 before data collection started on June 1, 2023.
6.1.1. Participants
We recruited 353 participants from Prolific, using the following filters: participants were located in the US, had an approval rate above 95%, were fluent in English, and had at least 500 previous submissions. 182 participants failed the screening criteria and could not proceed with the survey: participants who answered ‘No’ to ‘Do you identify as an NBA fan?’, or who answered any of four multiple-choice questions about the current NBA postseason incorrectly. We excluded two participants who straightlined the actively open-minded thinking scale and six participants whose reported score prediction estimate was more than 20 away from the center of their subjective probability distribution. Our final sample consisted of 163 participants. Our participants were 67.48% male, 68.1% White / 4.29% Asian / 19.02% Black / 1.84% Hispanic / 6.75% Other, ${M}_{age}$
= 36.53,
${M}_{age}$
= 36.53, $S{D}_{age}$
= 12.28, with amedian education level of a Bachelor’s degree in college. Participants earned $2.40 for participating in the study, for which the median completion time was 9.94 min.
$S{D}_{age}$
= 12.28, with amedian education level of a Bachelor’s degree in college. Participants earned $2.40 for participating in the study, for which the median completion time was 9.94 min.
6.1.2. Procedure
On June 1, 2023, participants predicted the winner of the first game of the 2023 NBA Finals (Denver Nuggets or Miami Heat), and by how many points that team would win. All participants completed the survey by 4:30 pm Eastern time, before the game started at 8:30 pm. Participants reported confidence in whether their point prediction was within five points of the true point difference in the same four ways as in Study 3a: a 7-point Likert scale (M = 4.81, SD = 1.28), an real $1.00 bet (M = $0.53, SD = $0.43), a 90% confidence interval (Mwidth = −18.79, SD = 20.22), and a subjective probability distribution (Mpeak = 0.55, SDpeak = 0.19; Mvariance = 347.36, SDvariance = 354.61). We also added an additional fifth measure of confidence, a numeric probability between 0 and 100 (M = 69.56, SD = 21.56) that their prediction was within five points of the true point difference. Participants then reported the following trait measures in a randomized order: actively open-minded thinking, intellectual humility, narcissism, Big Five personality dimensions, need for cognition, and need for cognitive closure. Finally, participants reported their demographics.
6.1.3. Trait measures
Actively open-minded thinking. We used the same scale as in prior studies, $\alpha$
= 0.79, M = 3.84, SD = 0.59.
$\alpha$
= 0.79, M = 3.84, SD = 0.59.
Intellectual humility, independence of intellect, and ego factor. We used the same scale as in Study 3a, $\alpha$
= 0.90, M = 2.53, SD = 0.89.
$\alpha$
= 0.90, M = 2.53, SD = 0.89.
Intellectual humility, lack of intellectual overconfidence. We used the same scale as in Study 3a, $\alpha$
= 0.77, M = 2.80, SD = 0.65.
$\alpha$
= 0.77, M = 2.80, SD = 0.65.
Narcissism. We used the same scale as in prior studies, $\alpha$
= 0.77, M = 12.36, SD = 3.14.
$\alpha$
= 0.77, M = 12.36, SD = 3.14.
Big Five. The BFI-XS measures the Big Five dimensions of personality (Soto and John, Reference Soto and John2017). Participants rated the extent to which they agreed with three statements per trait that completed ‘I am someone who…’, 1 = ‘disagree strongly’ to 5 = ‘strongly agree’, for extraversion ( $\alpha$
= 0.67, M = 2.95, SD = 0.93), openness (
$\alpha$
= 0.67, M = 2.95, SD = 0.93), openness ( $\alpha$
= 0.66, M = 3.91, SD = 0.81), conscientiousness (
$\alpha$
= 0.66, M = 3.91, SD = 0.81), conscientiousness ( $\alpha$
= 0.68, M = 3.63, SD = 0.93), agreeableness (
$\alpha$
= 0.68, M = 3.63, SD = 0.93), agreeableness ( $\alpha$
= 0.59, M = 3.89, SD = 0.78), neuroticism (
$\alpha$
= 0.59, M = 3.89, SD = 0.78), neuroticism ( $\alpha$
= 0.82, M = 2.62, SD = 1.11).
$\alpha$
= 0.82, M = 2.62, SD = 1.11).
Need for Cognition. We used the 6-item Need for Cognition Scale (Lins de Holanda Coelho et al., Reference Lins de Holanda Coelho, HP Hanel and J Wolf2020), for example, ‘I would prefer complex to simple problems,’ $\alpha$
= 0.88, M = 3.62, SD = 0.77.
$\alpha$
= 0.88, M = 3.62, SD = 0.77.
Need for Cognitive Closure. We used the 15-item Need for Cognitive Closure scale (Roets and Van Hiel, Reference Roets and Van Hiel2011; Webster and Kruglanski, Reference Webster and Kruglanski1994), for example, ‘I would prefer complex to simple problems,’ $\alpha$
= 0.80, M = 3.29, SD = 0.50.
$\alpha$
= 0.80, M = 3.29, SD = 0.50.
6.2. Results
6.2.1. Accuracy
Participants were the most accurate on this task compared to those in previous studies; the majority (123/163, or 75.46%) picked the winning team correctly (the Denver Nuggets). Of those who picked the winning team correctly, the mean prediction for the point difference was 9.68 (SD = 3.78), close to the true point difference of 11.
6.2.2. Correlations between certainty measures
Our certainty measures were mostly significantly correlated with each other (see Table 7), with a few exceptions. 90% confidence interval width did not significantly correlate with subjective probability distribution peak, r = .14, p = .073, or subjective probability distribution variance, r = −.06, p = .458, nor with bet confidence, r = −.03, p = .729. In addition, Likert confidence did not correlate with subjective probability distribution variance, r = −.07, p = .367, though it did correlate with subjective probability distribution peak.
Table 7 Study 3b: Correlations between certainty measures

Note: Asterisks denote results of two-tailed tests comparing the correlations to 0, *p<.05, **p<.01, ***p<.001. Confidence interval width is reverse-scored.
6.2.3. Correlations between precision measures and trait measures
All correlations between our precision measures and 13 trait measures appear in Table 8. Most correlations between traits and precision measures do not extend to multiple precision measures, with a few exceptions. Actively open-minded thinking negatively correlated with multiple precision measures such that actively open-minded thinkers were generally less confident: with Likert confidence, r = −.20, p = .012, and confidence interval width (reverse-scored), r = −.23, p = .004, and directionally negatively correlated with the other precision measures. Interestingly, conscientiousness was positively correlated with multiple precision measures: Likert confidence, r = .23, p = .003; confidence interval width, r = .24, p = .002, and numeric probability confidence, r = .20, p = .012, dfs = 169. We do not see an obvious explanation for why more conscientious people might be more confident, unless they are aware of their own general tendency to be conscientious and successful.
Table 8 Study 3b: Pearson correlations between certainty measures and trait measures
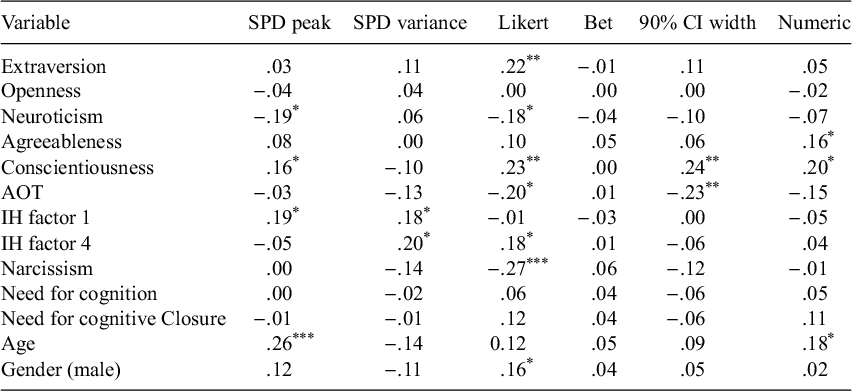
Note: Asterisks denote results of two-tailed tests comparing the correlations to 0, *p<.05, **p<.01, ***p<.001. Confidence interval width is reverse-scored so that higher numbers are narrower intervals.
6.3. Discussion
We note that the correlations between certainty measures are generally stronger compared to those in Study 3a; the average of the six correlations between the four precision measures that we also measured in Study 3a (Bet, CI Width, SPD Peak, and Likert) is .20, compared to .13 in Study 3a. This could be due to the nature of the task; participants potentially cared more and were more familiar with sports forecasting than guessing fuzzy images. We find mixed evidence that different measures of overprecision correlate with each other; while single-item continuous scale measures correlated consistently (Likert scale, numeric probability, or a bet), they were less related to the other two elicitation methods that attempt to measure the width or narrowness of one’s subjective probability distribution—confidence interval width and probability distribution peak and variance. Study 3b also extends 3a’s findings on relationships between certainty measures and trait measures. As in Study 3a, none of the traits we measured correlated consistently with our different measures of precision. However, the one that perhaps seemed most consistent was actively open-minded thinking, which correlated significantly negatively with two precision measures and directionally negatively with all of them. Conscientiousness was positively correlated with four of our six certainty measures; it could be that participants who are willing to answer favorably about their own competence on the conscientiousness measures (e.g., ‘I am someone who is reliable, can always be counted on’) is also more certain about their competence on this task.
7. General discussion
Overconfidence does not quite exhibit the consistency of a personality trait. In Studies 1a and 1b, we find low within-individual stability for overestimation and overplacement across three domains. In Studies 1b and 2, we find low within-individual stability for overestimation and overplacement across time points on sports forecasting tasks. However, we observe relatively high within-individual stability for overprecision. In Studies 3a and 3b, we find that correlations between different measures of precision produce correlations that are lower than benchmarks predicted by experts and simulations. In sum, we find inconsistency between different forms of overconfidence, between different measures of the same form, between overconfidence in different task domains, and between different points in time. Further, we find weak and inconsistent evidence that trait measures, including both demographic and personality measures, are related to overestimation or overplacement. We cannot attribute these weak correlations solely to poor data quality. Validated scales such as narcissism, the Big Five, and actively open-minded thinking show high reliabilities as expected in our samples, both within and across studies.
Despite these results, we find some hints of consistencies in overprecision. In Study 1a, a single measure of overprecision was correlated (rs around 0.7) across multiple domains. In Studies 1b and 2, we find that the correlation between two-time points of overprecision on every task we tested is between 0.4 and 0.5. These results build on past data indicating that overprecision may be the most robust form of overconfidence (Moore, Reference Moore2023; Moore and Healy, Reference Moore and Healy2008). However, these relationships primarily rely on the measure of overprecision that elicits confidence using a subjective probability distribution; the low correlations between different measures of precision in Studies 3a and 3b raise questions about whether these different measures are actually tapping into the same construct.
We acknowledge that across our studies we do find various significant correlations between confidence, overconfidence, and trait measures. In particular, we find that actively open-minded thinkers seem to be less overconfident in Raven’s Progressive Matrices in multiple studies, and are less certain in Study 3b; if there is a trait that correlates with overconfidence or partially explains it, based on our evidence it is likely actively open-minded thinking. Further, we find some evidence that men tend to be more confident across our tasks (though we acknowledge that sports forecasting in particular may be a male-typed task), with less confidence in overconfidence. We find mixed results on other traits. However, we first note that given the sheer number of correlation tests in each study, some are bound to show up as significant. Second, our results are descriptive; while we argue that the magnitude of the relationships between overconfidence and certainty measures across contexts is too low to be considered a trait, readers may interpret these same numerical results differently.
Psychologists seeking to identify new traits must run them through a gauntlet of stringent tests. Their claims gain credibility as their measures demonstrate consistent correlations across diverse samples; over varying periods of time; and using different methods. A measure that withstands these tests earns its place in the pantheon of individual differences following tests of convergent, nomological, and discriminant validity. In our case, these tests are not worth performing. We do not claim that overconfidence deserves a place in that pantheon. Our results show that overconfidence fails the most basic tests of consistency. It makes no sense for us to attempt tests of discriminant validity with other constructs when different measures of overconfidence fail to correlate with one another.
How do we reconcile our results with published claims finding consistent individual differences in overconfidence? We see several possible explanations. First, mono-method bias may inflate the perceived consistency in prior studies; relying on the same single measure of overconfidence might inflate correlations by relying on a single measure, situation or task (Donaldson and Grant-Vallone, Reference Donaldson and Grant-Vallone2002). We see mono-method bias as a weakness of our adversarial collaboration on this topic (Binnendyk et al., Reference Binnendyk, Li, Costello, Hale, Moore and Pennycook2024), which found relatively high correlations between probabilistic item-confidence on various tasks. The present article, by contrast, seeks more stringent measures of generalizability by employing a diversity of methods, approaches, and domains. Second, although we tried to use the best measures of overconfidence that we knew of, the paradigms and measures that we used may be inherently different than those in previous studies. For example, field studies that rely on investment behavior (Bengtsson et al., Reference Bengtsson, Persson and Willenhag2005; Malmendier and Tate, Reference Malmendier and Tate2005) that lack direct measures of beliefs may tap different internal mechanisms than our measures of overconfidence. Third, we cannot know the extent to which published studies reflect the file-drawering of discrepant results or publication bias; we do know that we have sought to report all the studies that we conducted and err on the side of full disclosure, in this writeup, in our supplemental writeup, and in all our posted documents online.
However, we acknowledge a number of limitations in our data—primarily regarding imperfect measures in Studies 1a, 1b, and 2. Our measures of confidence and overconfidence are single-item measures, which are less reliable than multi-item personality measures; this could deflate correlations with other durable personality traits. In addition, our measures of overplacement and overprecision rely on judgments about other participants in the study, which our participants may have had limited information about. Although we specified in our recruitment materials and consent forms that we wanted MLB (Studies 1a and 1b) or NFL fans (Study 2), we did not explicitly tell participants that all of our participants would be screened and recruited the same way from the same platform. Judgments about other participants were necessary for overplacement, but our measure of overprecision (comparing the spread of participants’ estimates of the score distribution to the true spread) was unconventional in this regard. Further, our tasks were relatively difficult; even though we recruited sports ‘fans’, the participants in Studies 1a and 1b performed no better than chance on the sports forecasting tasks, making the measures of overconfidence more noisy relative to confidence.
Understanding the origins of overconfident judgments is consequential. Evidence suggests that managers who exhibit excessive self-assurance make bad investments (Odean, Reference Odean1998), issue too much debt (Hackbarth, Reference Hackbarth2008), and discount useful advice from others (Minson et al., Reference Minson, Liberman and Ross2011). Overly optimistic entrepreneurs take excessive risks (Hogarth and Karelaia, Reference Hogarth and Karelaia2012; Vörös, Reference Vörös2020). Overly optimistic policy makers fail to anticipate and prevent economic crises, like recessions or inflation (Bennani, Reference Bennani2023; Claussen et al., Reference Claussen, Matsen, Røisland and Torvik2012). Overprecision, the most pervasive of the three forms of overconfidence, is evident in nearly every study that compares people’s certainty in judgments with the accuracy of those judgments (Campbell and Moore, Reference Campbell and Moore2024; Moore, Tenney, et al., Reference Moore, Tenney, Haran, Wu and Keren2015). This excessive certainty can serve as the gateway bias, making it harder for people to appreciate the flaws in their judgment and their vulnerability to other biases (Bazerman and Moore, Reference Bazerman and Moore2012).
Laypeople share the common intuition that there are some people who are more overconfident than others. That assumption undergirds research programs that seek to identify which types of people are more overconfident. Our research tests that assumption and orients researchers to the circumstances in which that assumption does indeed hold. We identify overprecision as the form of overconfidence that is best considered an individual difference, as it is consistent across domains and correlates with other trait measures. This finding opens the way to research identifying how people form their confidence judgments, and therefore, how we can best understand their consistencies and inconsistencies.
8. Conclusion
This article evaluates the common belief that overconfidence is an individual difference. We find that overconfidence demonstrates inconsistency across different contexts and time within individuals; further, overestimation and overplacement do not seem to consistently correlate with trait measures. Overprecision, particularly when measured with a subjective probability distribution, shows more consistency across domains, as it correlates with itself across domains and time; however, low consistency between measures of certainty raises questions. We hope to shift the focus of future overconfidence research from identifying overconfident individuals to exploring situational moderators that influence confidence judgments.
Supplementary material
The supplementary material for this article can be found at http://doi.org/10.1017/jdm.2025.11.
Data availability statement
Raw and cleaned data for all studies are available at https://osf.io/tb2me/.
Acknowledgments
This article benefited from helpful comments by Rene Choudhari, Karin Garrett, Aryan Arora, and Angelica Wang.
Funding statement
This research received no specific grant funding from any funding agency, commercial or not-for-profit sectors. The authors gratefully acknowledge funding from the Dean’s Office at Berkeley-Haas and the Experimental Social Science Laboratory at UC Berkeley.
Competing interest
The authors declare no competing interests.


 Open access