


1. Introduction
The problem addressed by recommender systems is how to effectively suggest items to users in order to enhance their click-through rate (CTR) and overall satisfaction. CTR prediction plays a crucial role in both recommender and advertising systems, as its accuracy directly impacts the performance of recommendation algorithms. The development of collaborative filtering (CF) algorithms (Koren & Bell, Reference Koren and Bell2015) dates back to 1992, marking the foundation of modern recommendation models. However, CF algorithms struggle with handling sparse matrices and maintaining similarity matrices. To overcome these limitations, matrix factorization (MF) techniques (Koren et al., Reference Koren, Bell and Volinsky2009) were introduced. MF represents users and items through latent vectors, enabling the extraction of underlying patterns and effectively addressing the issue of data sparsity. Research into these recommendation models has significantly contributed to the advancement of CTR prediction methodologies.
Logistic regression (LR) (Richardson et al., Reference Richardson, Dominowska and Ragno2007) is one of the earliest and most widely used methods for CTR prediction in industry. The LR algorithm employs a shallow interaction model to integrate multiple features for recommendation, playing a key role in the early development of CTR prediction techniques. The interaction between features is critical for prediction accuracy. To address the limitation of linear models, which cannot effectively capture feature interactions, many researchers have proposed various enhanced CTR prediction models focusing on feature engineering and interaction. CTR prediction data typically involve multiple features, with categorical features becoming highly sparse after one-hot encoding. Generalized linear models such as LR and follow-the-regularized-leader (FTRL) (McMahan et al., Reference McMahan, Holt, Sculley, Young, Ebner, Grady, Nie, Phillips, Davydov and Golovin2013) struggle to model complex feature interactions (Chapelle et al., Reference Chapelle, Manavoglu and Rosales2014). To overcome this, factorization machines (FM) (Rendle, Reference Rendle2010; Rendle, Reference Rendle2012a) were introduced, utilizing the embedding of two features as an inner product to capture second-order feature interactions. FM became a mainstream recommendation model in industry between 2012 and 2014 for several reasons: (1) It significantly reduces training overhead, with complexity reduced from
 $O(n^{2})$
in POLY2 (Chang et al., Reference Chang, Hsieh, Chang, Ringgaard and Lin2010) to the linear complexity of O(kn), where k represents the length of the implicit vector. (2) FM has a relatively simple structure compared to the more complex deep learning models, making deployment and service more efficient. (3) By introducing implicit vectors, FM effectively addresses the issue of data sparsity. However, FM typically captures only pairwise feature interactions, and as the number of features increases, the model’s complexity grows significantly. To capture higher-order feature interactions, Blondel et al. (Reference Blondel, Fujino, Ueda and Ishihata2016) and He et al. (Reference He, Pan, Jin, Xu, Liu, Xu, Shi, Atallah, Herbrich and Bowers2014) have proposed various methods.
$O(n^{2})$
in POLY2 (Chang et al., Reference Chang, Hsieh, Chang, Ringgaard and Lin2010) to the linear complexity of O(kn), where k represents the length of the implicit vector. (2) FM has a relatively simple structure compared to the more complex deep learning models, making deployment and service more efficient. (3) By introducing implicit vectors, FM effectively addresses the issue of data sparsity. However, FM typically captures only pairwise feature interactions, and as the number of features increases, the model’s complexity grows significantly. To capture higher-order feature interactions, Blondel et al. (Reference Blondel, Fujino, Ueda and Ishihata2016) and He et al. (Reference He, Pan, Jin, Xu, Liu, Xu, Shi, Atallah, Herbrich and Bowers2014) have proposed various methods.
In recent years, various machine learning tasks, including object detection (Szegedy et al., Reference Szegedy, Toshev and Erhan2013; Zhao et al., Reference Zhao, Zheng and Xu2019), natural language understanding (Dahl et al., Reference Dahl, Yu, Deng and Acero2011), and speech recognition (Hinton et al., Reference Hinton, Deng, Yu, Dahl and Mohamed2012), have been revolutionized by end-to-end deep learning paradigms. Models such as deep neural networks (DNN), convolutional neural networks (CNN), recurrent neural networks (RNN), and graph neural networks (GNN) have been continuously proposed. The powerful learning capabilities of deep learning have also been applied to CTR prediction (Wang et al., Reference Wang, Xing, Zhao and Li2018). Zhang et al. (Reference Zhang, Qin, Guo, Tang and He2021b) explains that depth is a necessary development trend for such tasks. Given the large volumes of training data, highly sparse features, and high performance requirements often associated with CTR prediction, algorithm design is primarily focused on addressing these challenges. Shan et al. (Reference Shan, Hoens, Jiao, Wang, Yu and Mao2016) proposed the Deep Crossing model, based on the classic DNN architecture of ResNet, for CTR prediction. This model effectively addresses several issues in the application of deep learning to recommender systems, such as feature engineering, sparse vector densification, and optimization of multilayer neural networks for target fitting. It has laid a strong foundation for subsequent research. With the advent of Microsoft’s Deep Crossing model, Google’s Wide & Deep model (Cheng et al., Reference Cheng, Koc, Harmsen, Shaked, Chandra, Aradhye, Anderson, Corrado, Chai and Ispir2016), and other advanced models such as Factorization Machine-based Neural Networks (FNN) (Zhang et al., Reference Zhang, Du and Wang2016) and Product-based Neural Networks (PNN) (Qu et al., Reference Qu, Cai, Ren, Zhang, Yu, Wen and Wang2016), the field of recommender systems and computational advertising has entered the era of deep learning.
The core objective of the attention mechanism is to identify and prioritize information that is most relevant to the task at hand, allowing the model to focus on useful data while minimizing attention to noise. Given current computational resource constraints, the attention mechanism is a crucial tool for enhancing efficiency. In CTR prediction, different samples correspond to distinct scenarios, and the importance of specific features or feature combinations varies depending on the sample and application context. Vaswani et al. (Reference Vaswani, Shazeer, Parmar, Uszkoreit, Jones and Gomez2017) introduced the Multi-Head Attention mechanism, which has provided valuable insights into understanding user interests–specifically, what these interests are and how they evolve. Historically, many models overlooked the varying impact of different features on prediction outcomes, with fixed training weights across all features. The LS-PLM model (Gai et al., Reference Gai, Zhu, Li, Liu and Wang2017), a traditional recommendation model, addresses this by introducing an attention mechanism that classifies samples before calculating prediction scores within each category. Since 2017, a growing body of CTR prediction research has incorporated attention networks to better capture users’ latent interests. Notable models include the attentional factorization machine (AFM) (Xiao et al., Reference Xiao, Ye, He, Zhang, Wu and Chua2017), deep interest network (DIN) (Zhou et al., Reference Zhou, Zhu, Song, Fan, Zhu, Ma, Yan, Jin, Li and Gai2018), deepinterest evolution network (DIEN) (Zhou et al., Reference Zhou, Mou, Fan, Pi, Bian, Zhou, Zhu and Gai2019), behavior squence transformer (BST) (Chen et al., Reference Chen, Zhao, Li, Huang and Ou2019a), and the search-based interest model (SIM) (Pi et al., Reference Pi, Zhou, Zhang, Wang, Ren, Fan, Zhu and Gai2020), among others.
To summarize, this paper offers an overview for those seeking to understand the development and current state of CTR prediction research, as well as for those interested in comparing different CTR prediction models.
1.1 Our contributions
This paper makes several significant contributions, summarized as follows.
-
1. Taxonomy: We classify CTR prediction models into two categories: shallow interaction models and deep learning-based prediction models (including DNN, CNN, RNN, and GNN).
-
2. Comprehensive Review: We provide an in-depth overview of CTR prediction technologies, offering detailed descriptions of representative models for each category, making necessary comparisons, and summarizing the corresponding algorithms.
-
3. Resource Compilation: We have compiled a wealth of resources on CTR prediction models, including classic and state-of-the-art models, benchmark datasets, and evaluation metrics.
-
4. Future Directions: We analyze the limitations of existing CTR prediction methods and propose potential directions for future research.
1.2 Organization of this paper
The remainder of this paper is organized as follows: Section 2 provides a brief introduction to the CTR prediction problem, reviews related work, including fundamental concepts of CNN, RNN, Graph, and Graph Embedding, and presents symbolic definitions along with a list of commonly used notations. Sections 3 and 4 summarize CTR prediction models by category. Section 5 discusses the advantages and disadvantages of the aforementioned algorithms, as well as commonly used datasets and evaluation metrics for assessing CTR prediction performance. Section 6 outlines current research trends in this field and highlights potential directions for future exploration. Finally, Section 7 concludes the paper.
2. Related work and symbol description
In this section, we present the CTR prediction problem, review related work, introduce the fundamental concepts of CNN, RNN, graph and graph embedding, and provide a list of the common symbols used in this paper.
2.1 Related work
Advertising CTR refers to the ratio of ad clicks to ad impressions. The goal of CTR prediction is to estimate the likelihood of an advertisement being clicked based on advertising and user information. The accuracy of this prediction directly impacts the advertising revenue of internet companies (Richardson et al., Reference Richardson, Dominowska and Ragno2007). Online advertising typically uses four billing methods (Asdemir et al., Reference Asdemir, Kumar and Jacob2012): monthly, Cost Per Mille (CPM), Cost Per Click (CPC), and Cost Per Sale (CPS). Among these, CPC and CPS are closely related to CTR. The expected revenue R for an internet platform can be expressed as R = CTR
 $\times$
CPC, where CPC represents the revenue generated by a single click on an advertisement. Therefore, accurate CTR prediction is crucial for maximizing user engagement, increasing user retention, and driving significant business value for the company. The relevant theories used in the subsequent model summary are as follows:
$\times$
CPC, where CPC represents the revenue generated by a single click on an advertisement. Therefore, accurate CTR prediction is crucial for maximizing user engagement, increasing user retention, and driving significant business value for the company. The relevant theories used in the subsequent model summary are as follows:
-
1. Convolutional Neural Networks: CNN (Gu et al., Reference Gu, Wang, Kuen, Ma, Shahroudy, Shuai, Liu, Wang, Wang and Cai2018) are characterized by sparse connections and weight sharing. The overall framework of classification task based on CNN is shown in Figure 1, which can be divided into feature extraction module and classification module. The feature extraction module extracts features from input through convolution layer and pooling layer, while the classification module is based on fully connected feedforward neural network. The two modules are connected through the flattening operation to flatten the feature matrix in multiple channels obtained by the feature extraction module into a one-dimensional vector, which will be used as the input of the classification module.
In the convolution neural network, the feature map (Zou et al., Reference Zou, Rui, Zhou, Yang and Zhang2018) is composed of multiple neurons, and each neuron is connected by the output of the upper layer neuron and the convolution kernel. Convolution kernel (Rawat & Wang, Reference Rawat and Wang2017) is a weight matrix of user-defined size, which acts on the local perception domains of different regions of the same image. The features of each local perception domain are extracted to generate the input value of the next layer of neurons. The convolutional layer convolves the input features, and its feature map is shown in formula (1). The pooling layer performs secondary extraction of input features through certain pooling rules, and its feature map is shown in formula (2), where
 $H_{i}$
is the feature map of the i-th layer, (1)
\begin{align} H_{i}&=f\left(H_{i-1} \otimes w_{i}+b_{i}\right),\end{align}
(2)f(x) is a nonlinear activation function,
\begin{align} H_{i}&=f\left(pooling((H_{i-1}))+b_{i}\right),\\[8pt]\nonumber \end{align}
$\otimes$
represents the convolution operation of the convolution kernel and the feature map, pooling(x) represents pooling rules, such as mean pooling, maximum pooling, random pooling, etc.
$w_{i}$
represents the weight vector of the convolution kernel of the i-th layer,
$b_{i}$
represents the bias term of the i-th layer.
$H_{i}$
is the feature map of the i-th layer, (1)
\begin{align} H_{i}&=f\left(H_{i-1} \otimes w_{i}+b_{i}\right),\end{align}
(2)f(x) is a nonlinear activation function,
\begin{align} H_{i}&=f\left(pooling((H_{i-1}))+b_{i}\right),\\[8pt]\nonumber \end{align}
$\otimes$
represents the convolution operation of the convolution kernel and the feature map, pooling(x) represents pooling rules, such as mean pooling, maximum pooling, random pooling, etc.
$w_{i}$
represents the weight vector of the convolution kernel of the i-th layer,
$b_{i}$
represents the bias term of the i-th layer.
Figure 1. Overall framework of convolutional neural network
Figure 2. Recurrent neural network
-
2. Recurrent Neural Network: RNN (Zaremba et al., Reference Zaremba, Sutskever and Vinyals2014) is a kind of neural network which is used to process time series information. In this paper, we consider discrete RNN, where the process is divided into multiple states and each state is time-stamped. Figure 2 (Wu et al., Reference Wu, Ren, Yu, Chen, Zhang and Zhu2016) shows the basic idea of RNN, let x and o represent input and output, respectively, and use h to represent the values in the hidden layer, as well as three transfer matrices, U,V and W. There is a self-link in the hidden layer that indicates that it will update its value over time. Assuming that there are three states at
$t-1$
, t and
$t+1$
, x(i) and o(i)
$(t-1\leq t\leq t+1)$
represent the input and output in different states respectively. The hidden layer value h (i) of state i will be updated according to the value
$(h(i-1))$
of the previous state, as shown in formula (3): (3)where f represents nonlinear activation functions, such as tanh, ReLU and Sigmoid functions, and o(i) is the predictive value of state i, which is formalized as follow:
\begin{equation} h(i)=f(Ux(i)+Wh(i-1)), \end{equation}
(4)Therefore, we can get the output of each state.
\begin{equation} o(i)=softmax(Vh(i)). \end{equation}
-
3. Graph: Graph (Cai et al., Reference Cai, Zheng and Chang2018) can be represented as
$G=(V,E)$
, where V is the set of vertices and E is the set of edges (directed or undirected edges). The directed graph is shown in Figure 3(a), and the undirected graph is shown in Figure 3(b). Vertices and edges may contain additional information, collectively referred to as label information.The label of vertex v is defined as
$ \vec{l}_{v} \in \mathbb{R}^{n_{v}} $
and
$n_{v}$
is the dimension of the vertex label, usually containing the characteristics of the vertex. The label that defines the edge
$(v_{1},v_{2})$
is
$ \vec{l}_{v_{1}, v_{2}} \in \mathbb{R}^{n_{E}} $
and
$n_{E}$
is the dimension of the edge label, usually containing characteristics of the relationships between vertices. Graph structure (Scarselli et al., Reference Scarselli, Gori, Tsoi, Hagenbuchner and Monfardini2008) exists in various realistic scenarios, such as social network, citation network and knowledge graph, etc. -
4. Graph Embedding: Graph embedding (Cai et al., Reference Cai, Zheng and Chang2018) aims to map each node in a given graph into a low-dimensional vector representation that typically preserves some key information of the node in the original graph. A node in a graph can be viewed from two domains: (1) the original graph domain, where nodes are connected via edges (or the graph structure) and (2) the embedding domain, where each node is represented as a continuous vector. We illustrate an overall framework of graph embedding in Figure 4, there are four key components in the general framework as: mapping function, information extractor, reconstructor, and optimize objective. In the figure, E is the extracted graph information, and
$E^{'}$
is the reconstructed information. Thus, graph embedding maps graphs to low-dimensional spaces that retain graph information. Most graph analysis methods require high computational cost and space cost, but graph embedding provides an effective method to solve the problem of graph analysis.


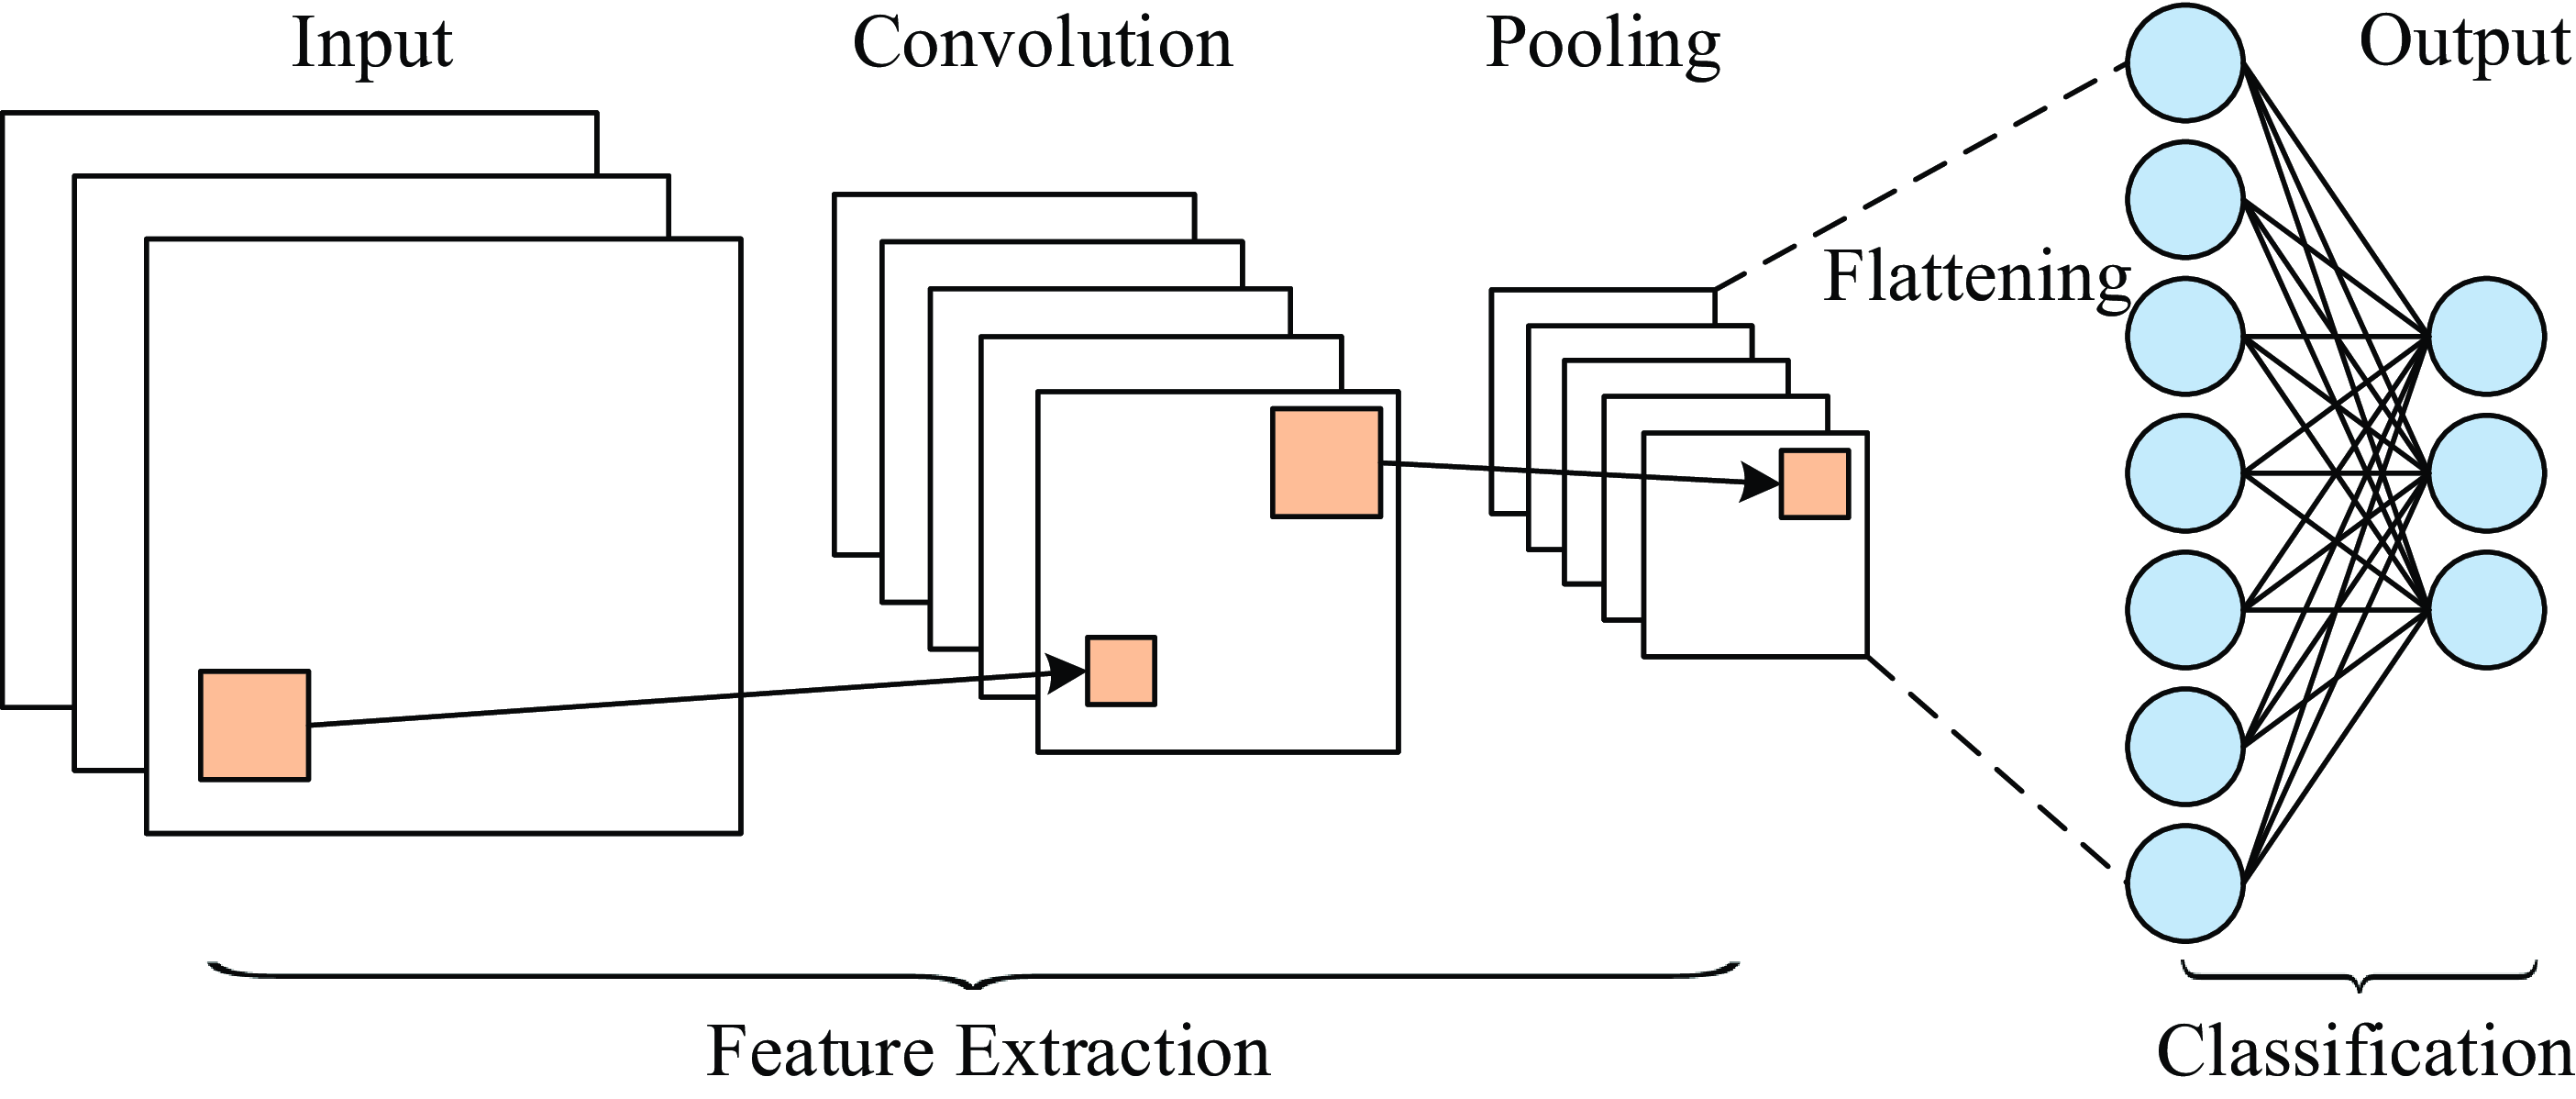
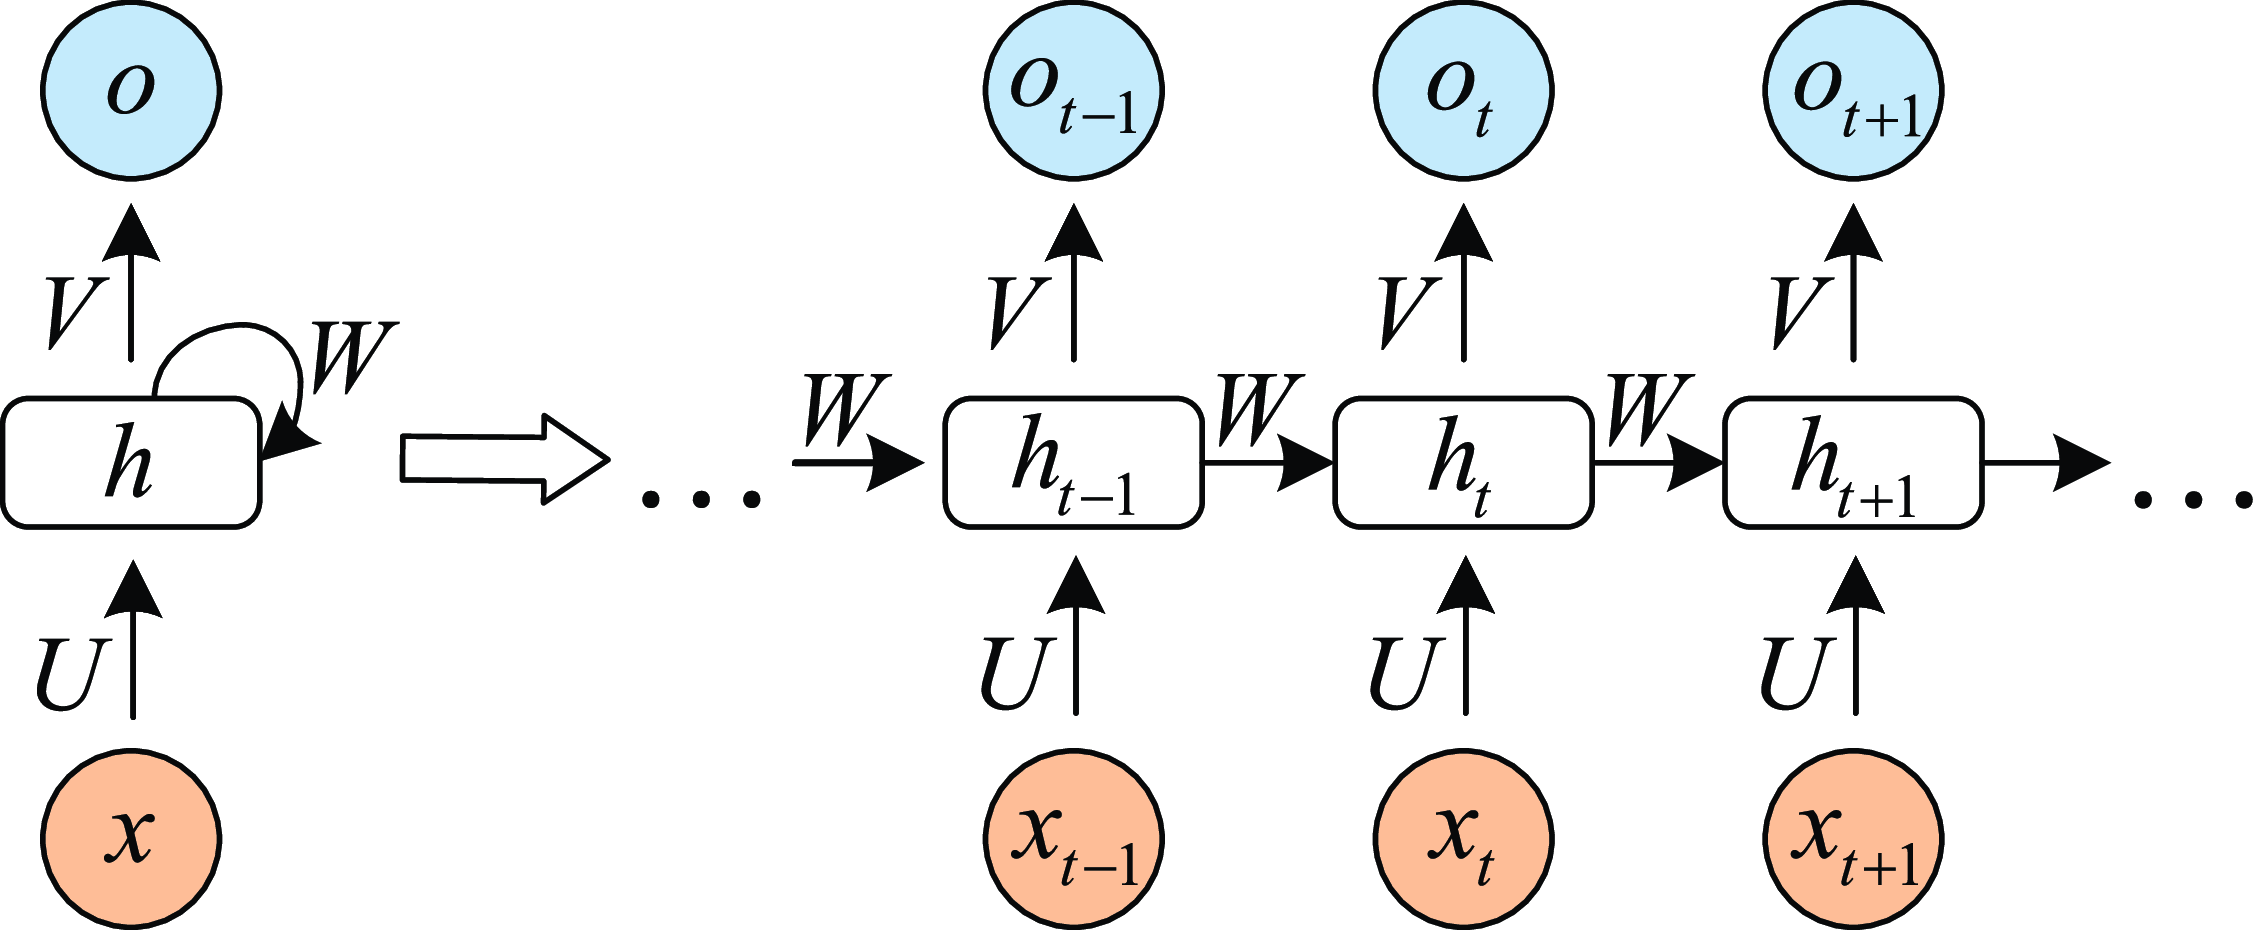


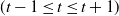


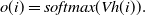


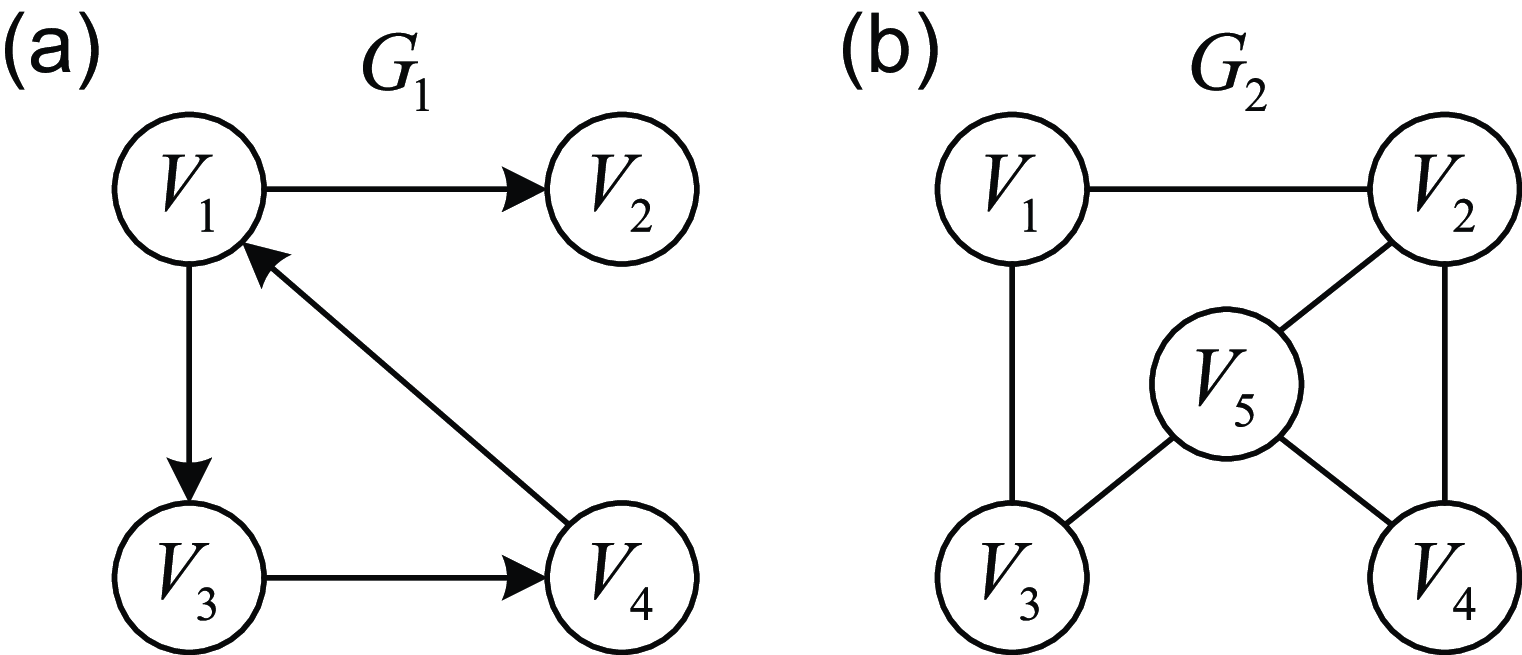
Figure 3. Instance of graph
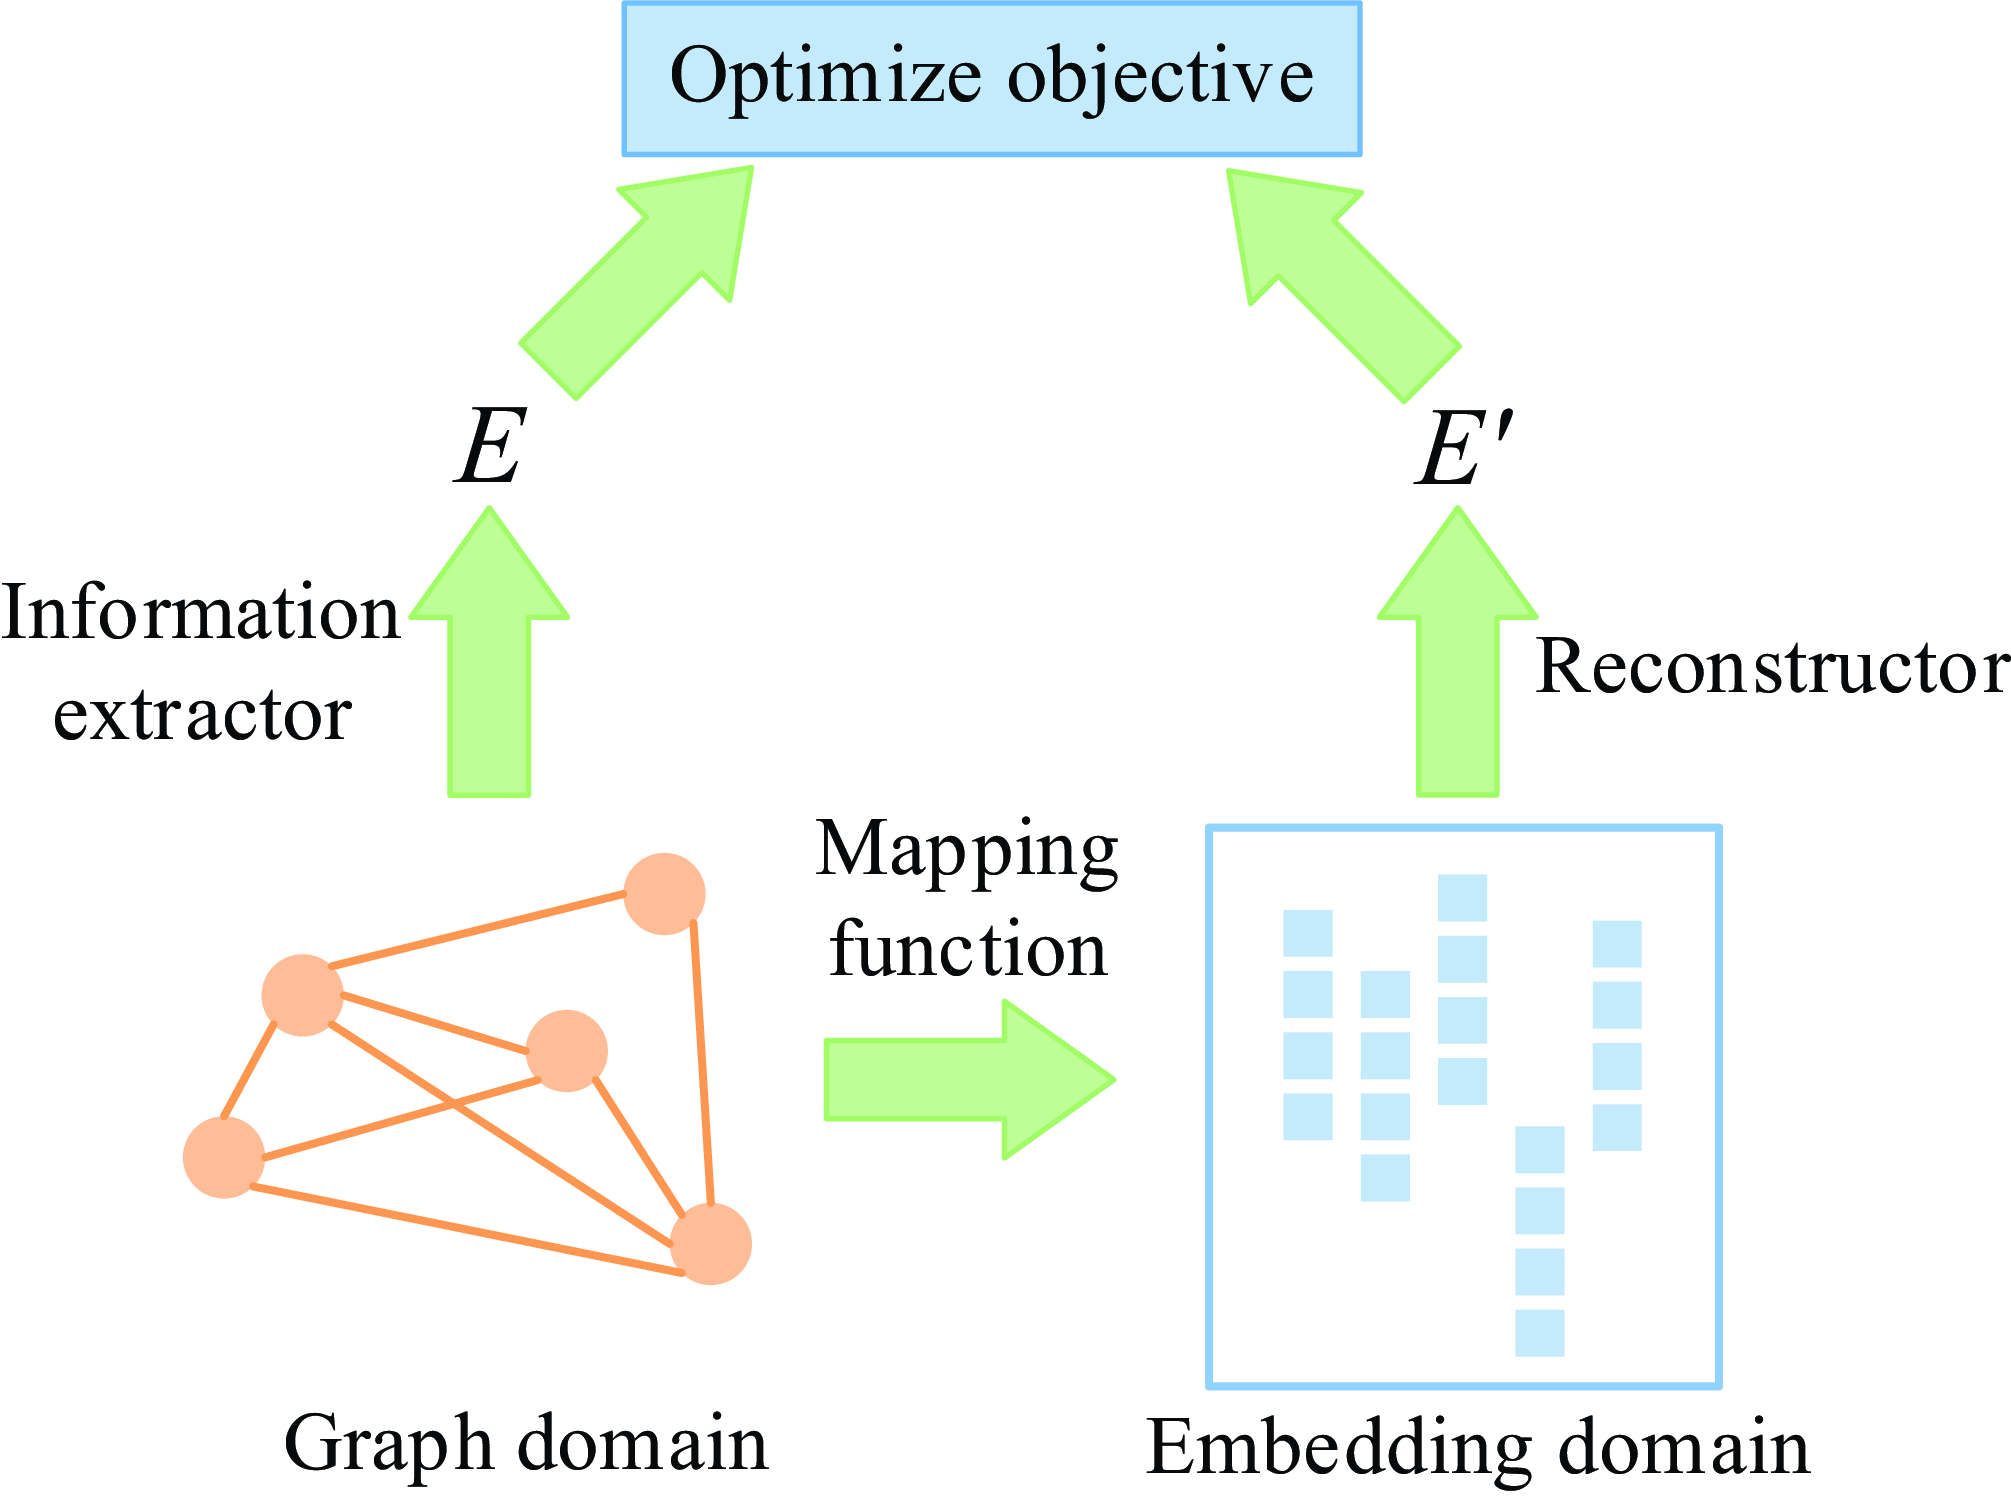
Figure 4. A general framework for graph embedding
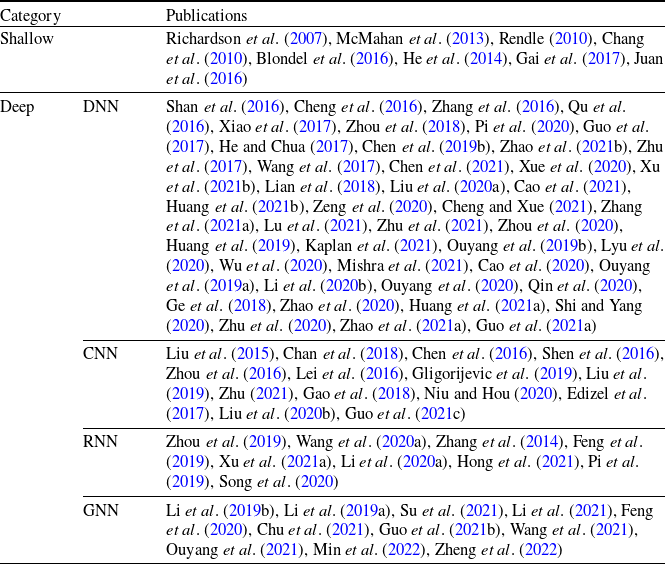
Table 1 presents the classification of CTR prediction models discussed in this paper. We categorize these models into two groups: shallow interaction models and deep learning-based prediction models (including DNN, CNN, RNN, and GNN). In this table, “Shallow” refers to traditional CTR prediction models based on shallow interactions, while ’‘Deep” encompasses models based on deep learning techniques, including deep neural networks, convolutional neural networks, recurrent neural networks, and graph neural networks. In the following two sections, we provide a brief overview of the representative models in each category.
Table 1. Classification and representative literature of click-through rate prediction models
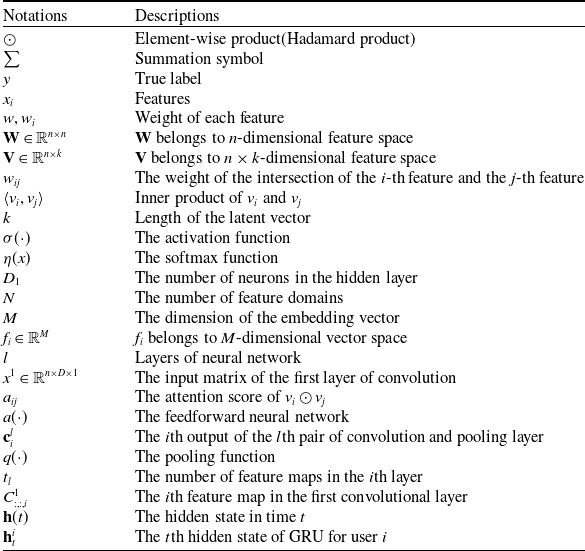
2.2 Commonly used notations
Before formally introducing the CTR prediction model, we list the commonly used notations. Unless otherwise specified, all notations used in this paper are defined in Table 2.
Table 2. Commonly used notations
3. The shallow interactive model
In internet application scenarios, the system can collect vast amounts of user and item data. The logistic regression model (Richardson et al., Reference Richardson, Dominowska and Ragno2007) effectively leverages a variety of features and converts the problem into a binary classification task. The structure of the model is illustrated in Figure 5. However, since logistic regression lacks the ability to generate combinatorial features, its expressive power is limited.
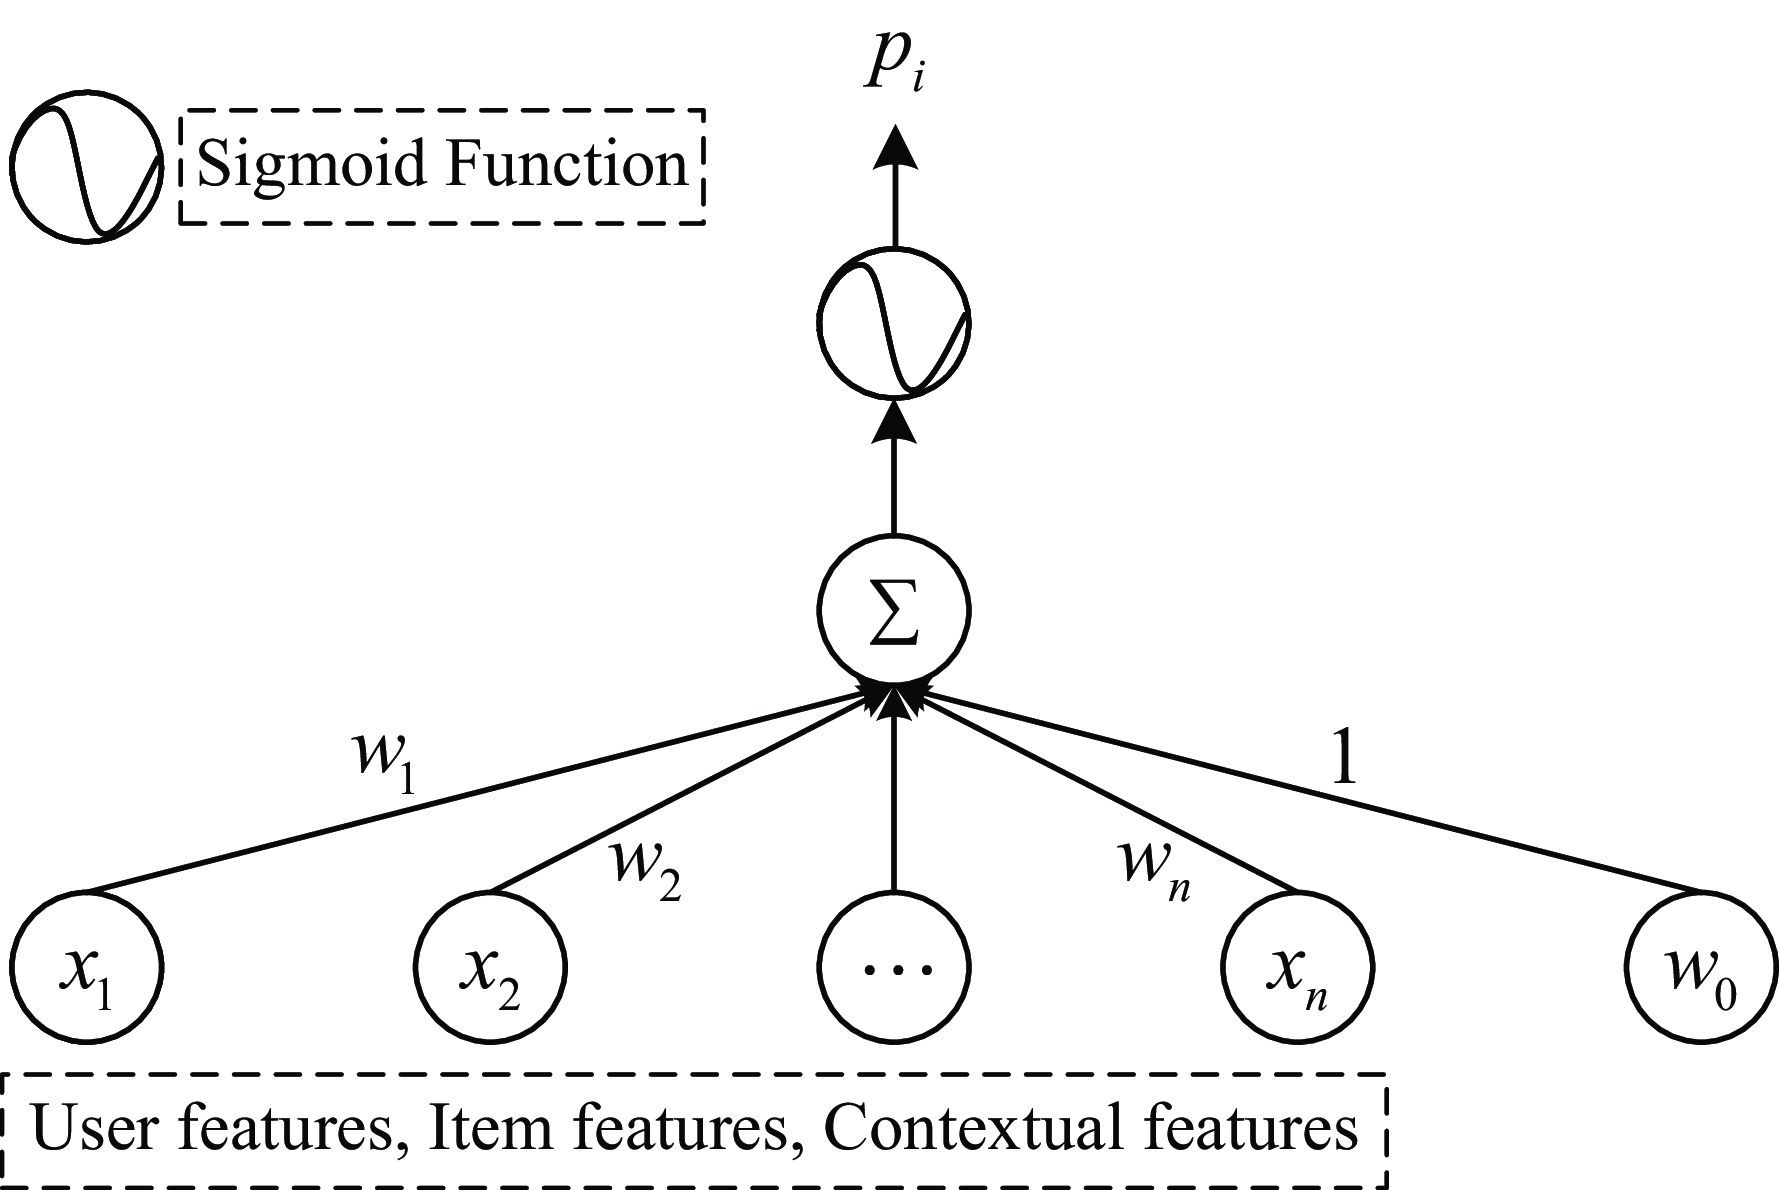
Figure 5. Structure diagram of logistic regression model
The CTR prediction result obtained by the pattern with feature interaction is often more accurate than those without feature interaction. Hence, Chang et al. (Reference Chang, Hsieh, Chang, Ringgaard and Lin2010) proposed the Poly2 model for CTR prediction, and the expression is:
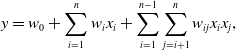 \begin{equation} y=w_{0} + \sum_{i=1}^{n} w_{i} x_{i} + \sum_{i=1}^{n-1}\sum_{j=i+1}^{n} w_{ij} x_{i} x_{j},\end{equation}
where
 $w_{ij}(i = 1,2,\ldots,n-1;\,j = i+1,\ldots,n)$
is the weight of the interaction of the i-th feature and the j-th feature. The model adopts the non-selective feature interaction method to learn the second-order feature combination, which will make the originally very sparse feature vector more sparse, resulting in the lack of effective data training for the weights of most of the intersecting features, and the time complexity is
$w_{ij}(i = 1,2,\ldots,n-1;\,j = i+1,\ldots,n)$
is the weight of the interaction of the i-th feature and the j-th feature. The model adopts the non-selective feature interaction method to learn the second-order feature combination, which will make the originally very sparse feature vector more sparse, resulting in the lack of effective data training for the weights of most of the intersecting features, and the time complexity is
 $O(n^{2})$
.
$O(n^{2})$
.
In order to reduce the computational complexity of the model in learning second-order feature combination, Rendle (Reference Rendle2010, Reference Rendle2012a) proposed the Factorization Machine (FM) model, which maps the high-dimensional sparse matrix to the low-dimensional dense vector, and learns the information of feature pairwise combination through the vector inner product. Since the features are not independent of each other, an implicit factor can be used to connect them in series. The FM introduces the idea of matrix decomposition to decompose the coefficient matrix of the cross term:
 $w_{ij}=\langle v_{i},v_{j}\rangle$
, The mathematical basis (Blum, Reference Blum2012) is that when k is large enough, there is a real matrix
$w_{ij}=\langle v_{i},v_{j}\rangle$
, The mathematical basis (Blum, Reference Blum2012) is that when k is large enough, there is a real matrix
 $\mathbf{V}\in\mathbb{R}^{n\times k}$
for any symmetric positive definite real matrix
$\mathbf{V}\in\mathbb{R}^{n\times k}$
for any symmetric positive definite real matrix
 $\mathbf{W}\in\mathbb{R}^{n\times n}$
, so that
$\mathbf{W}\in\mathbb{R}^{n\times n}$
, so that
 $\mathbf{W}=\mathbf{V}\mathbf{V}^{T}$
holds. FM model can be expressed as:
$\mathbf{W}=\mathbf{V}\mathbf{V}^{T}$
holds. FM model can be expressed as:
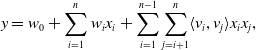 \begin{equation} y=w_{0} + \sum_{i=1}^{n} w_{i} x_{i} + \sum_{i=1}^{n-1}\sum_{j=i+1}^{n} \langle v_{i},v_{j}\rangle x_{i} x_{j},\end{equation}
The cross term coefficient of the feature vector
 $x_{i}$
and
$x_{i}$
and
 $x_{j}$
is equal to the inner product of the implicit vector corresponding to
$x_{j}$
is equal to the inner product of the implicit vector corresponding to
 $x_{i}$
and the implicit vector corresponding to
$x_{i}$
and the implicit vector corresponding to
 $x_{j}$
:
$x_{j}$
:
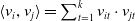 $\langle v_{i},v_{j}\rangle=\sum_{t=1}^{k} v_{it}\cdot v_{jt}$
, k is a hyperparameter, indicating the length of the implicit vector. In essence, it is embedding the feature, and the time complexity is O (kn). FM does not consider that the implicit vector may show different distribution when combining the features of different feature fields. Therefore, Juan et al. (Reference Juan, Zhuang, Chin and Lin2016) introduced the concept of field-aware and proposed the field-aware factorization machine (FFM) model related to the feature field, the mathematical expression is:
$\langle v_{i},v_{j}\rangle=\sum_{t=1}^{k} v_{it}\cdot v_{jt}$
, k is a hyperparameter, indicating the length of the implicit vector. In essence, it is embedding the feature, and the time complexity is O (kn). FM does not consider that the implicit vector may show different distribution when combining the features of different feature fields. Therefore, Juan et al. (Reference Juan, Zhuang, Chin and Lin2016) introduced the concept of field-aware and proposed the field-aware factorization machine (FFM) model related to the feature field, the mathematical expression is:
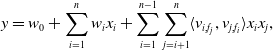 \begin{equation} y=w_{0} + \sum_{i=1}^{n} w_{i} x_{i} + \sum_{i=1}^{n-1}\sum_{j=i+1}^{n} \langle v_{i,f_{j}},v_{j,f_{i}}\rangle x_{i} x_{j},\end{equation}
although more information can be learned by using the feature field, FFM model gives a set of feature implicit vectors to individual features in each feature field, and the algorithm complexity is increased to
 $O(kn^{2})$
. Moreover, the feature interaction of FM and FFM is second-order, and at most, two features are crossed. Once there are more than two features, the complexity will become very high. Therefore, Blondel et al. (Reference Blondel, Fujino, Ueda and Ishihata2016) extended the second-order FM to higher-order factorization machines (HOFM) and designed the ANOVA kernel (used when the higher-order is greater than 2) to ensure that the higher-order combination information of features can be learned when the interpretability is strong.
$O(kn^{2})$
. Moreover, the feature interaction of FM and FFM is second-order, and at most, two features are crossed. Once there are more than two features, the complexity will become very high. Therefore, Blondel et al. (Reference Blondel, Fujino, Ueda and Ishihata2016) extended the second-order FM to higher-order factorization machines (HOFM) and designed the ANOVA kernel (used when the higher-order is greater than 2) to ensure that the higher-order combination information of features can be learned when the interpretability is strong.
In order to get higher-order feature combinations, Facebook researchers (He et al., Reference He, Pan, Jin, Xu, Liu, Xu, Shi, Atallah, Herbrich and Bowers2014) use the gradient boosting decision tree (GBDT) (Friedman, Reference Friedman2001) to extract and screen differentiated features and feature combinations and take the extracted features as the input of LR. This scheme is called GBDT+LR, which is the beginning of feature engineering modeling. Gai et al. (Reference Gai, Zhu, Li, Liu and Wang2017) put forward the large-scale piece-wise linear model (LS-PLM), also known as the mixed logistic regression (MLR), which was applied to all kinds of advertising scenes in Alibaba for a long time before the deep learning model was put forward. LS-PLM adopts the idea of divide and conquer on the basis of LR, after clustering and slicing the samples, logistic regression is applied in the sample sharding for CTR estimation. The structural characteristics of LS-PLM are similar to those of three-layer neural network (as shown in Figure 6), x is a large-scale sparse input data, the embedding operation is divided into two parts: the blue part is clustering embedding, and the green part is classification embedding, both projections are cast into the m dimensional space, and m is the number of categories. The formal expression is as follows:
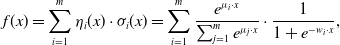 \begin{equation} f(x)=\sum_{i=1}^{m}\eta_{i}(x)\cdot\sigma_{i}(x)=\sum_{i=1}^{m}\frac{e^{\mu_{i} \cdot x}}{\sum_{j=1}^{m} e^{\mu_{j} \cdot x}} \cdot \frac{1}{1+e^{-w_{i} \cdot x}},\end{equation}
The clustering function
 $\eta_{i}$
is the softmax function, which is responsible for dividing the features into different spaces of m.
$\eta_{i}$
is the softmax function, which is responsible for dividing the features into different spaces of m.
 $\sigma_{i}(x)$
is the sigmoid function, which is responsible for predicting the feature fragments of m space. The space is divided into m regions for linear fitting, and finally, the results of the m regions are normalized in order to make the CTR prediction model more targeted for different user groups and different application scenarios.
$\sigma_{i}(x)$
is the sigmoid function, which is responsible for predicting the feature fragments of m space. The space is divided into m regions for linear fitting, and finally, the results of the m regions are normalized in order to make the CTR prediction model more targeted for different user groups and different application scenarios.
4. Deep learning models
Recently, recommender systems and computational advertising have entered the era of deep learning. On one hand, deep learning enables the extraction of deep feature representations for both users and items (Shaheen et al., Reference Shaheen, Verma and Asafuddoula2016). On the other hand, it allows for the mapping of diverse data types to a shared latent space through automatic feature learning from multi-source heterogeneous data (Mu, Reference Mu2018), thereby facilitating a unified representation of the data.
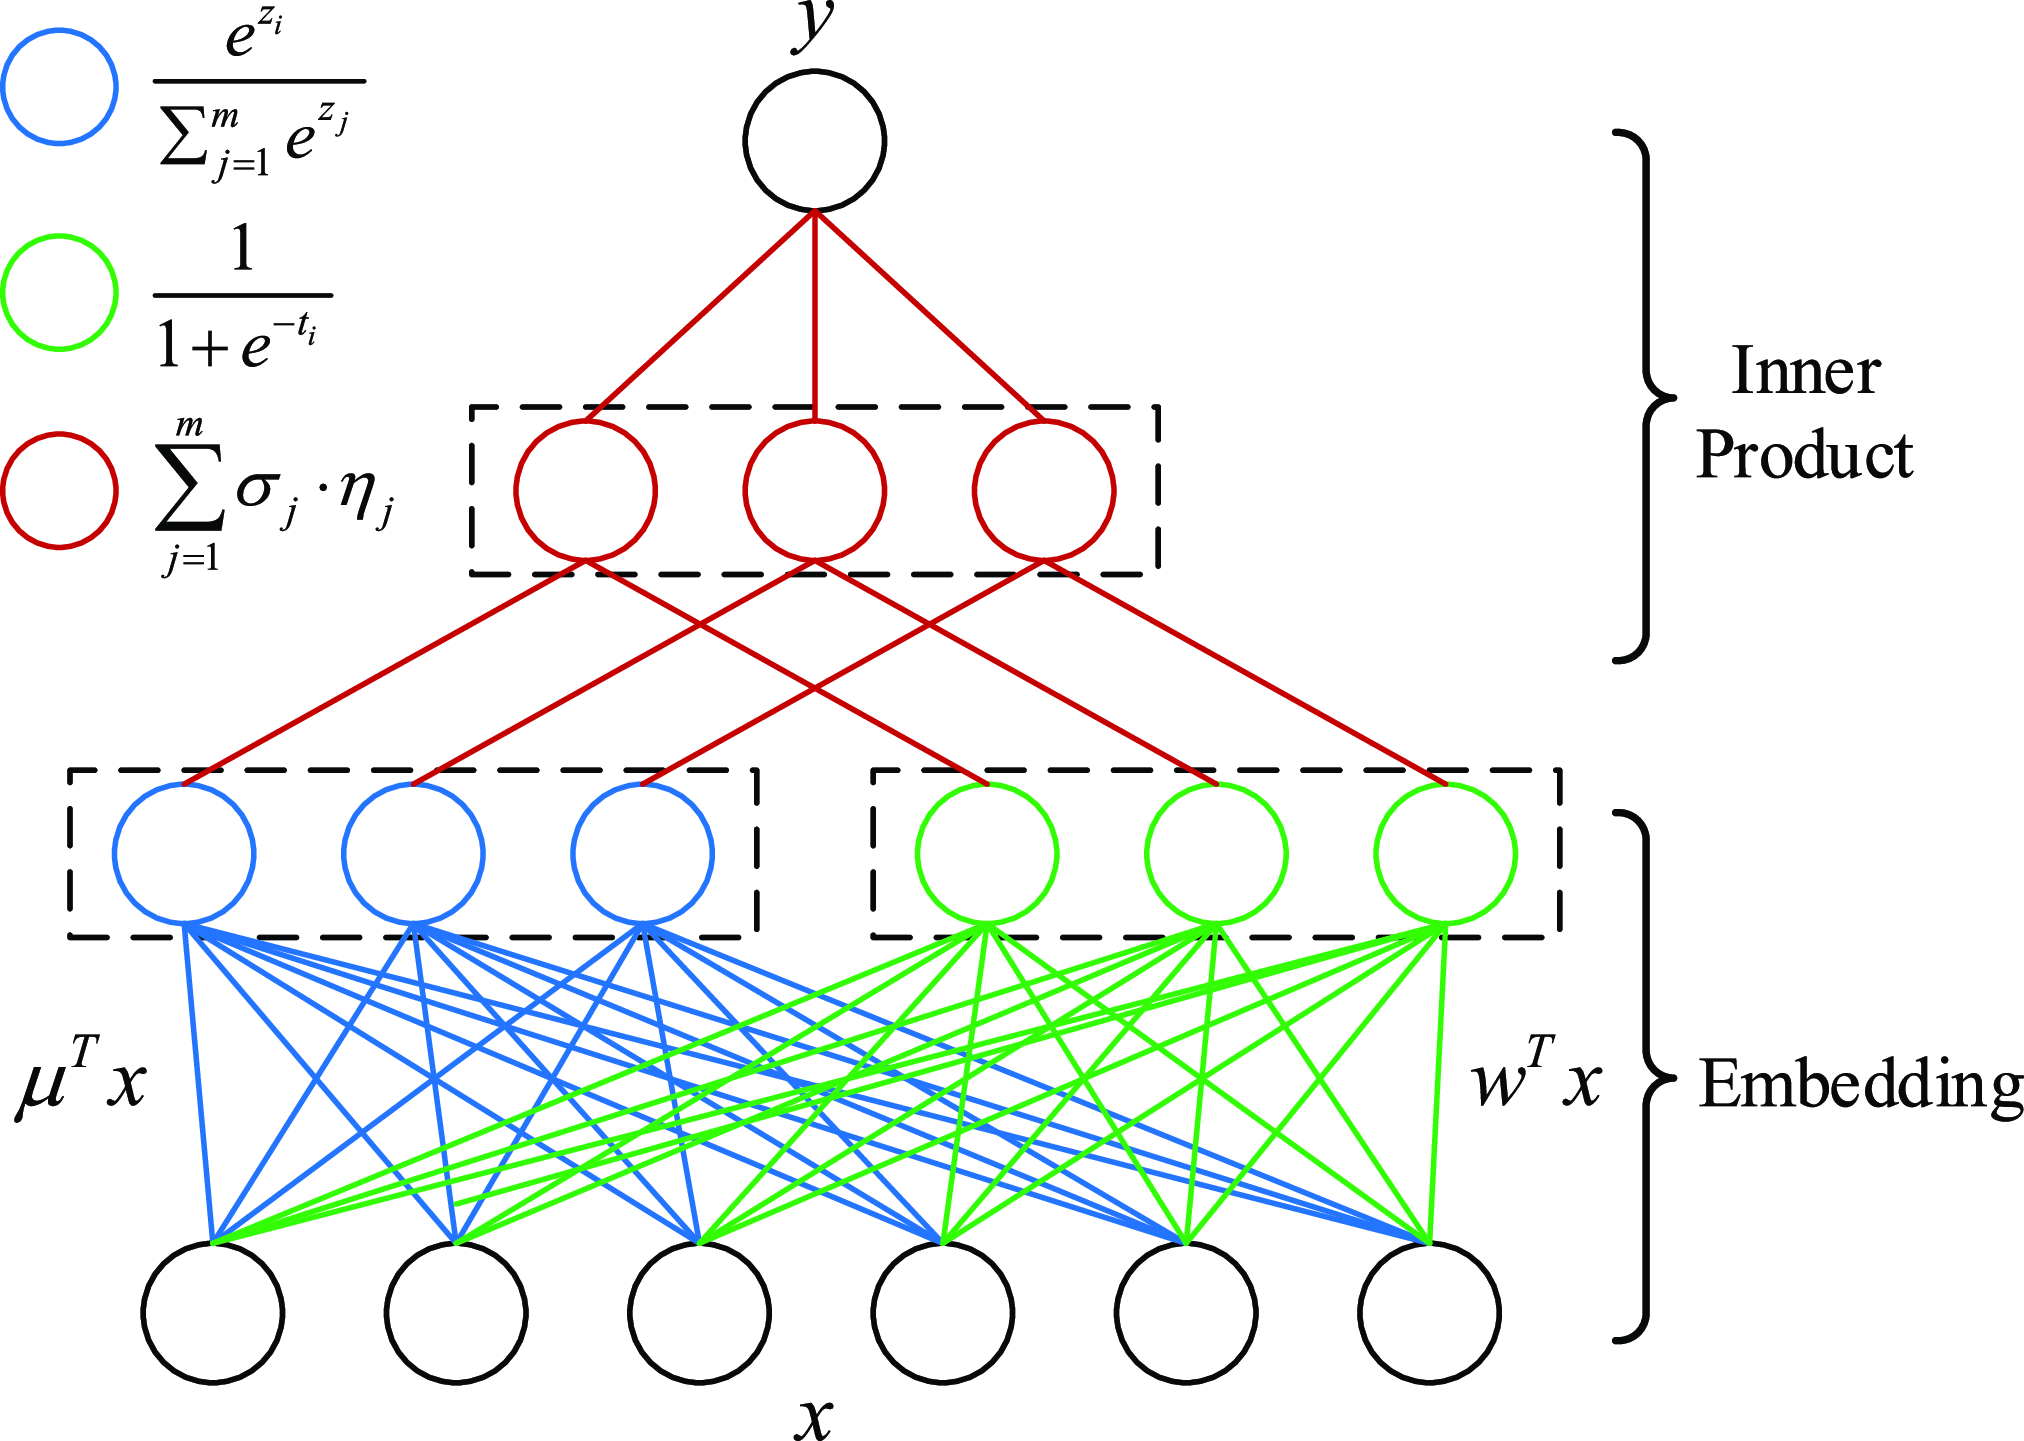
Figure 6. Structure diagram of LS-PLM
4.1 CTR prediction model based on deep neural network
Zhang et al. (Reference Zhang, Du and Wang2016) proposed factorization machine supported neural network (FNN) model, which used DNN to re-cross the second-order features of FM (Rendle, Reference Rendle2010) display expression, thus generating higher-order feature combinations and strengthening the learning ability of the model to data patterns. The input features are sparse after one-hot coding, which leads to the slow convergence speed of the embedding layer. FNN initializes the weight w of the embedding layer of the formally trained model with the feature implicit vectors pre-trained by the FM method. After introducing valuable prior information, the starting point of neural network training is closer to the optimal point of the target, which naturally accelerates the convergence process of neural network. However, the serial mode of FNN limits the expression ability of the whole model, which is limited to the upper limit of FM representation ability (second-order feature crossing), and only pays attention to the crossing of high-order combination features, so it is easy to lose the ‘memory ability’ of the model.
In the same year, Qu et al. (Reference Qu, Cai, Ren, Zhang, Yu, Wen and Wang2016) put forward the product-based neural network (PNN) model to enrich the way of feature interaction. The PNN introduced the product layer and used the vector product (inner product or outer product) between features to learn feature combination information and capture cross-domain interactive information. The product layer structure of PNN is shown in Figure 7. z in the product layer is the linear operation part,
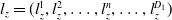 $l_{z}=(l_{z}^{1},l_{z}^{2},\ldots,l_{z}^{n},\ldots,l_{z}^{D_{1}})$
,
$l_{z}=(l_{z}^{1},l_{z}^{2},\ldots,l_{z}^{n},\ldots,l_{z}^{D_{1}})$
,
 $D_{1}$
is the number of neurons in the hidden layer. The embedding vector
$D_{1}$
is the number of neurons in the hidden layer. The embedding vector
 $f=(f_{1},f_{2},\ldots,f_{N})$
is defined as the vector
$f=(f_{1},f_{2},\ldots,f_{N})$
is defined as the vector
 $z=(z_{1},z_{2},\ldots,z_{N})$
, then the formula can be obtained:
$z=(z_{1},z_{2},\ldots,z_{N})$
, then the formula can be obtained:
 \begin{equation} l_{z}^{n}=\mathbf{W}_{z}^{n} \odot z=\sum_{i=1}^{N} \sum_{j=1}^{M}\left(\mathbf{W}_{z}^{n}\right)_{i, j} z_{i, j},(i=1,2,\ldots,N),\end{equation}
where N is the number of feature fields, and M is the dimension of Embedding. p in the product layer corresponds to the product operation part,
 $l_{p}=(l_{p}^{1},l_{p}^{2},\ldots,l_{p}^{n},\ldots,l_{p}^{D_{1}})$
, divided into inner and outer modes, and
$l_{p}=(l_{p}^{1},l_{p}^{2},\ldots,l_{p}^{n},\ldots,l_{p}^{D_{1}})$
, divided into inner and outer modes, and
 $l_{p}^{n}=W_{p}^{n} \odot z$
. The expressions for inner product and outer product modes are as follows:
$l_{p}^{n}=W_{p}^{n} \odot z$
. The expressions for inner product and outer product modes are as follows:
-
1. IPNN: The model input is the result of the inner product between embedding vectors, and the model complexity caused by the calculation of pairwise vector product will be very high. Therefore, the weight
$W_{p}^{n}$
in the formula is decomposed by using the idea of FM:
$\mathbf{W}_{p}^{n}=\theta_{i}^{n}\theta_{j}^{n}$
, the formula can be transformed into: (10)where
\begin{equation} l_{p}^{n}=\mathbf{W}_{p}^{n} \odot p=\sum_{i=1}^{N} \sum_{j=1}^{N}\theta_{i}^{n}\theta_{j}^{n}\langle f_{i},f_{j}\rangle=\langle \sum_{i=1}^{N}\delta_{i}^{n},\sum_{i=1}^{N}\delta_{i}^{n}\rangle, \end{equation}
$\delta_{i}^{n}=\theta_{i}^{n}f_{i}\in\mathbb{R}^{M}$
.
-
2. OPNN: The model input is the result of the outer product between the pairwise embedding vectors. The outer product operation will increase the complexity of the problem from O(M) to
$O(M^{2})$
. In order to reduce the complexity of the model, the results of all outer product operations can be superimposed into
$M\times M$
, that is, p is converted into: (11)
\begin{equation} p=\sum_{i=1}^{N}\sum_{j=1}^{N}f_{i\,}f_{j}^{T}=f_{M}(f_{M})^{T},f_{M}=\sum_{i=1}^{N}f_{i}. \end{equation}


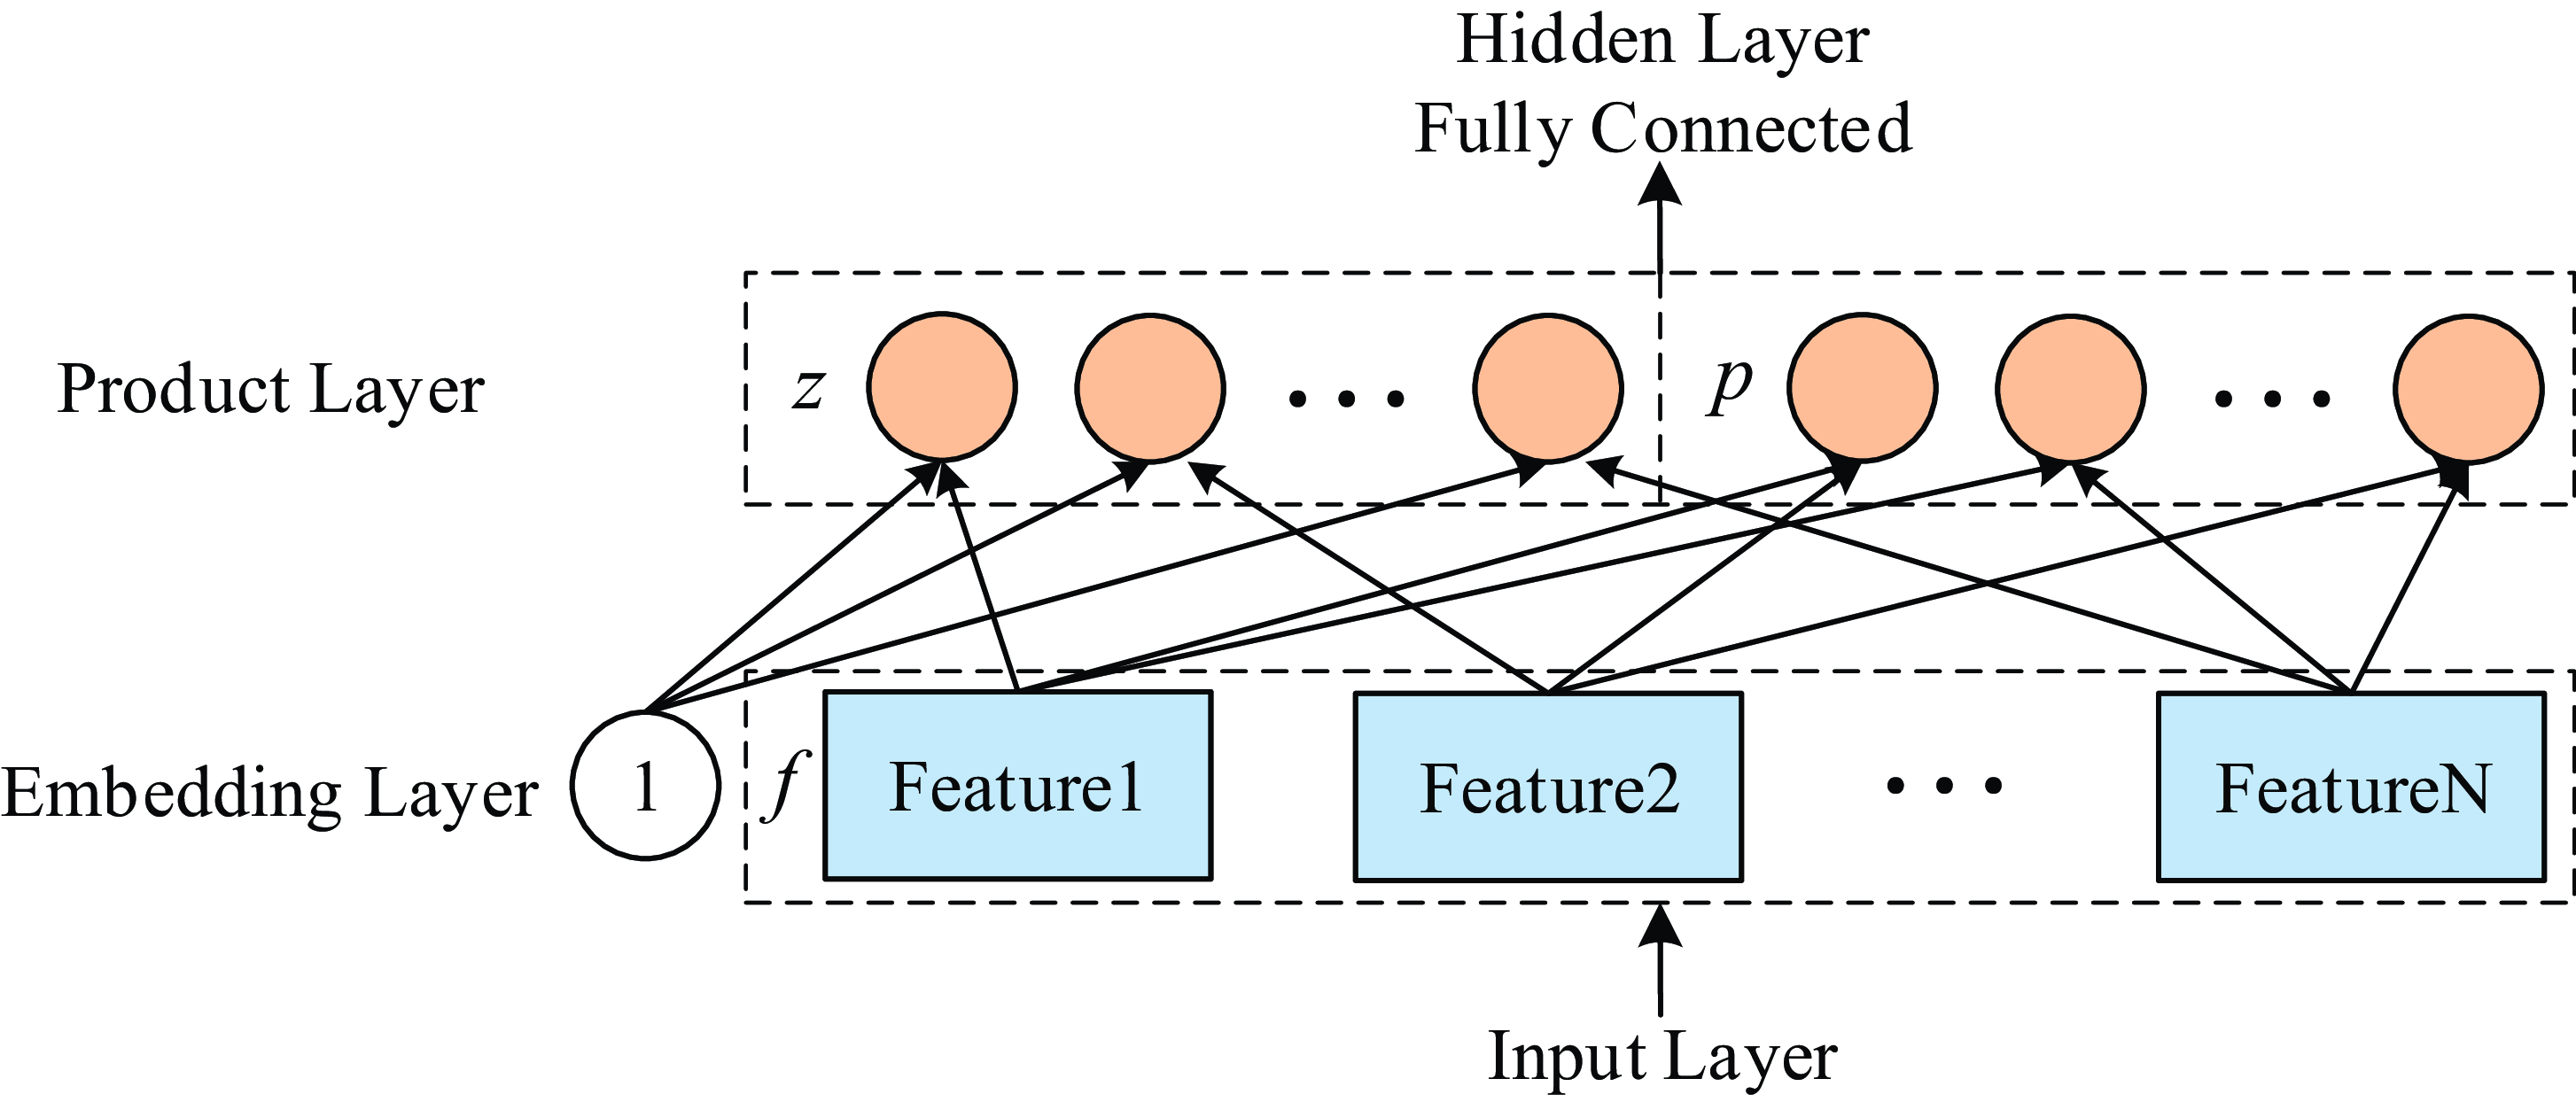
Figure 7. Structure diagram of product layer
Deep learning networks alone can capture high-order feature interactions, but they often overlook the importance of low-order feature combinations. Both the FNN and PNN models account for high-order feature interactions, yet their memory capacity is limited due to the neglect of low-order features. In deeper network architectures, the increased depth enables more complex feature interactions, but this can lead to the loss of simpler information provided by the initial features.
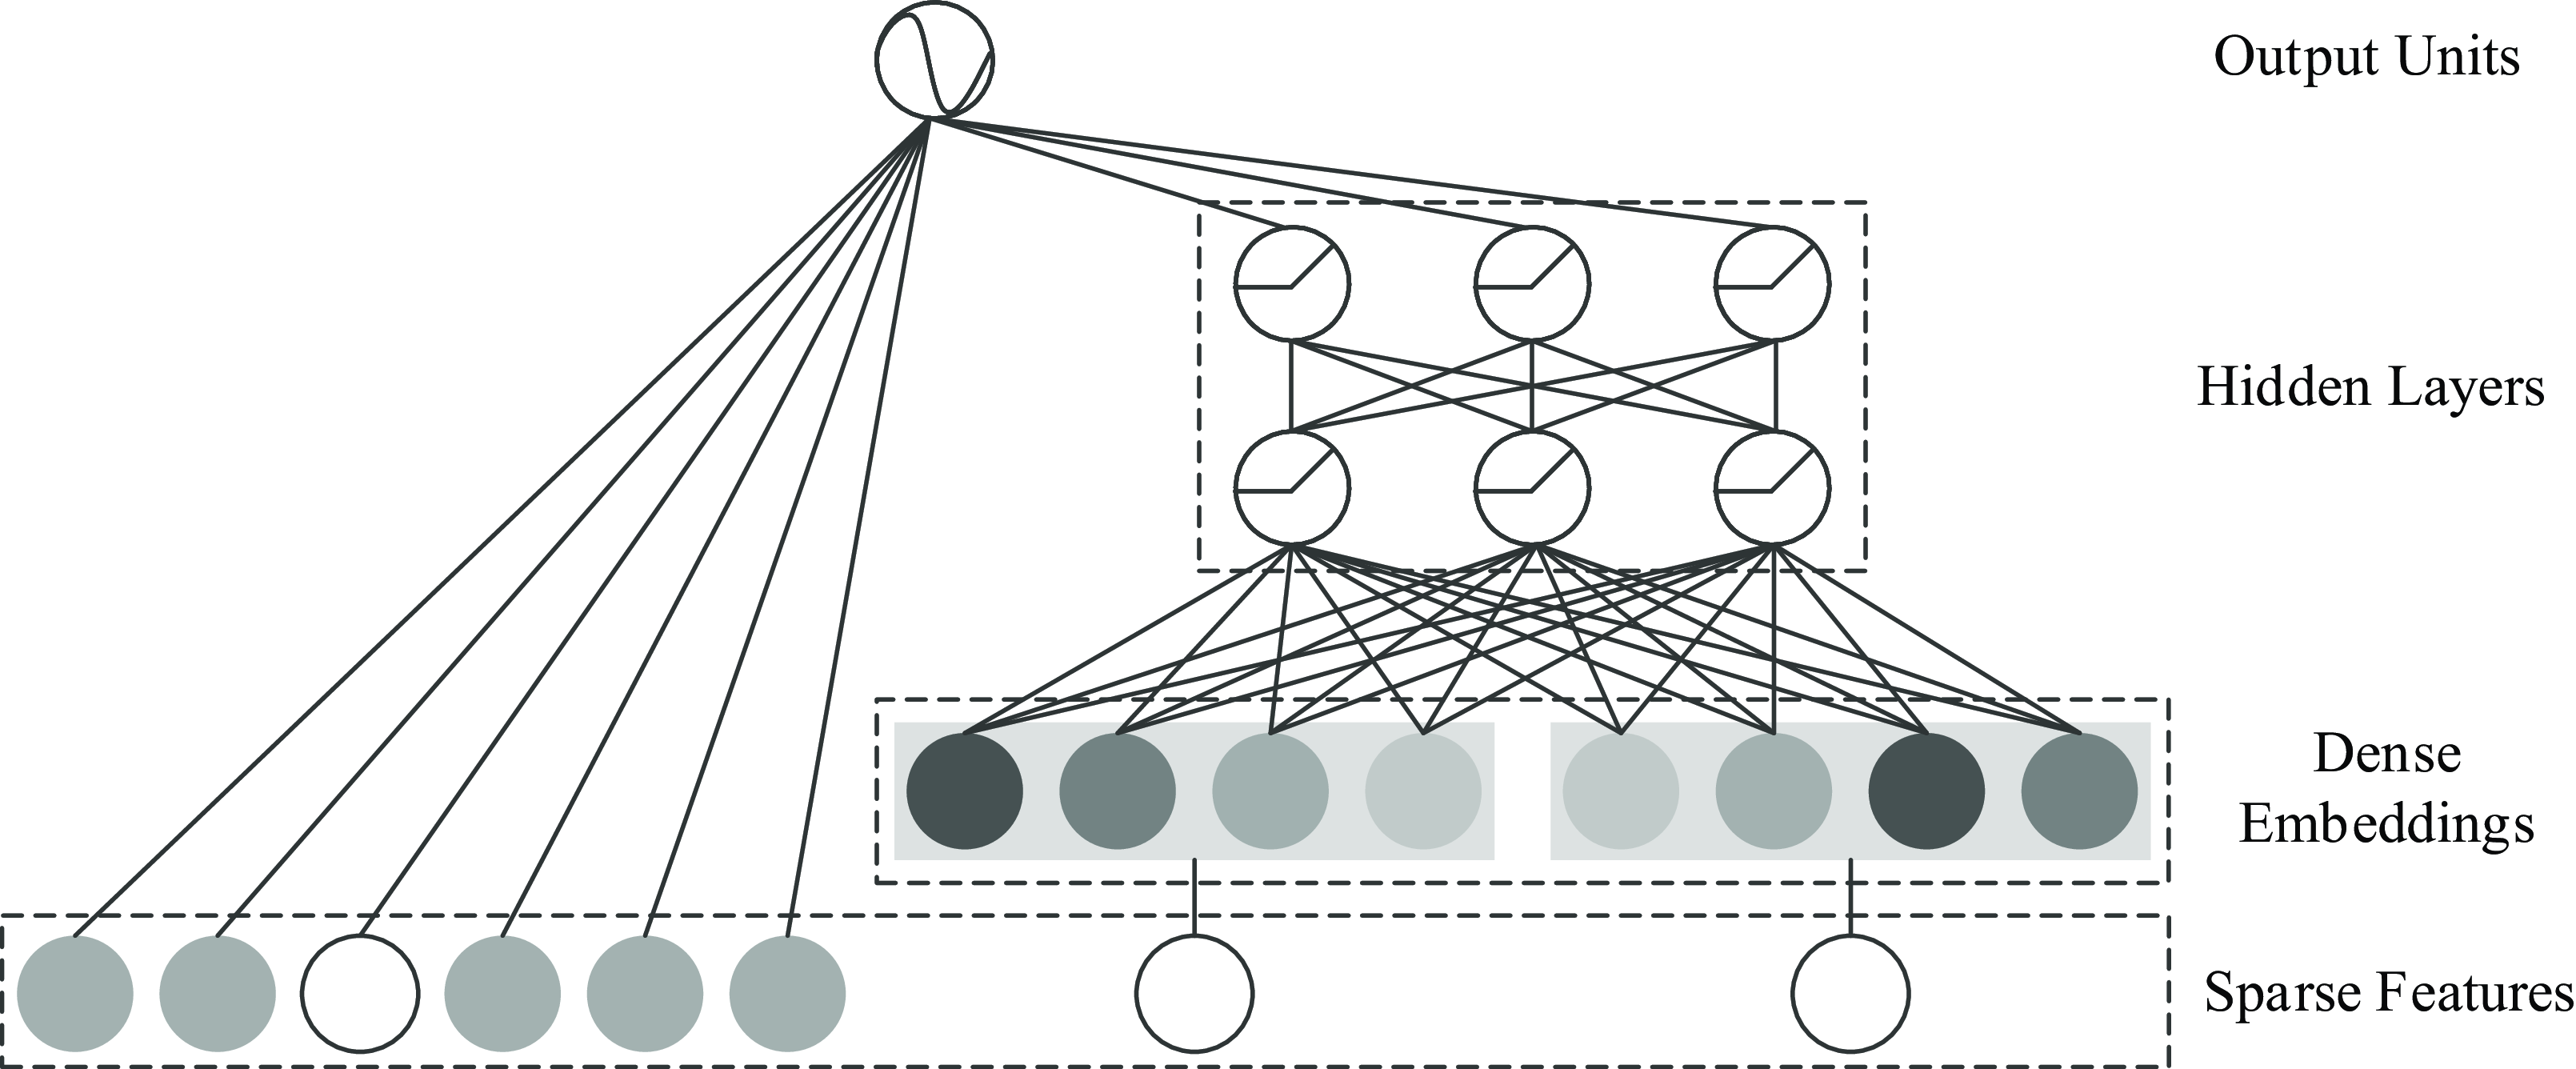
Figure 8. Structure diagram of Wide & Deep
In 2016, Google researchers (Cheng et al., Reference Cheng, Koc, Harmsen, Shaked, Chandra, Aradhye, Anderson, Corrado, Chai and Ispir2016) proposed the Wide&Deep model to combine linear models and deep learning models, not only considering low-level information but also learning the interactive information between features. The structure of the Wide&Deep model is shown in Figure 8, wide part is a linear model (generally LR) to provide memory for the whole model; DNN, as the deep part, mines high-order nonlinear features to increase the generalization ability of the model. The influence of Wide & Deep is to put forward a form that can be combined, which combines the simple model with the deep neural network, so as to strengthen the memory ability and generalization ability. In view of the defect that the wide part of Wide& Deep does not have the ability of automatic feature combination, the DeepFM model proposed by Guo et al. (Reference Guo, Tang, Ye, Li and He2017) uses a parallel structure to combine FM and DNN, both of which receive the same input, but learn different features (one is responsible for low-level interaction, the other is responsible for high-level interaction). As the FM part of the DeepFM is still a second-order crossover, it inevitably limits the expression ability of the model. Hence, He and Chua (Reference He and Chua2017) proposed Neural Factorization Machine (NFM) to extract the nonlinear interactive information of high-order features. The structure of NFM network is similar to that of PNN network. The structure of NFM network is similar to that of PNN network, which changes the product layer of PNN into Bi-Interaction pooling Layer to realize the seamless connection between FM and DNN.
Chen et al. (Reference Chen, Zhan, Ci, Yang, Lin and Liu2019b) proposed the field-leveraged embedding network (FLEN), which uses space-time efficient methods to alleviate the widespread gradient coupling problem, mainly using field-wise bilinear interaction (FwBI) (including three parts: Linear, FM, and MF), in which the MF part is used to learn the feature interaction among the large categories of features (user, item, and context), and the FM part is used to learn the feature interaction within the large categories of features. Reference (Zhao et al., Reference Zhao, Yang, Liu, Feng and Xu2021b) proposes that Field-aware INTeraction Neural Network (FINT) for CTR prediction uses the Field-aware INTeraction layer to capture high-order feature interactions while preserving low-order field information.
In addition to the models or composite models mentioned above, there are also models that directly use multi-layer perceptron (Gardner & Dorling, Reference Gardner and Dorling1998) to learn the interaction between features. The deep crossing model (Shan et al., Reference Shan, Hoens, Jiao, Wang, Yu and Mao2016) consists of embedding layer, stacking layer, multiple residual units, and a scoring layer. Through the multilayer residual network, all dimensions of feature vectors are fully crossed and combined, so that the model can capture more nonlinear features and combined feature information, and increase the expression ability of the model. Zhu et al. (Reference Zhu, Shan, Mao, Yu, Rahmanian and Zhang2017) put forward the deep embedding forest (DEF) model by replacing the residual network in the deep crossing model with the forest layer. Compared with the deep crossing, this model can effectively reduce the online prediction time.
Feature engineering plays an important role in CTR prediction accuracy, and identifying common, predictive features while exploring unseen or rare intersecting features is the key to making good predictions. Wang et al. (Reference Wang, Fu, Fu and Wang2017) proposed the Deep&Cross Network (DCN) for CTR prediction. The model consists of deep neural network and cross network, and the outputs of the two networks are combined as the input of the CTR prediction model. The purpose of designing cross network is to increase the interaction strength between features, and the time and space complexity of the network are linear. Cross network consists of multiple cross layers, assuming that the output vector of the l-th layer is
 $x_{l}$
, then the output vector of the
$x_{l}$
, then the output vector of the
 $l+1$
-th layer is:
$l+1$
-th layer is:
 \begin{equation} x_{l+1}=x_{0} x_{l}^{T} w_{l}+b_{l}+x_{l}=f(x_{l},w_{l},b_{l})+x_{l},\end{equation}
the visualization of cross layer is shown in Figure 9 (Wang et al., Reference Wang, Fu, Fu and Wang2017), the cross network can perform high-order feature interaction. The number of layers of the network determines the order of feature interaction, the highest cross product order corresponding to the l-th layer feature is
 $l+1$
. It can be seen that each layer adds a n-dimensional weight vector
$l+1$
. It can be seen that each layer adds a n-dimensional weight vector
 $w_{l}$
(n represents the dimension of the input vector) and retains the input vector at each layer, so the change between input and output will not be particularly obvious. Since Equation (12) is used for feature interaction learning, it can be seen that
$w_{l}$
(n represents the dimension of the input vector) and retains the input vector at each layer, so the change between input and output will not be particularly obvious. Since Equation (12) is used for feature interaction learning, it can be seen that
 $x_{l+1}$
is iteratively derived from
$x_{l+1}$
is iteratively derived from
 $x_{0}$
, so it will be more sensitive to the parameters of each layer. Due to insufficient sharing of hidden layer of DCN, and excessive network input sharing limits the expressiveness of the models. To enhance information sharing between explicit and implicit feature interactions, Chen et al. (Reference Chen, Wang, Liu, Tang, Guo, Zheng, Yao, Zhang and He2021) proposed the Enhanced Deep&Cross Network (EDCN). In EDCN, the bridge module mainly solves the problem of insufficient sharing of the hidden layer of DCN model and increases the interaction between parallel structures. and the regulation module generates different embeddings for different parallel networks, and is used again after each interaction to generate different embeddings. Explicit feature interaction modeling can help neural networks reduce the number of parameters and achieve better performance. However, because of the complexity of the calculation, the explicit feature interactions are often limited to the second order. Literature (Xue et al., Reference Xue, Liu, Guo, Tang, Zhou, Zafeiriou, Zhang, Wang and Li2020) also proposes efficient methods to express explicit higher-order feature combinations and simultaneously prune redundant features. To better model complex feature interactions, Xu et al. (Reference Xu, Zhu, Yu, Liu and Wu2021b) proposed the DisentanglEd Self-atTentIve NEtwork (DESTINE) framework for CTR prediction, which explicitly separates the computation of unary feature importance from pairwise interaction.
$x_{0}$
, so it will be more sensitive to the parameters of each layer. Due to insufficient sharing of hidden layer of DCN, and excessive network input sharing limits the expressiveness of the models. To enhance information sharing between explicit and implicit feature interactions, Chen et al. (Reference Chen, Wang, Liu, Tang, Guo, Zheng, Yao, Zhang and He2021) proposed the Enhanced Deep&Cross Network (EDCN). In EDCN, the bridge module mainly solves the problem of insufficient sharing of the hidden layer of DCN model and increases the interaction between parallel structures. and the regulation module generates different embeddings for different parallel networks, and is used again after each interaction to generate different embeddings. Explicit feature interaction modeling can help neural networks reduce the number of parameters and achieve better performance. However, because of the complexity of the calculation, the explicit feature interactions are often limited to the second order. Literature (Xue et al., Reference Xue, Liu, Guo, Tang, Zhou, Zafeiriou, Zhang, Wang and Li2020) also proposes efficient methods to express explicit higher-order feature combinations and simultaneously prune redundant features. To better model complex feature interactions, Xu et al. (Reference Xu, Zhu, Yu, Liu and Wu2021b) proposed the DisentanglEd Self-atTentIve NEtwork (DESTINE) framework for CTR prediction, which explicitly separates the computation of unary feature importance from pairwise interaction.
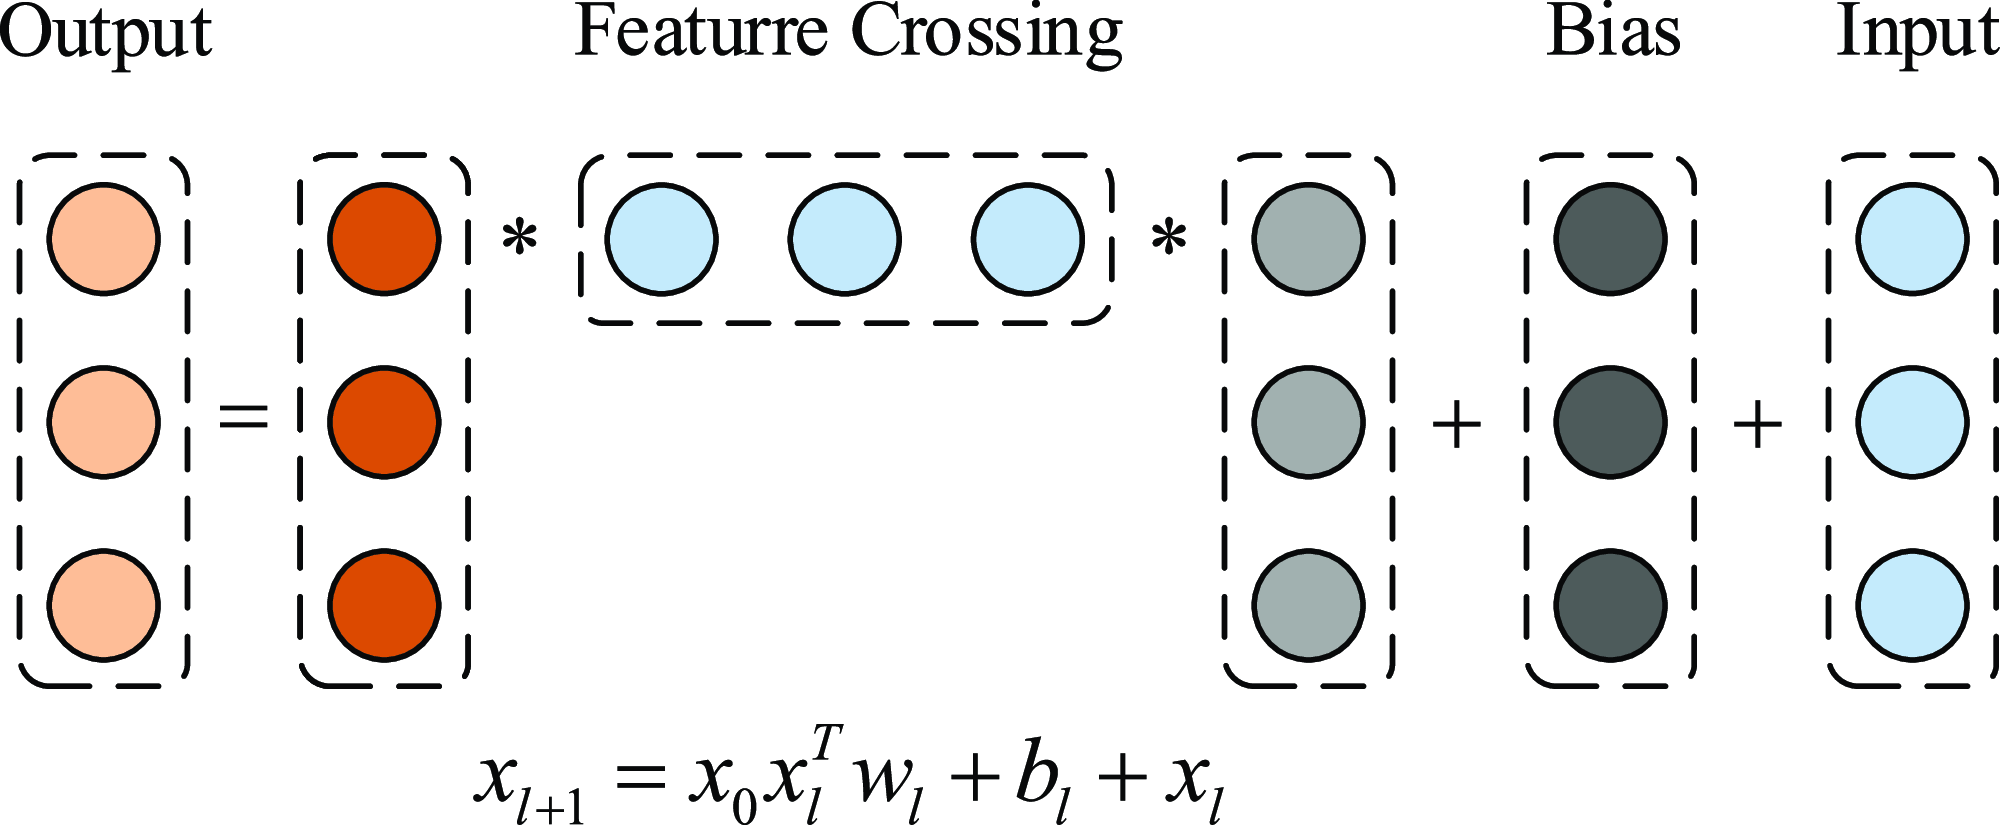
Figure 9. Visualization of cross layer
Lian et al. (Reference Lian, Zhou, Zhang, Chen, Xie and Sun2018) put forward the eXtreme Deep Factorization Machine (xDeepFM) model with compressed interaction network (CIN) to learn explicit high-order interaction. The CIN module replaces the bit-wise mode of ordinary DNN with vector-wise, which retains the advantages of high-order interaction, automatic cross-multiplication, and parameter sharing of cross network. The output of the k-th layer in CIN is matrix
 $\mathbf{X}^{k}\in \mathbb{R}^{H_{k}\times D}$
, where
$\mathbf{X}^{k}\in \mathbb{R}^{H_{k}\times D}$
, where
 $H_{k}$
represents the number of feature vectors in the k-th layer and let
$H_{k}$
represents the number of feature vectors in the k-th layer and let
 $H_{0}=m$
,
$H_{0}=m$
,
 $\mathbf{X}^{k}$
is calculated as follow:
$\mathbf{X}^{k}$
is calculated as follow:
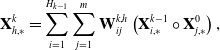 \begin{equation} \mathbf{X}_{h, *}^{k}=\sum_{i=1}^{H_{k-1}} \sum_{j=1}^{m} \mathbf{W}_{i j}^{k, h}\left(\mathbf{X}_{i, *}^{k-1} \circ \mathbf{X}_{j, *}^{0}\right),\end{equation}
where
 $ 1 \leq h \leq H_{k} $
,
$ 1 \leq h \leq H_{k} $
,
 $ \mathbf{W}^{k, h} \in \mathbb{R}^{H_{k-1} \times m} $
is the parameter matrix of the h-th feature vector, and
$ \mathbf{W}^{k, h} \in \mathbb{R}^{H_{k-1} \times m} $
is the parameter matrix of the h-th feature vector, and
 $\circ$
is the Hadamard product:
$\circ$
is the Hadamard product:
 $ \left\langle a_{1}, a_{2}, a_{3}\right\rangle \circ\left\langle b_{1}, b_{2}, b_{3}\right\rangle=\left\langle a_{1} b_{1}, a_{2} b_{2}, a_{3} b_{3}\right\rangle $
. Finally, the linear module, CIN module, and DNN are combined to complement each other, providing low-order features, explicit high-order features and implicit high-order features, respectively, to form xDeepFM. Literature (Liu et al., Reference Liu, Xue, Guo, Tang, Zafeiriou, He and Li2020a) models automatic feature grouping of explicit high-order feature interaction in CTR prediction.
$ \left\langle a_{1}, a_{2}, a_{3}\right\rangle \circ\left\langle b_{1}, b_{2}, b_{3}\right\rangle=\left\langle a_{1} b_{1}, a_{2} b_{2}, a_{3} b_{3}\right\rangle $
. Finally, the linear module, CIN module, and DNN are combined to complement each other, providing low-order features, explicit high-order features and implicit high-order features, respectively, to form xDeepFM. Literature (Liu et al., Reference Liu, Xue, Guo, Tang, Zafeiriou, He and Li2020a) models automatic feature grouping of explicit high-order feature interaction in CTR prediction.
In 2017, Xiao et al. (Reference Xiao, Ye, He, Zhang, Wu and Chua2017) added the attention mechanism to the NFM (He & Chua, Reference He and Chua2017) and proposed the attentive factorization machines (AFM) model. In the pair-wise interaction layer, the weights of the cross features of the NFM model are all 1, without considering the influence degree of different features on the results, while AFM can learn the different influence degrees of different cross features on the results. That is, an attention net is added between pair-wise interaction layer and output layer, and the formula is as follow:
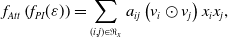 \begin{equation} f_{Att}\left(f_{PI}(\varepsilon)\right)=\sum_{(i, j) \in \Re_{x}} a_{i j}\left(v_{i} \odot v_{j}\right) x_{i} x_{j},\end{equation}
where
 $a_{ij}$
represents the attention score of the
$a_{ij}$
represents the attention score of the
 $v_{i} \odot v_{j}$
, indicating the importance of the interaction feature to the predicted target. Intuitively, this attention score can be used as a parameter to learn by minimizing the prediction loss, but it is impossible to estimate the attention score of the interaction for features that have never been common in the training data. In order to solve the generalization problem, a multilayer perceptron is used to parameterize the attention score. The structure of the attention network is a simple single full connection layer plus softmax output layer.
$v_{i} \odot v_{j}$
, indicating the importance of the interaction feature to the predicted target. Intuitively, this attention score can be used as a parameter to learn by minimizing the prediction loss, but it is impossible to estimate the attention score of the interaction for features that have never been common in the training data. In order to solve the generalization problem, a multilayer perceptron is used to parameterize the attention score. The structure of the attention network is a simple single full connection layer plus softmax output layer.
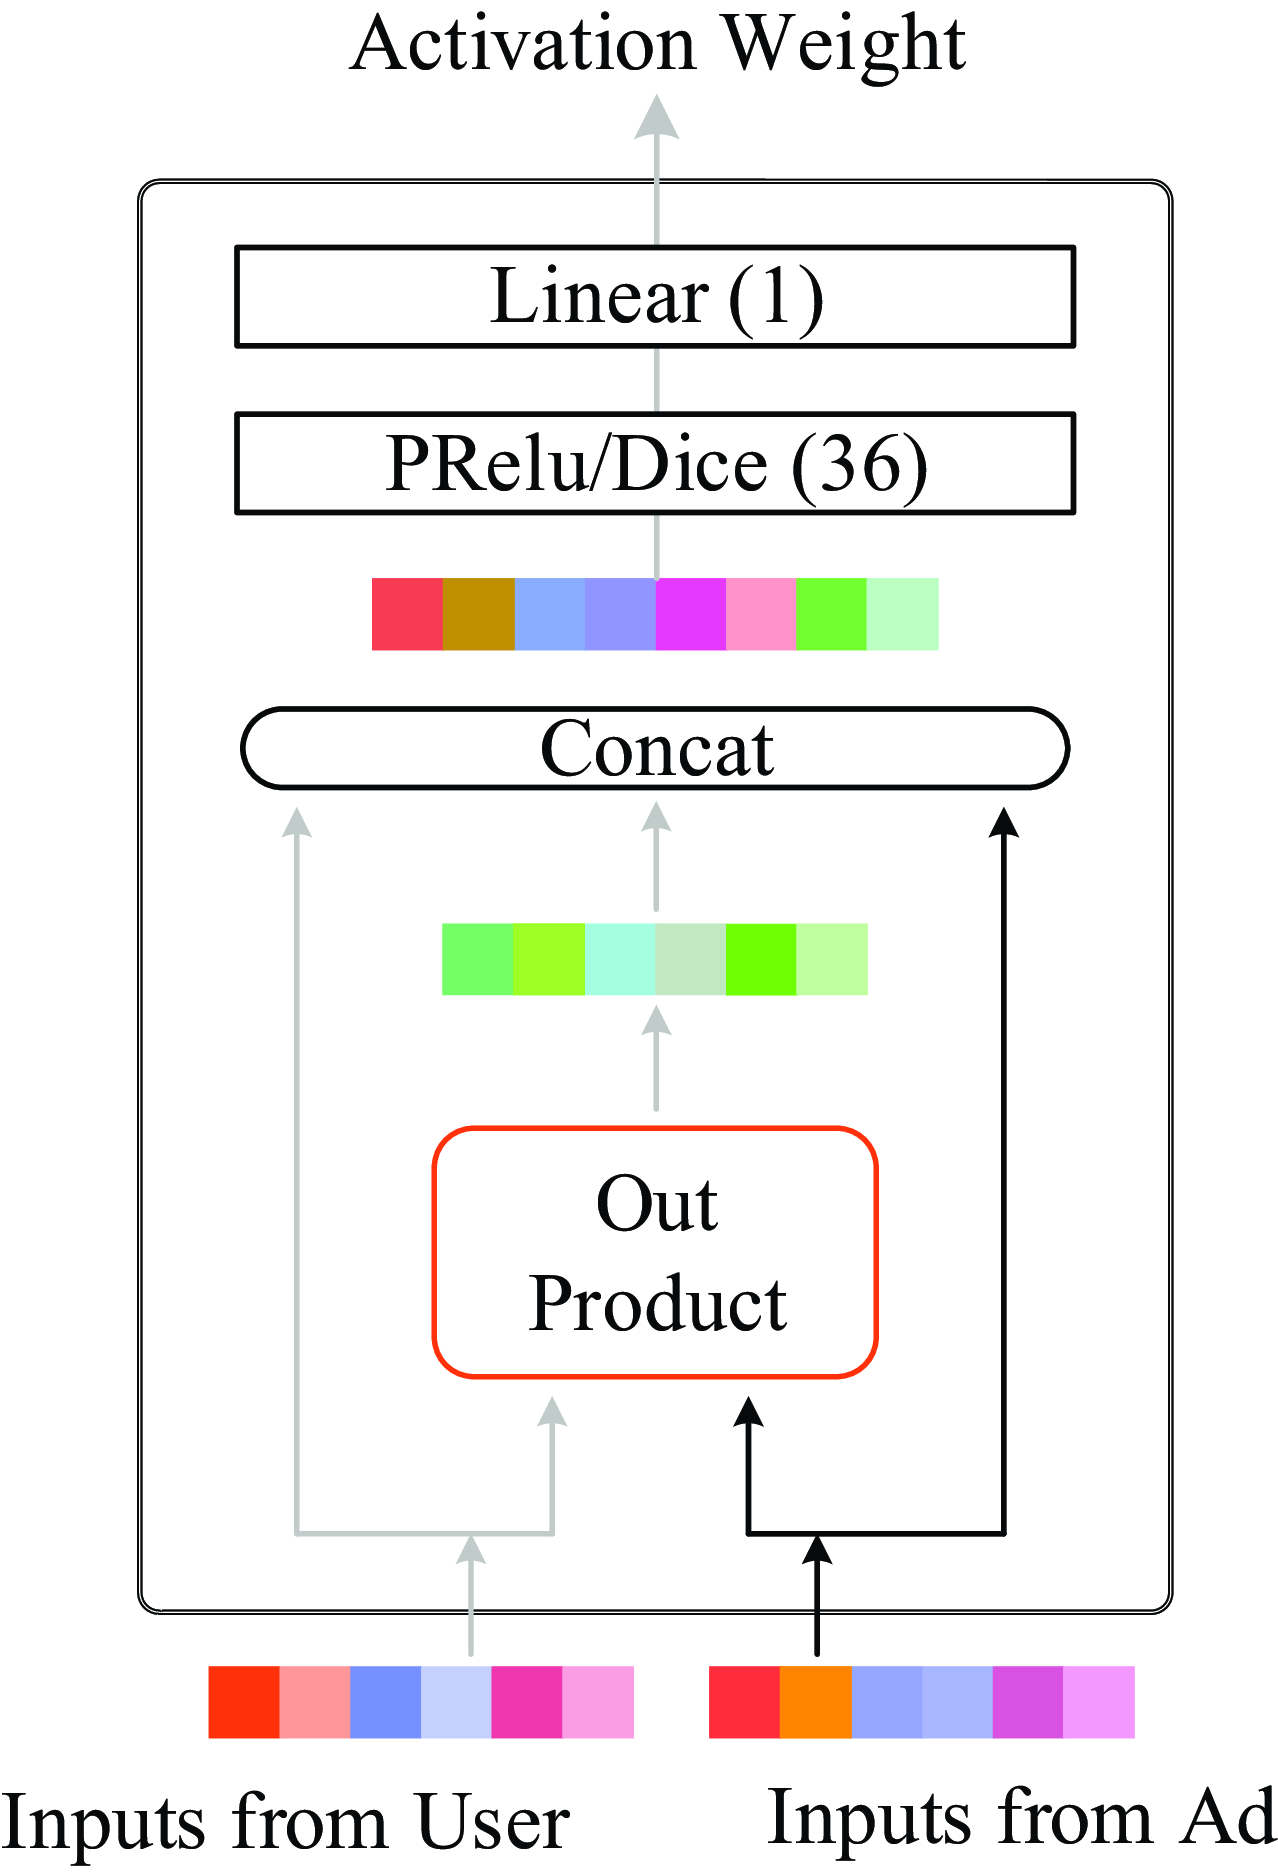
Figure 10. Structure of activation unit
AFM is a great attempt of attention in the recommender system, but it does not use specific application scenarios. Zhou et al. (Reference Zhou, Zhu, Song, Fan, Zhu, Ma, Yan, Jin, Li and Gai2018) added activation unit to learn the distribution of user interest on the basis of the basic model (Embedding & MLP) to improve CTR. This model is called deep interest network (DIN), this is Alibaba’s model improvement from the perspective of practical application based on business observation in 2018, and accords with the principle of innovation guided by actual needs. The structure of activation unit is shown in Figure 10: one of the most important features of the DIN is user behavior features, that is, the product features that the user has purchased or clicked on in the past. If many of the user’s historical products are related to the current product, then the product may be in line with the user’s taste, so recommend the advertisement to him. The activation unit structure makes a pairwise interaction between each record in the historical commodity and the commodity to be recommended, and calculates the correlation degree. The input of activation unit is the historical behavior commodity of each user and the current candidate commodity, and the output is the weight calculated by the correlation between the two. The user’s interest is expressed as formula (15):
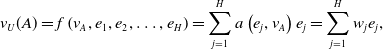 \begin{equation} v_{U}(A)=f\left(v_{A}, e_{1}, e_{2}, \ldots, e_{H}\right)=\sum_{j=1}^{H} a\left(e_{j}, v_{A}\right) e_{j}=\sum_{j=1}^{H} w_{j} e_{j},\end{equation}
where
 $v_{A}$
is the embedding vector of the candidate advertisement A,
$v_{A}$
is the embedding vector of the candidate advertisement A,
 $\{e_{1},e_{2},\ldots,e_{H}\}$
is the list of historical behavior embedding vectors of the user u, and the length is H,
$\{e_{1},e_{2},\ldots,e_{H}\}$
is the list of historical behavior embedding vectors of the user u, and the length is H,
 $a(e^{j},v_{A})=w^{j}$
indicates the weight or the correlation between the historical behavior commodity and the current advertisement A,
$a(e^{j},v_{A})=w^{j}$
indicates the weight or the correlation between the historical behavior commodity and the current advertisement A,
 $a(\!\cdot\!)$
is a feedforward neural network, the output is the activation weight, the input not only the historical behavior vector and candidate advertisement vector, but also their Hadamard product (the corresponding position elements are multiplied and not added) are added to the subsequent network, which is helpful to the explicit knowledge of association modeling. It should be noted that in order to retain the intensity of user interest, the attention score is taken as the final weight coefficient, and softmax normalization is not done. In recent years, some deep learning models that can automatically extract user interests from user behavior have achieved great success. In these works (Zeng et al., Reference Zeng, Chen, Zhu, Tian, Miao, Liu and Zheng2020; Cao et al., Reference Cao, Xu, Yang and Huang2021; Huang et al., Reference Huang, Tao and Zhang2021b), the attention mechanism is used to select items of interest to users from historical behaviors to improve the performance of CTR predictors. Literature (Cheng & Xue, Reference Cheng and Xue2021) found that most CTR prediction models can be regarded as a general attention mechanism suitable for feature interaction, so attention mechanism plays a key role in CTR prediction models. Literature (Zhang et al., Reference Zhang, Qian, Cui, Liu, Li, Zhou, Ma and Chen2021a) proposes a multi-interactive attention network (MIAN) to comprehensively extract the potential relationships among various fine-grained features (such as gender, age and occupation in user profiles). The model includes a multi-interaction layer for fine-grained feature interaction learning and a Transformer-based module to extract multiple representations of user behaviors in different feature subspaces. Dual inputaware factorization machines (DIFMs) model proposed by Lu et al. (Reference Lu, Yu, Chang, Wang, Li and Yuan2021) can adaptively learn different representations of given features according to different input examples. The automatic interaction machine (AIM) proposed in the literature (Zhu et al., Reference Zhu, Chen, Zhang, Lai, Tang, He, Li and Yu2021) has a similar idea.
$a(\!\cdot\!)$
is a feedforward neural network, the output is the activation weight, the input not only the historical behavior vector and candidate advertisement vector, but also their Hadamard product (the corresponding position elements are multiplied and not added) are added to the subsequent network, which is helpful to the explicit knowledge of association modeling. It should be noted that in order to retain the intensity of user interest, the attention score is taken as the final weight coefficient, and softmax normalization is not done. In recent years, some deep learning models that can automatically extract user interests from user behavior have achieved great success. In these works (Zeng et al., Reference Zeng, Chen, Zhu, Tian, Miao, Liu and Zheng2020; Cao et al., Reference Cao, Xu, Yang and Huang2021; Huang et al., Reference Huang, Tao and Zhang2021b), the attention mechanism is used to select items of interest to users from historical behaviors to improve the performance of CTR predictors. Literature (Cheng & Xue, Reference Cheng and Xue2021) found that most CTR prediction models can be regarded as a general attention mechanism suitable for feature interaction, so attention mechanism plays a key role in CTR prediction models. Literature (Zhang et al., Reference Zhang, Qian, Cui, Liu, Li, Zhou, Ma and Chen2021a) proposes a multi-interactive attention network (MIAN) to comprehensively extract the potential relationships among various fine-grained features (such as gender, age and occupation in user profiles). The model includes a multi-interaction layer for fine-grained feature interaction learning and a Transformer-based module to extract multiple representations of user behaviors in different feature subspaces. Dual inputaware factorization machines (DIFMs) model proposed by Lu et al. (Reference Lu, Yu, Chang, Wang, Li and Yuan2021) can adaptively learn different representations of given features according to different input examples. The automatic interaction machine (AIM) proposed in the literature (Zhu et al., Reference Zhu, Chen, Zhang, Lai, Tang, He, Li and Yu2021) has a similar idea.
The feature interaction method in CIN network is similar to the cross network in Deep&Cross, and each feature interaction uses input variables. Unlike FM, FM is a pairwise feature interaction of variables, and the CIN network fuses all variables into a matrix for feature interaction. The Co-Action in the Co-Action Network (CAN) proposed by Zhou et al. (Reference Zhou, Bian, Wu, Ren, Pi, Zhang, Xiao, Sheng, Mou and Luo2020) is a new feature interaction method. When there is an association between user and item, the data processed by Co-Action and the original data are simultaneously input to the depth learning models to improve CTR prediction.
Huang et al. (Reference Huang, Zhang and Zhang2019) pointed out that the current work of CTR prediction through feature combination mainly uses the inner product or hadamard product of feature vectors to calculate cross features. This method ignores the importance of the feature itself, and further proposes the feature importance and bilinear feature interaction network (FiBiNET) model, in which the importance of dynamic learning features using squeeze-and-excitation Nnetwork (SENET) structure and the use of a bilinear function to better establish cross features. Three kinds of bilinear functions, called Bilinear-Interaction layer, have been proposed in the literature. Taking the i-th field embedding
 $v_{i}$
and the j-th field embedding
$v_{i}$
and the j-th field embedding
 $v_{j}$
as examples, the bilinear interaction can be expressed as:
$v_{j}$
as examples, the bilinear interaction can be expressed as:
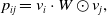 \begin{equation} p_{i j}=v_{i} \cdot W \odot v_{j},\end{equation}
where
 $ W \in R^{k \times k} $
, and
$ W \in R^{k \times k} $
, and
 $ v_{i}, v_{j} \in R^{k} $
are the i-th and j-th field embedding. Literature (Kaplan et al., Reference Kaplan, Koren, Leibovits and Somekh2021) proposes dynamic length factorization machines (DLFM) for CTR prediction to dynamically optimize the user vector structure and provide better representation for each feature and each pair of features under the constraint of maximum vector length.
$ v_{i}, v_{j} \in R^{k} $
are the i-th and j-th field embedding. Literature (Kaplan et al., Reference Kaplan, Koren, Leibovits and Somekh2021) proposes dynamic length factorization machines (DLFM) for CTR prediction to dynamically optimize the user vector structure and provide better representation for each feature and each pair of features under the constraint of maximum vector length.
In 2019, the DeepMCP model proposed by Ouyang et al. (Reference Ouyang, Zhang, Ren, Qi, Liu and Du2019b) is different from the previous CTR prediction model. It includes three parts (a matching subnet, a correlation subnet, and a prediction subnet) to model the user-ad, ad-ad and feature-CTR relationships, respectively. Aiming at the sorting problem in CTR prediction, Lyu et al. (Reference Lyu, Dong, Huo and Ren2020) combined with the idea of collaborative filtering, proposed deep match to rank (DMR) model, emphasizing the importance of capturing the correlation between users and items. Wu et al. (Reference Wu, Yu, Yu, Liu, Wang, Tan, Shao and Huang2020) proposed a tensor-based feature interaction network (TFNet) model, which introduces an operation tensor to describe the feature interaction through multi-slice matrices in multiple semantic spaces. Mishra et al. (Reference Mishra, Hu, Verma, Yen, Hu and Sviridenko2021) proposed an ad text-to-CTR prediction model based on BERT (Mozafari et al., Reference Mozafari, Farahbakhsh and Crespi2020), which uses the Ad Text Strength Indicator of Text-to-CTR and Semantic-Ad-Similarity.
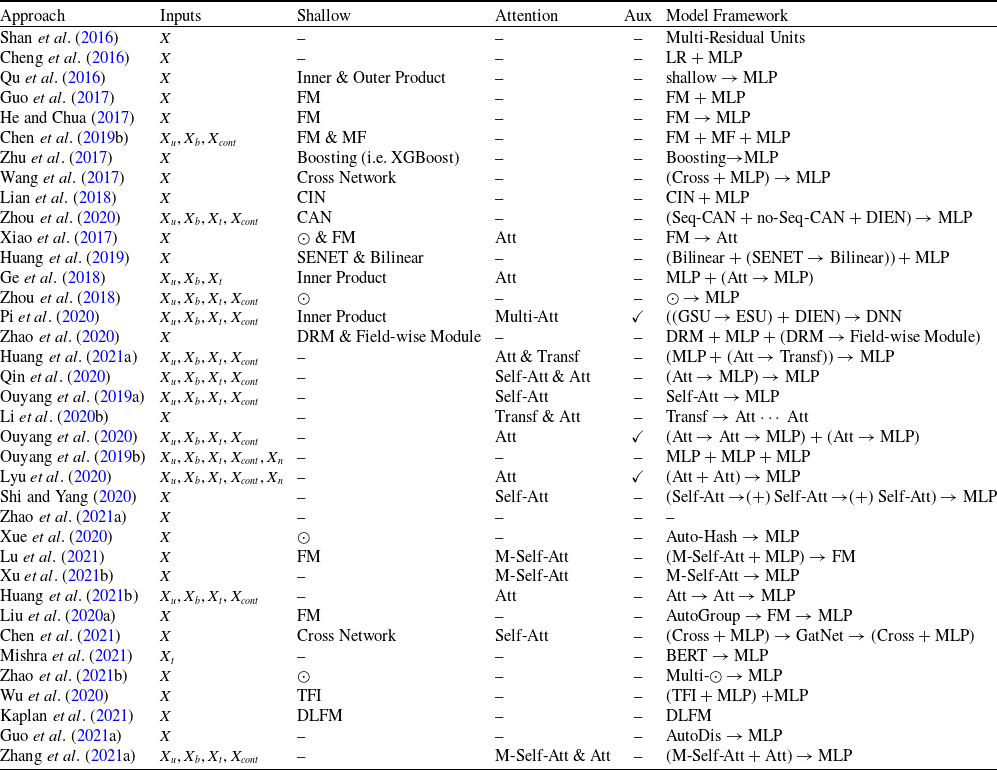
The cold-start problem (Schein et al., Reference Schein, Popescul, Ungar and Pennock2002) is a common and unavoidable challenge in recommender systems. Specifically, it arises when a new user is introduced, posing the question of how e-commerce platforms can personalize product recommendations, or how short video platforms can tailor video suggestions, in the absence of user data. Literature (Cao et al., Reference Cao, Xu, Yang and Huang2020) frames cold-start click-through rate (CTR) prediction as a meta-learning problem, treating each advertisement as an individual task. An adaptive loss function is then proposed to address task diversity and distributional shifts. The ultimate aim is to enhance CTR prediction performance in cold-start scenarios. In Table 3, we summarize the key features of representative deep neural network (DNN)-based ad CTR prediction models, comparing aspects such as input sources, shallow models, attention mechanisms, auxiliary loss functions, and overall model architectures.
Table 3. Summary of the representative DNN based ad click-through rate prediction model. Specifically,
 $\boldsymbol{X}$
,
$\boldsymbol{X}$
,
 $\boldsymbol{X}_u$
,
$\boldsymbol{X}_u$
,
 $\boldsymbol{X}_b$
,
$\boldsymbol{X}_b$
,
 $\boldsymbol{X}_{cont}$
,
$\boldsymbol{X}_{cont}$
,
 $\boldsymbol{X}_t$
and
$\boldsymbol{X}_t$
and
 $\boldsymbol{X}_{n}$
represent the input feature vector containing multiple fields, the user, the user behavior, the context, the target ad and the negative ad respectively. ‘+’ in the Model Framework indicates that the two models are combined in parallel, and ‘
$\boldsymbol{X}_{n}$
represent the input feature vector containing multiple fields, the user, the user behavior, the context, the target ad and the negative ad respectively. ‘+’ in the Model Framework indicates that the two models are combined in parallel, and ‘
 $\rightarrow$
’ indicates transmission. Missing values in the table are represented by ‘-’
$\rightarrow$
’ indicates transmission. Missing values in the table are represented by ‘-’
In the common CTR prediction models, only target advertisements are used for CTR prediction. Ouyang et al. (Reference Ouyang, Zhang, Li, Zou, Xing, Liu and Du2019a) use the contextual ads, clicked ads, and unclicked ads information auxiliary models of auxiliary advertisements to improve CTR. Three different processing methods are used for embedding matrix, including Pooling, Self-Attention, and Interactive Attention. Finally, three different CTR prediction models (DSTN-P, DSTN-S, DSTN-I) are obtained. Li et al. (Reference Li, Cheng, Chen, Chen and Wang2020b) proposed the Interpretable Hierarchical Attention (InterHAt) model, after embedding the layer, InterHAt joins the transformer network and uses the multi-layer attention mechanism to increase the interpretability of the network. Multi-head attention (Voita et al., Reference Voita, Talbot, Moiseev, Sennrich and Titov2019) divides the entire attention space into multiple attention subspaces, which has stronger expression ability. There are three ways to use multi-head attention: encoder-decoder attention, encoder self-attention and decoder masked self-attention. In principle, Multi-head is equivalent to introducing more nonlinearity to enhance the expression ability of the model under the condition that the overall calculation cost remains unchanged. A multi-head self-attention- based transformer can capture rich pairwise feature interaction and learn the diversity and polysemy of feature interaction in different semantic subspaces, that is, the diversity meaning of CTR in different click through rate contexts. Given input matrix
 $\mathbf{X}_{0}$
, the potential expression
$\mathbf{X}_{0}$
, the potential expression
 $\mathbf{H}_{i}$
of transformer head i is
$\mathbf{H}_{i}$
of transformer head i is
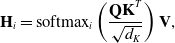 \begin{align} \mathbf{H}_{i}&=\operatorname{softmax}_{i}\left(\frac{\mathbf{QK}^{T}}{\sqrt{d_{K}}}\right) \mathbf{V}, \end{align}
 \begin{align} \mathbf{Q}=\mathbf{W}_{i}^{(Q)} \mathbf{X}_{0},& \quad \mathbf{K}=\mathbf{W}_{i}^{(K)} \mathbf{X}_{0}, \quad \mathbf{V}=\mathbf{W}_{i}^{(V)} \mathbf{X}_{0}, \\[8pt]\nonumber\end{align}
where matrix
 $ \mathbf{W}_{i}^{(Q)} \in \mathbb{R}^{d_{K} \times d} $
,
$ \mathbf{W}_{i}^{(Q)} \in \mathbb{R}^{d_{K} \times d} $
,
 $ \mathbf{W}_{i}^{(K)} \in \mathbb{R}^{d_{K} \times d} $
, and
$ \mathbf{W}_{i}^{(K)} \in \mathbb{R}^{d_{K} \times d} $
, and
 $ \mathbf{W}_{i}^{(V)} \in \mathbb{R}^{d_{K} \times d} $
is the weight parameters of head i,
$ \mathbf{W}_{i}^{(V)} \in \mathbb{R}^{d_{K} \times d} $
is the weight parameters of head i,
 $d_{K}$
represents the dimension of
$d_{K}$
represents the dimension of
 $\mathbf{K}$
and
$\mathbf{K}$
and
 $ \mathbf{H}_{i} \in \mathbb{R}^{d_{K} \times m} $
. Previous work mainly focused on single-domain CTR prediction, but advertisements are usually displayed as natural content, which provides opportunitys for cross-domain CTR prediction. In order to effectively use news data to predict the CTR of advertising, Ouyang et al. (Reference Ouyang, Zhang, Zhao, Luo, Zhang, Zou, Liu and Du2020) proposed a mixed interest network (MINET), which combines three types of user interests.
$ \mathbf{H}_{i} \in \mathbb{R}^{d_{K} \times m} $
. Previous work mainly focused on single-domain CTR prediction, but advertisements are usually displayed as natural content, which provides opportunitys for cross-domain CTR prediction. In order to effectively use news data to predict the CTR of advertising, Ouyang et al. (Reference Ouyang, Zhang, Zhao, Luo, Zhang, Zou, Liu and Du2020) proposed a mixed interest network (MINET), which combines three types of user interests.
Shopping, looking for delicious food, etc. will use the search function. The items currently searched will be the same as those in the history. Then, through the current search, mining similar parts in the history and adding them to the recommended items will greatly improve the user experience. The Search-based Interest Model(SIM) proposed by Pi et al. (Reference Pi, Zhou, Zhang, Wang, Ren, Fan, Zhu and Gai2020) divides the modeling of long-sequence user behavior features into two modules, namely, General Search Unit (GSU) and Exact Search Unit(ESU). GSU is responsible for screening candidate behaviors related to the current target advertisement from all user behavior queues. ESU uses the filtered information for effective modeling on this basis. The User Behavior Retrieval for CTR prediction (UBR4CTR) (Qin et al., Reference Qin, Zhang, Wu, Jin, Fang and Yu2020) model has the same purpose. UBR4CTR model retrieves a certain number of behavior sequences from the user’s historical behavior according to the target predicted by CTR. The target here consists of three parts, target item, target user and other associated content context. Then the model is used to extract the features of the most relevant subsequences from the user’s historical long behavior sequence, and finally these features will be used to complete the prediction task of CTR.
Over the past decade, the rapid development of e-commerce and mobile internet has led to a significant surge in the number of mobile applications. The emergence of e-commerce platforms such as Taobao, JD.com, and Douyin has introduced diverse forms of source data for advertisements, which hold considerable research significance. These platforms generate vast amounts of user interaction and behavioral data, which can be leveraged to enhance the accuracy and relevance of advertising recommendations. CTR prediction typically encompasses three primary recommendation modes, each designed to address different real-world recommendation scenarios, thereby offering tailored solutions for various types of users, content, and contextual conditions.
1. CTR prediction scenarios related to pictures
Ge et al. (Reference Ge, Zhao, Zhou, Chen, Liu, Yi, Hu, Liu, Sun and Liu2018) proposed the deep image CTR model (DICM) using pictures as one of the data sources. DICM uses the pictures clicked by users and the pictures in advertisements to predict CTR. When using pictures for training and predicting, it causes excessive bandwidth problems when embedding pictures, so the advanced model server (AMS) (Tusch, Reference Tusch2002) architecture is proposed in this paper to solve this problem. Add a learnable MLP of the compression model
 $\{4096-256-64-12\}$
for each server. When worker requests image embedding from server, the compression model on server first compresses the original 4096-dimensional image embedding to 12-dimensions, which greatly reduces the traffic. The compression model parameters on each server can be learned according to the locally stored graph data. At the end of each iteration, all server compression models need to be synchronized to ensure that the compression models on each server are consistent.
$\{4096-256-64-12\}$
for each server. When worker requests image embedding from server, the compression model on server first compresses the original 4096-dimensional image embedding to 12-dimensions, which greatly reduces the traffic. The compression model parameters on each server can be learned according to the locally stored graph data. At the end of each iteration, all server compression models need to be synchronized to ensure that the compression models on each server are consistent.
2. CTR prediction scenarios related to position
The dimension relation module (DRM) model proposed by Zhao et al. (Reference Zhao, Fang, Li, Peng, Bao and Yan2020) includes two subnetworks (Item-to-Item network and user-to-item network) and adds the location information of each behavior, which pays more attention to the recent behavior of users, so it can better predict CTR. When ordering takeout or looking for location-related services such as food on some platforms, adding location information and context information to the CTR model can greatly improve the prediction performance of the model. The common CTR prediction model uses the results obtained from the embedding layer for learning feature interaction, which will bring two shortcomings: one is that the importance of dimension in different field is not considered; the other is that the interaction between features is ignored. Therefore, Zhao et al. (Reference Zhao, Fang, Li, Peng, Bao and Yan2020) put forward field-wise and element-wise based on DRM (FED-net) to solve the shortcomings caused by the direct use of embedding. First of all, dimension relation module (DRM) is proposed in FED-net to solve the deficiency one (the importance of dimension in different field), and then the Field-wise module is designed to solve the deficiency two (interaction between features). The use of two different network structures to help solve the shortcomings caused by the direct use of the embedding layer will have a great impact on future research. Huang et al. (Reference Huang, Hu, Tang, Chen, Qi, Cheng and Lei2021a) proposed that deep position-wise interaction network (DPIN) model uses multi-source data and adds attention mechanism to learn the potential interest of users’ location to help the platform to better push satisfactory services to users.
3. CTR prediction scenarios related to video
The video click-through rate prediction studied in document (Wang et al., Reference Wang, Zhang, Feng and Zha2020a) solves the multi-channel problem in video CTR prediction for the first time, which is very important for the refinement of video recommendation and the revenue of video advertising. In this paper, sequential multi-fusion network (SMFN) is proposed to divide all channels into two categories: (1) the target channel to which the current candidate video belongs. (2) the context channel including all left channels. For each category, SMFN deeply fuses the two sequences through a simple but effective mechanism, and verifies that the fusion unit helps to improve the CTR prediction performance. Min et al. (Reference Min, Rong, Xu, Bian, Luo, Lin, Huang, Ananiadou and Zhao2022) propose neighbor interaction-based CTR prediction (NI-CTR) model. The model is actually deployed to the online recommendation scene of wechat official account video. The proposed modeling neighborhood information improves the performance of CTR prediction.
The effective integration of high-level and low-level features remains an underexplored area of research. Some studies attempt to combine these features through simple summation or concatenation. However, this approach often yields suboptimal results, as it treats high-level and low-level features with equal importance, without accounting for their inherent differences in significance and abstraction. The hybrid feature fusion (HFF) model proposed by Shi and Yang (Reference Shi and Yang2020) is composed of feature interaction layer and feature fusion interaction. It can not only capture high-level features but also make full use of low and high level features. Model integration is a powerful means to improve the prediction accuracy. Literature (Zhu et al., Reference Zhu, Liu, Li, Lai, He, Chen and Zheng2020) attempts to apply knowledge distillation (KD) to ensembled CTR prediction. Zhao et al. (Reference Zhao, Luo, Zhou, Qiao, He, Zhang and Lin2021a) introduced reinforcement learning (Sutton & Barto, Reference Sutton and Barto2018) into CTR prediction model, which lays a foundation for the proposal of various evolution models later.
4.2 CTR prediction model based on convolutional neural network
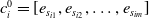
Convolutional neural networks (CNNs) have demonstrated exceptional performance in processing images, videos, and other types of data, and they can also be effectively applied to click-through rate prediction tasks. CNNs are particularly well-suited for feature extraction, leveraging their hierarchical structure to capture both low-level and high-level features from raw data, the most typical of which is the convolutional click prediction model (CCPM) proposed by Liu et al. (Reference Liu, Yu, Wu and Wang2015), which calculates continuous features to obtain local features, Then, the obtained feature combination is input into the fully connected neural network, which improves the learning ability of the fully connected network. The basic architecture of using CNN for the CTR problem is shown in Figure 11 (Chan et al., Reference Chan, Hu, Zhao, Yeung, Liu and Xiao2018),
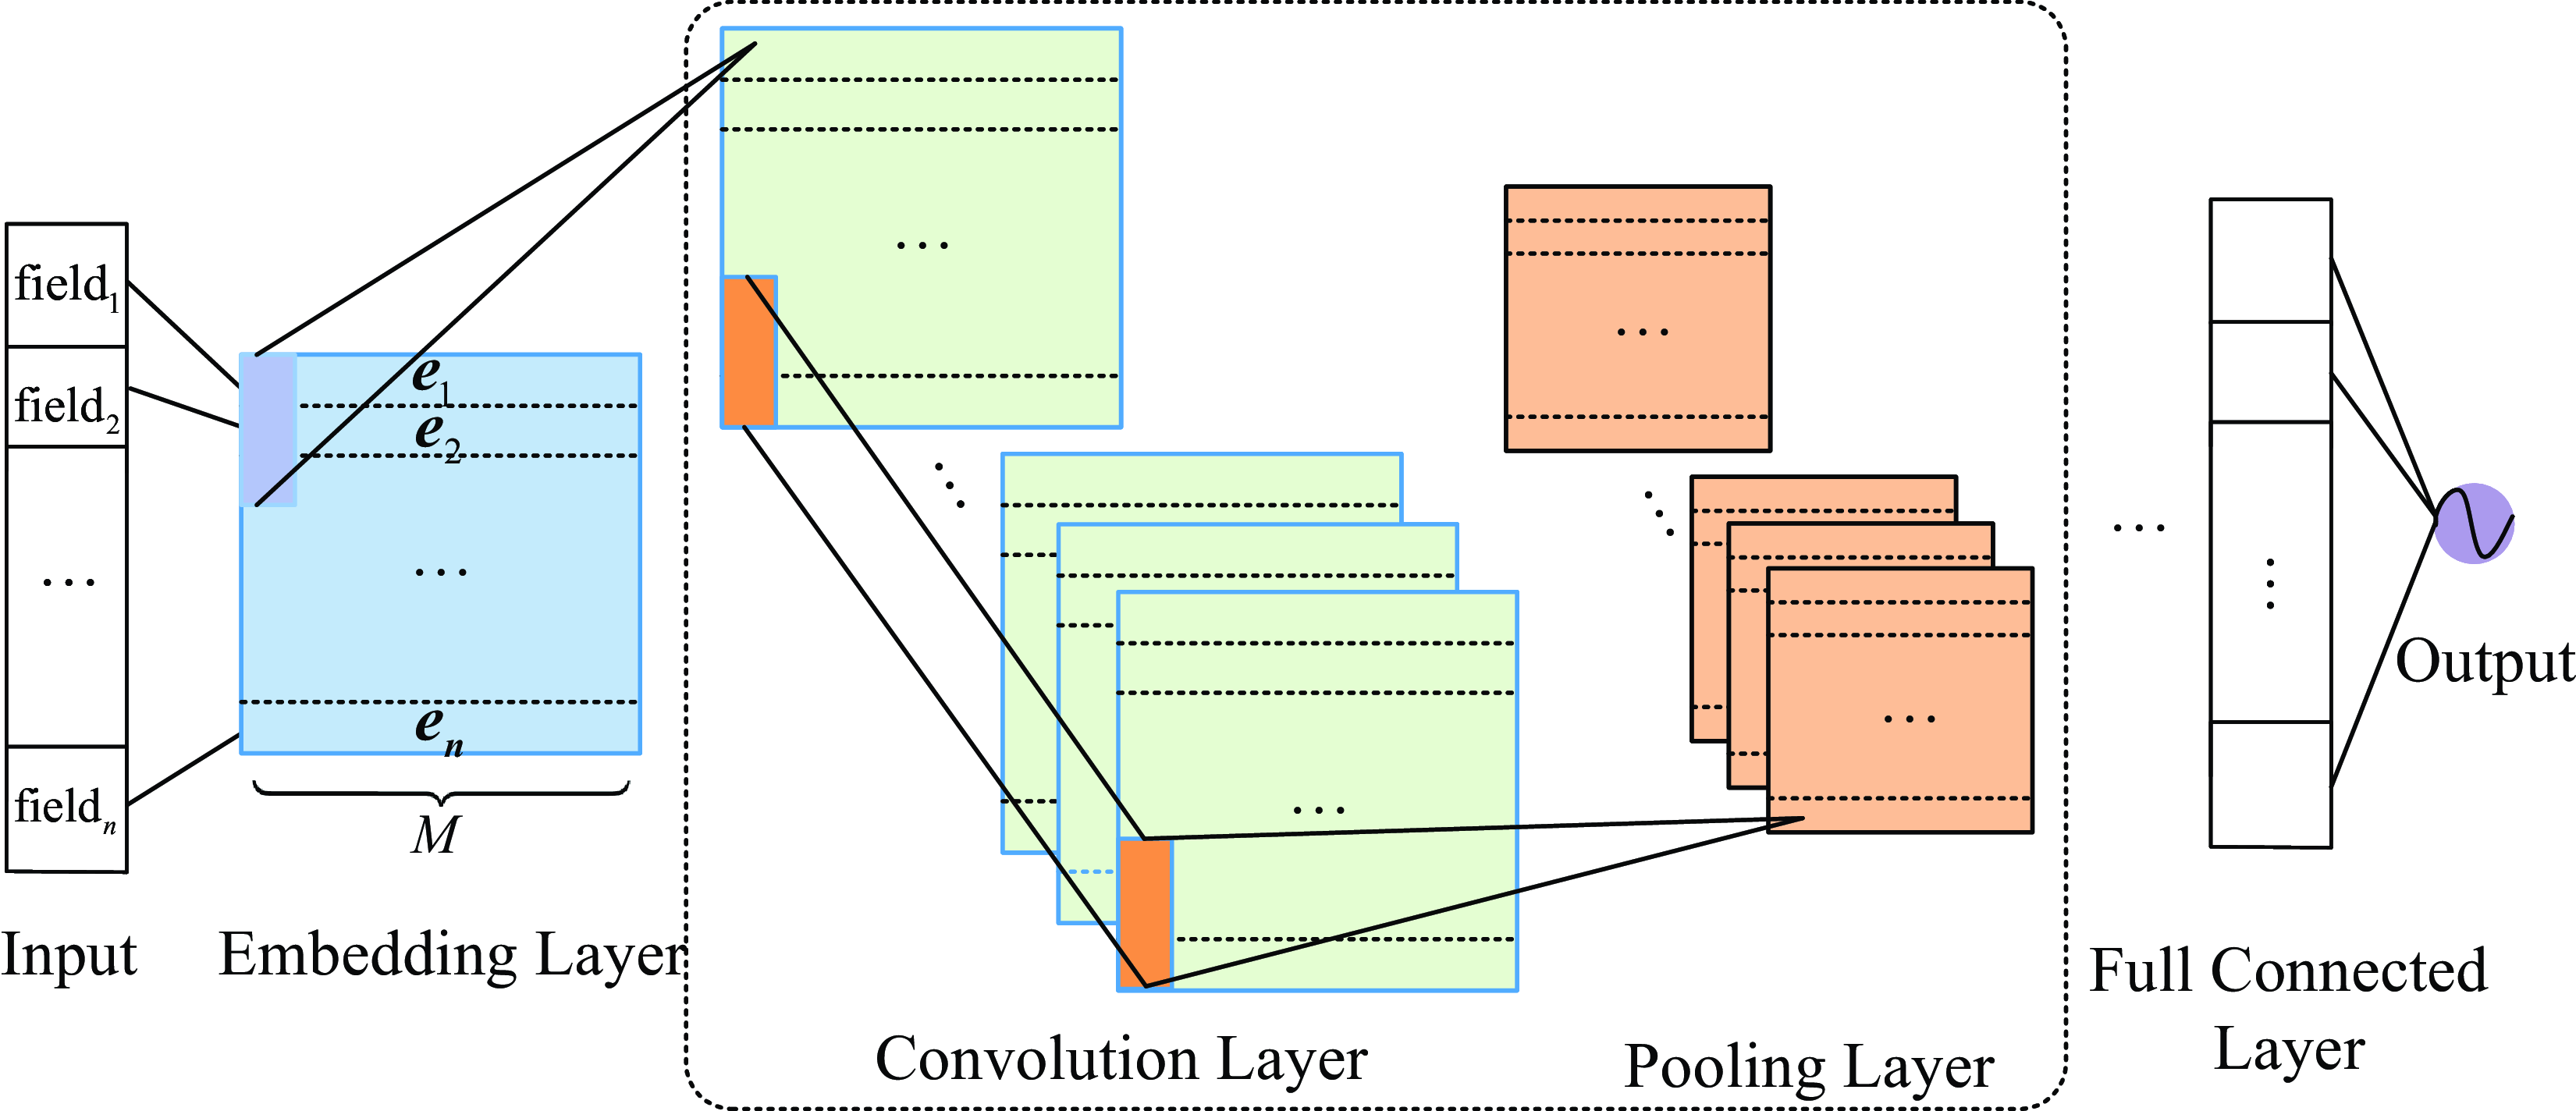
Figure 11. Basic architecture of applying CNN to CTR prediction
the feature field is mapped to a densely structured input space using an embedding layer, that is, the i-th feature field is mapped to
 $e_{i}$
, where
$e_{i}$
, where
 $e_{i}$
represents the i-th embedding feature vector of length t,
$e_{i}$
represents the i-th embedding feature vector of length t,
 $e = [e_{1},e_{2},\ldots,e_{n}]$
 $(i=1,2,\ldots,n)$
, n is the number of feature fields. The embedding feature vector is fed into the feature learning layer, including convolution and pooling. Finally, all learned latent features are processed by fully connected layers to predict CTR. Unlike applications in image or natural language processing where the samples have natural sequences, the embedding feature vectors for CTR prediction can be arranged in any order. However, the order in which the embedding feature vectors affects the local information learned by the CNN because the convolutional and pooling layers of the CNN capture information in the local receptive fields.
$(i=1,2,\ldots,n)$
, n is the number of feature fields. The embedding feature vector is fed into the feature learning layer, including convolution and pooling. Finally, all learned latent features are processed by fully connected layers to predict CTR. Unlike applications in image or natural language processing where the samples have natural sequences, the embedding feature vectors for CTR prediction can be arranged in any order. However, the order in which the embedding feature vectors affects the local information learned by the CNN because the convolutional and pooling layers of the CNN capture information in the local receptive fields.
The distribution of data predicted by CTR varies over time, Chan et al. (Reference Chan, Hu, Zhao, Yeung, Liu and Xiao2018) first investigated whether and how feature sequences affect the performance of CNN-based CTR prediction methods. To learn the information provided by different sequences, two multi-sequence models are proposed: multi-sequence model with single feature learning module (MSS) and multi-sequence model with multiple feature learning modules (MSM). In the MSS model, all feature maps of the MS layer are used as the input of the first convolutional layer:
 $c_{i}^{0} = [e_{s_{i1}},e_{s_{i2}},\ldots,e_{s_{im}}]$
, usually the i-th output of the l-th pair of convolutional pooling layers
$c_{i}^{0} = [e_{s_{i1}},e_{s_{i2}},\ldots,e_{s_{im}}]$
, usually the i-th output of the l-th pair of convolutional pooling layers
 $\mathbf{c}_{i}^{l}$
can be defined as Equation (19):
$\mathbf{c}_{i}^{l}$
can be defined as Equation (19):
 \begin{equation} \mathbf{c}_{i}^{l}=q\left(\sigma\left(\sum_{j=1}^{t_{l-1}} \operatorname{conv}\left(\mathbf{c}_{j}^{l-1}, \mathbf{w}_{i j}^{l}\right)+\mathbf{b}_{i j}^{l}\right)\right),\end{equation}
where
 $q(\!\cdot\!)$
and
$q(\!\cdot\!)$
and
 $\sigma(\!\cdot\!)$
are the pooling function and activation function,
$\sigma(\!\cdot\!)$
are the pooling function and activation function,
 $\mathbf{w}_{ij}$
represents the weight of the i-th filter of the j-th input,
$\mathbf{w}_{ij}$
represents the weight of the i-th filter of the j-th input,
 $\mathbf{b}$
is the bias term, and
$\mathbf{b}$
is the bias term, and
 $t_{l}$
is the number of feature maps of the i-th layer. In the MSM model, each feature map in the MS layer is independently learned by a feature learning module. The output of the first pair of convolutional pooling layers can be defined as (20):
$t_{l}$
is the number of feature maps of the i-th layer. In the MSM model, each feature map in the MS layer is independently learned by a feature learning module. The output of the first pair of convolutional pooling layers can be defined as (20):
 \begin{equation} \mathbf{u}_{i j}^{1}=q\left(\sigma\left(\operatorname{conv}\left(\mathbf{c}_{j}^{0}, \mathbf{w}_{i j}^{1}\right)+\mathbf{b}_{i j}^{1}\right)\right), j=1,2, \ldots, n,\end{equation}
where
 $\mathbf{c}_{j}^{0}$
represents the j-th feature map of the MS layer. The MSS model first combines the information provided by the multi-sequence embedding feature vectors and is learned by a feature learning module. The time complexity of this model is low, but the feature learning module cannot learn all the information efficiently. So the MSM model is proposed so that the feature vectors embedded in each sequence are learned separately by a feature learning module, and the learned representations are merged into the fully connected layers.
$\mathbf{c}_{j}^{0}$
represents the j-th feature map of the MS layer. The MSS model first combines the information provided by the multi-sequence embedding feature vectors and is learned by a feature learning module. The time complexity of this model is low, but the feature learning module cannot learn all the information efficiently. So the MSM model is proposed so that the feature vectors embedded in each sequence are learned separately by a feature learning module, and the learned representations are merged into the fully connected layers.
Chen et al. (Reference Chen, Sun, Li, Lu and Hua2016) proposed a DeepCTR model based on convolutional structure and multilayer perceptron structure to extract image advertisements as image features and other basic features. The image features are extracted by the convolution layer and further learned by the DNN, and then the two features are normalized and input into the multi-layer perceptron. The model achieves performance improvement by combining the two types of features for prediction. Convolutional neural networks have powerful functions in extracting image features, and can also extract text features, so as to better discover latent factors. Shen et al. (Reference Shen, Yi, Zhang, Shu and Liu2016) exploited convolutional neural networks to extract latent factors based on user review text data. Zhou et al. (Reference Zhou, Albatal and Gurrin2016) used convolutional neural networks to extract image advertisement features, and further considered users’ visual preferences in click-through rate prediction. Lei et al. (Reference Lei, Liu, Li, Zha and Li2016) based on the convolutional neural network to map the latent features of the image and the user’s preference features to the same latent space, discover the latent features of the image, and further generate prediction results. Literature (Gligorijevic et al., Reference Gligorijevic, Gligorijevic, Stojkovic, Bai, Goyal and Obradovic2019) is the first effective attempt to use click data to learn CTR and semantic embeddings at the same time. In Table 4, we summarize the main characteristics of the representative CNN-based ad click-through rate prediction model. Input sources, the dimension of conv-kernel, the pooling method, and the number of layers of convolution network are compared among various models.
Table 4. Summary of the representative CNN-based ad click-through rate prediction model. Specifically,
 $\boldsymbol{X}$
,
$\boldsymbol{X}$
,
 $\boldsymbol{X}_A$
,
$\boldsymbol{X}_A$
,
 $\boldsymbol{X}_Q$
,
$\boldsymbol{X}_Q$
,
 $\boldsymbol{X}_u$
, and
$\boldsymbol{X}_u$
, and
 $\boldsymbol{X}_{cont}$
represent the input feature vector containing multiple fields, the ad, the query, the user, and the context, respectively. In the Pooling column, p-max, MOR, and max & avg represent flexible p-max pooling, mean-overtime region pooling, and max and average pooling, respectively. Missing values in the table are represented by ‘-’
$\boldsymbol{X}_{cont}$
represent the input feature vector containing multiple fields, the ad, the query, the user, and the context, respectively. In the Pooling column, p-max, MOR, and max & avg represent flexible p-max pooling, mean-overtime region pooling, and max and average pooling, respectively. Missing values in the table are represented by ‘-’
The primary challenge in click-through rate prediction is effectively modeling feature interactions. Many researchers have proposed deep learning models to capture both low-order and high-order feature interactions from raw features. However, many of these meaningful features are sparse, and while manual feature engineering can improve model performance in real-world scenarios, it is often costly and requires extensive domain knowledge. Consequently, there is a need for methods that can automatically expand the feature space, reducing the reliance on manual intervention. Liu et al. (Reference Liu, Tang, Chen, Yu, Guo and Zhang2019) proposed a new feature generation model based on convolutional neural network (FGCNN), which consists of two parts: feature generation and deep classifier. Figure 12 is a general framework for automatic feature generation, the raw features are input into the machine learning model (model section in Figure 12) to identify and generate feature interactions between the raw features. The original features are then combined with the new generated features and fed into the deep neural network. In CNN, the design of weight sharing and pooling mechanism greatly reduces the number of parameters required to find important local patterns, and eases the optimization difficulty of the later MLP structure. Assuming that the output of the first convolutional layer is
 $ C^{1} \in R^{n_{f} \times k \times m_{c}^{1}} $
, the convolutional layer can be expressed as Equation (21):
$ C^{1} \in R^{n_{f} \times k \times m_{c}^{1}} $
, the convolutional layer can be expressed as Equation (21):
 \begin{equation} C_{p, q, i}^{1}=\tanh \left(\sum_{m=1}^{1} \sum_{j=1}^{h^{1}} E_{p+j-1, q, m}^{1} \mathbb{WC}_{j, 1,1, i}^{1}\right),\end{equation}
where
 $C_{p, q, i}^{1}$
represents the i-th feature map of the first convolutional layer, and p,q are the row and column indices of the i-th feature map. If only CNN is used, many useful global feature interactions will be lost. Therefore, a complementary approach of CNN and MIP is adopted to extract cross features that are difficult to get from DNN, and then the generated new features and old features are spliced together and input into any other classifier (FM, DNN, IPNN, DeepFM, etc.) to improve the effect.
$C_{p, q, i}^{1}$
represents the i-th feature map of the first convolutional layer, and p,q are the row and column indices of the i-th feature map. If only CNN is used, many useful global feature interactions will be lost. Therefore, a complementary approach of CNN and MIP is adopted to extract cross features that are difficult to get from DNN, and then the generated new features and old features are spliced together and input into any other classifier (FM, DNN, IPNN, DeepFM, etc.) to improve the effect.
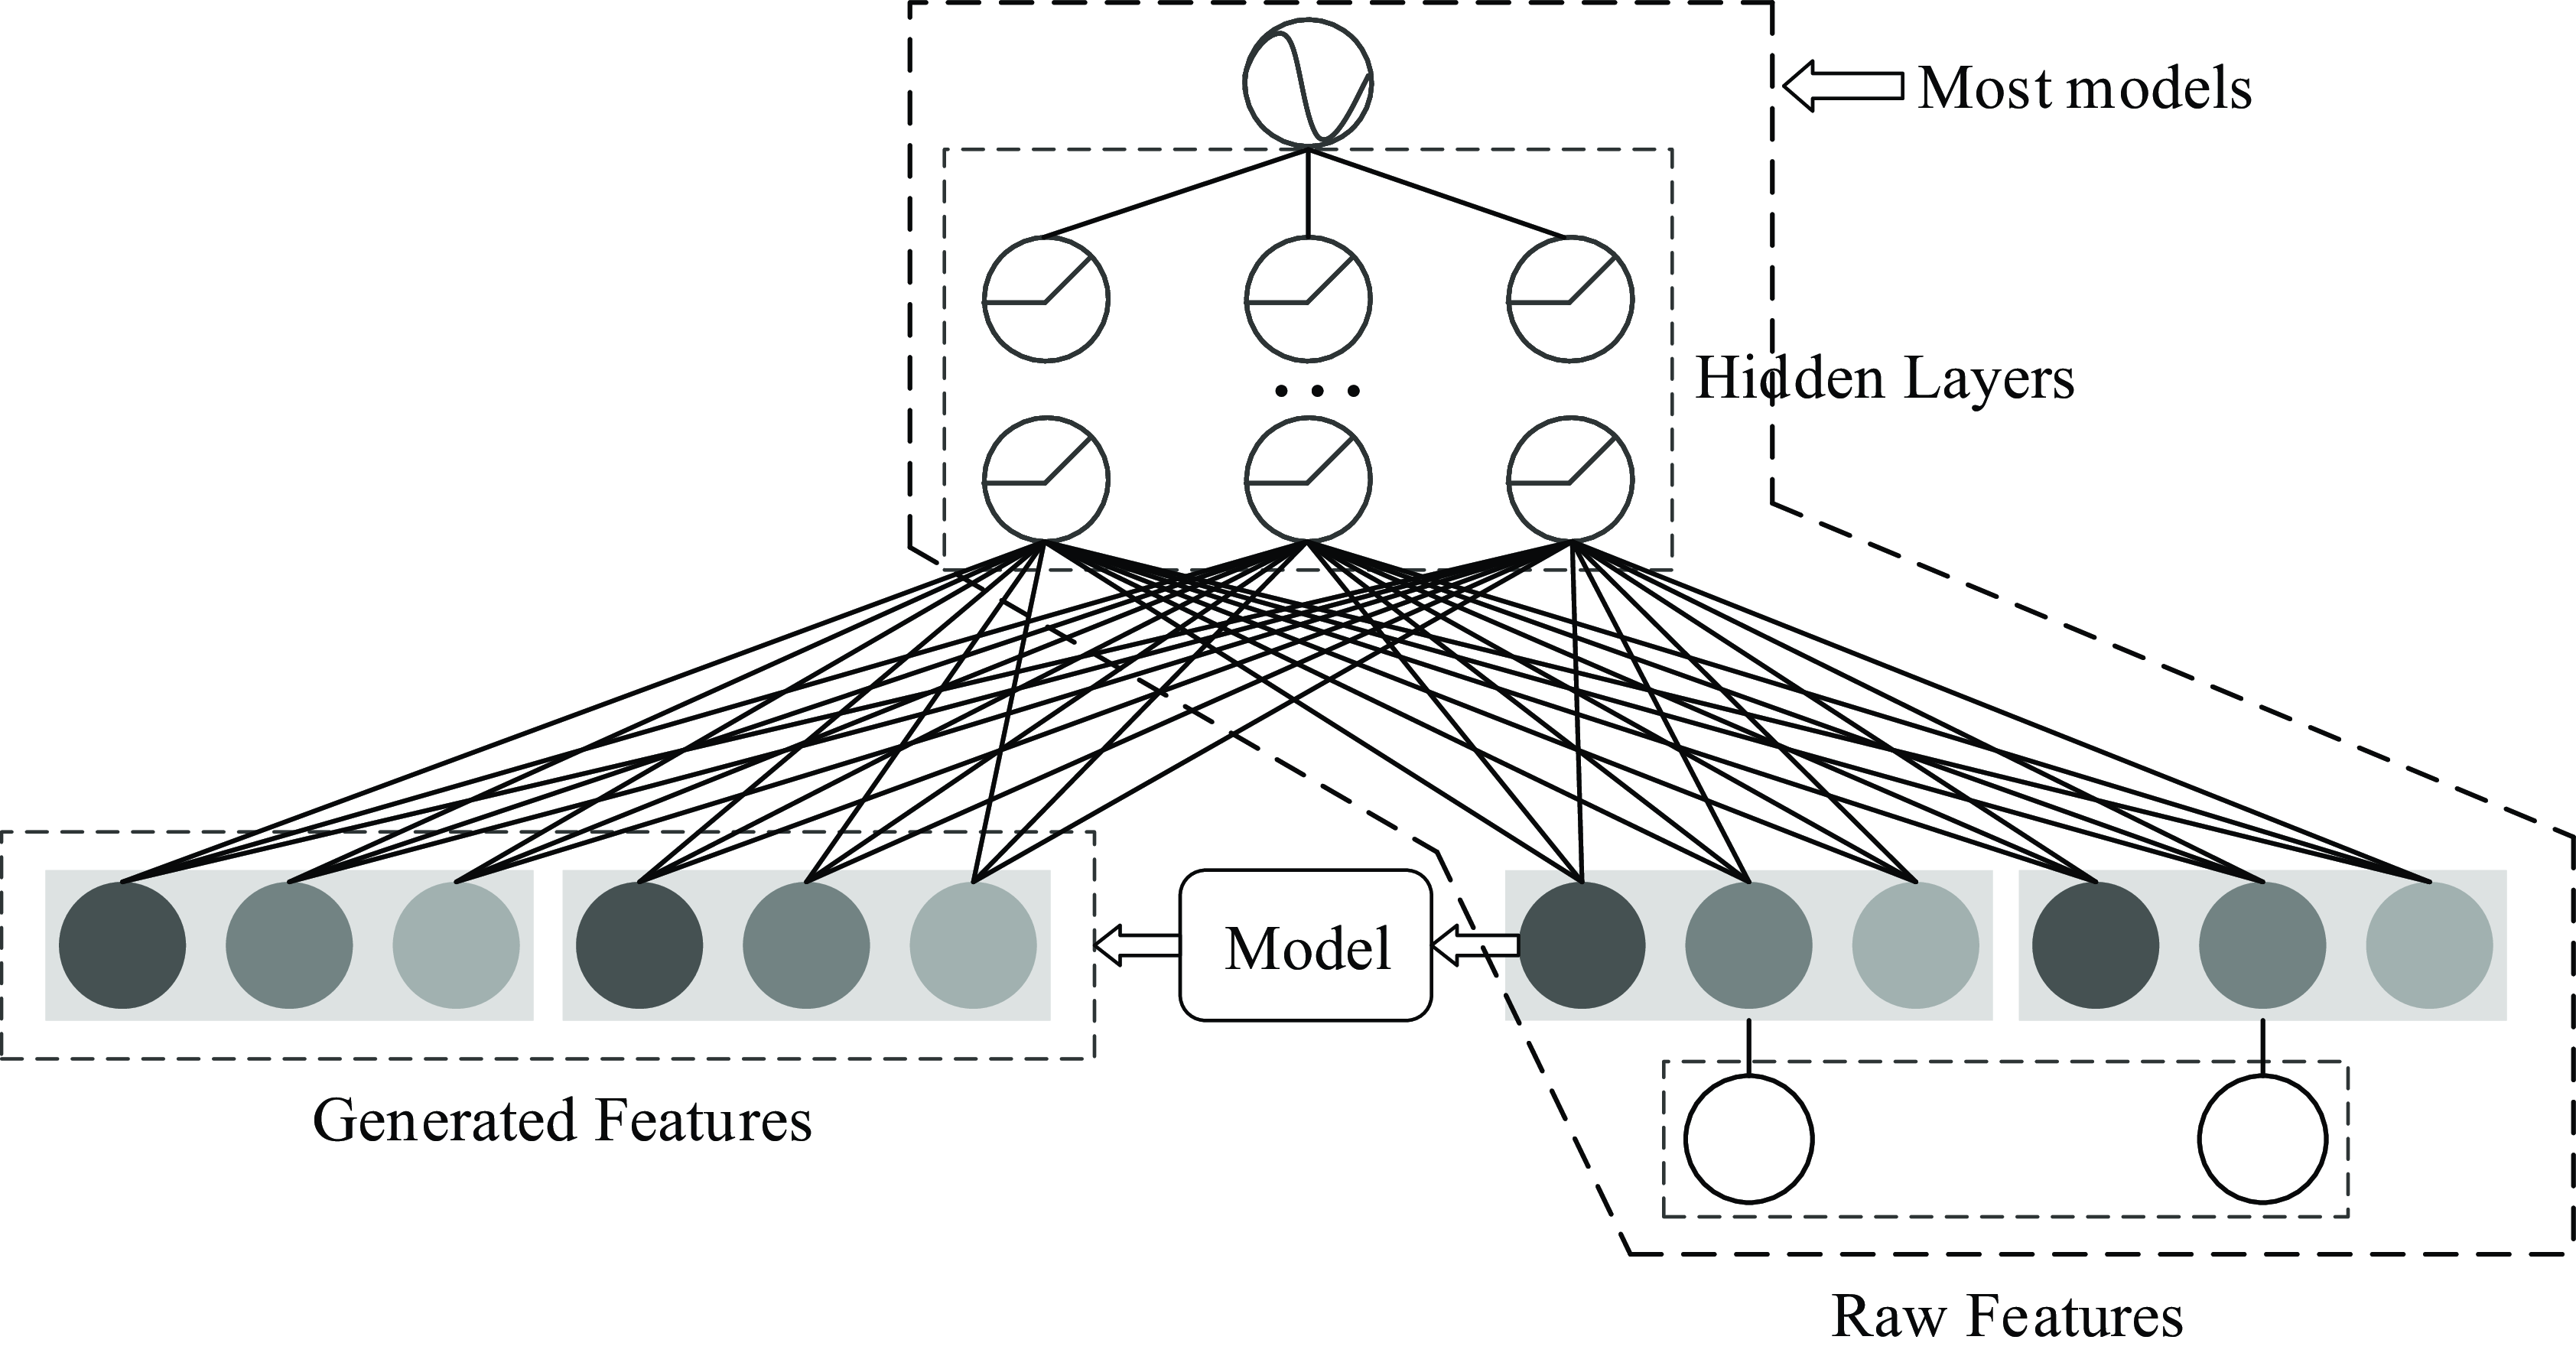
Figure 12. General framework of FGCNN model
Most existing studies only focus on user-level CTR prediction, and advertiser-level CTR prediction also plays an important role, because return on investment (ROI) is closely related to advertiser-level click-through rate forecasting. The CTR prediction of advertiser-level can be described as a time series prediction problem based on historical click through records. Literature (Zhu, Reference Zhu2021) proposes a CNN-LSTM convolution hybrid neural network algorithm to predict advertising click through rate. In the modeling process, effective features and combined features are extracted, and prediction and analysis are performed according to the LSTM neural network time series features. Gao et al. (Reference Gao, Kong, Lu, Bai and Yang2018) proposed a context-aware attention convolutional neural network (CACNN) to capture the highly nonlinear and local information of time series and the potential correlation between CTR time series and context information, so as to obtain more accurate prediction. Literature (Niu & Hou, Reference Niu and Hou2020) proposes a new input instance representation method based on density matrix, which can contain the interaction information of global second-order features. Then, combining the advantages of density matrix and convolutional neural network, a density matrix based convolutional neural network (DMCNN) is proposed, which can capture more feature interactions than other models. Literature (Edizel et al., Reference Edizel, Mantrach and Bai2017) proposes two new content-based click-through rate prediction model for sponsored search. Both models are based on convolutional neural network structure, which can significantly improve the accuracy and calibration of the model in production.
Attention mechanism is an important feature selection method, which can help CNN to highlight important parts in feature maps and suppress unimportant parts. Many previous works (such as CBAM Woo et al., Reference Woo, Park, Lee and Kweon2018 and GSoP Gao et al., Reference Gao, Xie, Wang and Li2019) have attempted to learn attention weights from feature maps, called self-attention. A large part of the advertisements of e-commerce application scenarios are displayed in the form of images, existing algorithms usually use CNN to extract visual features and fuse visual and non-visual features together to finally predict CTR. Liu et al. (Reference Liu, Lu, Yang, Zhao, Xu, Peng, Zhang, Niu, Zhu and Bao2020b) proposed a new visual embedding module category-specific CNN (CSCNN) for CTR prediction. The core idea is to perform category-specific channel and spatial self-attention to emphasize important and category-related features. CSCNN early combined category knowledge with a lightweight attention module on each convolutional layer. This enables CSCNN to extract expressive class-specific visual patterns that are beneficial for CTR prediction. Literature (Guo et al., Reference Guo, Zhang, He, Qin, Guo, Chen, Tang, He and Zhang2021c) proposes two multi-interest extractors based on CNN, which fully consider different interest representation, interest dependence and interest correlation.
4.3 CTR prediction model based on recurrent neural network
Personalization is a key factor in enhancing user experience for click-through rate prediction models. Personalized information is inherently embedded in a user’s past behavior. As a result, many models aim to learn a user’s current interests by incorporating their behavioral sequence into the modeling process. A user’s decision to click on an advertisement is often influenced by a series of prior behaviors, such as previous searches, content clicks, and the time spent on landing pages (Zhang et al., Reference Zhang, Dai, Xu, Feng, Wang, Bian, Wang and Liu2014). For instance, if a user clicks on an advertisement and quickly closes the landing page, the likelihood of them clicking on an advertisement in the future is significantly reduced. Conversely, if a user searches for flight booking keywords, the probability of them clicking on a flight booking advertisement is much higher. In comparison to shallow models and traditional deep learning approaches, recurrent neural networks (RNNs) are particularly effective in capturing the impact of a user’s browsing sequence on CTR prediction (Gan & Xiao, Reference Gan and Xiao2019). RNNs excel at identifying latent interests behind user behavior and can track the dynamic evolution of these interests over time.
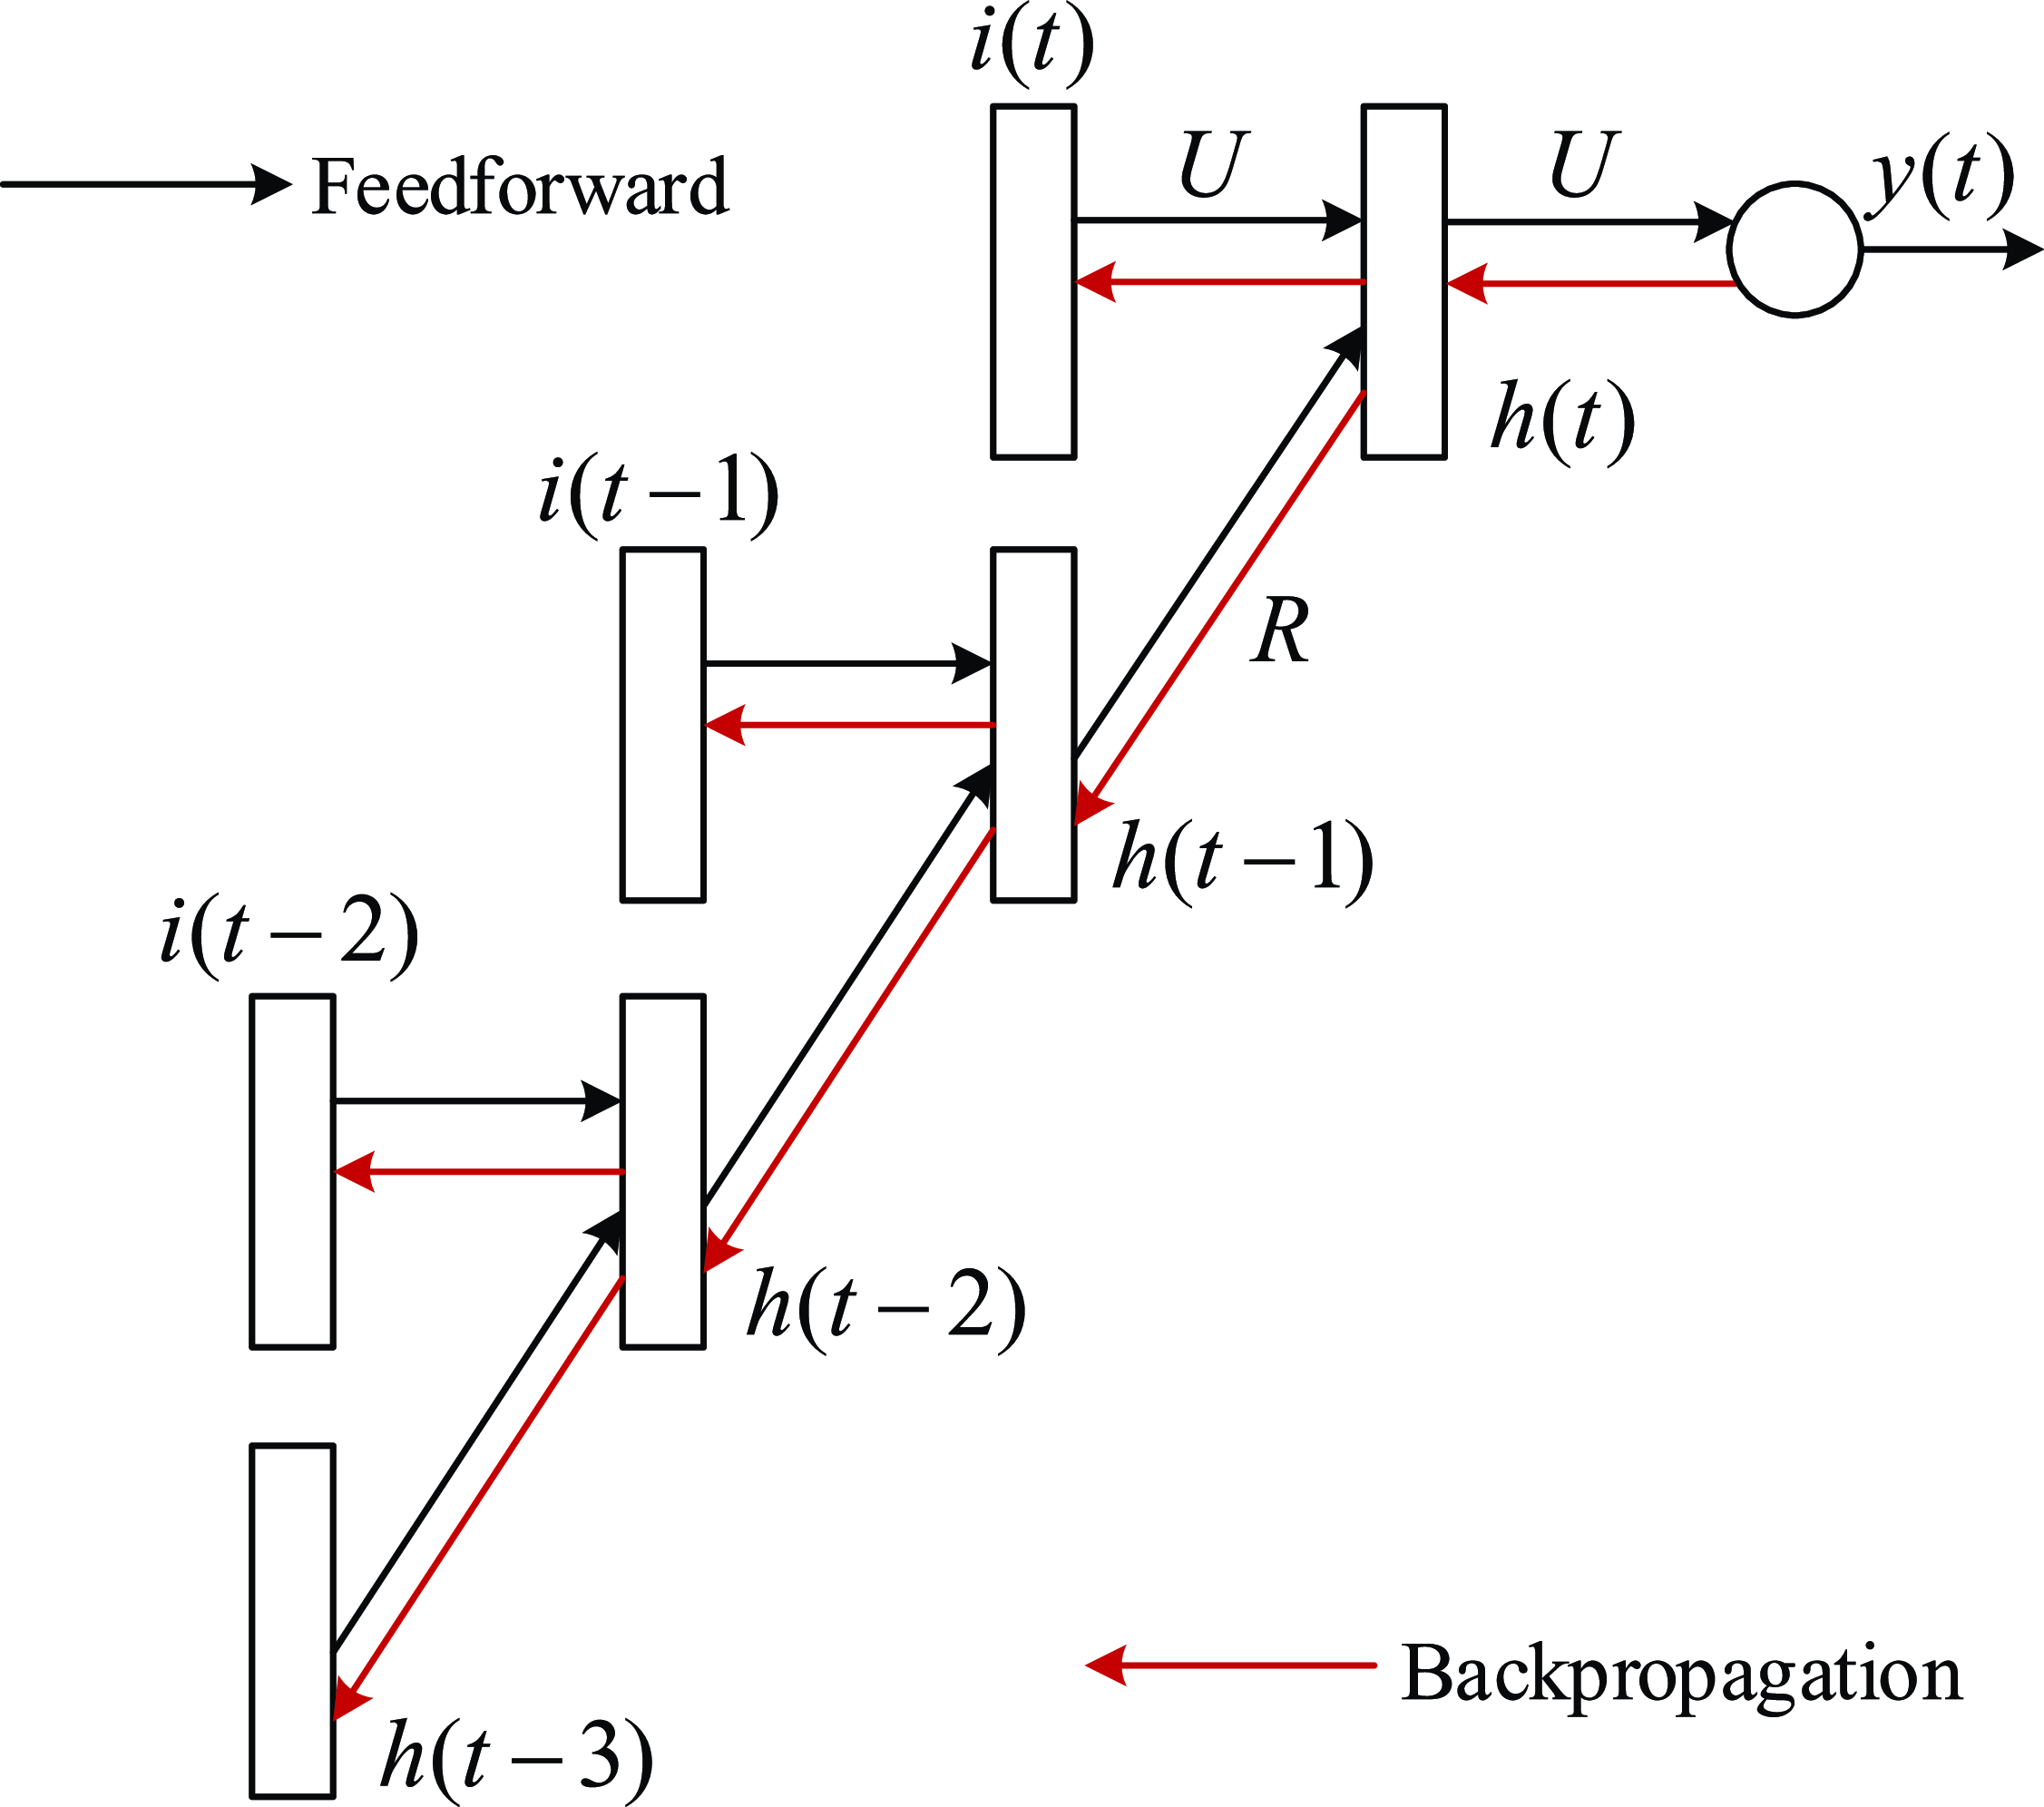
Figure 13. RNN training process with BPTT algorithm
The sequence of user behavior is ignored in most CTR prediction models. Zhang et al. (Reference Zhang, Dai, Xu, Feng, Wang, Bian, Wang and Liu2014) used a recurrent neural network to model sequential dependencies in predicting ad click probabilities. They treat each user’s ad viewing history as a sequence that generates internal dependencies. During the training of the RNN model, the features of each ad impression are fed into the hidden layers along with the previously accumulated hidden states, and order dependencies are incorporated to improve the accuracy of click predictions. The RNN training process of this model adopts the BPTT algorithm (De Jesus & Hagan, Reference De Jesus and Hagan2007), the expansion step is set to 3, and the structure is shown in Figure 13, the network consists of input layer i, output unit, hidden layer h and internal weight matrix. Here, we use
 $t\in \mathbf{N}$
to denote the timestamp and use
$t\in \mathbf{N}$
to denote the timestamp and use
 $\mathbf{h}(t)$
to denote the hidden state at time t. Specifically, the recurrent connection
$\mathbf{h}(t)$
to denote the hidden state at time t. Specifically, the recurrent connection
 $\mathbf{R}$
between
$\mathbf{R}$
between
 $\mathbf{h}(t-1)$
and
$\mathbf{h}(t-1)$
and
 $\mathbf{h}(t)$
can propagate sequential signals. The input layer consists of the vector
$\mathbf{h}(t)$
can propagate sequential signals. The input layer consists of the vector
 $\mathbf{i}(t)$
representing the current user behavior characteristics, and the vector
$\mathbf{i}(t)$
representing the current user behavior characteristics, and the vector
 $\mathbf{h}(t-1)$
represents the value in the hidden layer calculated from the previous step. The activation values of the hidden layer and output layer are calculated as Equations (22) and (23):
$\mathbf{h}(t-1)$
represents the value in the hidden layer calculated from the previous step. The activation values of the hidden layer and output layer are calculated as Equations (22) and (23):
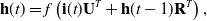 \begin{align} \mathbf{h}(t)&=f\left(\mathbf{i}(t) \mathbf{U}^{T}+\mathbf{h}(t-1) \mathbf{R}^{T}\right), \end{align}
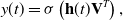 \begin{align} & y(t)=\sigma\left(\mathbf{h}(t) \mathbf{V}^{T}\right),\\[8pt]\nonumber \end{align}
where
 $f(\!\cdot\!)$
represents the tanh function for nonlinear activation, and
$f(\!\cdot\!)$
represents the tanh function for nonlinear activation, and
 $\sigma(\!\cdot\!)$
represents the sigmoid function.
$\sigma(\!\cdot\!)$
represents the sigmoid function.
 $\mathbf{i}(t)$
represents the features related to the user’s current behavior, and
$\mathbf{i}(t)$
represents the features related to the user’s current behavior, and
 $\mathbf{h}(t)$
represents the sequence information of the user’s previous behavior. The prediction results not only depend on the current input features but also on continuous historical information.
$\mathbf{h}(t)$
represents the sequence information of the user’s previous behavior. The prediction results not only depend on the current input features but also on continuous historical information.
Currently, user historical data are a time series, so the recurrent neural network can be used to learn user interests. Sequences of user historical behaviors may contain multiple concurrent interests, and the rapid jumps and abrupt ends of these interests cause the sequence data of user behaviors to be noisy. The deep interest evolution network (DIEN) (Zhou et al., Reference Zhou, Mou, Fan, Pi, Bian, Zhou, Zhu and Gai2019) proposed in 2019 is an evolution of the DIN (Zhou et al., Reference Zhou, Zhu, Song, Fan, Zhu, Ma, Yan, Jin, Li and Gai2018). Based on the DIN model, a recurrent neural network is introduced to capture sequence information. DIEN utilizes RNN with two layers of gated recurrent unit (GRU) to learn user interests. The first layer is the interest extractor layer, which learns the sequence dependencies between historical sequence behaviors by simulating the user’s interest migration process. A GRU training loss, an auxiliary loss, is introduced to supervise the training process of each intermediate hidden state of the GRU, as shown in Equation (24):
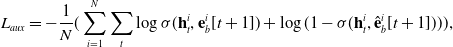 \begin{equation} L_{aux}=-\frac{1}{N}(\sum_{i=1}^{N}\sum_{t}\log\sigma(\mathbf{h}_{t}^{i},\mathbf{e}_{b}^{i}[t+1])+\log(1-\sigma(\mathbf{h}_{t}^{i},\hat{\mathbf{e}}_{b}^{i}[t+1]))),\end{equation}
where
 $ \sigma\left(\mathbf{x}_{1}, \mathbf{x}_{2}\right)=\frac{1}{1+\exp \left(-\left[\mathbf{x}_{1}, \mathbf{x}_{2}\right]\right)} $
is the sigmoid activation function,
$ \sigma\left(\mathbf{x}_{1}, \mathbf{x}_{2}\right)=\frac{1}{1+\exp \left(-\left[\mathbf{x}_{1}, \mathbf{x}_{2}\right]\right)} $
is the sigmoid activation function,
 $\mathbf{h}_{t}^{i}$
represents the t-th hidden state of the GRU of user i. Then the output of the first layer is used as the input of the attentional up-date gate (AUGRU) of the second layer (interest evolving layer) and combined with the attention network to simulate the user’s interest migration process related to the target advertisement. The attention network is used to control the update gate of AUGRU in the second layer to make it more targeted to simulate the interest evolution path related to the target advertisement. Finally, the last state in the second layer is input into the DNN as the user’s interest to predict the user’s CTR. In Table 5, we summarize the main characteristics of the representative RNN based ad click-through rate prediction model. Input sources, the type of RNN, the attention mechanism, and the auxiliary loss function are compared among various models.
$\mathbf{h}_{t}^{i}$
represents the t-th hidden state of the GRU of user i. Then the output of the first layer is used as the input of the attentional up-date gate (AUGRU) of the second layer (interest evolving layer) and combined with the attention network to simulate the user’s interest migration process related to the target advertisement. The attention network is used to control the update gate of AUGRU in the second layer to make it more targeted to simulate the interest evolution path related to the target advertisement. Finally, the last state in the second layer is input into the DNN as the user’s interest to predict the user’s CTR. In Table 5, we summarize the main characteristics of the representative RNN based ad click-through rate prediction model. Input sources, the type of RNN, the attention mechanism, and the auxiliary loss function are compared among various models.
Table 5. Summary of the representative RNN based ad click-through rate prediction model. Specifically,
 $\boldsymbol{X}$
,
$\boldsymbol{X}$
,
 $\boldsymbol{X}_u$
,
$\boldsymbol{X}_u$
,
 $\boldsymbol{X}_b$
,
$\boldsymbol{X}_b$
,
 $\boldsymbol{X}_t$
, and
$\boldsymbol{X}_t$
, and
 $\boldsymbol{X}_{cont}$
represent the input feature vector containing multiple fields, the user features, the user behavior features, the target ad features, and the context features, respectively. Att, Multi-Att, and M-Self-Att in the Attention indicate that attention, multi-head attention, and multi-head self-attention, respectively. Missing values in the table are represented by ‘-’
$\boldsymbol{X}_{cont}$
represent the input feature vector containing multiple fields, the user features, the user behavior features, the target ad features, and the context features, respectively. Att, Multi-Att, and M-Self-Att in the Attention indicate that attention, multi-head attention, and multi-head self-attention, respectively. Missing values in the table are represented by ‘-’
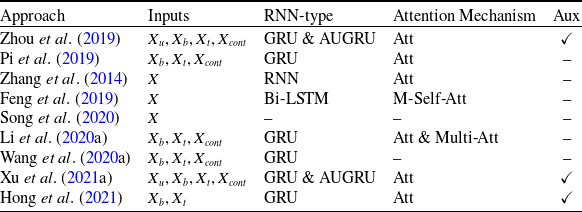
Transformer is a feature extractor based on attention mechanism. The transformer architecture includes two parts: encoder and decoder, which can extract the features of sequences instead of CNN and RNN. Transformer has the following advantages over the recurrent neural network: (1) Long distance dependencies in sequences can be captured directly. (2) The model has high parallelism, which greatly reduces the training time. Most works ignore the inherent structure of user behavior sequences, user behavior sequences are composed of multiple sessions (Hidasi et al., Reference Hidasi, Karatzoglou, Baltrunas and Tikk2015), and the sessions are distinguished by the user’s click time. A user has a definite and separate need to purchase items within the same session, but his interests will change once a new session is opened. Based on this observation, Feng et al. (Reference Feng, Lv, Shen, Wang, Sun, Zhu and Yang2019) proposed the deep session interest network (DSIN) that utilizes multiple historical sessions of users to simulate user sequence behavior in CTR prediction tasks. The key part of the DSIN is to model the user behavior sequence, which is divided into four layers from bottom to top: (1) session division layer: divide the user’s behavior sequence into multiple sessions according to the click time; (2) session interest extraction layer: for each session, the multi-head self-attention mechanism in transformer is used to extract the interest features of the user session and capture the internal relationship between actions; (3) session interest interacting layer: adopts Bi-LSTM (Huang et al., Reference Huang, Xu and Yu2015) captures the interaction and evolution of users’ interests across multiple historical sessions; and (4) session interest activating layer: applies a local activation unit to the user’s session interest about the item. Finally, the output of the session interest activating layer, along with the user portrait embedding and the item portrait embedding, is input into the fully connected layer for final prediction.
The aforementioned studies demonstrate that researchers have long acknowledged the importance of extracting user interests in CTR prediction tasks. Many of these studies treat interactions between users and items as sequential data and apply recurrent neural networks (RNNs) to effectively capture and model user interests. However, these solutions cannot handle relatively long sequence lengths due to the vanishing gradient problem (Hochreiter, Reference Hochreiter1998) of RNNs. Therefore, Xu et al. (Reference Xu, Yu, Guo and Cui2021a) proposed a new core interest network (CIN) to alleviate the long sequence problem of the CTR prediction task for sequence data. The main idea of the model is to extract users’ core interests first and the refined data is then used as input for the following learning tasks. The model divides a long sequence into multiple subsequences and extracts the user’s core interest in each subsequence and also uses the auxiliary loss shown in Equation (24) to supervise the training process of each intermediate hidden state of the GRU. The core interests extracted from each subsequence are passed to the next subsequence and finally the learning of user interests in the whole long sequence is completed. Li et al. (Reference Li, Wang, Tong, Tan, Zeng and Zhuang2020a) proposed the deep time-aware item evolution network (TIEN), the mentioned time-aware item behavior extends traditional user behavior, and helps indicates user interest drift and item popularity over time. Reference (Hong et al., Reference Hong, Xiong, You, Wu and Xia2021) proposes a recommendation model that is closer to real recommender scenarios by jointly learning the current and comprehensive interests of users.
Simple recurrent neural networks (RNNs) often struggle to learn from long sequence data. To address this, attention mechanisms can be introduced to enhance the model’s expressive power by compressing relevant information from sequential data into fixed-length vectors. However, the computational cost of attention mechanisms grows with the length of the action sequence. Moreover, the hidden state in an RNN does not retain all information from the past sequence; instead, it tends to focus more on the prediction target, potentially overlooking important historical context. Drawing on the idea of neural turing machine (NTM) (Graves et al., Reference Graves, Wayne and Danihelka2014), Pi et al. (Reference Pi, Bian, Zhou, Zhu and Gai2019) proposed the multichannel user interest memory network (MIMN) to deal with long sequences of user behaviors in CTR prediction. MIMN designs an independent user interest center (UIC) module, which separates the bulk user interest computation from the entire CTR prediction process. UIC stores MIMN’s external storage information, updates it for each user’s behavior, and UIC gradually captures the user’s interest from the user’s behavior sequence. The core idea of the model is to adopt two designs: (1) Increase a memory utilization regularization to improve the expressiveness of memory tensors in UIC by improving memory utilization. (2) Use a memory induction unit to help capture higher-order information. Reference (Song et al., Reference Song, Cheng, Zhou, Yang, Tian and Hu2020) conducted a preliminary study of automatically designing the architecture for the CTR prediction task.
4.4 CTR prediction model based on graph neural network
In recent years, graph neural networks (GNNs) (Scarselli et al., Reference Scarselli, Gori, Tsoi, Hagenbuchner and Monfardini2008) have gained widespread adoption as a deep learning-based approach for processing graph-structured data, owing to their powerful ability to model complex relationships within graph structures. In 2019, Li et al. (Reference Li, Cui, Wu, Zhang and Wang2019b) pioneered the use of GNNs for modeling intricate interactions between features and proposed the feature interaction graph neural network (Fi-GNN) for CTR prediction. The basic idea is to use a graph structure called feature graph to represent multi-field features. The feature is used as a node of the graph, there is an edge between two nodes, and the weight on the edge represents the importance of feature interaction, so as to transform the complex interaction between features into the interaction between the nodes of the feature graph. In the embedding layer, the model uses a multi-head self-attention network layer to obtain a new field embedding, which contains the high-level feature interaction between the field and other feature fields, and the output feature map is used as the input of the Fi-GNN. The Fi-GNN consists of multiple steps, and each step updates the nodes. The information of neighbor nodes is aggregated using an attention network, and then a GRU unit is used to make state updates for the nodes. In Fi-GNN, each node updates its own state in a cyclic manner by exchanging state information with neighbor nodes, so the number of steps updated on the graph network is equivalent to the order of feature interaction. According to the powerful representation ability of the graph, the model not only can flexibly and explicitly model complex feature interactions but also provides more understandable model interpretation for CTR prediction.
The accuracy of CTR prediction in sponsored search has a key impact on improving business revenue and user experience. Li et al. (Reference Li, Chen, Wang, Ren, Zhang and Zhu2019a) proposed a graph intention network (GIN) based on co-occurrence commodity graph to mine user intentions. In previous models, user intentions were mostly extracted based on their historical click behaviors, there will be problems such as user behavior sparsity, weak generalization, and so on. First, the GIN method enriches user behaviors through the multilayer graph diffusion of historical behaviors and solves the problem of sparse user behaviors; Second, by introducing commodity co-occurrence relationships, it explores users’ potential preferences and alleviates the weak generalization problem. The construction of the co-occurring commodity graph based on historical behavior is shown in Figure 14, each row in Figure 14(a) represents a user’s click sequence, when the window size is 1, the black arrows represent the behavior direction, and the red arrows represent the edges of the graph. In the undirected co-occurrence commodity graph of Figure 14(b), the nodes represent the clicked commodities, and the edge weights represent the number of co-occurrence clicks. By performing multilayer neighborhood diffusion on the graph for each item in the user click sequence, then an attention mechanism is applied to aggregate the tree-like intents. Finally, through end-to-end joint training, the intent mining method based on co-occurrence commodity graph is combined with the CTR prediction task. In Table 6, we summarize the main characteristics of the representative GNN based ad click-through rate prediction model. Input sources, graph info and the attention mechanism are compared among various models.
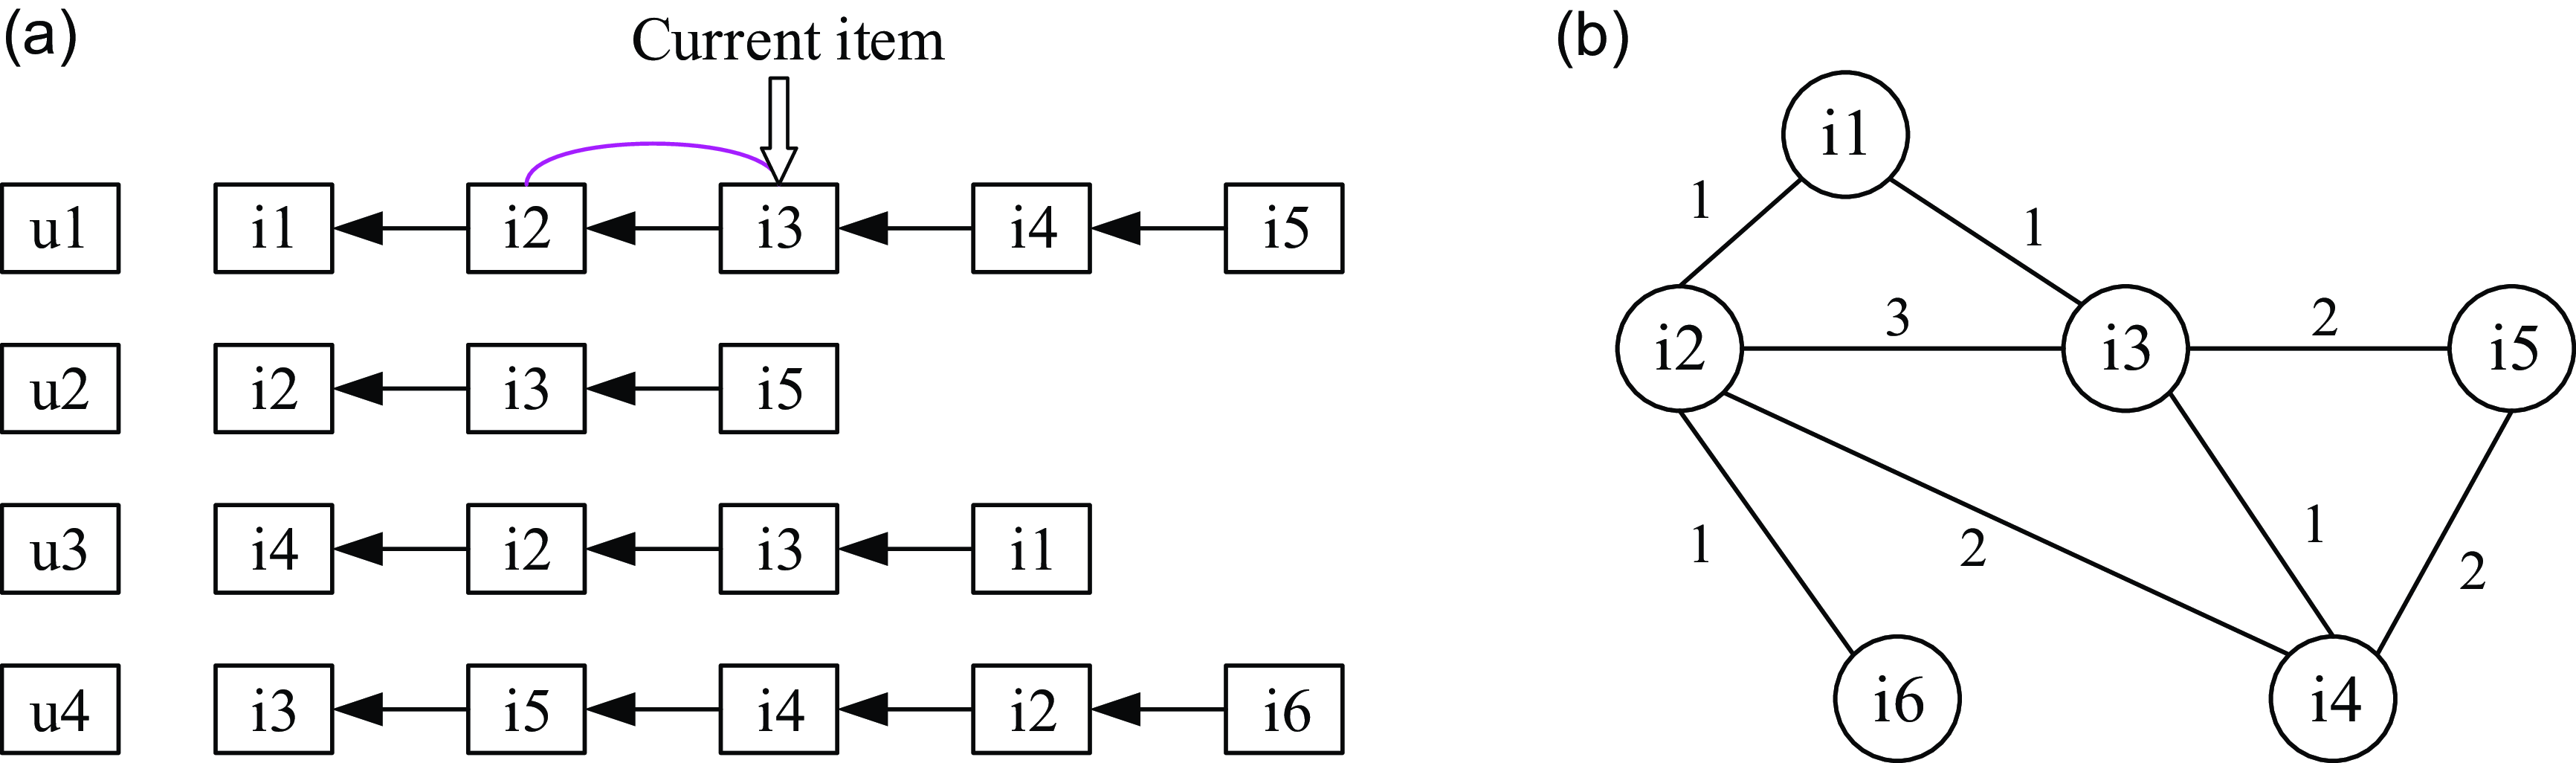
Figure 14. Structure of co-occurrence commodity graph
Table 6. Summary of the representative GNN based ad click-through rate prediction model. Specifically,
 $\boldsymbol{X}$
,
$\boldsymbol{X}$
,
 $\boldsymbol{X}_u$
,
$\boldsymbol{X}_u$
,
 $\boldsymbol{X}_b$
,
$\boldsymbol{X}_b$
,
 $\boldsymbol{X}_t$
and
$\boldsymbol{X}_t$
and
 $\boldsymbol{X}_{cont}$
represent the input feature vector containing multiple fields, the user features, the user behavior features, the target ad features and the context features, respectively. Att and M-Self-Att in the Attention Mechanism indicates that attention and multihead self-attention, respectively. Missing values in the table are represented by ‘-’
$\boldsymbol{X}_{cont}$
represent the input feature vector containing multiple fields, the user features, the user behavior features, the target ad features and the context features, respectively. Att and M-Self-Att in the Attention Mechanism indicates that attention and multihead self-attention, respectively. Missing values in the table are represented by ‘-’
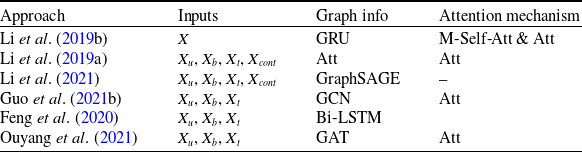
Feature interaction is critical for achieving high-accuracy recommendations in recommender systems. Graphs provide a more effective data structure for addressing combinatorial problems, making them particularly well-suited for modeling complex interactions between features. In order to make full use of feature interaction, Su et al. (Reference Su, Zhang, Erfani and Xu2021) proposed a recommendation model based on graph neural network—
 $L_{0}$
-SIGN, which detects beneficial feature interaction through graph neural network and
$L_{0}$
-SIGN, which detects beneficial feature interaction through graph neural network and
 $L_{0}$
regularization, and only uses beneficial feature interaction for recommendation.
$L_{0}$
regularization, and only uses beneficial feature interaction for recommendation.
 $L_{0}$
-SIGN also constructs a feature graph, where each data sample is treated as a graph, features are nodes, feature interactions are edges, and the weight of edge represent the importance of feature interactions. This is the first time that the problem of detecting beneficial feature interactions in recommender system is proposed and elaborated, and an edge prediction model with
$L_{0}$
-SIGN also constructs a feature graph, where each data sample is treated as a graph, features are nodes, feature interactions are edges, and the weight of edge represent the importance of feature interactions. This is the first time that the problem of detecting beneficial feature interactions in recommender system is proposed and elaborated, and an edge prediction model with
 $L_{0}$
activation regularization is also proposed to automatically detect those beneficial feature interactions in recommendation accuracy, thereby filtering out feature interactions that bring noise. Specifically, the model consists of two components: one component is the
$L_{0}$
activation regularization is also proposed to automatically detect those beneficial feature interactions in recommendation accuracy, thereby filtering out feature interactions that bring noise. Specifically, the model consists of two components: one component is the
 $L_{0}$
edge prediction model, which detects the most beneficial feature interactions by predicting the presence of edges between nodes. Another component is the graph classification model, called the statistical interaction graph neural network (SIGN). SIGN takes nodes (features) and detected edges (beneficial feature interactions) as input graphs, and outputs predictions by efficiently modeling and aggregating pairs of nodes connected by edges. The general form of the SIGN prediction function is
$L_{0}$
edge prediction model, which detects the most beneficial feature interactions by predicting the presence of edges between nodes. Another component is the graph classification model, called the statistical interaction graph neural network (SIGN). SIGN takes nodes (features) and detected edges (beneficial feature interactions) as input graphs, and outputs predictions by efficiently modeling and aggregating pairs of nodes connected by edges. The general form of the SIGN prediction function is
 \begin{equation} y=f_{S}\left(G_{n}\left(X_{n}, E_{n}^{\prime}\right)\! ;\, \boldsymbol{\theta}\right),\end{equation}
where
 $\theta$
is the parameter of SIGN, and y is the graph classification result. So the
$\theta$
is the parameter of SIGN, and y is the graph classification result. So the
 $L_{0}$
-SIGN prediction function
$L_{0}$
-SIGN prediction function
 $f_{LS}$
is:
$f_{LS}$
is:
 \begin{equation} f_{L S}\left(G_{n}\left(X_{n}, \emptyset\right) \! ;\, \boldsymbol{\theta}, \boldsymbol{\omega}\right)=f_{S}\left(G_{n}\left(X_{n}, F_{e p}\left(X_{n} ;\, \boldsymbol{\omega}\right)\right) \! ;\, \boldsymbol{\theta}\right).\end{equation}
Different from the end-to-end modeling of Fi-GNN, the PCF-GNN proposed by Li et al. (Reference Li, Yan, Long, Wang, Lin, Xu and Zheng2021) is a two-stage model. The first stage is the pre-training of GNN: build a GNN based on feature co-occurrence relationship, nodes represent each feature, and edge weights are feature co-occurrence degrees. During pre-training, the multi-head attention mechanism is not used to learn the initial representation of nodes like Fi-GNN, but the interaction relationship with the output feature is explicitly predicted, and the prediction can also be generalized for new interactions that have not appeared before. The second stage is the downstream application: GNN can use fixed parameters as interactive feature extractor, the value of the interaction feature is first inferred in the application stage, and then spliced together with the remaining features as the input of the subsequent DNN. Or a pre-training paradigm can be used to fine-tune the GNN during the downstream CTR model training process to update the representation of each feature.
Modeling user behavior sequences has attracted a lot of attention, and many existing methods ignore the underlying reasons that drive users to click on target items. Feng et al. (Reference Feng, Lv, Hu, Sun, Kuang, Liu, Liu and Ou2020) proposed a novel Multiplex Target-Behavior Relation enhanced Network (MTBRN) framework to enhance CTR prediction using multiple relationships between user behavior and target items. Multiple relationships contain semantics that enable better understanding of user interests from different perspectives. MTBRN combines various graphs such as knowledge graph (Wang et al., Reference Wang, Zhang, Feng and Chen2014) and item-item similarity graph to build multiple relational paths between user behaviors and target items. Chu et al. (Reference Chu, Chang, Jia, Zhou and Yang2021) put forward Dynamic Sequential Graph Learning (DSGL) method, which enhances the representation of users or items by using the collaboration information in local sub-graphs associated with users or items. In traditional methods, item attributes are regarded as ID features, thus ignoring the dependency between structural information and attributes. In addition, when mining user interests from user product interactions, the current model ignores user intentions and product intentions with different attributes. Zheng et al. (Reference Zheng, Zhang, Gao and Chen2022) proposed hierarchical intention embedding network (HIEN), which considers attribute dependency based on bottom-up tree aggregation in the constructed attribute graph. The hierarchical attention mechanism captures both user and product intentions across different attributes. It represents the relationship between attributes and products (users) using graph and tree structures, exploring attribute dependencies through aggregation methods. Additionally, the attention mechanism integrates with the hierarchy to uncover user and product intentions based on varying attributes.
In recent years, two prevalent techniques for CTR prediction are feature interaction modeling and user interest mining. However, these approaches encounter key challenges: (1) Feature sparsity arises as many features occur infrequently, and feature interaction models rely heavily on feature co-occurrence and (2) user interest mining requires extensive behavioral data to capture diverse interests, but many users have short behavior sequences, leading to sparse behavior data. To address these issues, Guo et al. (Reference Guo, Su, Tan, Guo, Zhang, Liu, Tang and He2021b) proposed the dual graph enhanced embedding module compatible with various CTR prediction models to alleviate these two issues. And further propose dual graph enhanced embedding neural network (DG-ENN) for CTR prediction. A user (item) attribute graph and a collaborative graph are proposed in DG-ENN to alleviate the feature sparsity and behavior sparsity problems. To efficiently learn these graphs, the embeddings are optimized through two well-designed learning strategies: divide-and-conquer and curriculum-learning-inspired organized learning. Literature (Wang et al., Reference Wang, Luo, Ding, Wang and Deng2021) puts forward the dependency-aware multi-interest network (Deminet), which explicitly models multiple user interests in CTR prediction task. In order to reduce the noise signal in the behavior sequence, we carry out multi-dependency-aware heterogeneous attention and self-supervised interest learning.
5. Discussions
5.1 Comparison of advantages and disadvantages of algorithms
Different ad click-through rate prediction algorithms exhibit unique advantages and challenges. Table 7 offers a comprehensive summary of the advantages and disadvantages of CTR prediction algorithms based on shallow interactive model, DNN, CNN, RNN, and GNN.
Table 7. Advantages and disadvantages of CTR prediction algorithms based on shallow interactive model, DNN, CNN, RNN, and GNN
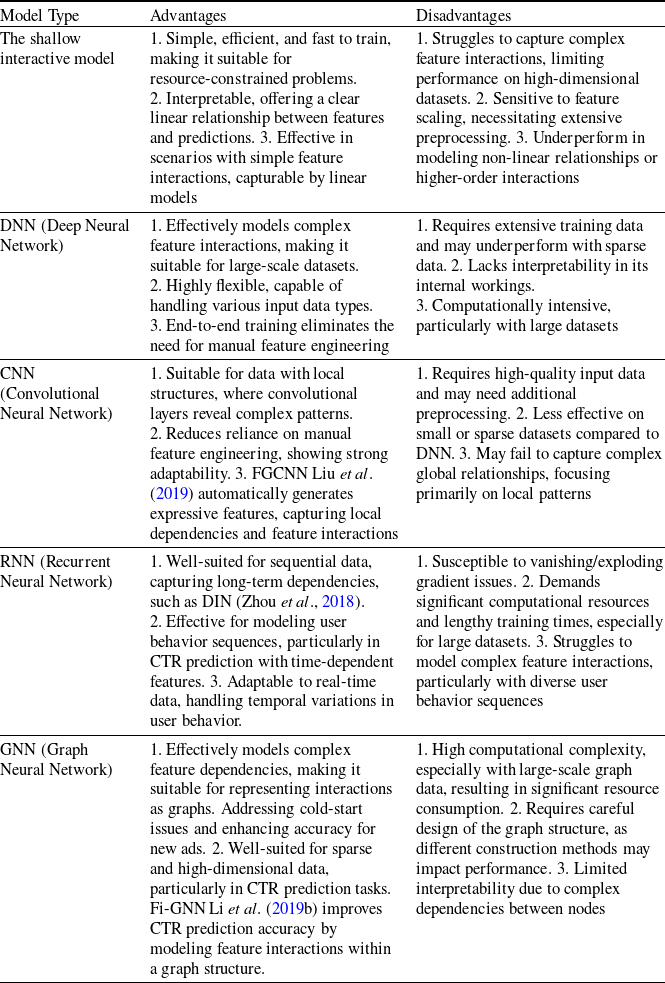
This comparative overview offers valuable insights into the strengths and weaknesses of these models, guiding researchers in selecting the most appropriate approach for CTR prediction tasks.
5.2 Datasets
In the existing literature, ad click-through rate prediction models are often evaluated using various datasets. Table 8 summarizes the datasets used in several studies. It is evident that Criteo, Avazu, and Amazon are the most commonly used public datasets. Proprietary datasets, on the other hand, are sourced from advertising platforms such as Alibaba Cloud, as well as social media platforms (e.g., Tencent, Facebook) and e-commerce sites (e.g., Alibaba, Taobao). Public datasets tend to be more widely used than proprietary ones, likely due to their greater accessibility.
Table 8. The summary of datasets for advertising click-through rate prediction model
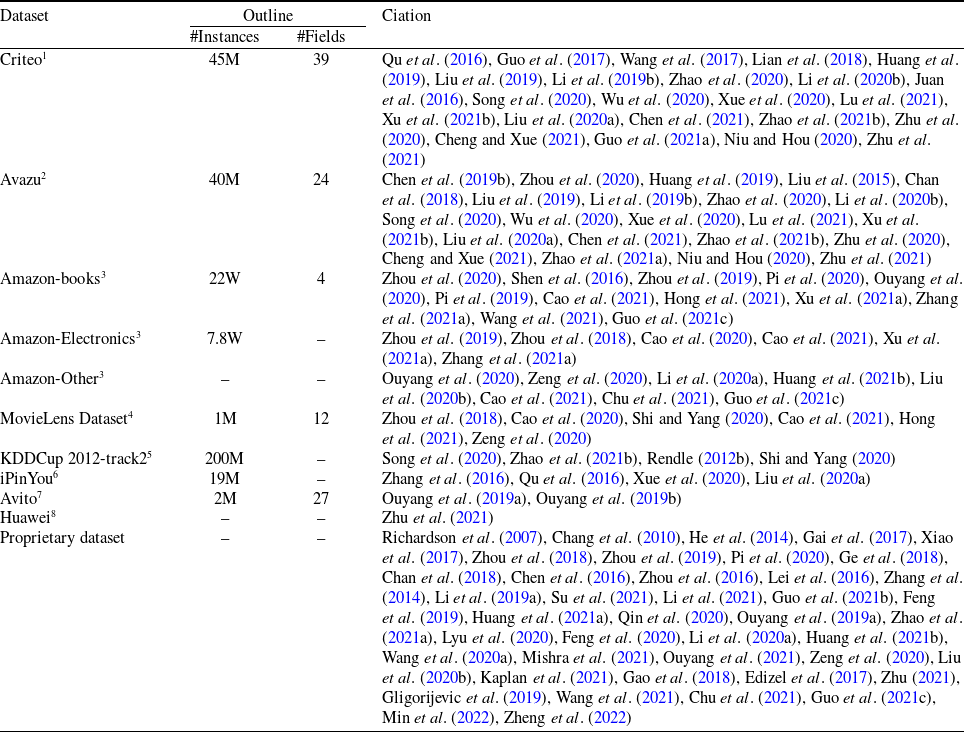
1 https://www.kaggle.com/c/criteo-display-ad-challenge.
2 https://www.kaggle.com/c/avazu-ctr-prediction/dat.
3 http://jmcauley.ucsd.edu/data/amazon/.
4 https://grouplens.org/datasets/movielens/20m/.
5 https://www.kaggle.com/c/kddcup2012-track2.
6 http://contest.ipinyou.com/.
7 https://www.kaggle.com/c/avito-context-ad-clicks/data.
8 https://www.kaggle.com/louischen7/2020-digix-advertisement-ctr-prediction.
Table 9. Evaluation metrics for CTR prediction model
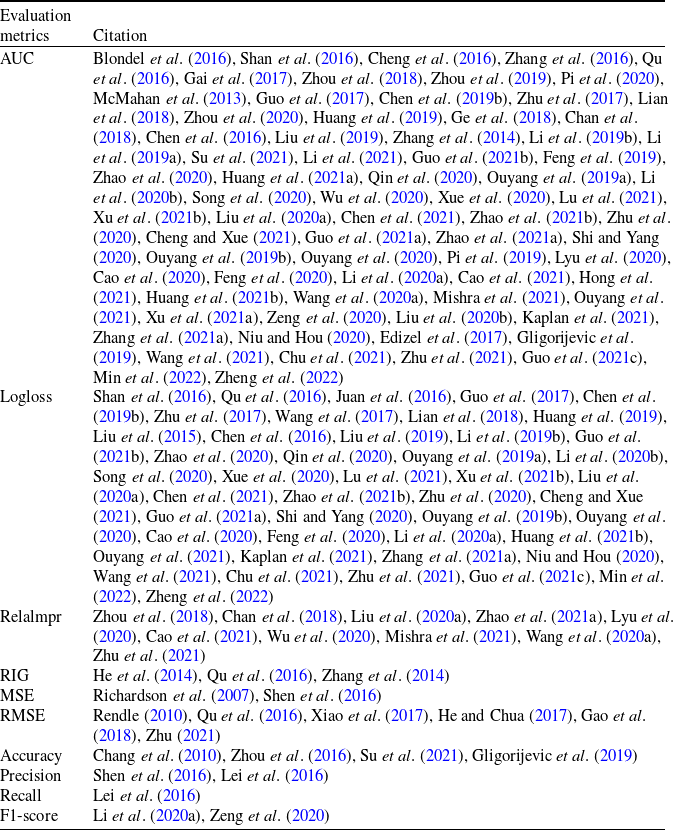
5.3 Model evaluation indicators
Many studies have proposed a range of evaluation indicators for evaluating CTR prediction models. Table 9 presents various evaluation indicators along with the corresponding research references. Among these, the most commonly used evaluation indicators are AUC and Logloss. A brief overview of some of these metrics is provided below:
-
1. AUC: AUC measures the probability that a randomly selected positive item ranks higher than a randomly selected negative item. It is the area under the ROC curve (Narkhede Reference Narkhede2018). It only considers the order of prediction instances, which is not sensitive to the problem of imbalance of class. AUC’s upper boundary is 1, the bigger the better.
-
2. Logloss: Logloss (Vovk Reference Vovk2015) measures the distance between the predicted scores of each instance and the real label. The lower limit of the Logloss is 0, which means that the two distributions match exactly, the smaller the value, the better the performance. The expression of Logloss with regularization term is as shown in the formula (27),
(27)where
\begin{equation} \mathcal{L}=-\frac{1}{N} \sum_{i=1}^{N} y_{i} \log \left(\hat{y}_{i}\right)+\left(1-y_{i}\right) \log \left(1-\hat{y}_{i}\right)+\lambda\|\Theta\|_{2}, \end{equation}
$y_{i}$
and
$\hat{y}_{i}$
are the true label and estimation value of the i-th instance, respectively. N is the total number of training instances,
$\lambda$
is the weight of
$L_{2}$
regularization, and
$\Theta\ $
is a model parameter set.
-
3. RelaImpr: The introduction of RelaImpr is to estimate the relative improvement of online performance on the basis of offline performance. As shown in the formula (28), the model is compared well with the baseline model. RelaImpr is also known as RI-AUC, the value of AUC for random guess is 0.5, and RelaImpr can be expressed as follows:
(28)
\begin{equation} RelaImpr=[\frac{AUC(\text{model})-0.5}{\text{AUC}(\text {baseline})-0.5}-1]\times 100\%. \end{equation}
-
4. Relative Information Gain (RIG):
$RIG=1-NE$
, where NE is normalized cross entropy, which is expressed as (29)where
\begin{equation} N E=\frac{-\frac{1}{N} \sum_{i=1}^{n}\left(\frac{1+y_{i}}{2} \log \left(p_{i}\right)+\frac{1-y_{i}}{2} \log \left(1-p_{i}\right)\right)}{-(p * \log (p)+(1-p) * \log (1-p))}, \end{equation}
$p_{i}$
represents the click-through rate estimation value, p is the average experience CTR value.


6. The future research directions
-
1. Attention mechanism: In practical applications, not all feature interactions contribute to improved model performance, and CTR predictions that cannot be explained are often unreliable. Models that automatically capture high-order feature interactions, such as DeepFM (Guo et al., Reference Guo, Tang, Ye, Li and He2017) and xDeepFM (Lian et al., Reference Lian, Zhou, Zhang, Chen, Xie and Sun2018), require more robust theoretical support. Future research should explore the full potential of attention and pooling methods to analyze the importance of combined features. In the context of online advertising, a deeper understanding of user behavior can significantly enhance CTR prediction. Attention-based CTR models are particularly effective in capturing user interests by leveraging sequential behavioral data. However, since user interests are dynamic and prone to drift, more sophisticated predictive models are needed to better capture the evolving relationship between user behavior and click-through rate.
-
2. Graph neural network: In recent years, several studies have explored the use of GNNs for CTR prediction, primarily employing graph representations for simple feature interactions. GNNs can integrate more powerful feature interactions, such as those found in models like FwFM (Pan et al., Reference Pan, Xu, Ruiz, Zhao, Pan, Sun and Lu2018), FmFM (Sun et al., Reference Sun, Pan, Zhang and Flores2021) and AOAFM (Wang et al., Reference Wang, Ma, Zhang, Wang, Ren and Sun2020b), into the graph structure, and apply various aggregation strategies to achieve better CTR prediction performance. Researchers have also focused on developing explicit higher-order models for CTR prediction, such as the deep and cross network (Wang et al., Reference Wang, Fu, Fu and Wang2017) and compressed interaction network (CIN) (Lian et al., Reference Lian, Zhou, Zhang, Chen, Xie and Sun2018). However, while explicit representations and high interpretability are valuable, they can sometimes limit the predictive performance of these models. Another promising approach is to leverage GNNs to represent feature interactions directly within the graph structure (Li et al., Reference Li, Cui, Wu, Zhang and Wang2019b; Su et al., Reference Su, Zhang, Erfani and Xu2021), transforming complex interactions into node-to-node relationships. This approach suggests that GNNs hold significant potential for advancing the exploration of explicit higher-order models in CTR prediction.
-
3. Cold start: For newly launched advertisements, there is often insufficient historical data to predict clicks effectively. Deep learning models struggle to generate accurate embedding vectors for new ads or ads with limited training samples. To address this, Pan et al. (Reference Pan, Li, Ao, Tang and He2019) proposed a meta-embedding model that leverages attributes related to new advertisements to mitigate the cold start problem. However, this approach may overlook other valuable information. GNNs offer a solution to the cold start issue by constructing graphs that link various advertisements, enabling the extraction of useful information from adjacent ads. This approach can enhance the click-through rate prediction performance for new advertisements (Ouyang et al., Reference Ouyang, Zhang, Ren, Li, Zhang, Luo, Liu and Du2021). Effectively addressing the cold start problem could provide valuable insights for developing highly interpretable CTR prediction models.
-
4. Embedding of numerical features: Most modeling frameworks for CTR prediction primarily focus on capturing interactions between categorical features, while the embedding of numerical features is often overlooked. The GBDT+LR model (He et al., Reference He, Pan, Jin, Xu, Liu, Xu, Shi, Atallah, Herbrich and Bowers2014) addresses this by converting numerical features into categorical values using a tree model and then searches for embedding dimensions to obtain their representations. To better handle numerical features in CTR prediction, Guo et al. (Reference Guo, Chen, Tang, Zhang, Li and He2021a) proposed the AutoDis framework, a pluggable embedding learning approach for numerical features. AutoDis boasts high model capacity and generates unique representations with a controlled number of parameters in an end-to-end manner.
7. Conclusion
This paper provides a comprehensive overview of ad click-through rate prediction models. We classify CTR prediction models into two main categories: shallow interaction models and deep learning-based CTR prediction models (including DNN, CNN, RNN, and GNN). First, we trace the evolution of classical CTR prediction models in recommender systems, with a focused discussion on representative models from each category. Next, we summarize the advantages and disadvantages of the aforementioned algorithms as well as commonly used datasets and evaluation metrics for assessing the performance of CTR prediction models. Finally, we explore the current research trends in this field and highlight potential directions for future exploration. This paper aims to offer foundational knowledge and identify key areas for further research for scholars interested in CTR prediction.
Author contributions
J. Bai was involved in conceptualization, literature reviews and formal analysis, division and classification, comparison and summary, and writing the original draft. X. Geng took part in conceptualization, project administration and resources, methodology, investigation, writing, reviewing, and editing. J. Deng and Z. Xia took part in conceptualization, resource acquisition, literature reviews, document statistics, reviewing, and editing. H. Jiang, G. Yan, and J. Liang was involved in resource acquisition and formal analysis, reviewing, and editing. All authors have read and agreed to the published version of the manuscript.
Competing interests
All authors declare that they have no known competing financial interests or personal relationships that could have appeared to influence the work reported in this paper.


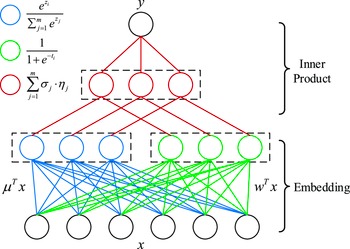
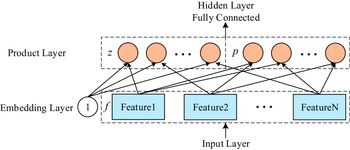


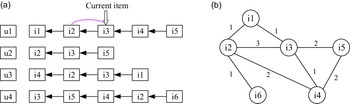


 Open access