

Introduction
The most common way of exploring language variation and change is by studying individual sociolinguistic variables. But do sociolinguistic variables really operate in isolation of each other? There are many reasons to assume that the answer is “no.” For example, social meaning is likely to be distributed across multiple different variables and meaning manifests in how speakers combine or cluster different variants (Brand, Hay, Clark, Watson, and Sóskuthy, Reference Brand, Hay, Clark, Watson and Sóskuthy2021; Campbell-Kibler, Reference Campbell-Kibler, Hall-Lew, Moore and Podesva2021). Moreover, when linguistic variables are involved in variation or change, they may be integrally linked together, for example through chain-shifts. In considering the covariation of variables, there are two sets of important questions in the literature. One relates to which variables work together—Are there subsystems of vowels, for example, that seem to cluster together across speakers? A second relates to which speakers cluster together—Are some speakers reliably “leading” in all ongoing sound changes in a dialect?
In Brand et al. (Reference Brand, Hay, Clark, Watson and Sóskuthy2021), a methodology was developed that allows for the study of patterns of covariation that can address both questions. Brand et al. (Reference Brand, Hay, Clark, Watson and Sóskuthy2021) explored covariation and change in the production of monophthongs in the Origins of New Zealand English (ONZE) corpus—a large longitudinal spoken corpus of New Zealand English (NZE) (Maclagan & Hay, Reference Maclagan and Hay2007). They found clusters of vowels that are statistically and systematically linked to each other. This suggests that if we know how a speaker produces one vowel in a particular cluster, we can make predictions about how they are likely to produce other vowels in that cluster.
One important question that stems from this work is: How robust are these patterns of vowel covariation? One way to check for this is to consider whether these clusters still exist in a different corpus of NZE, recorded much later when the variety is more stable. In this paper, we apply Brand et al.’s (Reference Brand, Hay, Clark, Watson and Sóskuthy2021) analysis to the QuakeBox corpus, a collection of earthquake stories told by survivors of the earthquakes which struck the Canterbury region in 2010/2011 (Walsh, Hay, Bent, Grant, King, Millar, Papp, & Watson, Reference Walsh, Hay, Bent, Grant, King, Millar, Papp and Watson2013). This corpus was recorded in 2012 and includes speakers born later than the youngest speakers in ONZE. We show that almost identical patterns of vowel covariation exist in the QuakeBox corpus, even though many of the sound changes have considerably progressed. Our results suggest that even when historic ongoing change becomes more stable, speakers may continue to use the same vowel clusters to index social meanings.
We also examine within-speaker stability in real time by looking at recordings from QuakeBox 2; earthquake stories retold by 51 of the original QuakeBox speakers eight years later. We ask: Do the innovative speakers in QuakeBox still produce innovative variants eight years later? We examine this in our corpus of re-recorded stories and find a high degree of correlation between the two sets of recordings. Where a speaker sits within the landscape of covariation in the first recording can reliably predict where they will be in the second recording. This suggests that even if a speaker’s vowel realizations change over time, their position (as innovative or conservative) within a particular cluster of sound changes remains stable when compared with others in the community. In other words, speakers who can be identified as leaders of sound change at one time-point may remain leaders at later points in their life.
For readers who are interested in referring to the R Markdown file used for this paper, we have provided this as supplementary materials (R Core Team, 2021)Footnote 1. Viewing the supplementary materials is not necessary to follow this paper, but they provide substantial extra context and detail for interested readers.
Background
Covariation, style, and social meaning
There are multiple reasons why vowels might cluster meaningfully together. In the absence of very clear structural relationships (e.g., in a chain-shift), one leading explanation could be that a cluster of vowels works together in the construction of social meaning. The term social meaning is used to refer to any form of indexical association between linguistic material and some aspect of the “speaker as a social actor in the speech situation” (Eckert & Labov, Reference Eckert and Labov2017:3). Social meaning may appear to index categories of speakers (e.g., men, older, working class) and indeed identifying linguistic differences between broad categories of speakers was the focus of early sociolinguistic work (Labov, Reference Labov2001). It is now understood that these categories of speakers are not the root cause of observed variation but rather reflect communities of practice, and patterns of behavior linked to broader constraints on the social order (Eckert, Reference Eckert2019). Individuals also deploy stylistic resources in the construction of personae—“holistic, ideological social types that are recognizably linked with ways of being and speaking” (D’Onofrio, Reference D’Onofrio2020:1). Personae are linked with recognizable social types and are used to convey social meanings through associated stylistic resources (Agha, Reference Agha2003; D’Onofrio, Reference D’Onofrio2020). Recent work on personae raises the question of how they might be linked with “holistic style packages” (D’Onofrio, Reference D’Onofrio2020:11). To the degree that we observe coherent subsets of vowels varying together across speakers, one potential interpretation is that they are working as a “style package.”
Approaches to the study of covariation
Studies of potential patterns of covarying variables have been largely supported by careful analyses of variation within and across small numbers of speakers and largely using pairwise comparisons of two variables (Guy, Reference Guy2013; Tamminga, Reference Tamminga2019). The overall results of such studies are mixed. Some studies show that the realizations of some variables appear to be correlated across speakers, but many other pairs of changes appear unrelated.
Brand et al. (Reference Brand, Hay, Clark, Watson and Sóskuthy2021)
Brand and colleagues (Reference Brand, Hay, Clark, Watson and Sóskuthy2021) developed a technique to investigate covariation in a large corpus. Their methodology shows how elements of sound systems covary across hundreds of speakers and demonstrates how constellations of vocalic variables operate together. Brand et al.’s (Reference Brand, Hay, Clark, Watson and Sóskuthy2021) dataset is composed of NZE monophthongs from 481 speakers born between 1864 and 1982. They first obtained statistical estimates of how advanced each speaker was with respect to changes in each of the 10 vowels studied (detailed below). They then used principal component analysis (PCA) on these estimates to investigate the underlying covariation that exists across the vocalic variables. PCA finds covariation in multivariate data by taking the original variables and replacing them with principal components (PCs), where each new PC is selected to capture the maximum possible variation in the data. Each PC consists of numerical “loadings” assigned to the original variables which explain the relationship between the PC and original variables (Wilson Black, Brand, Hay, & Clark, Reference Wilson Black, Brand, Hay and Clark2023). Every speaker is assigned a “score” for each PC, which indicates their position with respect to the PCFootnote 2.
This technique provides a pathway for answering questions both about vowels—such as which vowels appear to be working together—but also about speakers—such as whether any speakers are consistently ahead in sets of sound changes and, if so, who those speakers are. The ability to statistically identify patterns of covariation of this kind lays the groundwork for the field to move to more large-scale analyses investigating covariation across multiple variables and multiple speakers. This paper adopts the methodology reported by Brand et al. (Reference Brand, Hay, Clark, Watson and Sóskuthy2021) and the steps detailed by Wilson Black et al. (Reference Wilson Black, Brand, Hay and Clark2023) to address the stability of this observed covariation across apparent time and in different corpora, and within speakers in real time.
Linguistic change over the lifespan
Historically, adults’ vowel production was thought to be stable, and indeed, this is the basis of the apparent time hypothesis, on which much work in language variation and change relies (Bailey, Wikle, Tillery, & Sand, Reference Bailey, Wikle, Tillery and Sand1991). However, it is now known that speakers can continue to shift their production of vowels over their lifetime. For example, Harrington, Palethorpe, and Watson (Reference Harrington, Palethorpe and Watson2000), in their data on Queen Elizabeth II’s speech, exemplified how speakers may undergo individual/unrelated acoustic shifts over a lifetime, in the direction of community change. These shifts may be indicative of age-graded variation (Wagner, Reference Wagner2012) or they may be the result of a speaker continuing to participate in community sound change (“lifespan change”), or they may even move in the opposite direction to the community (“retrograde change”) (cf. Sankoff, Reference Sankoff2019).
Sheard (Reference Sheard2023) came closest to investigating the stability of clusters of covarying variables in real and apparent time. This work explored real-time variation and change in 11 phonetic variables in the speech of five Greek- and five Italian- background Australians who were recorded in Sydney in the 1970s as teenagers (see Horvath, Reference Horvath1985) and again in 2019 as adults. These real-time changes were contextualized against an apparent time study of 117 speakers from the Sydney Speaks corpus.Footnote 3 Sheard (Reference Sheard2023) showed that individual speakers in the real-time study consistently change over time in the direction of the community and that they change more for the variables that they were behind in when first recorded in the 1970s. There is also some attempt to explore the speakers’ “‘cohesion’ in relative positioning” of a cluster of sound changes in progress (i.e., whether relative position in one sound change will correlate with relative position in other [structurally or socially] related changes) (Sheard, Reference Sheard2023:291). However, this work does not use PCA to explore cohesion; it presupposes which variables are likely to covary and explores pairwise correlations between sets of variables. Sheard (Reference Sheard2023) found little evidence of cohesion across structurally related variables in the 1970s, and no evidence of cohesion across structurally unrelated variables, which is perhaps why this work does not then attempt to explore cohesion further in the 2019 data. The inability to find evidence of cohesion among these variables is perhaps an artifact of the very small sample size of only 10 participants (5 representing each speech community).
In the context of our study of covariation, we can ask a more specific question regarding speaker stability. Imagine that vowel realizations do shift considerably within speakers over time so that if we record the same cohort of speakers some years later, the vowels have moved. Will individuals’ positions within the distributions for the sets of clustering vowels remain stable? Are the leaders at time-point one in a cluster of sound changes, still the leaders at time-point two?
Research questions
We have two research questions. These relate to the stability of patterns of vowel covariation, and the stability of a speaker’s position within the wider distribution of vowel covariation.
1) Stability of patterns of vowel covariation. Are patterns of vowel covariation observed with PCA stable and replicable across multiple corpora?
We address this by replicating the analysis presented in Brand et al. (Reference Brand, Hay, Clark, Watson and Sóskuthy2021) on an entirely different corpus, recorded with younger NZE speakers.
2) Stability of speaker position within axes of vowel covariation. Are individual speakers stable in their position within covarying vowel clusters?
We address this by conducting a covariation analysis of two different sets of recordings by the same speakers—recorded eight years apart—and investigating how stable speakers are in terms of their position within the identified PCs. Both of our primary research questions were preregistered (AsPredicted.org, #86574).
To answer the research questions, PCA is conducted on two sets of recordings with the same speakers produced eight years apart and compares the results to each other, as well as to Brand et al. (Reference Brand, Hay, Clark, Watson and Sóskuthy2021). We conclude that despite considerable sound change between ONZE and QuakeBox (and minor sound changes between the two time-points in our dataset), both the patterns of vowel covariation across corpora, and the positions of individual speakers within this covariation, are remarkably stable.
Methodology
Corpora
The analysis is conducted on the QuakeBox corpus, a collection of earthquake stories from the 2010/2011 Canterbury earthquakes (Walsh et al., Reference Walsh, Hay, Bent, Grant, King, Millar, Papp and Watson2013). In 2019–2020, many of the original participants returned to retell their stories, and recount what has happened since. We focus on speakers who are in both sets of recordings—referred to as QuakeBox 1 (QB1) and QuakeBox 2 (QB2). Analysis of the discourse structure of the “earthquake” story components has revealed that they have extremely similar structure across the two recordings (Blain & Millar, Reference Blain and Millar2023). Recordings in QB2 tend to be longer (median QB2 = 19 minutes, median of same speakers in QB1 = 7.5 minutes). This is predominantly because they include not only the retold earthquake story but also a reflection of what has happened since. The recording context, content, and purpose across the two recordings are relatively equivalent. We thus have two recordings of each speaker, with approximately an eight-year span between them. The recordings have been transcribed and uploaded to a LaBB-CAT database which is a browser-based corpus management tool (Fromont & Hay, Reference Fromont and Hay2008). Using HTK, transcripts have been automatically aligned at the phoneme level. Vowel F1 and F2 values (at the vowel midpoint), along with other relevant phonetic and social information (see supplementary materials S1), were extracted using LaBB-CAT and its integration with Praat (Boersma & Weenink, Reference Boersma and Weenink2022).
Visualizing overall patterns of change within QB1
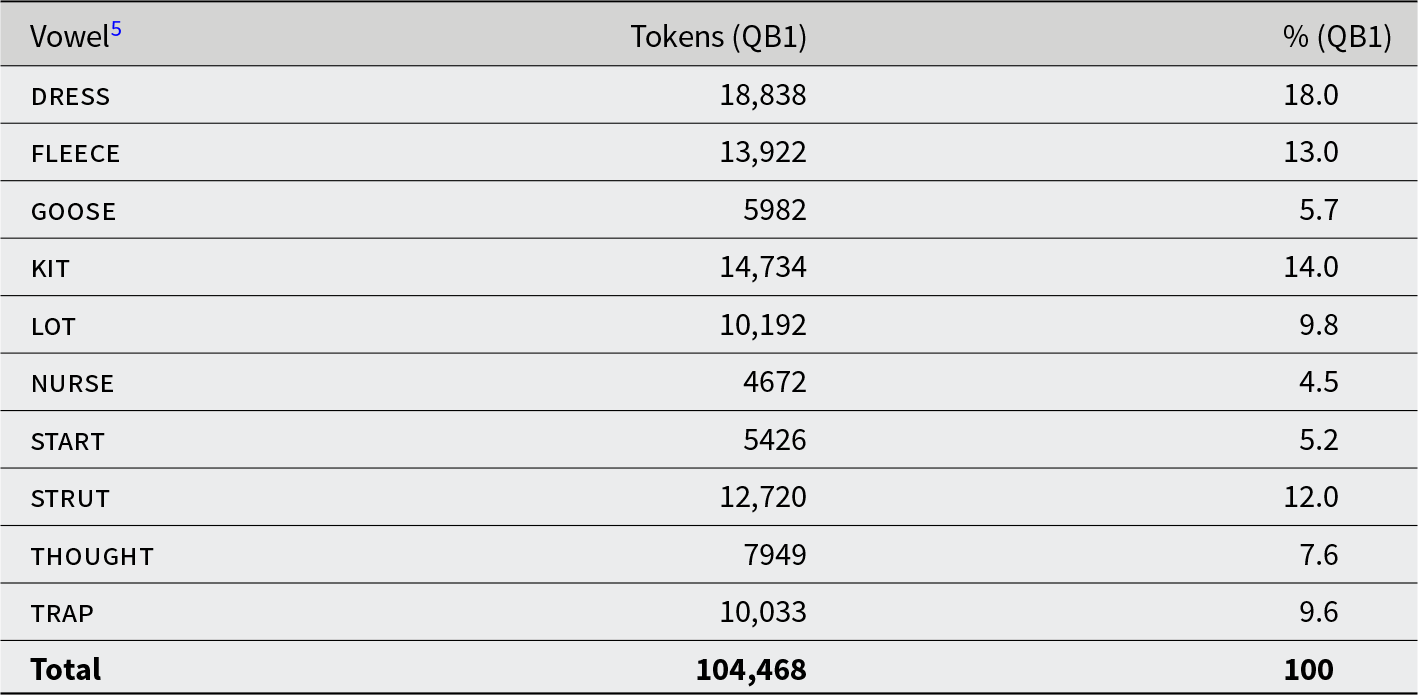
First, we explore the direction of change for all 239 speakers in QB1 who remain after filtering (F = 168). This allows us to interpret our comparisons between real-time QB1 and QB2. The filtering process closely follows Brand et al. (Reference Brand, Hay, Clark, Watson and Sóskuthy2021) and detailed steps are provided in the supplementary materials (S2). Briefly, the filtering process removed measurement errors, missing speaker and formant data, stop words (due to their unstressed vowel realisations), tokens that preceded /l/ and /r/, and applies a 2.5SD outlier removal to each vowel token. After filtering, we normalized the data using the Lobanov 2.0 method detailed in Brand et al. (Reference Brand, Hay, Clark, Watson and Sóskuthy2021). The final token counts are presented in Table 1.Footnote 4
Table 1. The number and percentage of vowel tokens per monophthong in all QB1
We fit generalized additive mixed models (GAMMs) on each formant. These models predict the normalized formant values with a parametric term for gender and a four-knot smooth for age at both levels of gender. We also fit articulation rate Footnote 6 as a control variable and random effect intercepts for speaker and word Footnote 7. We note that the focus is on exploring (and ultimately controlling) known social factors associated with vowel variation, and there are likely to be unmodeled nonsocial influences, including phonological environment and lexical frequency. However, we have left these unmodeled in the interests of fitting simple parallel models for each vowel and formant, and to closely follow the structure in Brand et al. (Reference Brand, Hay, Clark, Watson and Sóskuthy2021). The random effect intercepts are likely to absorb any major sources of variation associated with the word.

Figure 1. Vowel changes in apparent time for QB1 (panel A) compared to the vowel changes in real time for ONZE (panel B). Men are on the left and women are on the right. Data for panel B comes from Brand et al. (Reference Brand, Hay, Clark, Watson and Sóskuthy2021) (CC BY-NC-ND 4.0). Vowels with statistically significant change over time in either F1 or F2 are displayed with a star, nonsignificant changes are marked with “(n.s.).”
Figure 1 shows the age effects from the GAMMs. This figure represents the apparent change over time, separately for men and women, with the beginning of the arrow representing the oldest age group (76–85) and the arrowhead representing the direction of change (i.e., the youngest age group, 18–25). goose, thought, and lot are not significant for men while strut and lot are not significant for women. This is compared, in the bottom panel, with the real-time sound changes observed within the ONZE corpus (Brand et al., Reference Brand, Hay, Clark, Watson and Sóskuthy2021), which spans an earlier and longer period, and has significant effects for all vowels.
When comparing apparent time change within QB1 to the older ONZE data, we see some consistencies and some differences. With respect to the well-established short front vowel shift (Maclagan & Hay, Reference Maclagan and Hay2007), we can observe the continued raising of dress, whereas trap is now relatively stable. kit has been lowering and retracting for many years in NZE, but it appears to start reversing for our youngest speakers. The fronting of goose has stabilized, although there is some movement in the F1 dimension. start continues to lower (women) and back (men), whereas strut looks to be raising for younger men. thought appears to be very high, and relatively stable, moving slightly up and back for the women. lot shows some nonsignificant raising for women. nurse is now lowering, as opposed to the raising trajectory seen in ONZE (Brand et al., Reference Brand, Hay, Clark, Watson and Sóskuthy2021). We see a continued lowering of fleeceFootnote 8, which swaps position with dress for the women, and then a reversal of this trajectory in the youngest speakers.
This is the landscape in which our investigation of covariation takes place. We may expect some differences from Brand et al. (Reference Brand, Hay, Clark, Watson and Sóskuthy2021) given the later and more compressed time-period, and some differences in terms of the directionality of vowel change. Crucially, whatever patterns of covariation we find in QB1, we expect some stability in the observed covariation to carry through to QB2, given that it contains the same set of speakers.
Visualizing real-time speaker change between QB1 and QB2
In this section, we visualize the stability of the vowels across the 51 speakers who are in both QB1 and QB2 (F = 37). QB2 contains nearly double the number of tokens as QB1 (because participants talked for longer in QB2), but the distribution of vowels is roughly equivalent, as shown in Table 2. A similar set of GAMMs to those detailed in the aforementioned section were run on this subset of data with corpus as a predictor but dividing the data by gender to reduce model complexity, giving 40 distinct models (10 vowels × 2 formants × 2 genders). The models fit a smooth for QB1 and a “difference smooth” which represents the difference between QB1 and QB2, divided into differences in the shape of the smooth (the “smooth term”) and the overall height of the smooth (the “parametric term”).Footnote 9
Table 2. The number and percentage of vowel tokens per monophthong in QB1 and QB2 after outlier removal
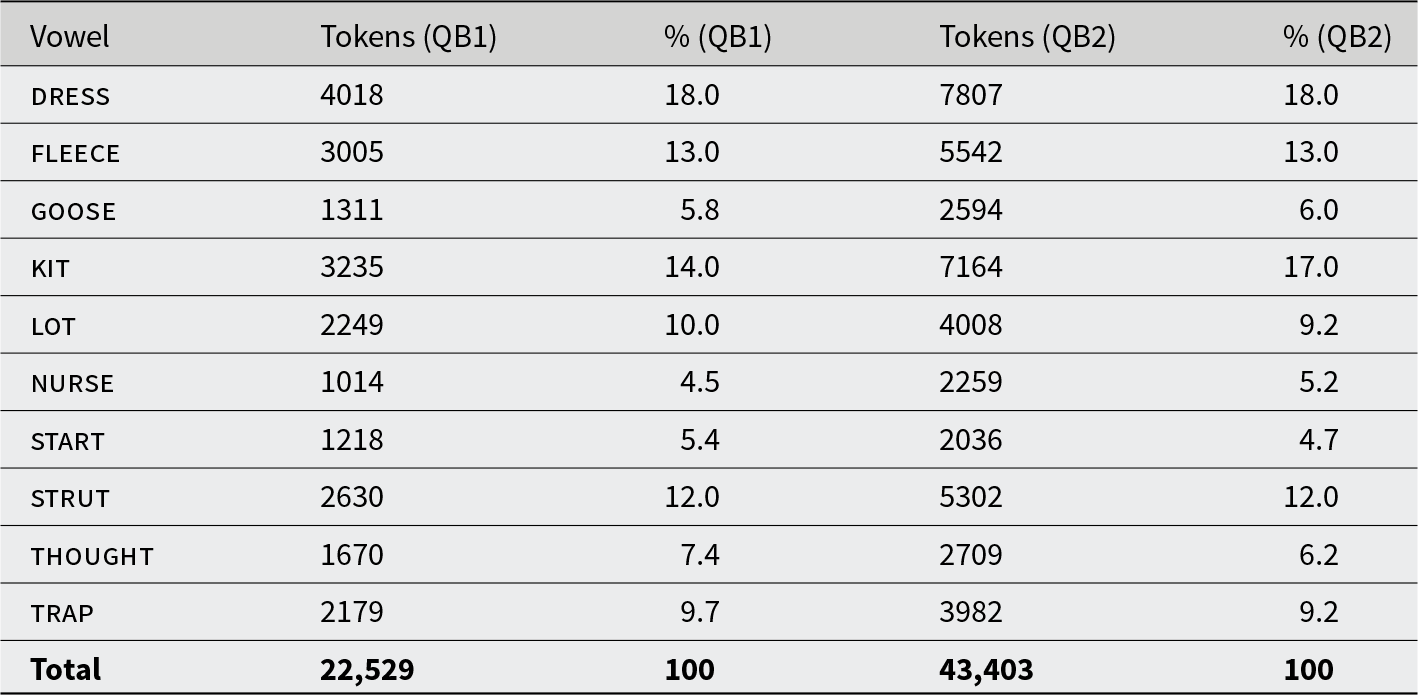
Figure 2 visualizes the vowel spaces across the two corpora, plotting the predicted values for QB1 and QB2 for men and women. QB1 and QB2 are plotted on the same graph, with the QB1 vowels in orange and QB2 vowels in green. QB2 vowels are only shown if their parametric terms are significantly different from those in QB1. That is, Figure 2 represents change in real time while controlling for apparent time change, articulation rate, and speaker and word effects.
To the extent that we observe change across the corpora, this could relate to several possible sources. One is that there may be lifespan or retrograde change, in which case the QB2 vowels would be either in the direction pointed to by the corresponding arrow in Figure 1 (the potential “direction of change”) or in the reverse direction, respectively. The second is that age differences seen in QB1 could reflect age-graded differences. If so, we might expect the QB2 vowels to be shifted in the opposite direction from the arrow, reflecting the fact that speakers have grown older, and shifted toward the more conservative variants used by older speakers in QB1. Finally, there may be stylistic variation between the corpora. The recording context differs, the urgency of the stories differs, and QB2 more often has an interlocutor whereas the QB1 stories are mostly monologues. Wholesale shifts related to such differences would be removed by the normalization process. But stylistic variation encoded in different vowels or clusters of vowels may be visible across the corpora, in a way that could be independent of the observed age effects.
For all speakers, fleece significantly lowers between the two sets of recordings. The women show a substantial raising of nurse and dress and a slight fronting of strut. The men show a significant raising of kit, and a small but significant fronting of goose and backing of lot. thought slightly raises (women) and backs (men). Some of these shifts are aligned with apparent time changes (Figure 1, panel A) and some are not. The youngest speakers in the apparent time analysis appear to be now raising fleece, following a period of lowering (Figure 1, panel A). In this real-time data, both speaker groups lower their fleece. thought shows a significant raising effect for women in apparent time (Figure 1, panel A), and the women in Figure 2 show significant raising of thought between the recordings. This is consistent with an interpretation in which speakers are changing in the direction of community norms (or “lifespan change”). The apparent time data (Figure 1, panel A) shows a recent raising by the youngest speakers of kit—significant for women and nonsignificant for men, and the real-time data show men producing higher kit. This, too, may be a case of speakers shifting in the direction of emerging change. nurse, on the other hand, shows an overall lowering in the apparent time analysis (Figure 1, panel A), but considerable raising in the real-time analysis for women (Figure 2), indicating that there are also within-speaker changes that are not consistent with the direction of change and may instead indicate some age-grading or stylistic variation. We do not have sufficient data to robustly interrogate the degree to which these changes are equally carried across speakers of all ages. Work on life-span change indicates that different types of change may be more likely at different ages (Sankoff & Wagner, Reference Sankoff and Wagner2006), but our data are too sparsely distributed to look for robust age differences. The significant effects in the models simply tell us that there is a change that is carried by a nontrivial number of speakers, but not who those speakers are.Footnote 10
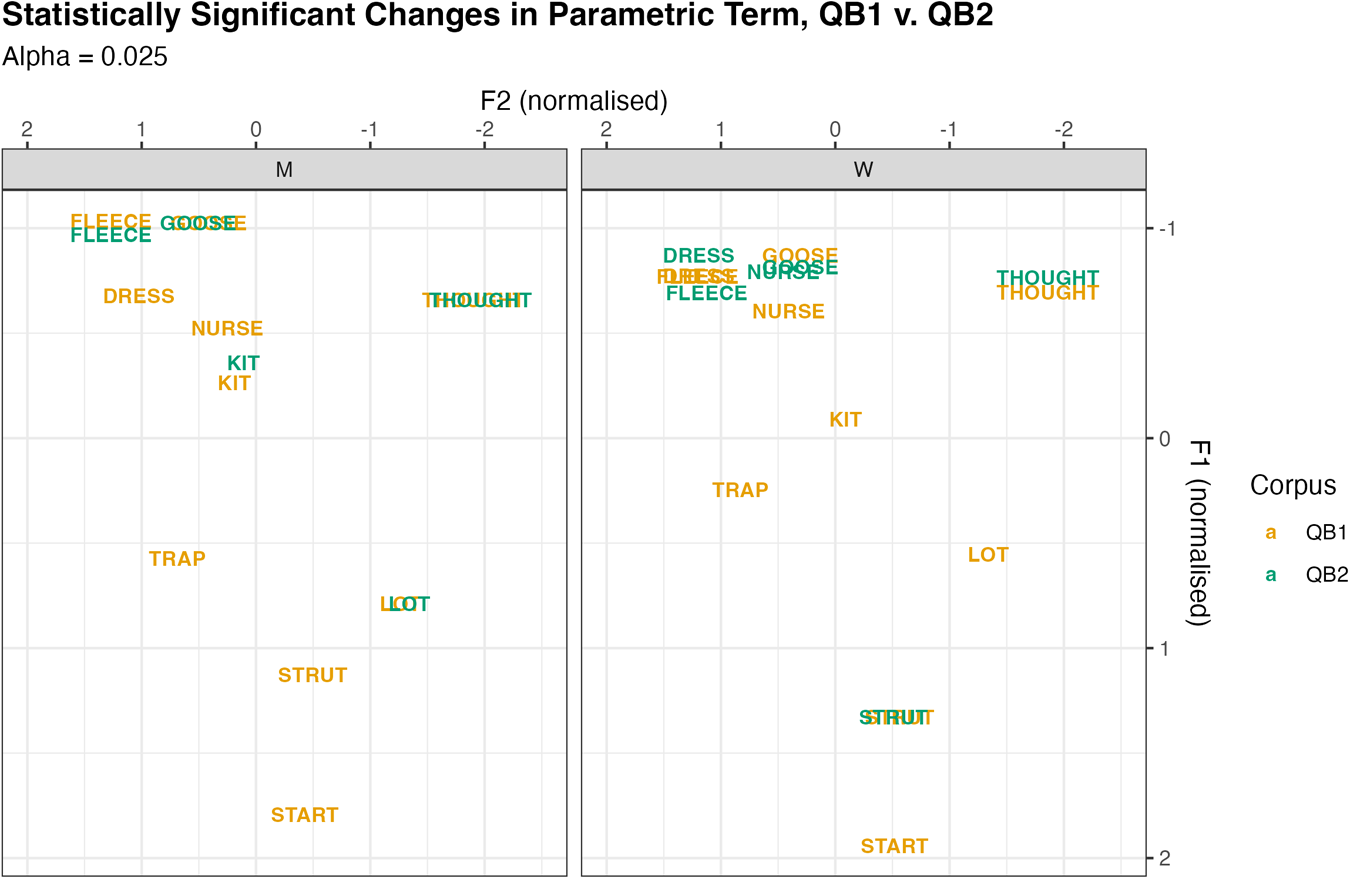
Figure 2. Vowel spaces from QB1 (orange) and QB2 (green), plotted only in cases of significant difference with men on the left and women on the right. The significance test uses a Bonferroni correction (α = .025).
Overall, the results show some stability between the corpora, and some change. The change is not always in a uniform direction and is not carried equally across both genders. There is unlikely to be a single factor explaining these shifts. Indeed, explaining the individual effects is not our focus. Rather, we ask, even though we have some observed change between the two time-points, are speakers’ positions within patterns of covariation nonetheless stable?
Modeling covariation patterns in QB1 and QB2
This section reports results of the PCA performed on the 51 speakers in QB1 and QB2. This analysis follows the procedure outlined by Brand et al. (Reference Brand, Hay, Clark, Watson and Sóskuthy2021) but with additional techniques as detailed in Wilson Black et al. (Reference Wilson Black, Brand, Hay and Clark2023). Both studies suggest that PCA is a promising method to explore holistic vowel covariation if the data that undergoes PCA has already been controlled for known factors of sound change. To do this, we fit GAMMs following the same structure reported above to the speakers who are in both QB1 and QB2. We then extract the random speaker intercepts from these models, which represent the differences between speakers in formant values which remain after gender, age, and articulation rate have been controlled for (Wilson Black et al., Reference Wilson Black, Brand, Hay and Clark2023)Footnote 11. The resulting dataset gives distinct vowel intercept values per speaker, per corpus, which are used as input data to a PCA.
Overview of PCA
PCA returns similar results when applied to QB1 and QB2. Both PCAs were robust when compared with random permutations of the data, suggesting that PCA is reflecting real covariation in both datasets. Following Wilson Black et al. (Reference Wilson Black, Brand, Hay and Clark2023), we apply another permutation test to explore 95% confidence intervals of the variance explained in each PC. This is done by bootstrapping the data to estimate the stability of the variance explained by each PC. These random permutations and the bootstrapped samples are depicted in Figure 3, with QB1 in the top panel and QB2 in the bottom panel. PC1 accounts for 33.1% of the original variation in QB1 and 25.9% of the original variation in QB2. PC2 accounts for 15.9% of original variation in QB1 and 14.1% of the original variation in QB2. PC1 and PC2 explain more variance than expected from randomly permuted data in QB1. Consequently, we focus our analysis on PC1 and PC2 (unlike Brand et al., Reference Brand, Hay, Clark, Watson and Sóskuthy2021, who explored three PCs). In QB2, PC1–PC3 explain more than expected from randomly permuted data. However, the overlap between sampling distributions (red) for PC2 and PC3 in both QB1 and QB2 indicates instability in the loadings of these PCs (in a way to be explained).
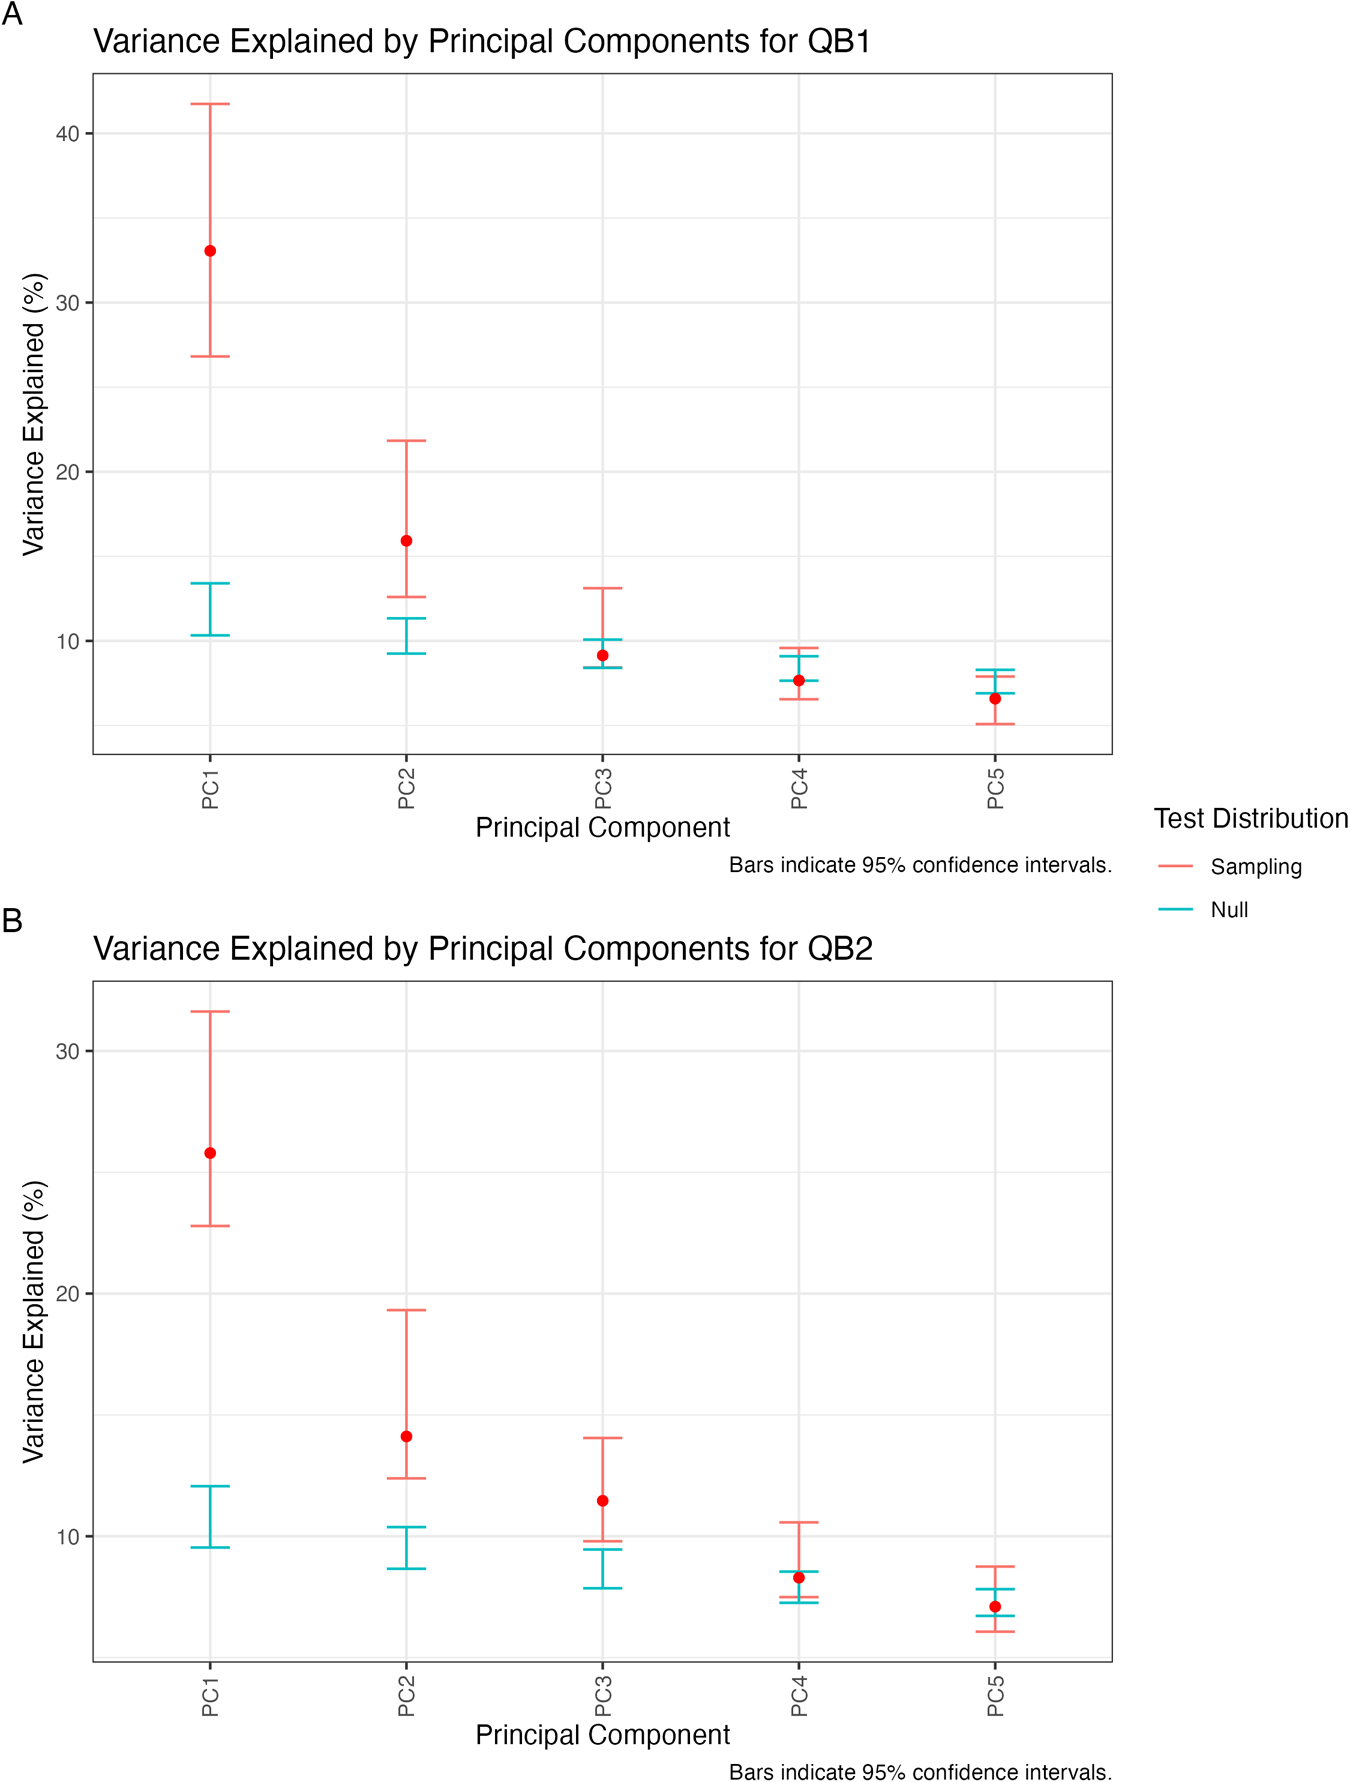
Figure 3. Variance explained by top five PC loadings for QB1 (panel A) and QB2 (panel B). The red “sampling” distribution represents the range of variance explained attained across the bootstrapped analyses, and the blue “null” distribution indicates the variance explained by random permutations of the data. Bars indicate 95% confidence intervals.
In short, we are focusing on the two PCs that are significant in our data. The first one is heavily weighted for the vowel measurements involved in ongoing changes, on which speakers are ranging along a leader–lagger continuum. The second is loaded for back vowel measurements. The ONZE results found by Brand et al. (Reference Brand, Hay, Clark, Watson and Sóskuthy2021) found two comparable PCs with similar loadings but weighted in the opposite order. See below for further discussion on this PC switch.
PC1: leaders and laggers of change
PC1 loadings for both corpora are given in Figure 4, with QB1 in the top panel and QB2 in the bottom panel. Vowels are listed from left to right with vowels on the right having greater contribution to the PC. Vowels that are positively loaded are indicated with a black cross. Vowels that are negatively loaded are indicated with a minus sign. The direction of the loadings is arbitrary in that the plus and minus signs could be swapped without affecting the interpretation. We have manually flipped the loadings for PC1 to match the orientation of the corresponding PC in Brand et al. (Reference Brand, Hay, Clark, Watson and Sóskuthy2021). Vowels with loadings and confidence intervals outside the null distribution are the most stable in the PC. In QB1, F1 fleece and F1 kit are both negatively loaded. The fact that they are loaded in the same direction means that when a speaker has a low F1 for fleece, they will also have a low F1 for kit. In other words, vowel formants sharing a sign are positively correlated with each other, and vowel formants with opposite signs are negatively correlated with each other.
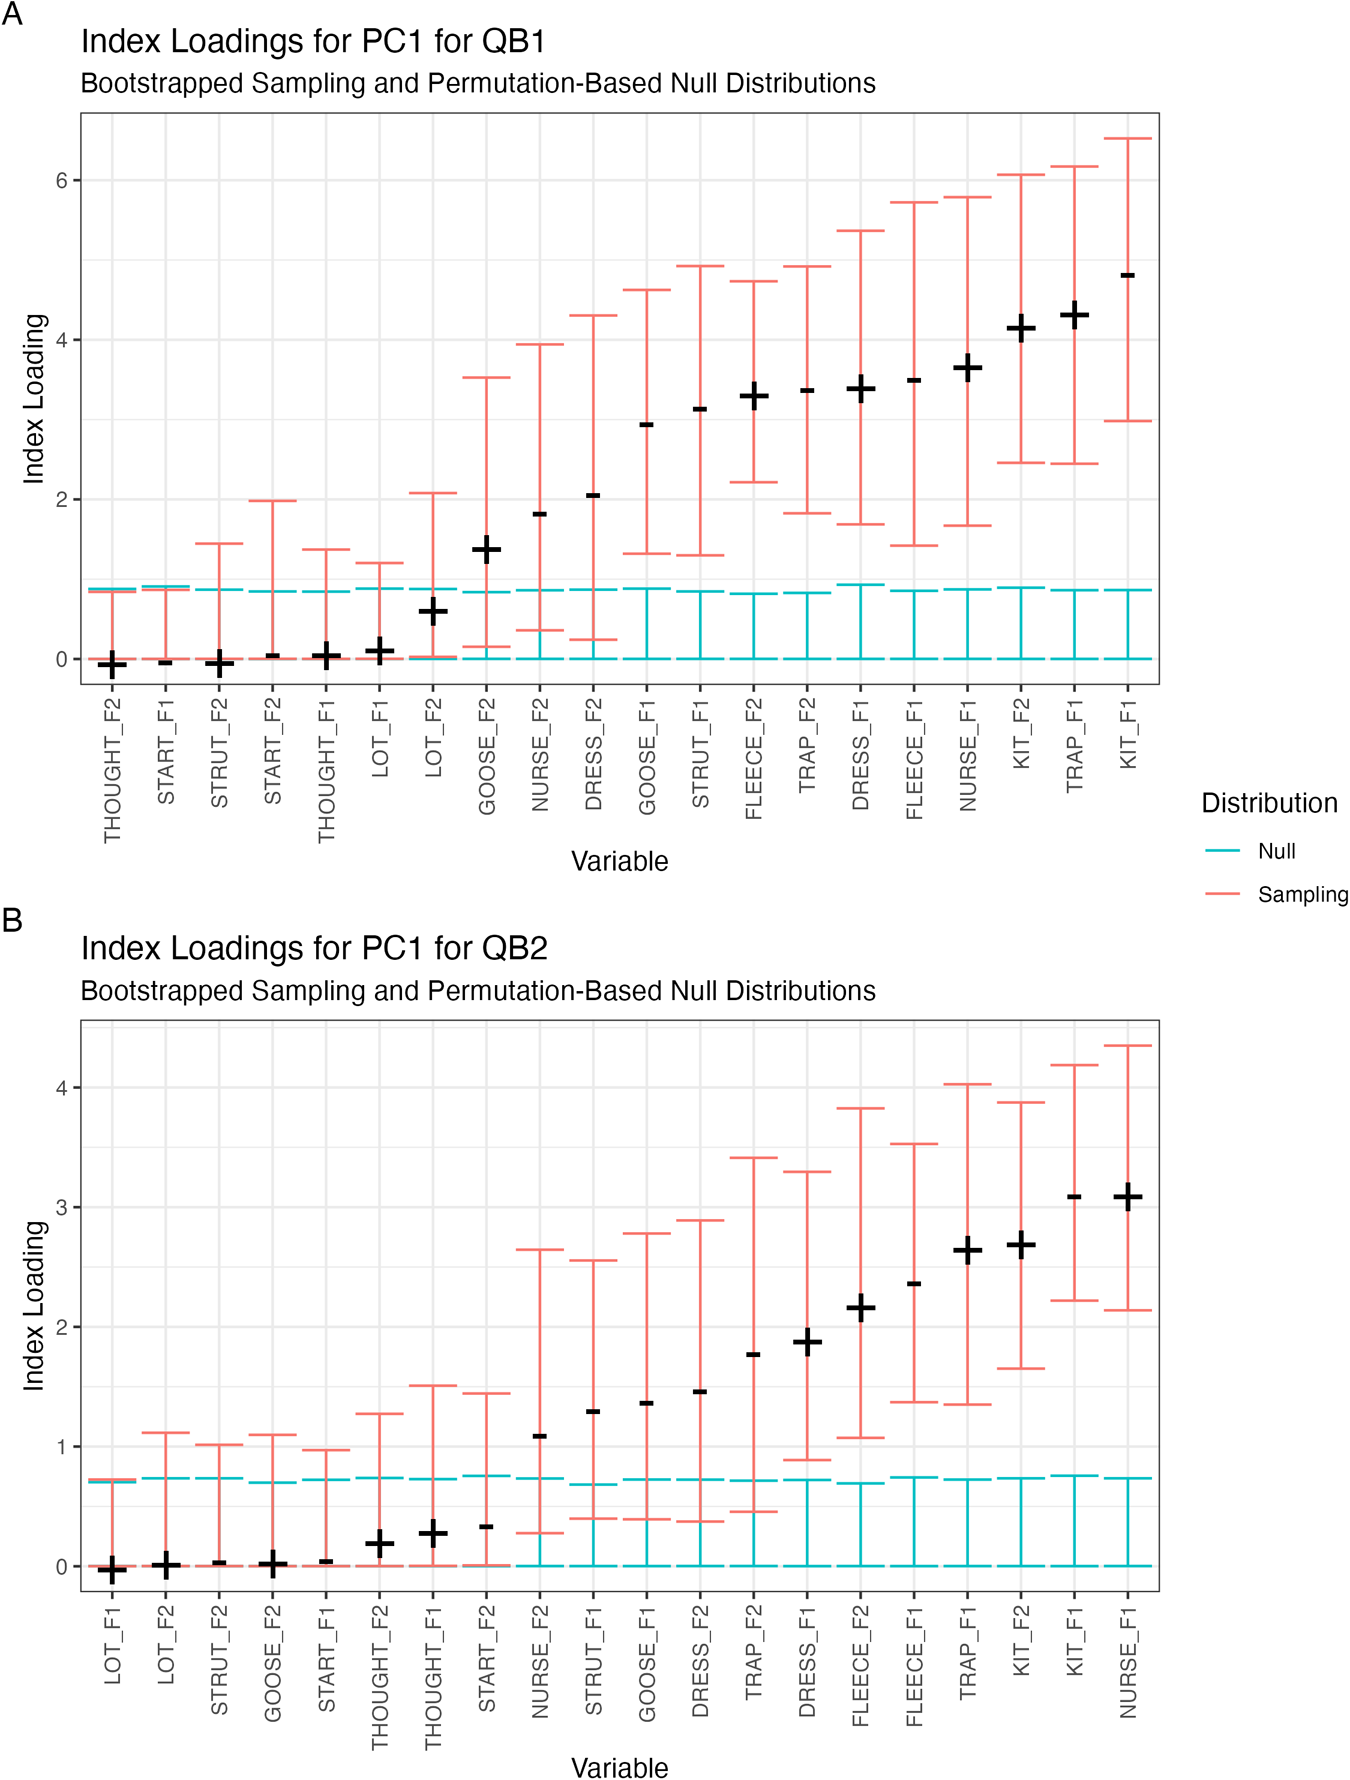
Figure 4. PC1 loadings for QB1 (panel A) and QB2 (panel B).
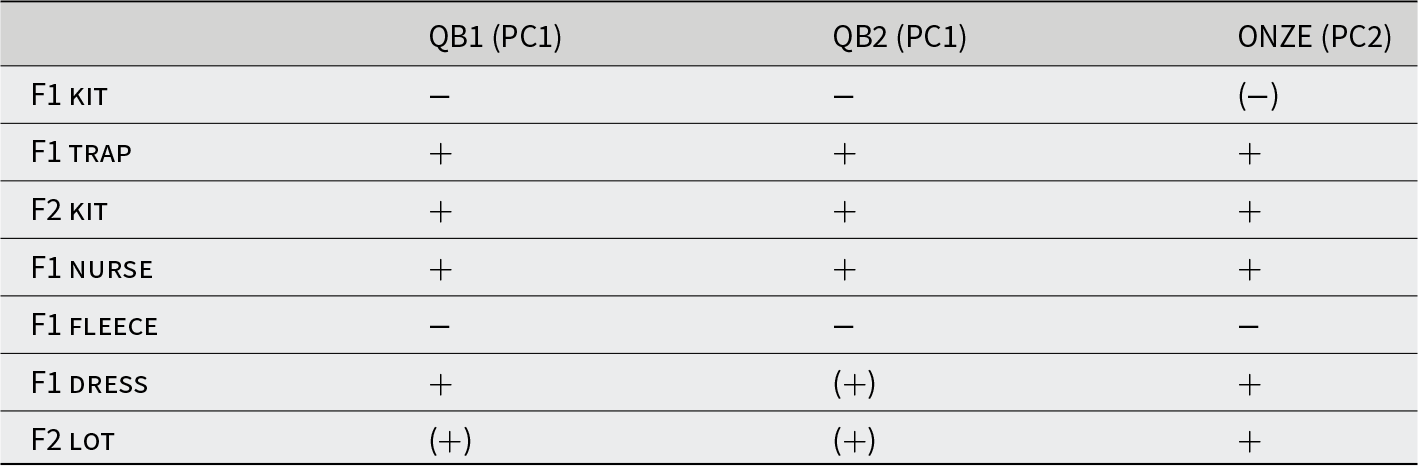
The PC1 loadings for the different corpora are compared in Table 3, with loadings from a matching PC (PC2) in Brand et al. (Reference Brand, Hay, Clark, Watson and Sóskuthy2021). Included in the table are all vowel formants that fall above the 50% threshold in PC1—meaning these vowels collectively account for at least 50% of variation in that PCs’ total loadings. In other words, these vowel formants are the “top contributors” to the PC loading. Although some vowels are more strongly loaded in some of the analyses than others, we can see that the same pattern of covariation is found in all three corpora. In all cases, speakers with high loadings on this PC are producing innovative variants of these vowels and speakers with low loadings are behaving conservatively.
Table 3. Comparison of matching principal components from QB1, QB2, and ONZE (Brand et al., Reference Brand, Hay, Clark, Watson and Sóskuthy2021) (CC BY-NC-ND 4.0); + and − represent loadings within the top 50% of the contribution to the PC, and parentheses indicate lower contributions (below 50%)
This PC includes New Zealand’s short front vowel shift (Maclagan & Hay, Reference Maclagan and Hay2007) as centered on raising trap and dress vowels, and a lowering and centralizing kit vowel. These vowels account for the four strongest loadings of PC1 in both QB1 and QB2—with positive loadings for dress and trap F1 and kit F2 (conservative speakers having lower dress, trap, and fronter kit), and a negative loading for F1 kit (with conservative speakers having higher kit).
This PC is not limited to the short front vowels—other vowels are also loaded in the direction of well-documented sound change in NZE, particularly the raising of nurse, and the lowering and backing of fleece (McKenzie, Reference McKenzie2005). Despite the remarkable consistency across these analyses, there are some differences in the strength of involvement of different vowels. lot F2 was strongly loaded in Brand et al. (Reference Brand, Hay, Clark, Watson and Sóskuthy2021) but is absent in QB1 and QB2. Conversely, the QB analyses show kit F1 as one of the most strongly loaded formants, whereas this fell below the threshold for interpretation in Brand et al. (Reference Brand, Hay, Clark, Watson and Sóskuthy2021).
Our first research question asked: Are patterns of vowel covariation observed with PCA stable and replicable across multiple corpora? We have shown that the vowel covariation first discovered in NZE in Brand et al. (Reference Brand, Hay, Clark, Watson and Sóskuthy2021) is replicated in both of our more recent QuakeBox corpora. The degree of replication is particularly notable given that the patterns of sound change (Figure 1, panel A) for the QuakeBox speakers is not the same as seen in the earlier ONZE corpus (Figure 1, panel B). For example, a low kit F1 may be conservative when considering the QuakeBox speakers as a population, but we are starting to see a reversal of this trend with kit raising again in the vowel space in our youngest speakers. Despite this, in the overall covariation pattern, a low F1 (i.e., raised kit) patterns with the conservative variants of other vowels with which it has been shown to covary for some time. Similarly, trap F1 remains robustly represented, despite the complete lack of an age effect in the GAMMs. It is interesting to observe well-documented patterns of “innovative” vowels clustering together even in a corpus that does not contain evidence within itself of ongoing change. This may indicate that the social meaning associated with “innovative” and “conservative” speech can permeate users’ speech for some time after there is an observable age effect within the community.
On the other hand, lot is largely backing in the ONZE corpus, whereas in QuakeBox, lot is no longer in the set of vowels characteristic of the “leaders,” perhaps suggesting that some previous social meaning associated with lot F2 is no longer present. Similarly, nurse is raising in ONZE, and in the beginning of QuakeBox, but then begins to lower. In QB1 and QB2, we see high nurse patterning with the innovative vowels. These relatively minor fluctuations over time seem to suggest that the innovative/conservative axis of variation can remain relevant for specific vowels for some time after community-level age-effects are apparent.

Figure 5. PC1 speaker loadings correlated across QB1 and QB2 (rho = .77, p < .001).
We turn now to question 2, which asked: Are individual speakers stable in their position within covarying vowel clusters? To answer this, we can extract the speaker scores from the PCA, as a measure of where individuals sit with respect to this cluster. A Spearman correlation test between these two sets of loadings (i.e., PC1 in QB1 and QB2) shows the scores have a strong, significant relationship, displayed in Figure 5. Thus, even though several vowels change in their production between QB1 and QB2 (Figure 2), individual speakers’ position within this covariation remains remarkably stable. In terms of research question 2, then, at least with respect to PC1, the answer is yes—speakers are very stable in their positioning within the covariation over time. Speakers who are innovative in QB1 continue to be innovative in QB2, eight years later.
PC2: the back vowels
PC2 loadings for both corpora are shown in Figure 6, with QB1 in the top panel and QB2 in the bottom panel. PC2 is less stable than PC1, with many of the confidence intervals overlapping the null distribution. We only consider vowels where the loadings signs (±) are above the null distribution (indicating that they explain more variation than expected by chance) and vowels whose sampling confidence intervals do not touch zero (indicating that their appearance in a PC with the other identified variables is stable) (Wilson Black et al., Reference Wilson Black, Brand, Hay and Clark2023). This includes (reading right to left on the x-axis) strut F2 through to thought F2 in QB1 and lot F2 through to thought F1 in QB2. In this PC, speakers with fronter start vowels also have a fronter strut, and a fronter and higher thought. Additionally, speakers in QB1 have a fronter and higher lot covarying with the previous vowels, whereas lot F1 drops from this covariation in QB2, leaving only lot F2 to covary with start, strut, and thought.
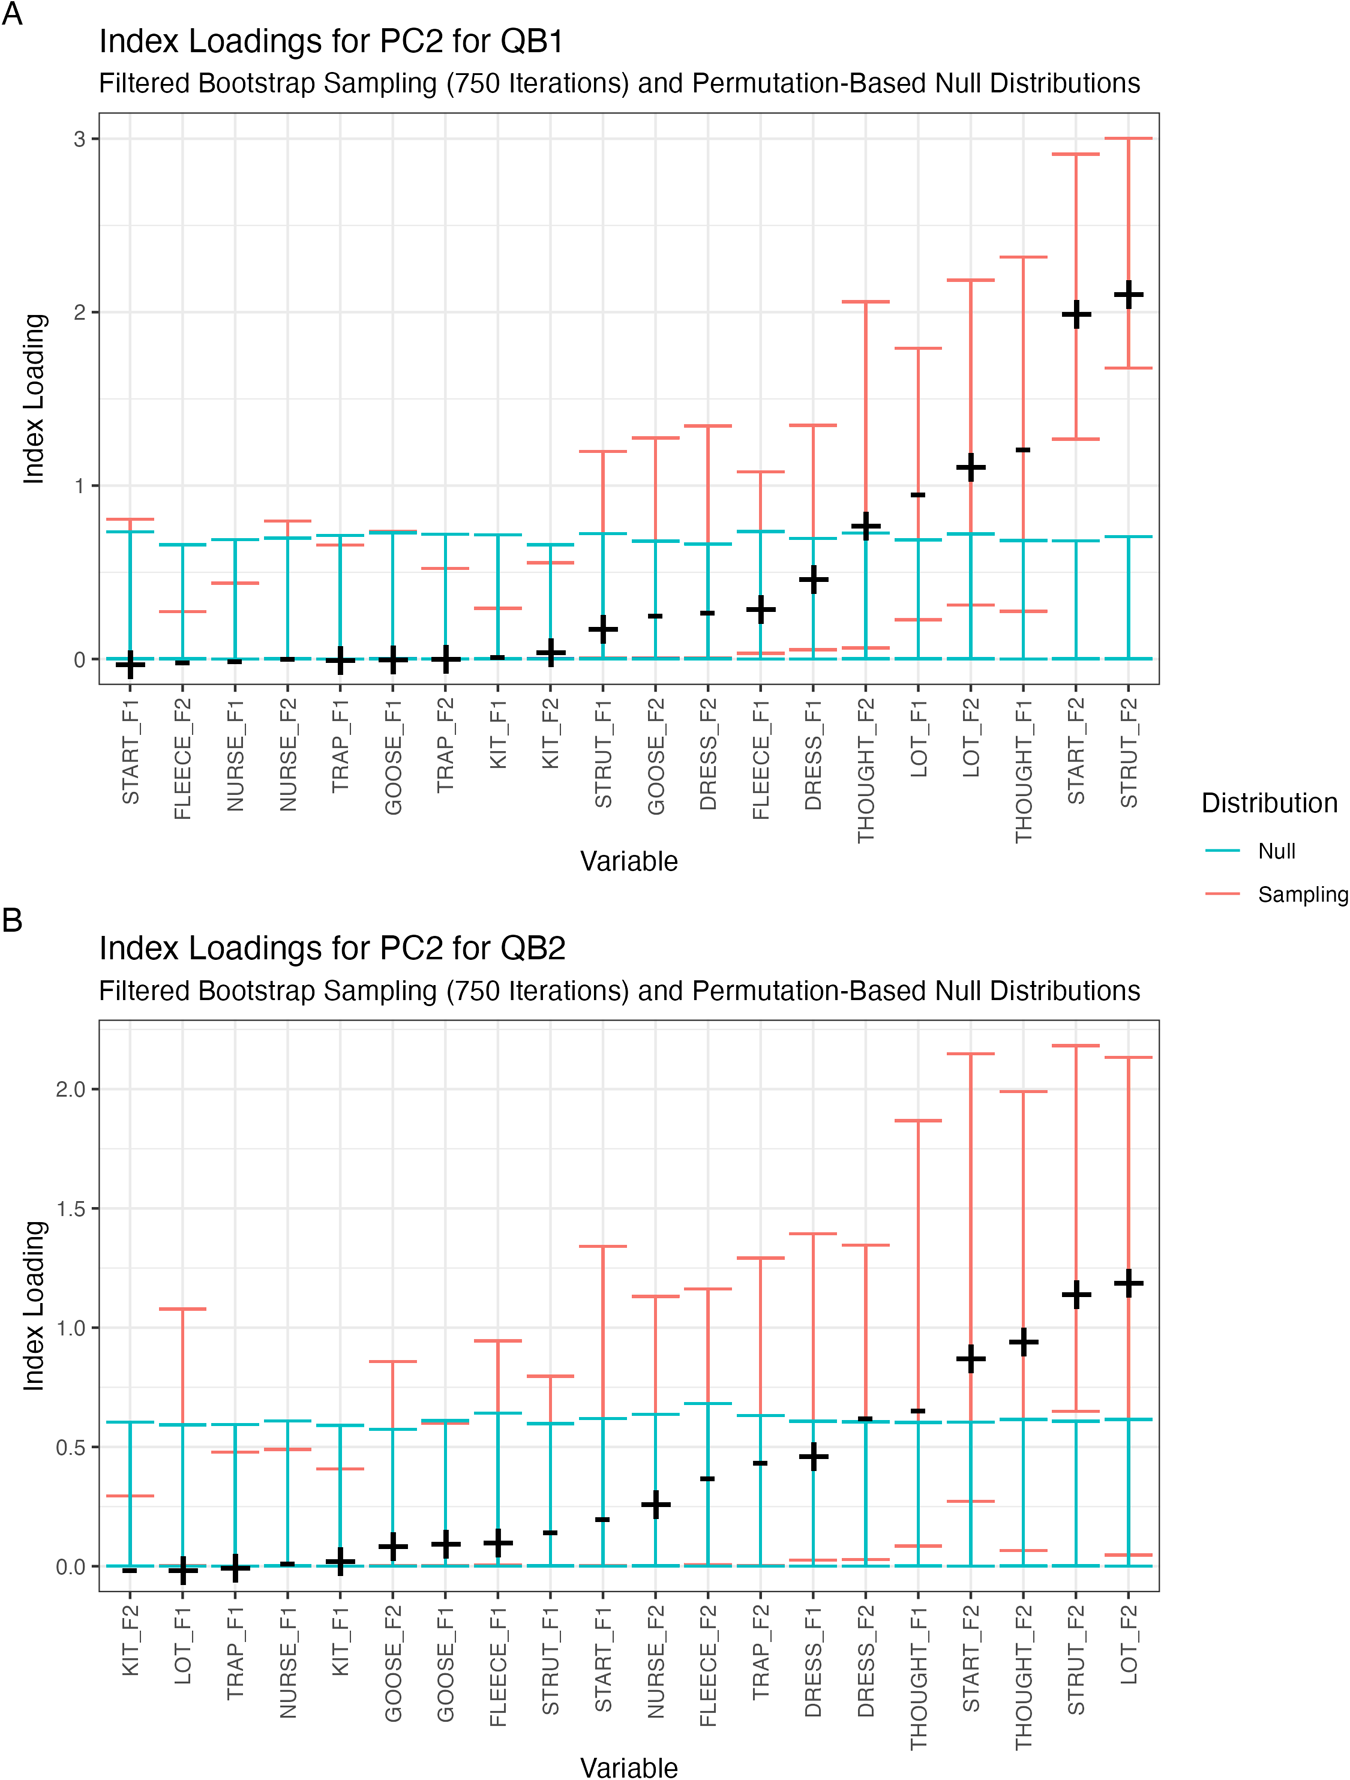
Figure 6. PC2 loadings for QB1 (panel A) and QB2 (panel B). Only the 750 bootstrapped iterations with the highest values for the largest magnitude loading are included. Sampling intervals indicate a conditional 95% bound. For instance, the sampling distribution for start F2 in QB1 indicates a 95% interval in cases where strut F2 is in the top three quarters of its distribution.
Table 4 shows the loadings on PC2 (from this analysis) and from Brand et al.’s (Reference Brand, Hay, Clark, Watson and Sóskuthy2021) PC1, which is the corresponding PC from their analysis. It also indicates the general direction of sound change in each corpus based on Figure 1. For Brand et al. (Reference Brand, Hay, Clark, Watson and Sóskuthy2021), we have simplified the description of sound change to only include the trajectory at the end of the time-period studied. In ONZE, all vowels in the cluster were aligned in the direction of change except for F2 thought. It was proposed that speakers participated in a linear reorganization of the back vowel space in different ways—speakers who were innovative in their F2 for a set of back vowels were conservative for the raising of thought, and vice versa.
Table 4. Comparison of matching principal components from QB1, QB2, and ONZE (Brand et al., Reference Brand, Hay, Clark, Watson and Sóskuthy2021) (CC BY-NC-ND 4.0); + and − represent loadings within the top 50% of the contribution to the PC, and parentheses indicate lower contributions
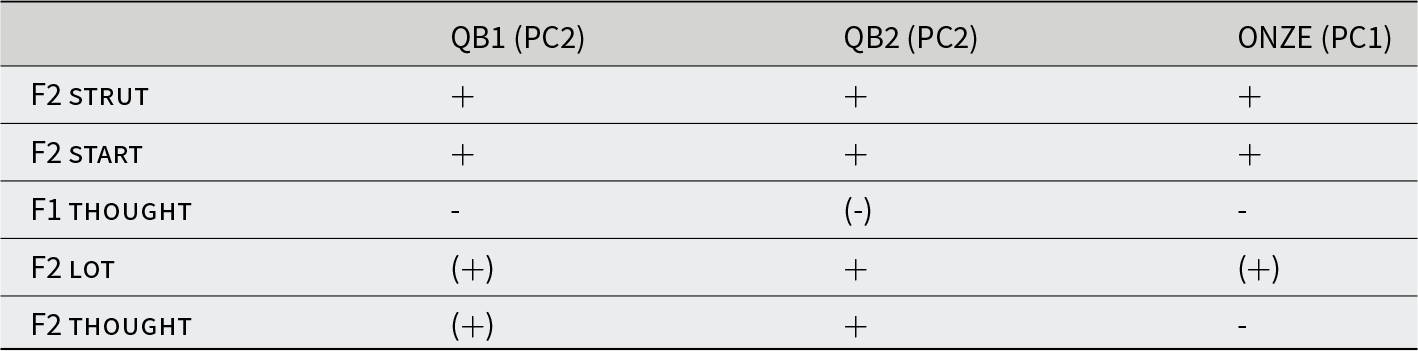
In QuakeBox, we see thought much higher in the vowel space, and generally less movement amongst all the vowels (Figure 1, panel A). When they are moving, they are moving in the same direction as they were in Brand et al. (Reference Brand, Hay, Clark, Watson and Sóskuthy2021) except for thought F2, which is now is backing (see the final row of Table 4). The polarity of the loading of thought F2 on the PC has also flipped.
Brand and colleagues (Reference Brand, Hay, Clark, Watson and Sóskuthy2021) claimed that this vowel cluster encodes innovation in a set of vowels (including thought F2), together with conservatism in thought F1. In QB2, this interpretation can hold, but thought is now backing, and so the specific realization in terms of what it means to be innovative has changed. When thought was fronting, speakers who were innovative in start, strut, and lot were innovative in the fronting of thought. Now that it is backing, it is still the same speakers that are leading that change.
It is interesting to note that the F1 of thought is still loaded in the opposite direction, with respect to the historic sound change; speakers who are innovative in F2 in the back vowels are “conservative” in thought F1. Though thought F1 is not significantly changing within the QuakeBox corpus, the previously observed structural relationship between it and the other vowels remains, despite its different overall position and lack of current momentum. This provides further support for the interpretation that covariation in these vowels can be stable and potentially socially meaningful in a sense that is not directly tied to any currently ongoing change.
Despite these differences in the direction of sound change between ONZE and QuakeBox, what we see from Table 4 and Figure 6 is relative consistency across the corpora in terms of the axes of covariation. For PC2, the answer to research question 1 is that this vowel cluster is stable and observable across multiple NZE corpora. In this PC, however, we see a change in the alignment of one of the vowels that may be linked to interim changes in the overall direction of sound change.
Again, we can test whether individual speakers are stable in their position within this covariation between QB1 and QB2, shown in Figure 7. The Spearman correlation is significant (p = .02 < .05), although much weaker than for PC1Footnote 12. If a speaker shows a particularly vertical configuration of their back vowels in QB1 they are likely to retain that pattern into QB2.
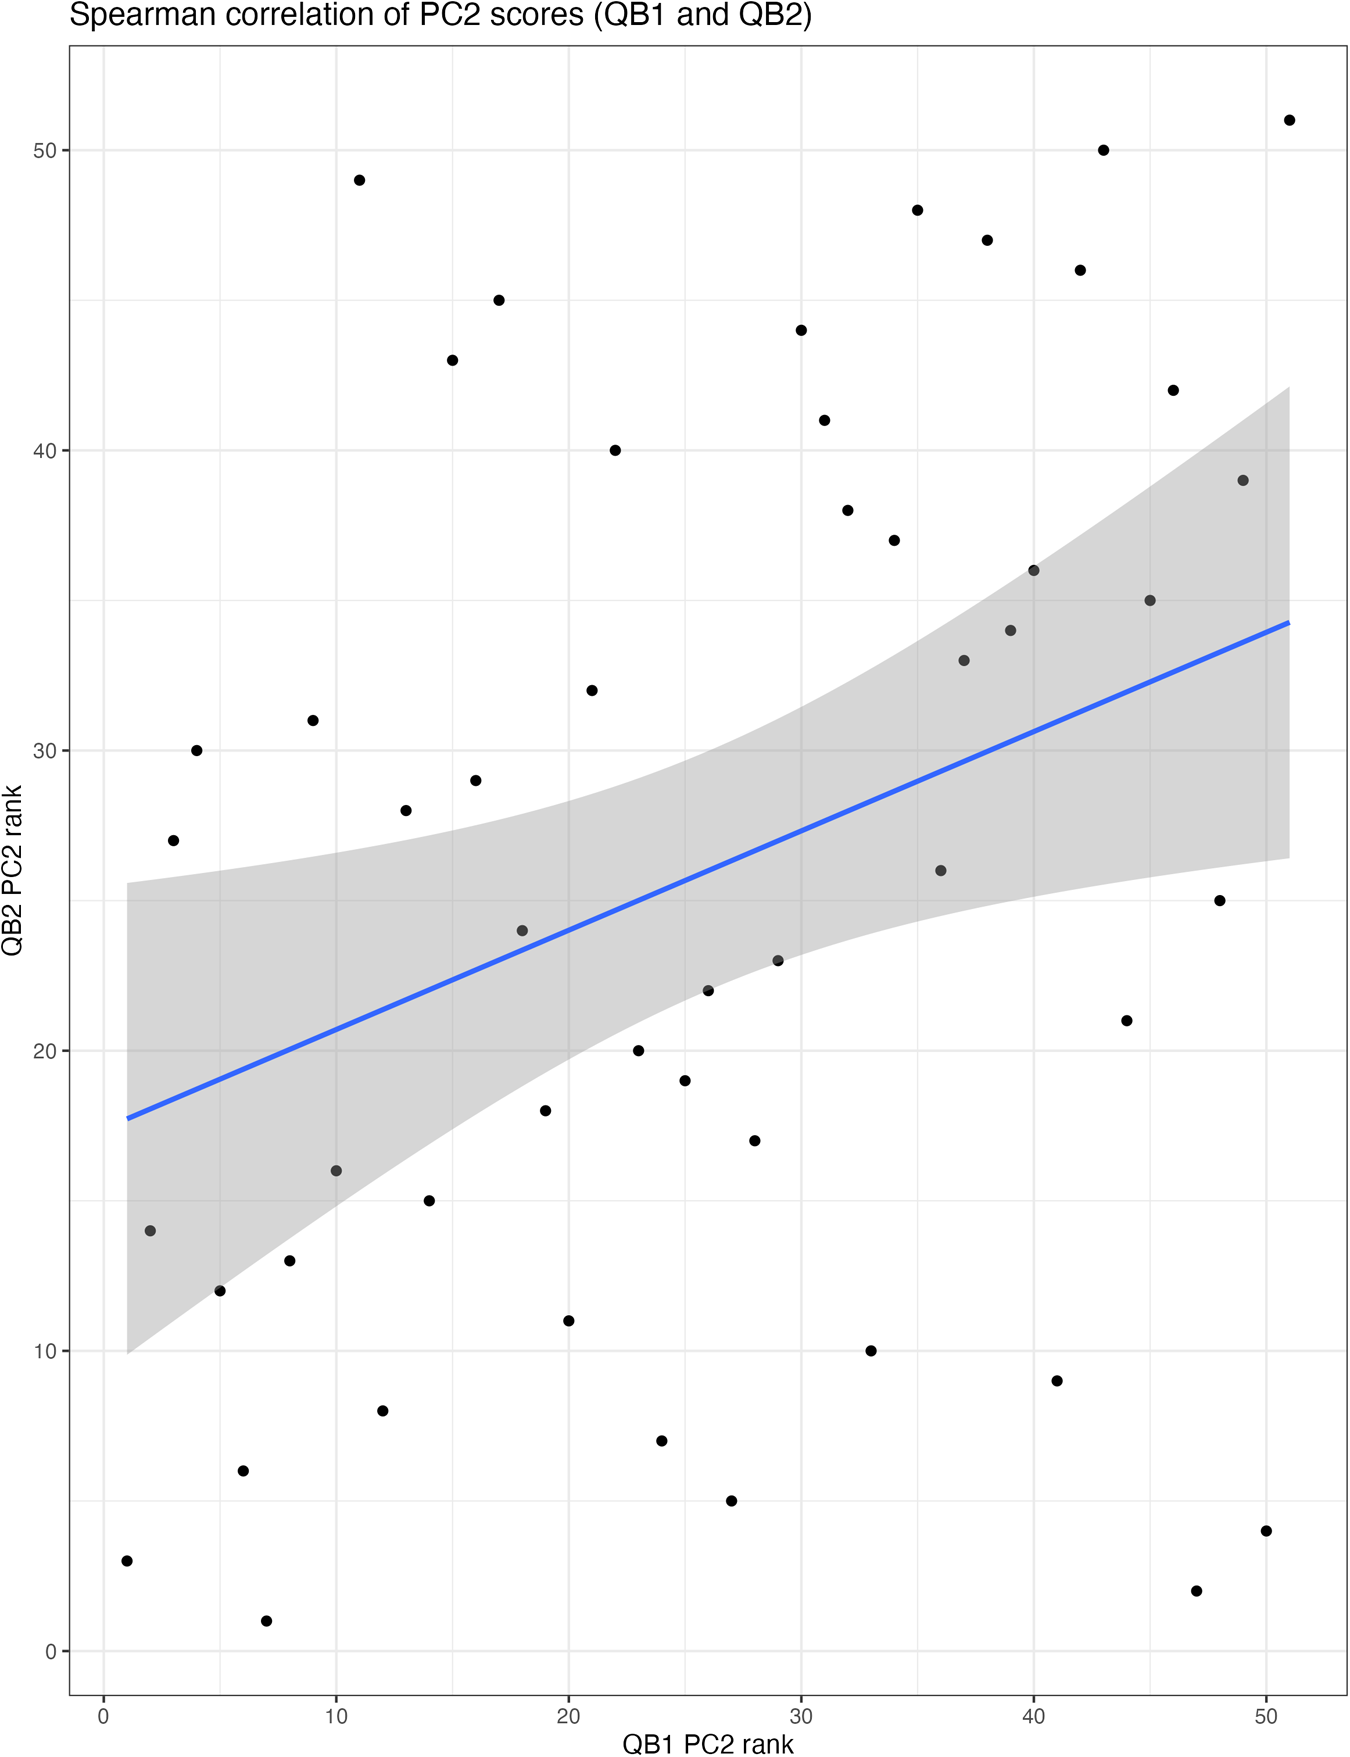
Figure 7. PC2 speaker correlations across QB1 and QB2 for the original models (rho = .33, p < .05).
The changed relevance of PC1/PC2 across corpora
As outlined above, the relative ordering of the two PCs has switched between Brand et al. (Reference Brand, Hay, Clark, Watson and Sóskuthy2021) and our analysis. In Brand et al. (Reference Brand, Hay, Clark, Watson and Sóskuthy2021), their PC1 (back vowels) accounted for 17.2% of the variation, and their PC2 (leaders and laggers) accounted for 15.8% of the variation. The two components were not dramatically different from each other in how much variation they explained. By contrast, in QB1, our PC1 (leaders and laggers) accounts for 33.1%, and PC2 (back vowels) accounts for 15.9%. QB2 is similar. It is important to note that the absolute numbers cannot be directly compared across analyses. There are many reasons why the absolute value of a PC could be different in QB1 than ONZE, including the fact that the recordings are newer and likely to be less noisy, and that only two PCs surface as reliable in that analysis. We cannot say that “leaders and laggers” has become more important, because it now explains 33.1% of the variance instead of 15.8%, nor can we say that “back vowels” have become less important. What we can conclude is that a gulf has opened between these patterns of covariation. The “leaders and laggers” cluster is now much more explanatory—compared to the back vowels—than it used to be. If we consider the patterns of changes over the history of NZE, we see that there is a history of change in the back vowels (Figure 1, panel B), but that they are relatively stable now (Figure 1, panel A). We know from our analysis that they still covary in a meaningful way. But it is possible that the weight of social meaning carried by these now relatively stable vowels is waning, and/or that the vowels represented by the leader/lagger continuum (most of which are still changing) are more meaningful at this moment in time. Our analysis, and its comparison to Brand et al. (Reference Brand, Hay, Clark, Watson and Sóskuthy2021), shows that patterns of covariation in a dialect can endure across corpora, across different recordings of the same speaker, and across evolving sound change patterns. But this does not imply that the relevance of such patterns is completely static. The fluctuation in relative importance of these clusters over time suggests that patterns of covariation can themselves be subject to change.
Additional analyses
We conducted further analyses on the QuakeBox data to investigate whether our stability is an artifact of other mechanisms such as uncontrolled social factors or repetition of content. Adding an ethnicity control into the GAMMs did not significantly change the vowel clusters. This suggests that our stability is not an artifact of the unmodeled social factor ethnicity that is a known source of variation in NZE (Maclagan et al., Reference Maclagan, Watson, Harlow, King and Keegan2009).
Additionally, parts of the QB2 corpora contain retold phrases and common lexical items due to speakers retelling their earthquake story. However, when we divided QB2 into “new” and “repeated” speech, we found no evidence that the correlation is stronger for the retold material.
We also explored whether these clusters are explainable in more universal terms. We conducted PCA on 30 speakers from an entirely different corpus, the Origins of Liverpool English corpus (Clark & Watson, Reference Clark and Watson2016), which resulted in unique PC clusters unlike those that have been found in NZE. Thus, the patterns of covariation reported in this paper and in Brand et al. (Reference Brand, Hay, Clark, Watson and Sóskuthy2021) really are patterns that relate to NZEFootnote 13.
Discussion
We have analyzed patterns of vowel covariation in a set of 51 speakers, each recorded twice (eight years apart). Our data show some differences from Brand et al.’s (Reference Brand, Hay, Clark, Watson and Sóskuthy2021) analysis in terms of the progression and, in some cases, emerging reversals of sound changes. The two time-points in our data also show some differences, with speakers significantly shifting several of the vowels between the two time-points. Our research questions relate not to these overall changes, but rather to the stability of relationships between clusters of vowels in the context of these changes. First, we asked whether patterns of vowel covariation observed with PCA are stable and replicable across multiple corpora. Using the QuakeBox corpus, we largely replicated the two major patterns of covariation reported in Brand et al. (Reference Brand, Hay, Clark, Watson and Sóskuthy2021).
Second, we asked whether speakers are stable in their position within covarying vowel clusters. Spearman correlation tests reveal that individual speakers’ PC1 and PC2 scores in QB1 are statistically predictable by their scores in QB2 (Figures 5 and 7). This effect is much stronger for PC1 than PC2. Although many of the vowels in question change significantly between the two corpora (see Figure 2), we find reasonable stability in individuals’ positions within the distribution of covariation. The stability of PC1 suggests that what counts as “innovative” might look slightly different in 2019 than 2012, but whether a speaker is “innovative” is relatively stable across the two corpora. The implication is that speakers are finely tuned in to directions of change in the community even as they age, staying in the leadership position even as the community moves in a new direction of sound change. We note that, in the context of a lifespan, the time between our two corpora (eight years) is reasonably short. Whether such high levels of stability would be observed at longer intervals is a question which would warrant further study.
Relationships between sound change and “social meaning”
PC1 links a set of vowels that have significantly changed over the history of NZE. There are few changes between the patterns of covariation picked up by Brand et al. (Reference Brand, Hay, Clark, Watson and Sóskuthy2021) and the patterns of covariation documented here, even though many of the sound changes that “leaders” were leading seem to have since been completed or reversed. This appears, then, to reflect social meaning that may have been linked with innovativeness but has remained stable beyond the momentum of the sound changes themselves. As outlined by Guy, Oushiro, and Mendes (Reference Guy, Oushiro, Mendes, Karen and Gregory2022:55), we might expect that speakers are likely to use variants together that “jointly or separately index some particular social meaning.” Once a set of covarying sound changes carries social meaning, ongoing change is not necessarily required for that social meaning to persist. It has been shown that social variation which appears to be tied to demographic features can take on more locally relevant and nuanced meanings. For example, Eckert (Reference Eckert2008:462) showed how variables that historically distinguish geographic dialects “can take on interactional meanings based in local ideology.” In the case of our sound changes, some of the social stratifications may no longer persist, but the covariation continues to exist and so it is likely that the ideological orientation associated with the covariation does too.
Eckert and Labov (Reference Eckert and Labov2017) discussed a variety of sound changes through Silverstein’s (Reference Silverstein2003:4) notion of orders of indexicality, “through which a variable can progress from indexing a social position (e.g., with a region, a class position, an ethnic group) to indexing some quality apparently associated with the people occupying that social position.” If the patterns of covariation picked up by our PCs relate to social constructs such as persona, then our results suggest that, while these may not be entirely independent of patterns of sound change, they can persist beyond the change itself.
We note that Eckert and Labov (Reference Eckert and Labov2017) explicitly excluded patterns of sound change such as vowel shifts from the type of structure likely to attract social meaning because complex sequences of sound change are not likely to be objects of social perception. Our PC1 includes not only a vowel shift but also a range of other forms that underwent change at the same time. We have demonstrated that the covariation across speakers persists over a long period of time, which we believe indicates that there is some persona-based social meaning associated with this covariation. However, to properly understand whether these patterns of covariation are picking up on stylistic persona-based variation, we need to carry out careful perceptual work.
Covariation in real and apparent time
When exploring changes in vowels over real time (Figure 2), there are some differences in the production of certain vowels in the eight-year gap between QB1 and QB2. Let us suppose that these are due to vowel changes that take place over the lifespan of the speakers (rather than stylistic differences between the two corporaFootnote 14). The fact that these changes in real time are present is not unexpected. Gillian Sankoff and Blondeau (Reference Sankoff and Blondeau2007) showed that individuals can continue to change their linguistic production post-adolescence in the direction of the community in a process known as “lifespan change.” G. Sankoff and Wagner (Reference Sankoff and Wagner2006) also described “retrograde change,” where speakers move away from the direction of community change over time and adopt more conservative variants with age. We may have evidence of both lifespan and retrograde change in our data, although we note that to fully untangle what is going on with these individual vowels, a more detailed study would be needed, including investigation of the degree to which speakers of particular age-groups may be disproportionally responsible for these changes. In our apparent time data (Figure 1, panel A), fleece is lowering and kit is beginning to raise after a period of lowering. In our real-time data (Figure 2), both men and women now have lower fleece realizations than they did eight years ago, and men are raising their kit vowels, following the most recent community innovations. These are two examples of potential lifespan change. We can also see in our apparent time data that goose is beginning to raise for the youngest women, but in our real-time data, women now have a lower goose realization than they did eight years ago. This is a potential example of retrograde change.
Work on change across the lifespan has mainly focused on exploring variation and change in single linguistic variables. Our work shows that while there may be differences in the rate and direction of change of individual vowels when we compare apparent time with real-time data, the speakers’ axes of covariation remain relatively stable over time, even as the vowels which make up the cluster of covariation changes over the same time-period. A speaker who was a “leader” (or produced more innovative articulations) in the cluster of sound changes represented by PC1 in 2012 is still a “leader” in 2020, eight years later.
Beaman and Sering (Reference Beaman, Sering, Karen and Gregory2022) explored sociolectal coherence over real and apparent time in two German communities (Stuttgart and Schwäbisch Gmünd). The real-time data came from 20 speakers who were interviewed in 1982 and again in 2017, and an apparent time set of “social twins” (i.e., speakers who are matched for age, sex, education, and location with the real-time speakers). A PCA was conducted on data from 20 linguistic variables and variation was documented between pairs of PCs (e.g., participants PC1 score from 1982 is plotted against their PC2 score from 1982, etc.). These were then used to calculate measures of dialect coherence. The real-time findings suggest that the 1982 Schwäbisch Gmünd speakers showed the most coherence with little variation and no overlap in the PCs between Schwäbisch Gmünd and Stuttgart. By 2017, however, both dialects showed less cohesion (i.e., greater variability) and there was overlap in the PCs, which Beaman and Sering attributed to dialect contact with speakers now “juggling” and “mixing” these two different varieties. The apparent time analysis tells a largely congruent story. This work confirms the importance of using PCA as a tool to understand clusters of variation in both real and apparent time, but because participants’ PC scores from 1982 were not correlated against their PC scores from 2017, we are unable to tell whether the results from Beaman and Sering (Reference Beaman, Sering, Karen and Gregory2022) match our own with respect to the stability of a participant’s position along the axis of variation for a particular cluster or PC.
In summary, “there is clearly much we still do not know about co-variation in real and apparent time, and very little we know about co-variation over the course of an individual’s lifetime” (Sheard, Reference Sheard2023:63). We are left with substantial questions. For instance, if the position of an individual vowel changes in real time, but both the clusters and the individual’s position on the axes of variation remains stable, what are the implications for social meaning? If patterns of covarying variables carry social meaning, do listeners track covariation and are they aware of patterns of relationships between phonetic variants?
Conclusion
The findings of this paper contribute to our understanding of lifespan variation and real-time change in a covariation context. The nature of the relationships between the vowels appears to be more stable over time than the specific realizations of the individual vowels themselves. Furthermore, individual speakers’ positions within the axes of covariation are also relatively stable over time. It seems very likely that these patterns of observed covariation are socially meaningful, consistent with arguments put forward by Eckert, that “sociolinguistic variables do not occur independently, but as components of styles” (Eckert, Reference Eckert2019:752). A major question yet unanswered is the degree to which this social meaning is accessible to the listener. This is an important question for future work.
Supplementary material
The supplementary material for this article can be found at https://nzilbb.github.io/qb_stability_public/markdown/QB-analysis.html.
Acknowledgements
This research was funded primarily by the University of Canterbury’s Aho Hīnātore scholarship. Additional funding was made available from Marsden Fund Grants from the Royal Society of New Zealand (21-UOC-107; 20-UOC-064).
Competing interests
The authors have no competing interests to declare.


 Open access