


Non-technical Summary
Toothed whales (e.g., orcas and sperm whales) use high-frequency sounds to echolocate, while baleen whales (e.g., humpback and bowhead whales) communicate using low-frequency sounds. Here, we build on previously established methods showing how functionally relevant features of cochlear (inner ear) morphology can help paint a robust picture of a species’ hearing ability. Early Eocene cetaceans may have specialized in low-frequency hearing, which coincided with the appearance of new sound conduction pathways. This likely proved essential to the development of higher-frequency underwater hearing in protocetids and the later ultra-high-frequency echolocation of modern toothed whales. The common ancestor of modern whales likely did not possess hearing abilities similar to either of the two modern suborders. While increases in cetacean brain size do not correlate with shifts toward high-frequency hearing, we cannot rule out a lack of connection to other aspects of hearing ability, particularly echolocation. Even ancient cetaceans may have possessed the capacity for complex vocalizations and communication, as well as basic echolocation.
Introduction
The transition from terrestrial to fully aquatic lifestyles necessitated profound changes in cetacean sensory systems. The auditory apparatus requires distinct adaptations for optimal function in water as opposed to air due to differences in the sound transmission characteristics of the two media. Modern cetaceans have not only adapted their auditory system for aquatic environments, but have become adept at using sound: odontocetes developed ultra-high-frequency hearing and sophisticated echolocation, while mysticetes developed complex low-frequency songs used for intraspecific communication.
Cetacean evolution is well documented by numerous well-preserved fossils (Thewissen et al. Reference Thewissen, Williams, Roe and Hussain2001, Reference Thewissen, Cooper, Clementz, Bajpai and Tiwari2007). These show stepwise changes in the auditory system toward increasing adaptation for underwater hearing through the Eocene (Nummela et al. Reference Nummela, Thewissen, Bajpai, Hussain and Kumar2004, Reference Nummela, Thewissen, Bajpai, Hussain and Kumar2007). Many previous studies have made significant progress toward understanding cetacean auditory capabilities based on identifying morphological correlates in modern species (Fleischer Reference Fleischer1976; Ketten Reference Ketten, Webster, Popper and Fay1992; Ekdale and Rowe Reference Ekdale and Rowe2011; Geisler et al. Reference Geisler, Colbert and Carew2014; Ekdale and Racicot Reference Ekdale and Racicot2015; Churchill et al. Reference Churchill, Martinez-Caceres, de Muizon, Mnieckowski and Geisler2016; Park et al. Reference Park, Fitzgerald and Evans2016; Mourlam and Orliac Reference Mourlam and Orliac2017; Racicot et al. Reference Racicot, Boessenecker, Darroch and Geisler2019; Racicot Reference Racicot2022); however, many of the features studied do not have a direct causal connection to auditory physiology, even though they are correlated. This has led different authors to come to contradictory conclusions regarding frequency specializations, with some suggesting that late Eocene cetaceans are high-frequency specialized (Churchill et al. Reference Churchill, Martinez-Caceres, de Muizon, Mnieckowski and Geisler2016), low-frequency specialized (Ekdale and Racicot Reference Ekdale and Racicot2015), or unspecialized (Mourlam and Orliac Reference Mourlam and Orliac2017).
Morphological features of the cochlea that do have well-defined links to function include the laminar gap and the size of Rosenthal’s canal (Fig. 1). The development of the bony spiral laminae, concurrent with cochlear coiling, was an important innovation toward the evolution of high-frequency hearing in therian mammals (Ruf et al. Reference Ruf, Luo, Wible and Martin2009; Luo et al. Reference Luo, Ruf, Schultz and Martin2011). These spiral laminae provide a more rigid support for the basilar membrane (on which rests the sensory epithelium). The gap between the spiral laminae (the laminar gap [Geisler and Luo Reference Geisler and Luo1996] or basilar gap [Fleischer Reference Fleischer1976]) is indicative of the width of the basilar membrane and its supporting tissue, and this is directly and causally related to frequency perception. All else being equal, a wider membrane is more responsive to lower frequencies and a narrower membrane to higher frequencies. The laminar gap widens from the cochlear base to its apex and is one of the characters that gives the cochlea its tonotopic organization (Von Békésy Reference Von Békésy1960).
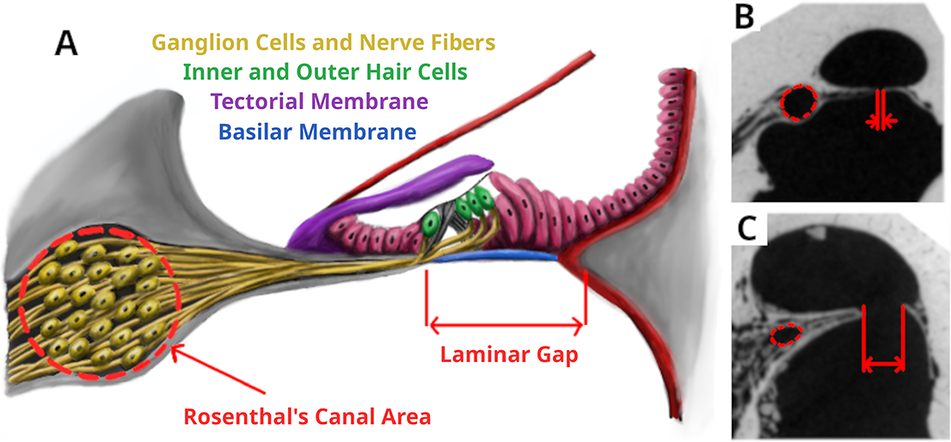
Figure 1. Morphological measurements of the cochlea. A, Anatomical features of the organ of corti with the variables we measured marked. B and C, Example CT slices in Kogia breviceps and Antilocapra americana with the measurements marked.
Rosenthal’s canal (sometimes referred to as the spiral ganglion canal) is an oval tube found within the primary spiral lamina, which contains the ganglion cells. These relay signals from the inner hair cells to the cochlear nucleus. Larger canals will support more ganglion cells (Johnson et al. Reference Johnson, Schmitz and Santi2011), which will determine the ratio of ganglion cells to hair cells: a larger ratio allowing for more sophisticated processing of auditory information including improved frequency discrimination (Wever et al. Reference Wever, McCormick, Palin and Ridgway1971; Luo and Marsh Reference Luo and Marsh1996). A greatly enlarged canal, with a correspondingly larger number of ganglion cells, has long been noted for echolocating odontocetes (Sensor et al. Reference Sensor, Suydam, George, Liberman, Lovano, Rhaganti, Usip, Vinyard and Thewissen2015).
These two measures, laminar gap and Rosenthal’s canal area, are therefore not only correlated to hearing ability, but a direct causal relationship is known. Thus, appropriate measurement of them could allow for well-supported interpretations of a species’ hearing.
A clearer understanding of hearing in fossil cetaceans is of value in interpreting cetacean brain-size evolution. It is well known that cetaceans have large, complex brains, including the largest brain sizes in absolute terms. Many species, particularly delphinoid odontocetes, have brain sizes relative to body mass that are among the largest of all species, while mysticete whales have some of the lowest relative brain sizes. This observation has attracted considerable attention, and high-frequency echolocation has been proposed as one of the major drivers of increased encephalization (Ridgway Reference Ridgway, Schusterman, Thomas and Wood1986; Ridgway and Au Reference Ridgway, Au and Squire2009). Different studies have drawn different conclusions on this matter, and alternative hypotheses have been proposed, for example, that encephalization was driven by increased cognitive abilities and complex social structures (Delfour and Marten Reference Delfour and Marten2001; Marino et al. Reference Marino, Connor, Fordyce, Herman, Hof, Lefebvre and Lusseau2007; Fox et al. Reference Fox, Muthukrishna and Shultz2017).
Numerous studies have made valuable contributions to understanding cetacean brain-size evolution, including the pioneering work of Marino et al. (Reference Marino, McShea and Uhen2004), which has been built upon by various authors (e.g., Montgomery et al. Reference Montgomery, Geisler, McGowen, Fox, Marino and Gatesy2013; Boessenecker et al. Reference Boessenecker, Ahmed and Geisler2017; Waugh and Thewissen Reference Waugh and Thewissen2021). One major gap in our understanding is the lack of available data for some of the earliest cetaceans; thus a complete picture of encephalization across all cetaceans has not been reported. This is particularly critical in investigating whether evolutionary increase in brain size is related to the origin of high-frequency echolocation, as some evidence suggests that even the earliest odontocetes, near the Eocene/Oligocene boundary, were echolocators (Park et al. Reference Park, Fitzgerald and Evans2016).
In this study, we report measurements of the laminar gap and Rosenthal’s canal in extant and fossil cetaceans, as well as a wide range of other therian mammals, to infer the hearing ability in Eocene cetaceans. We further report new measurements and analysis of Eocene cetacean brain sizes and examine these data alongside hearing ability to consider the relationship between the two. We thus present our hypothesis charting the evolutionary trajectory of cetacean hearing and brain size.
Materials and Methods
CT Imaging
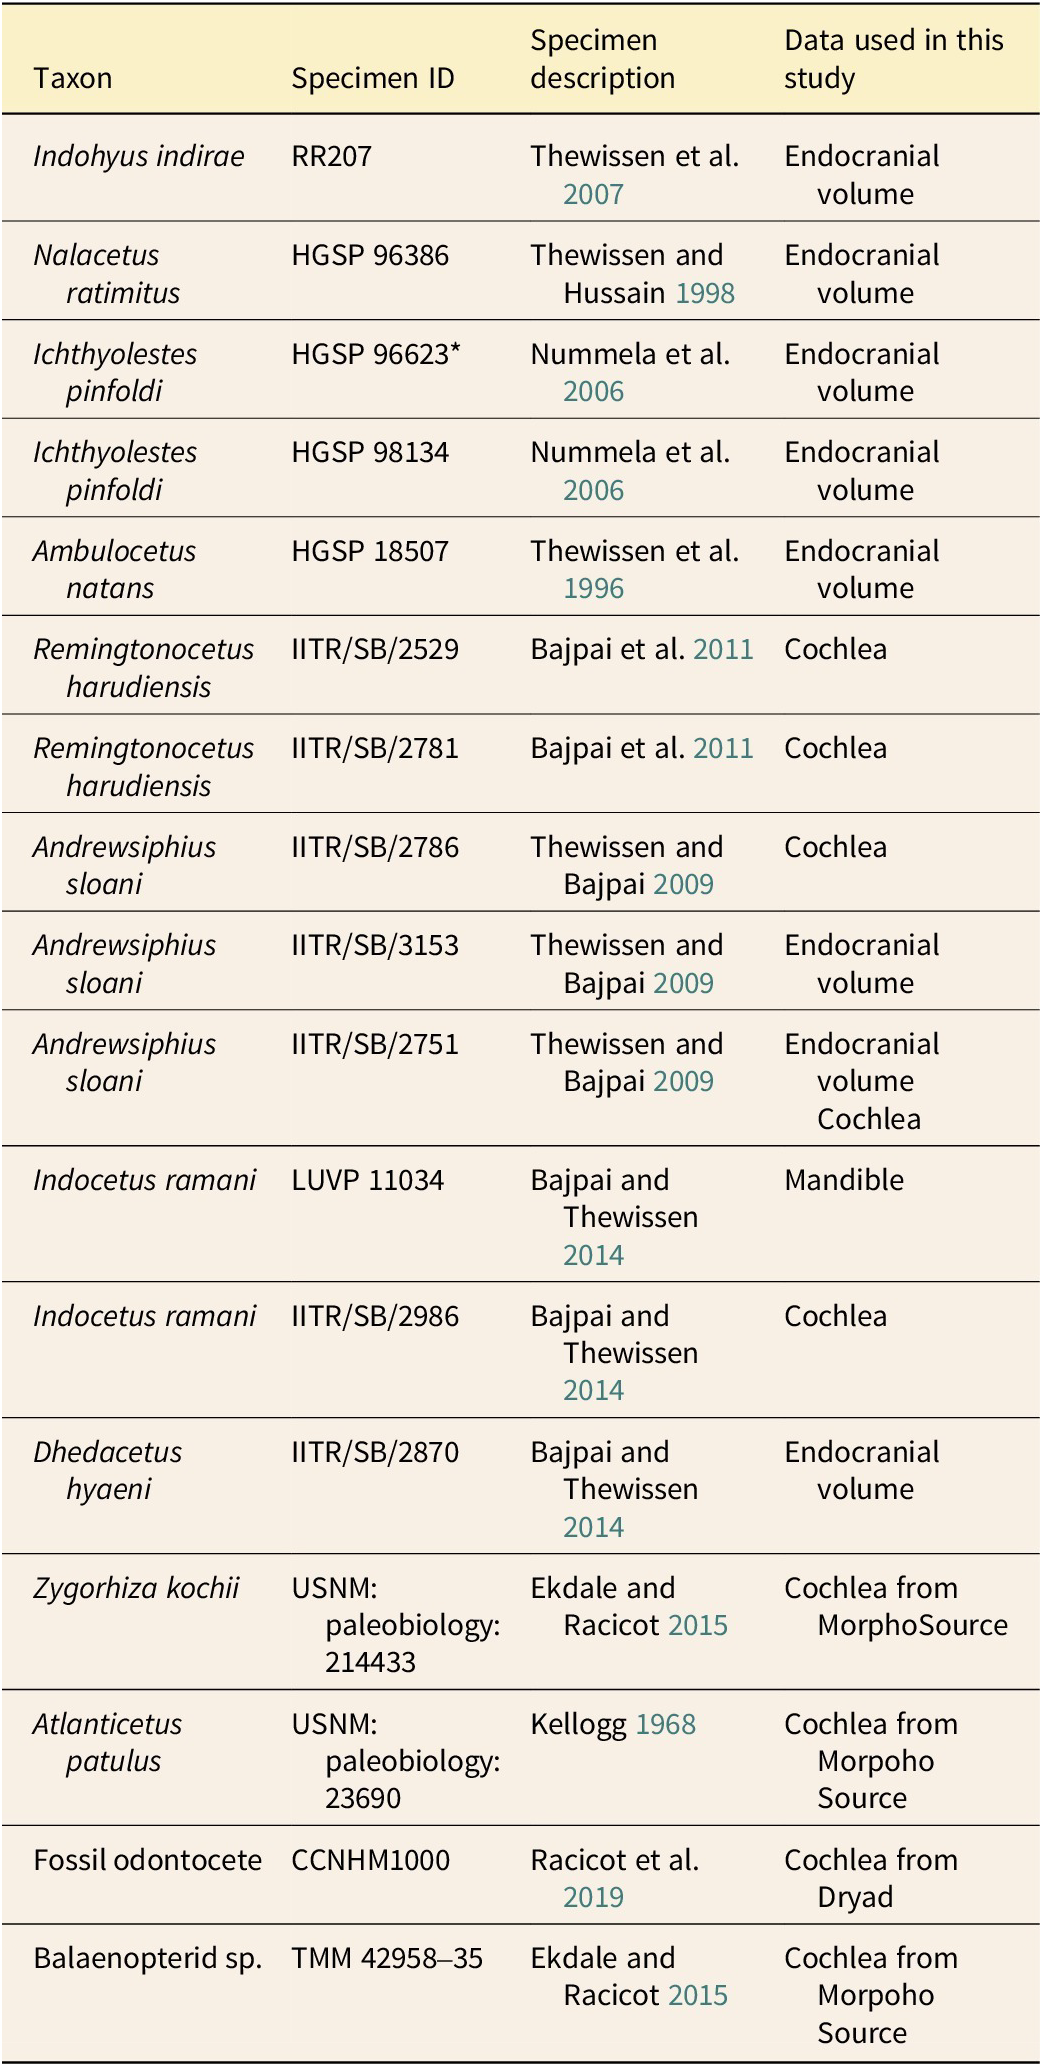
We studied inner ear morphology using micro-computed tomography (μCT) imaging. Specimens were scanned using a Skyscan 1273 (Bruker, Billerica, MA, USA) with scanning parameters being optimized to achieve maximum resolution and contrast for each individual specimen. Additional scan data from previous published studies were downloaded from MorphoSource and Dryad. A list of fossil specimens and corresponding ID numbers is given in Table 1.
Table 1. List of fossil specimens examined and the type of data gathered for each. Unless a different source is noted in the table, all specimens were scanned/examined specifically for this study as described in the methods. *HGSP 99623 was identified as a juvenile Pakicetus attocki in Nummela et al. (Reference Nummela, Hussain and Thewissen2006).
Cochlear Morphology
For measurements of cochlear morphology, we marked the tip of the primary spiral lamina along its full length before fitting a line to this using the spline function in Avizo 3D Pro (Thermo Fisher Scientific, Waltham, MA, USA). We took the length of this line as the length of the basilar membrane.
Using the trajectory feature in Avizo, we can define slices through the data that sit perpendicular to our line. We used this to extract 50 equally spaced slices running from the cochlea’s base to its apex. From each slice, we made measurements of the gap between the primary spiral lamina and the secondary spiral lamina (where present) or the wall of the cochlea (Geisler and Luo Reference Geisler and Luo1996), as well as the cross-sectional area of the Rosenthal’s canal. If the spiral lamina was broken at any location, the value for this point was marked as missing data. All length and area data were gathered using ImageJ (Schindelin et al. Reference Schindelin, Arganda-Carreras, Frise, Kaynig, Longair, Pietzsch and Preibisch2012).
Endocranial Volume and Body Mass
Endocranial volume was calculated from μCT data using Avizo 3D Pro. Specimens of Nalacetus, Andrewsiphius, Ambulocetus, and Dhedacetus were scanned using the same Skyscan 1273 (Bruker, Billerica, MA, USA) as the ears, while specimens of Indohyus, and Ichthyolestes were scanned using an EasyTom 150 μCT scanner at the Montpellier Rio Imaging platform at the University of Montpellier (Orliac and Thewissen Reference Orliac and Thewissen2021). We digitally segmented the endocranial volume and then used the surface area volume calculation in Avizo to determine a volume. Measurements of occipital condyle width (used to estimate body mass) were made manually using calipers. Additional brain- and body-mass measurements were taken from (Waugh and Thewissen Reference Waugh and Thewissen2021).
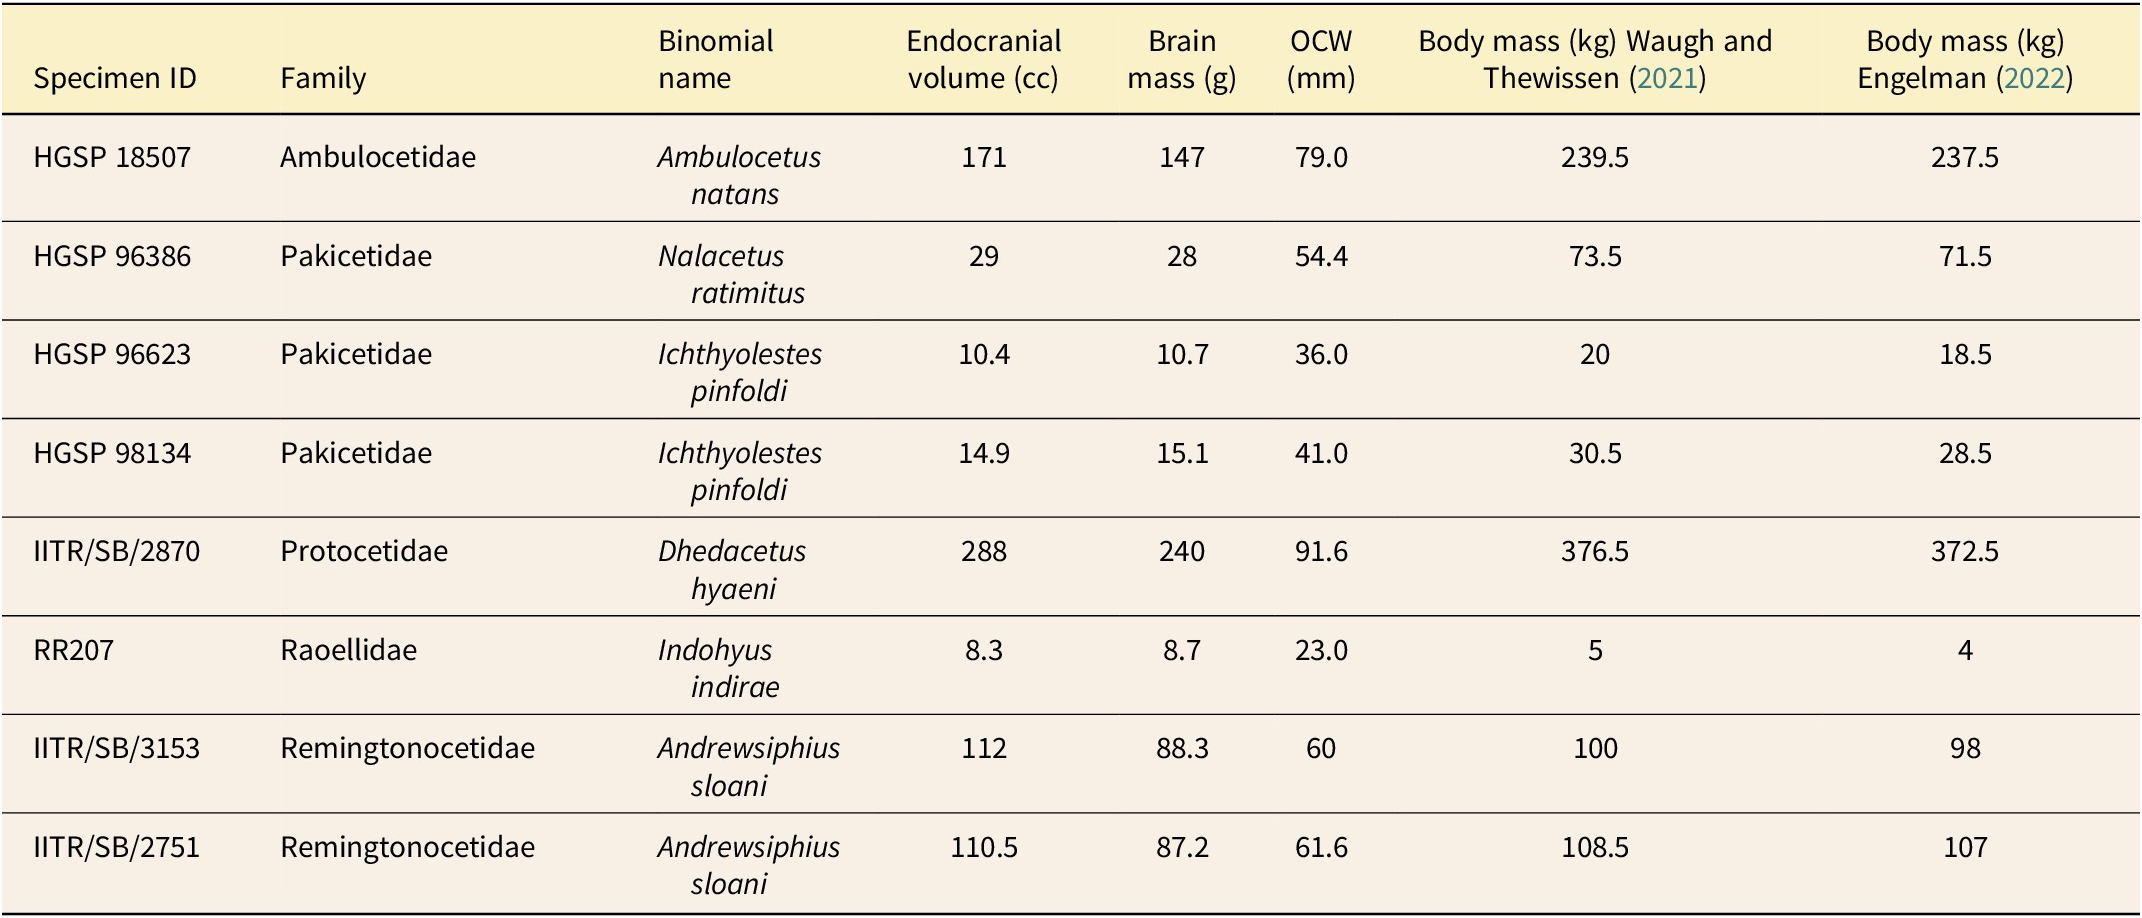
The relationship between occipital condyle width and body mass was obtained from other published studies. As shown by Waugh and Thewissen (Reference Waugh and Thewissen2021), the relationship between occipital condyle width and body mass is different for delphinoid odontocetes compared with all other whales: the equation used by Marino et al. (Reference Marino, McShea and Uhen2004), as reported in Boessenecker et al. (Reference Boessenecker, Ahmed and Geisler2017), gives a good fit for delphinoids but not for other whales. The study by Engelman (Reference Engelman2022) examined a large set of terrestrial mammals and found a relationship that is very similar to that from Waugh and Thewissen (Reference Waugh and Thewissen2021) for non-delphinoid cetaceans. We therefore use the equations from Marino et al. (Reference Marino, McShea and Uhen2004)/Boessenecker et al. (Reference Boessenecker, Ahmed and Geisler2017) for delphinoids, Waugh and Thewissen (Reference Waugh and Thewissen2021) for non-delphinoid cetaceans, and Engelman (Reference Engelman2022) for terrestrial species. For our new measurements on early cetaceans, we calculate body mass using both Waugh and Thewissen (Reference Waugh and Thewissen2021) and Engelman (Reference Engelman2022) (see Table 2).
Table 2. New measurements on brain and body size in early Eocene cetaceans. Body mass was calculated from occipital condyle width (OCW) using the equations from Waugh and Thewissen (Reference Waugh and Thewissen2021) and Engelman (Reference Engelman2022). Brain mass was calculated from endocranial volume using the equation from Waugh and Thewissen (Reference Waugh and Thewissen2021). Note that this equation overestimates the brain mass for very small volumes; this means that the relative brain size values are likely also overestimated and suggests that the increase in brain size we observed is even greater than shown in Fig. 4.
Audiogram Data
We gathered behavioral audiogram data from several published studies (Wollack Reference Wollack1963; Dalland Reference Dalland1965; Heffner and Masterton Reference Heffner and Masterton1980; Heffner and Heffner Reference Heffner and Heffner1985a,Reference Heffner and Heffnerb, Reference Heffner and Heffner1990, Reference Heffner and Heffner1992, Reference Heffner and Heffner2010; Frost and Masterton Reference Frost and Masterton1994; Heffner et al. Reference Heffner, Heffner, Contos and Ott1994, Reference Heffner, Koay and Heffner2001; Jackson et al. Reference Jackson, Heffner and Heffner1997; Koay et al. Reference Koay, Heffner and Heffner1997, Reference Koay, Bitter, Heffner and Heffner2002; Kastak and Schusterman Reference Kastak and Schusterman1998; Gerstein et al. Reference Gerstein, Gerstein, Forsythe and Blue1999; Flydal et al. Reference Flydal, Hermansen, Enger and Reimers2001; Kastelein et al. Reference Kastelein, Bunskoek, Hagedoorn, Au and de Haan2002, Reference Kastelein, Wensveen, Hoek, Verboom and Terhune2009; Finneran et al. Reference Finneran, Carder, Dear, Belting, McBain, Dalton and Ridgway2005; Branstetter et al. Reference Branstetter, St Leger, Acton, Stewart, Houser, Finneran and Jenkins2017). Our sample did not include audiograms acquired using evoked potentials, as these generally result in higher thresholds (Yuen et al. Reference Yuen, Nachtigall, Breese and Supin2005) and are not directly comparable with behavioral data. We took the hearing range of each species to be the highest and lowest frequency it perceived at a sound pressure level of 60 dB SPL (re: 20 μPa). Audiograms measured underwater are normally reported with a reference value of 1 μPa, and water has a far greater density and acoustic impedance than air. Thus, we applied a correction subtracting 62 dB from the underwater audiogram data for greater comparability (thus data are effectively taken at 122 dB re 1 μPa in water). We chose to take data at 60 dB (approximately the level of normal human conversation), as this is the most common level used to define hearing range for comparative purposes.
The species chosen cover 19 family-level clades (including 8 artiodactyls, 4 carnivorans, 3 chiropterans, 2 marsupials, 1 lagomorph, 1 primate, 6 rodents, and 1 sirenian). We interpolated between measured values to find the highest and lowest frequency each species could detect at 60 dB (re: 20 μPa). Separate air and underwater audiograms are available for the harbor seal (Phoca vitulina), and we used both.
Data Analysis and Plotting
We performed phylogenetic generalized least squares (PGLS) regression analyses on log-transformed data using the caper package (Orme Reference Orme2013) in R (R Core Team Reference Team2023), with phylogenies based on Upham et al. (Reference Upham, Esselstyn and Jetz2019) and a simultaneous maximum-likelihood estimation of lambda. To calculate the relationship between high-frequency hearing limit and laminar gap, the data input were the mean value of the laminar gap for the basal third of the cochlea or the mean gap at the apical 10%, and both the highest and lowest audible frequency as described in the audiogram data section. The mean laminar gap for high frequencies is thus the mean of the first 17 of 50 slices (counting from base to apex), and for low frequencies it is the mean of the last 5 slices. For the brain- and body-size analysis, the data input only included extant species. The residuals were then calculated for all specimens, including fossils, and this was taken as the relative brain size. All figures were plotted using ggplot2 (Wickham Reference Wickham and Wickham2016) in R.
Institutional Abbreviations
CCNHM: Mace Brown Museum of Natural History, Charleston, SC, USA; HGSP: Howard University–Geological Survey of Pakistan, Islamabad, Pakistan; IITR-SB: Indian Institute of Technology, Roorkee/Sunil Bajpai, Roorkee, India; LUVP: Lucknow University–Vertebrate Palaeontology, Lucknow, India; RR: Rao Obergfell Trust for Geosciences, Dehradun, India; USNM: U.S. National Museum, Smithsonian Institution, Washington, DC, USA; TMM: Vertebrate Paleontology Laboratory, Jackson School of Geosciences, University of Texas at Austin, Austin, TX, USA.
Results
The Relationship between Laminar Gap and Hearing Ability
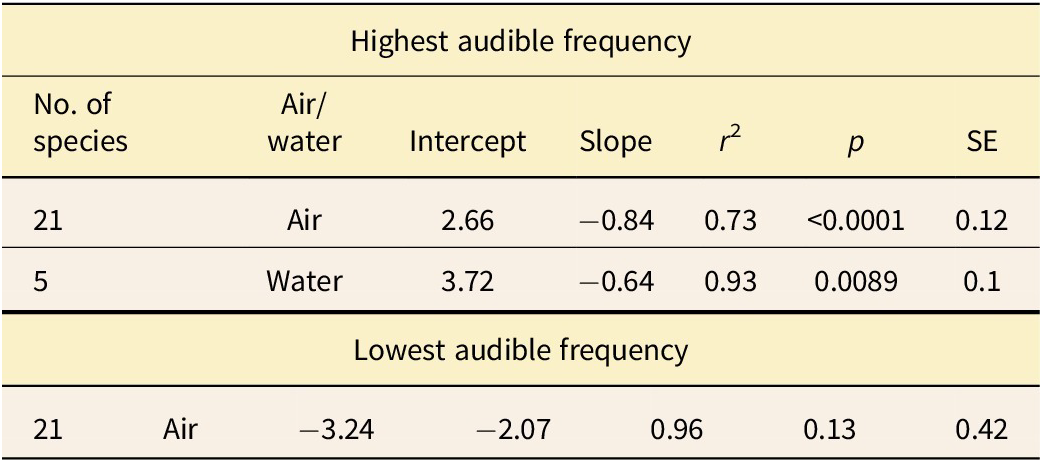
Our measurements show a strong, significant correlation between the mean width of the laminar gap around the cochlea’s basal region and a species’ highest audible frequency (Fig. 2A, Table 3). A clear difference is seen between aquatic and terrestrial species, and thus each group was treated separately when performing the regression analysis (see “Discussion”). Results for aquatic species are less significant than the results for terrestrial animals due to the lower number of available species with audiograms. A strong but less significant correlation is found between the width of the laminar gap at the apical end and the lowest audible frequency for hearing in air (Fig. 2B, Table 3).
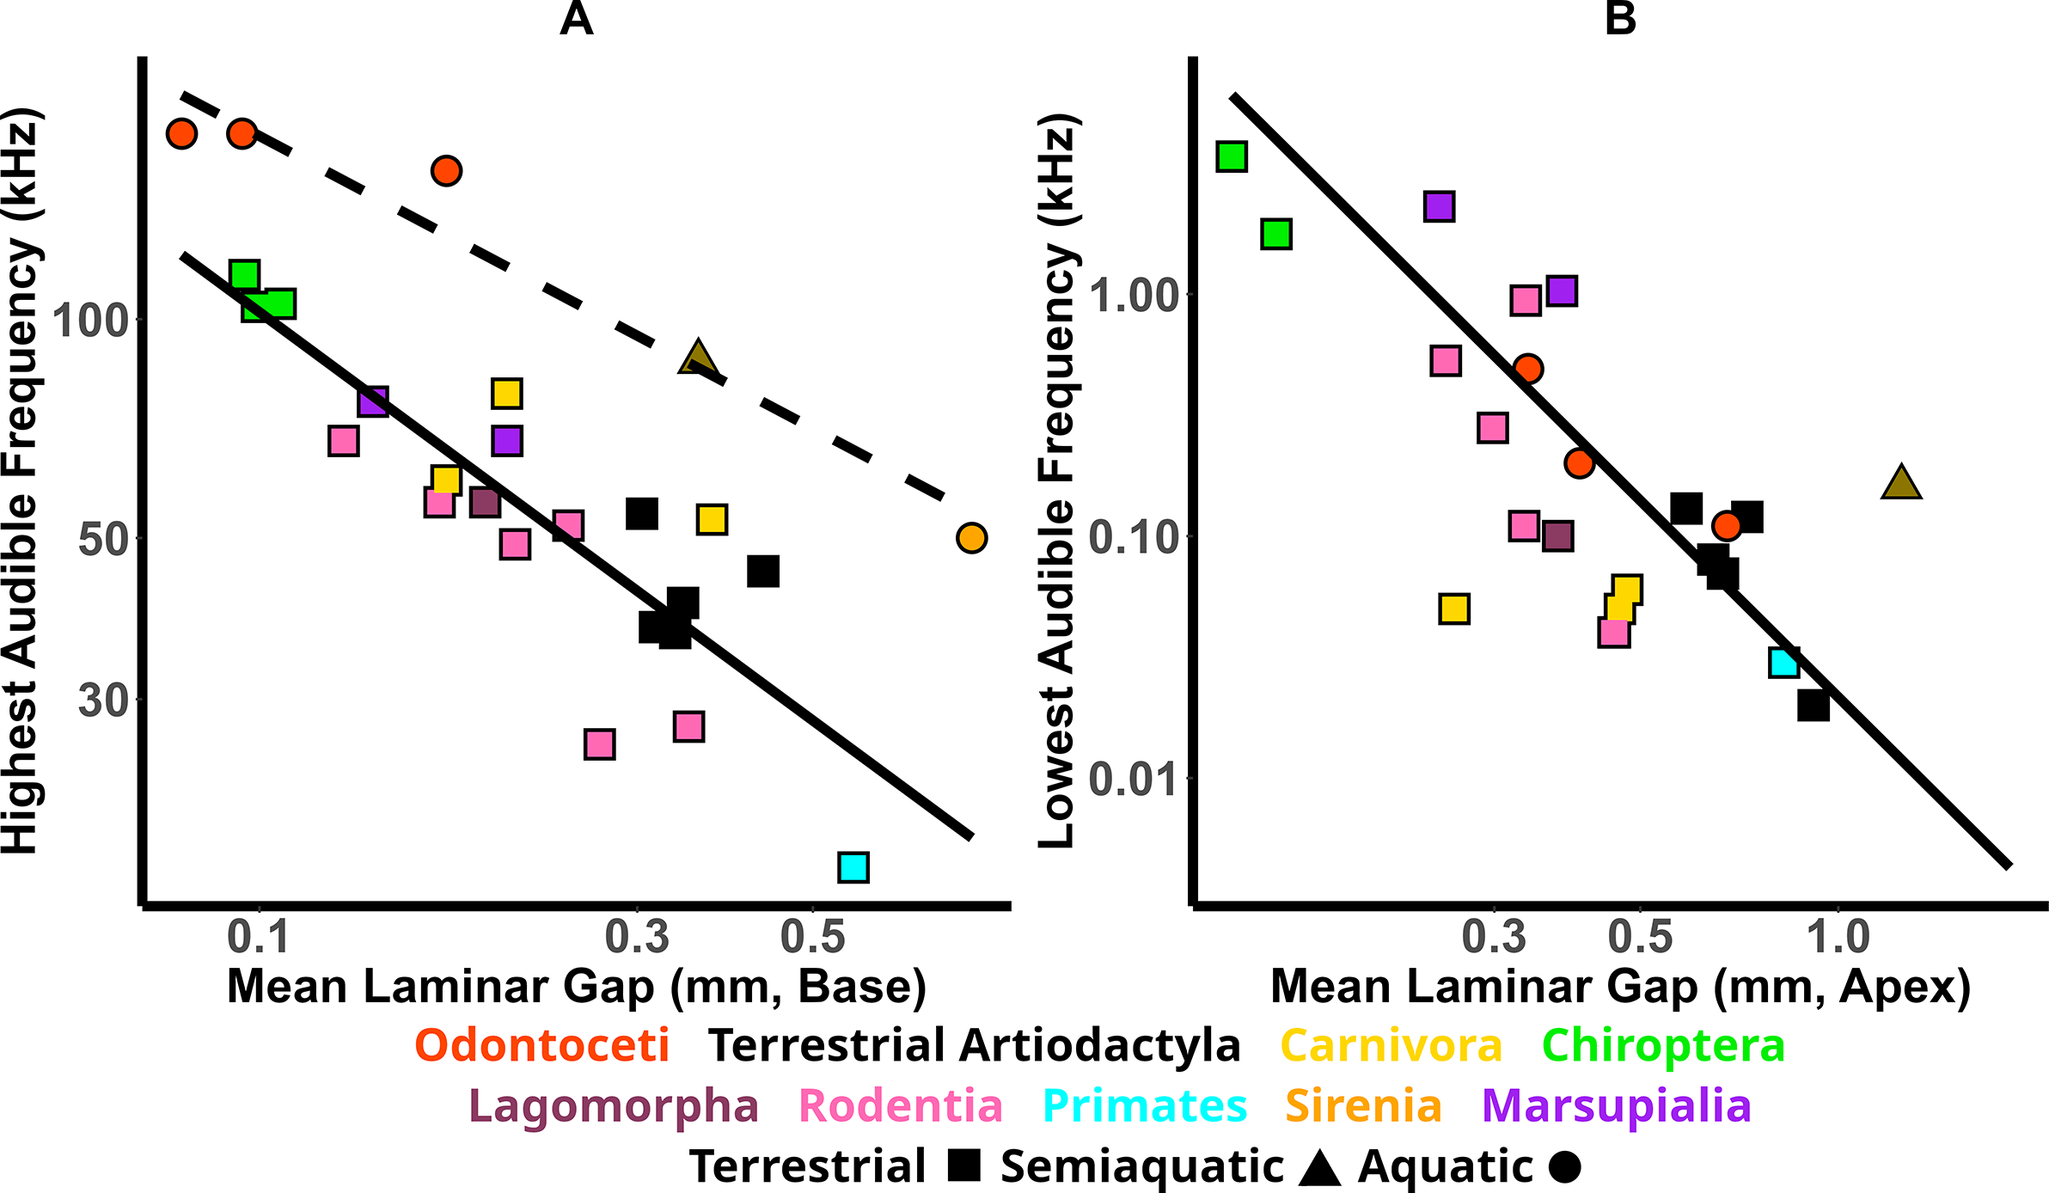
Figure 2. The relationship between the laminar gap, measured from CT data, the highest audible frequency (A), and the lowest audible frequency (B), as taken from behavioral audiogram data, for a broad taxonomic sample of mammals. The solid lines show the results of the phylogenetic generalized least squares (PGLS) regressions, including terrestrial species, while the dashed line shows the results of the PGLS regression including aquatic species, and each point represents a different species. Different clades are distinguishable by color, and terrestrial and aquatic species can be distinguished by shape as indicated.
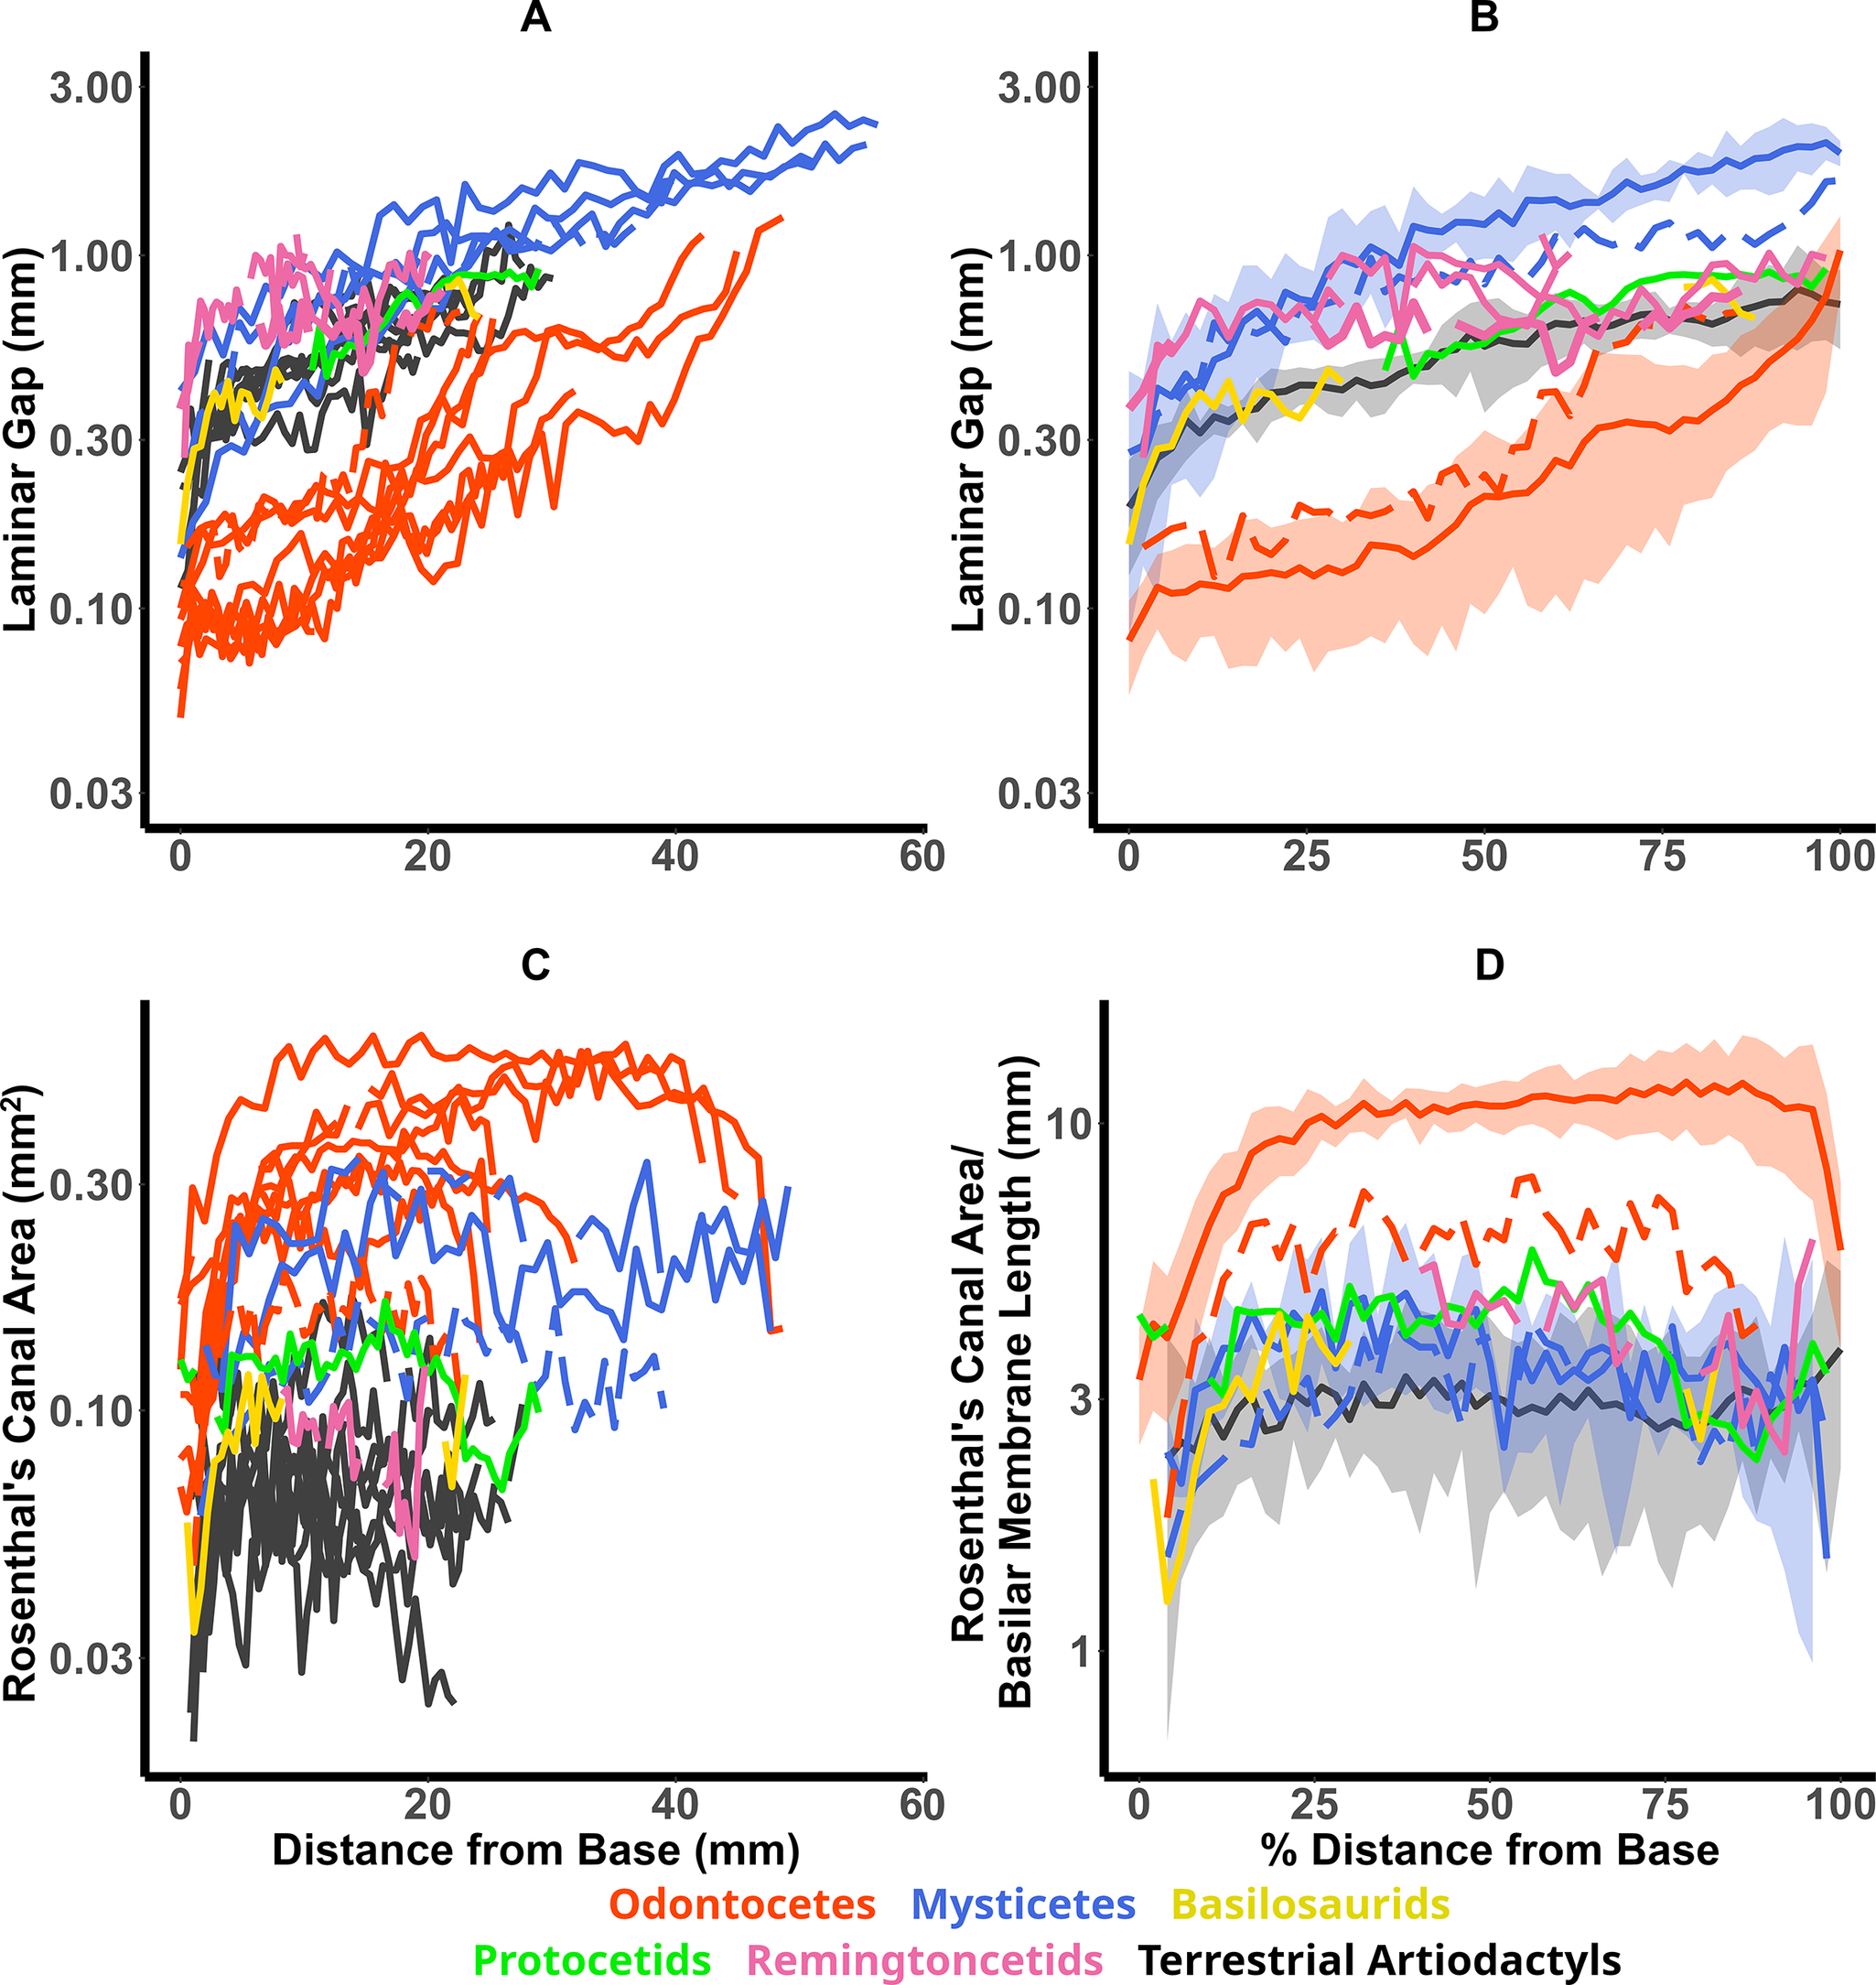
Figure 3. The width of the laminar gap is plotted against the absolute distance from the cochlea’s base (A) and as a percentage distance from base to apex (B) for all measured artiodactyls (including cetaceans). The absolute values of Rosenthal’s canal cross-sectional area against absolute distance from the base is plotted in C, while D shows the canal area normalized to basilar membrane length (as a proxy for overall size of the cochlea) against percentage distance from base to apex. Different taxa are distinguished by color. The two dashed lines represent a fossil odontocete and a fossil mysticete (see Table 1). In B and D, the mean values were calculated for extant species and plotted as a solid line, with a shaded area indicating 1 SD either side of the mean.
Table 3. Results of the phylogenetic generalized least squares (PGLS) regression analyses plotted in Fig. 2.
Laminar Gap in Artiodactyls
Width profiles of the laminar gap along the entire cochlea show that groups of modern artiodactyls are distinguishable (Fig. 3A,B). High-frequency echolocating odontocetes have a distinctly narrower laminar gap for a longer segment of the cochlea compared with modern terrestrial artiodactyls. By contrast, low-frequency hearing mysticetes have, on average, wider laminar gaps than the terrestrial species, although the bowhead and humpback do overlap with terrestrial species near the base. Together, these morphological features allow a robust interpretation of frequency specializations during the Eocene evolution of cetaceans.
The earliest-diverging branches of the cetacean phylogenetic tree, pakicetids and ambulocetids, do not have cochleas with well-preserved laminar gaps; however, we found better preservation in the cochleas of some remingtonocetids. The basal part of the laminar gap of the remingtonocetids is wider than that of terrestrial artiodactyls (Fig. 3A,B) and similar to that of mysticetes, possibly indicating a shift toward specialization for detecting lower-frequency sounds. Thus, based on laminar gap width, the hearing ability of these species is expected to be similar to that of modern mysticetes. It must be noted that preservation in some taxa is potentially subject to errors, particularly around the basal region, which is the most easily damaged area. This would result in an overestimation of the width of the laminar gap.
Our measurements in middle and late Eocene protocetids (Indocetus ramani) and basilosaurids (Zygorhiza kochii) indicate that they also lack the high-frequency specializations found in odontocetes; for these species, the laminar gap profile bears greater similarity to that of terrestrial artiodactyls.
Rosenthal’s Canal Area
The cross-sectional area of Rosenthal’s canal is largest in absolute terms in odontocetes, with the largest found in the beluga, although the humpback and bowhead compete in absolute size with many odontocetes (Fig. 3C). However, when normalized to the length of the basilar membrane (as a correction for absolute size), Rosenthal’s canal areas in mysticetes, terrestrial artiodactyls, remingtonocetids, protocetids, and basilosaurids are indistinguishable, while in odontocetes this is notably larger. The exception is a basal odontocete species closely related to Olympicetus (red dashed line Fig. 3D).
Brain and Body Size
As would be expected, there is a significant correlation between body and brain mass (Fig. 4A); the PGLS regression gives a line with the equation y = 26.1x 0.45 (r 2 = 0.71, p > 0.0001, SE = 0.026). It should be noted that the regression analysis here is only performed on extant species, while half of the plotted data points are from measurements on fossils. As encephalization shows an overall increase over time, this results in a regression line that appears skewed compared with all the data.
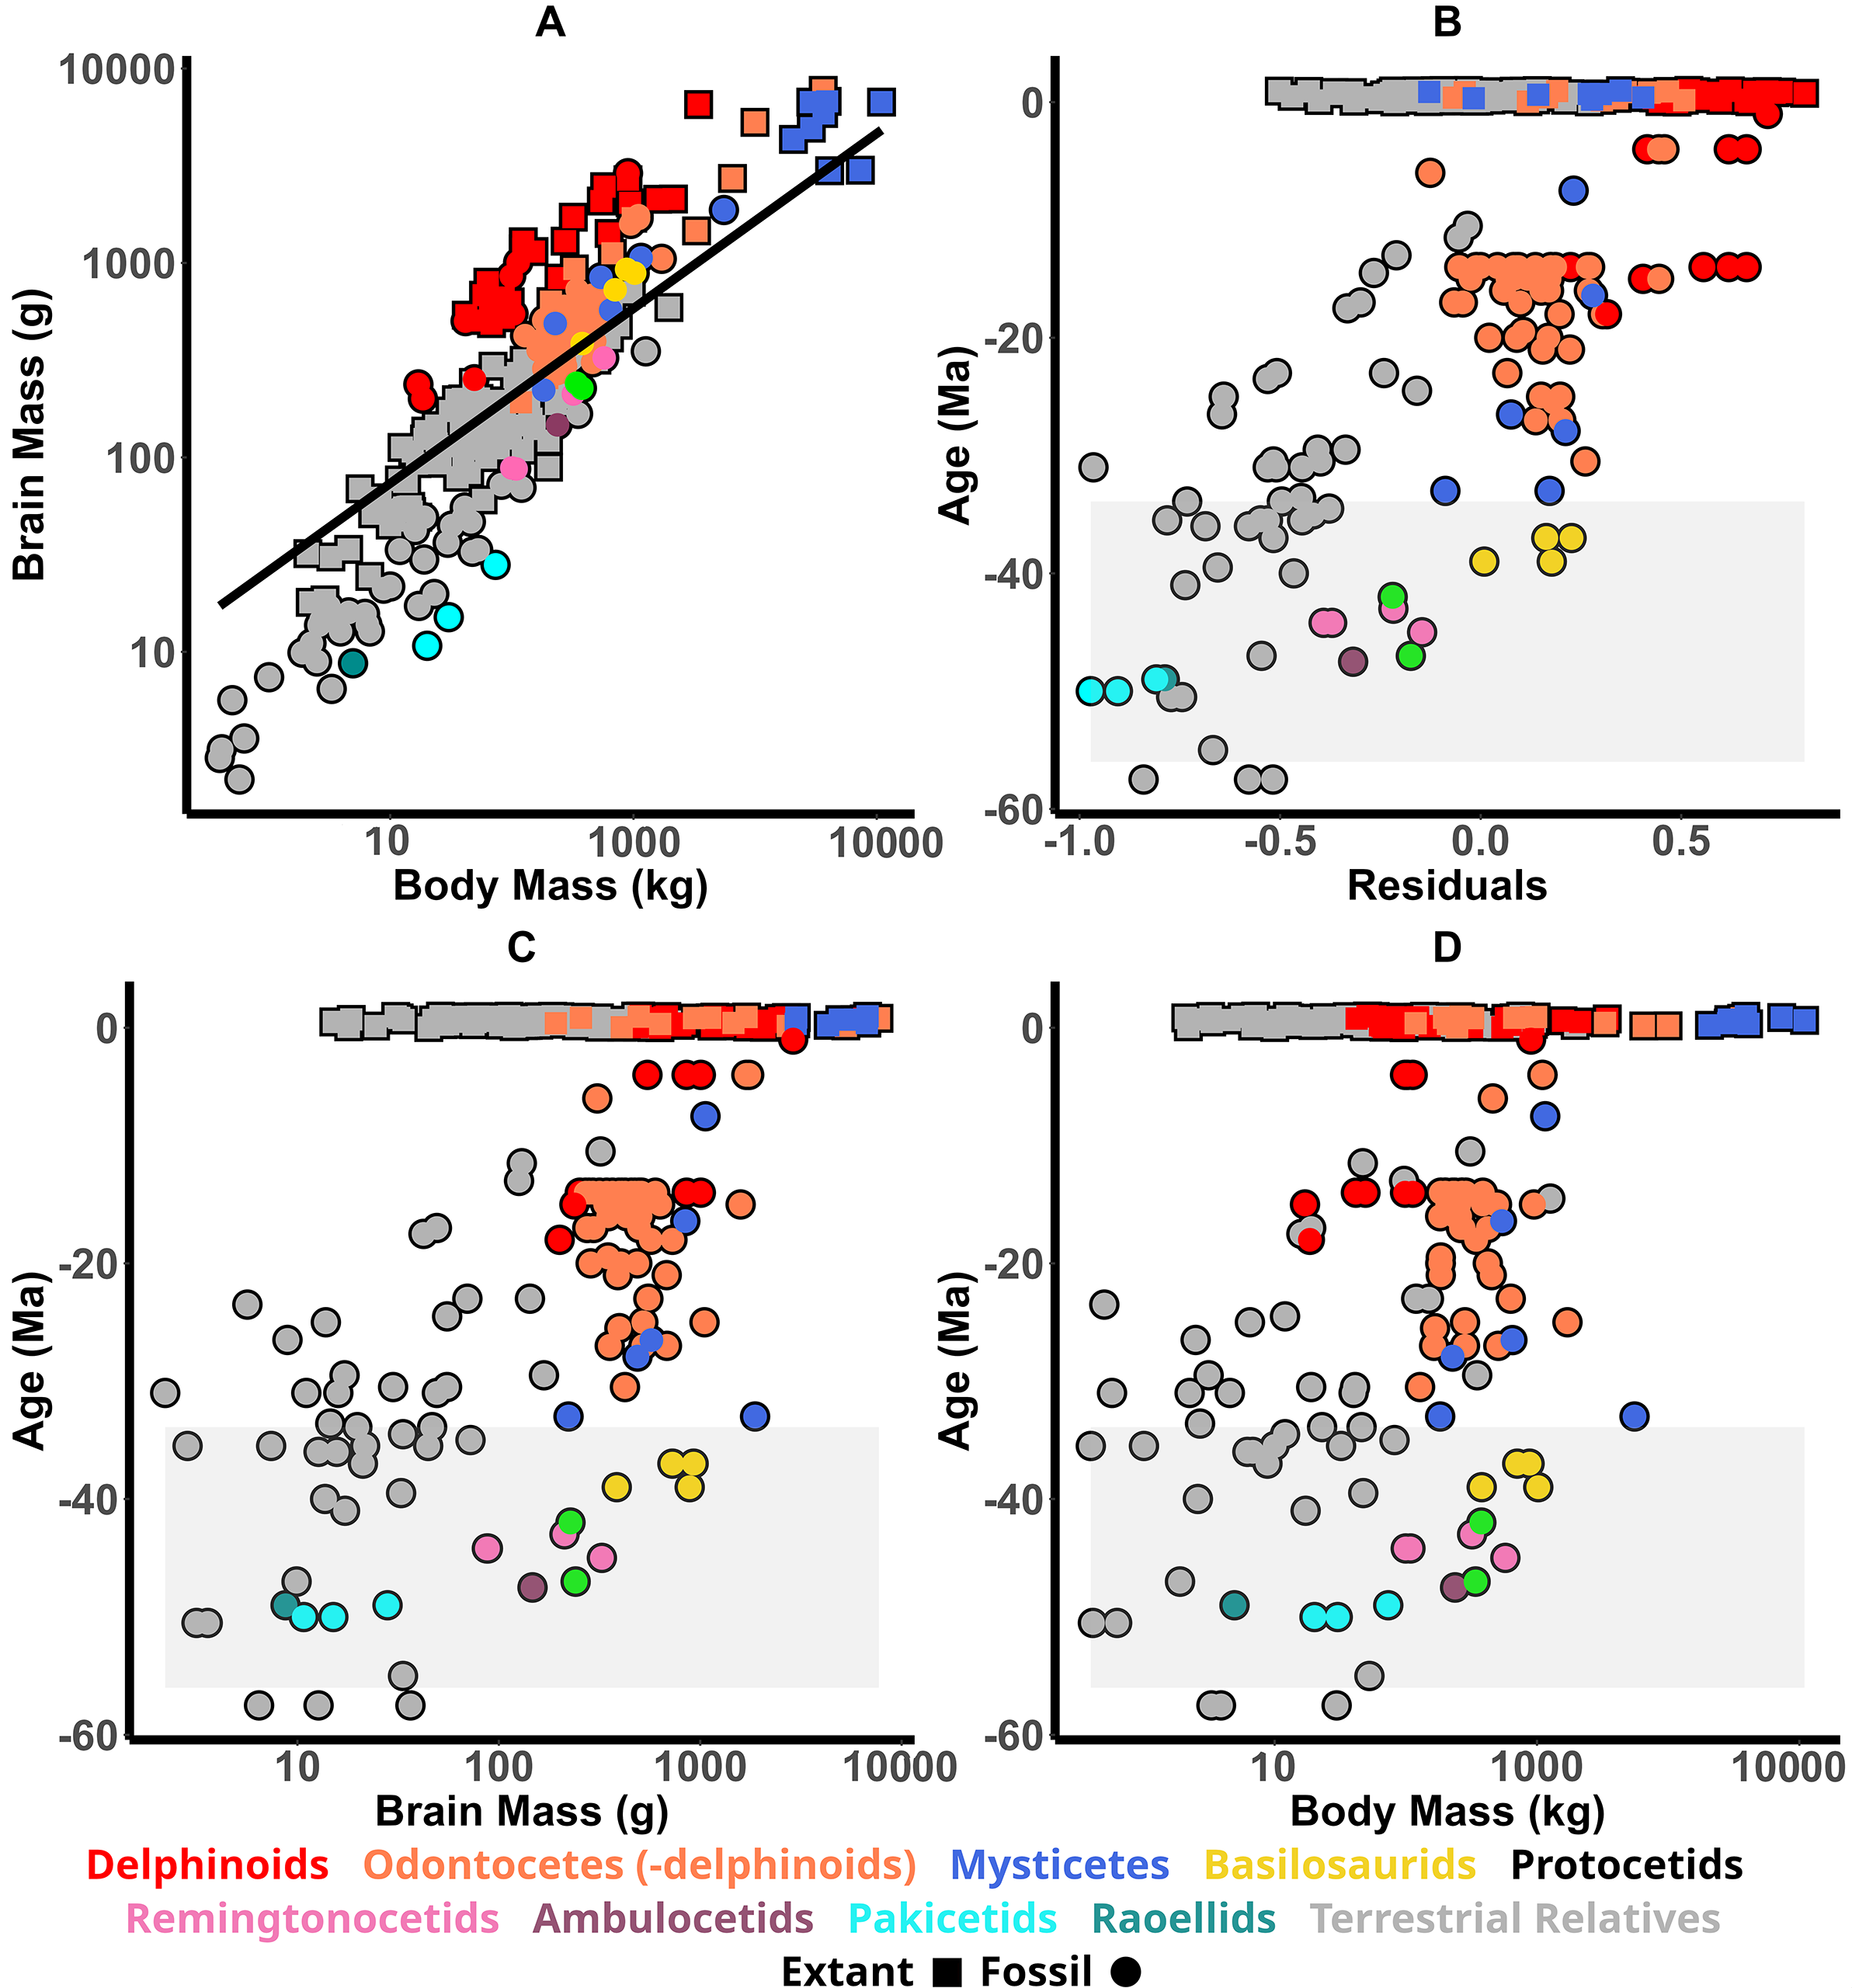
Figure 4. The relationship between brain size and body mass in cetaceans and their relatives. A, Calculated brain mass vs. body mass for all artiodactyls measured; the broken black line is the results of the phylogenetic generalized least squares (PGLS) regression analysis. B, The residuals from the regression analysis for each species plotted against the age of the specimen. In B–D, all modern species have the same value on the y-axis (0), and so in order to better distinguish individual data points, we added some jitter such that they are not exactly aligned at y = 0. In all subfigures, different groups are distinguishable by color as indicated in the legend. A shaded area is added to B–D to indicate the Eocene epoch.
Relative brain size, taken as the residuals from the regression analysis (Fig. 4B), shows remarkably small brain sizes in both pakicetids and raoellids. An initial large increase in relative brain size occurs between pakicetids and ambulocetids, where the ambulocetid brain size is similar to that of both the remingtonocetids and protocetids. A second encephalization increase is noticeable between protocetids and basilosaurids, in which the brain size is then comparable to that of modern neocetes. A final increase in relative brain size is then seen in delphinoid odontocetes.
Eocene cetaceans see a significant increase in brain size but also in body size: ranging from the tiny cat-sized Indohyus to the gigantic Basilosaurus. It is clear that, as the Eocene proceeds, larger bodies and larger-brained species dominate, and both these factors combine to affect relative brain size.
Absolute brain size, body size, and relative brain size of Indohyus and pakicetids overlap with those of Eocene artiodactyls (Fig. 4B–D). With Ambulocetus, brain and body size both increase, but the former increases by a proportionally greater amount, leading to a greater relative brain size. The body sizes of the ambulocetids, remingtonocetids, protocetids, and basilosaurids in this study (which does not include Basilosaurus) do not appear substantially different. However, brain size does increase significantly with the basilosaurids, indicating that increased encephalization at the basilosaurid node was due to a brain-size increase alone. Basilosaurids have similar relative brain size compared with many Oligocene and Miocene odontocetes and mysticetes.
Our new measurements of endocranial volume, occipital condyle width (OCW), as well as calculated brain mass and body mass for early Eocene species, are given in Table 2.
Mandibular Foramen
All archaeocetes, except pakicetids, resemble modern odontocetes in some aspects of the morphology of the mandible, in which there is a large mandibular foramen (Fig. 5A,B). This enlarged foramen is present in modern odontocetes (shown in the beluga in Fig. 5C), where it is filled with a fat pad that connects to the lateral tympanic wall. Although mysticetes have a fundamentally differently shaped mandible, their mandibular foramen is reduced compared with odontocetes but still enlarged compared with pakicetids (Fig. 5A,D). As shown in Figure 5E,F, the fat pad in the bowhead whale is relatively diminutive, and most of the foramen is filled with a vascular plexus. This is likely to be the case for other mysticetes.
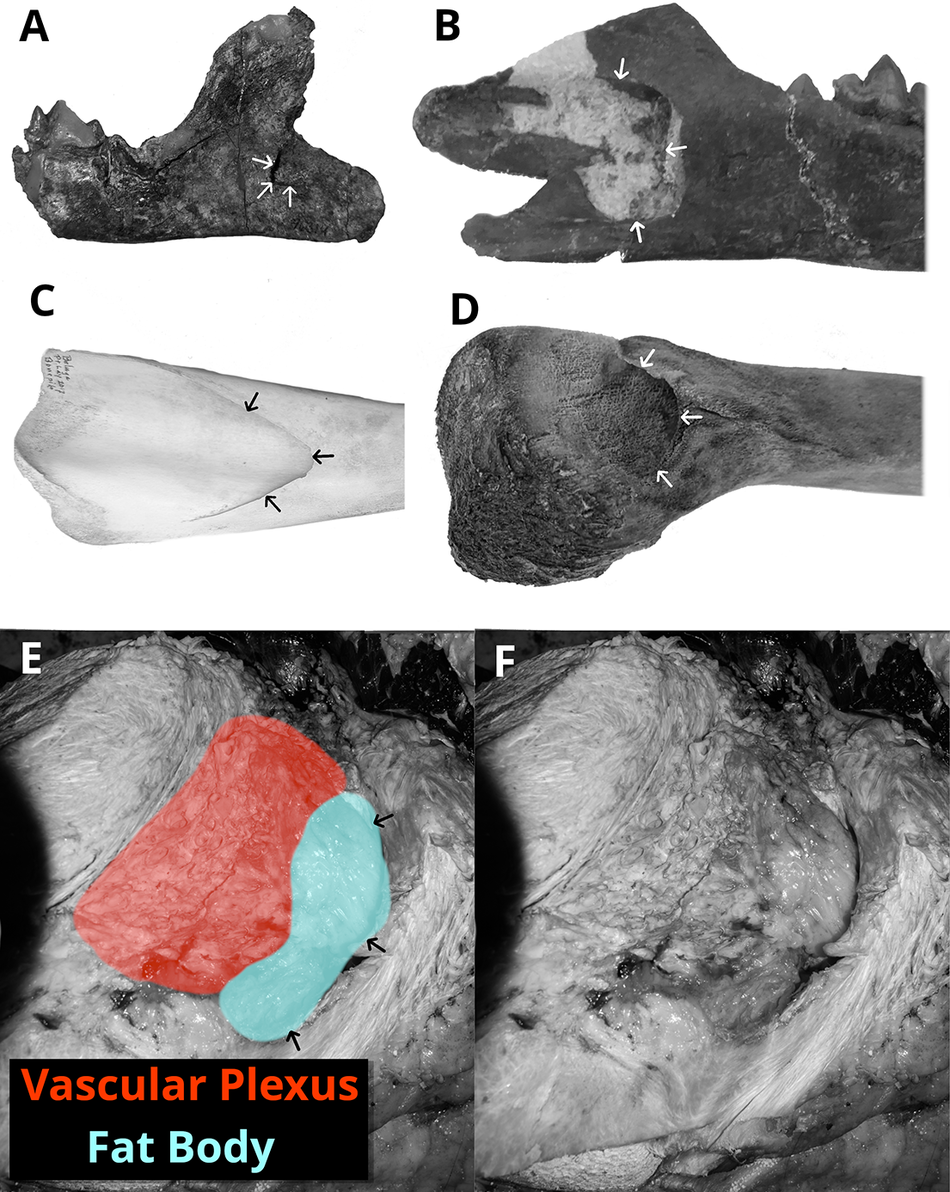
Figure 5. The mandibular foramen in: A, juvenile Ichthyolestes pinfoldi (HGSP 96314, see description in Supplementary Material); B, juvenile Indocetus ramani (IITR-SB 2986); C, Delphinapterus leucas (NSB-HT 129); and D, Balaena mysticetus fetus (NSB-DWM 2007B16F). E, F, The soft tissue bodies of the mandibular foramen, remnant fat body, and vascular plexus in Balaena mysticetus (NSB-DWM 2014B17). Arrows indicate the edge of the mandibular foramen.
Discussion
Estimating Hearing Thresholds from Cochlear Morphology
Our data reinforce the potential to deduce a species’ hearing abilities from simple quantitative morphological features with well-defined links to function. Our broad taxonomic sample indicates that such a relationship is likely valid across all terrestrial therian mammals; however, we do find differences between aquatic and terrestrial species that complicate this analysis and require further investigation. One possibility is that similarities in sound transmission in the external and middle ear underlie this relationship, and marine mammals (particularly cetaceans) make use of different sound transmission pathways. Significant differences in sound transmission would lead to different thresholds for a given sound pressure level.
Alternatively, we note that the width of the laminar gap is far from the only factor that determines the response of hair cells. Other features such as the thickness of the basilar membrane (e.g., Ketten et al. Reference Ketten, Simmons, Riquimaroux and Simmons2021), its material properties, flexing of the bony spiral lamina itself (Stenfelt et al. Reference Stenfelt, Puria, Hato and Goode2003; Raufer et al. Reference Raufer, Guinan and Nakajima2019), and morphology of the scalae (Dallos Reference Dallos1970; Puria and Allen Reference Puria and Allen1991) all play a role (among other things). In addition, molecular mechanisms in the hair cells are important in determining their ability to respond to certain frequencies (e.g., Manley Reference Manley2018). Some of these features could be determined from measurements of bony morphology and thus could be determined in fossils. Thus, we think it is possible to produce a more refined method to quantitatively estimate hearing thresholds by incorporating other morphological elements into the model and, additionally, by including more species with audiogram data.
The applicability of these methods to fossil specimens requires extremely good preservation, which is not found in many taxa, including the earliest cetaceans and near relatives (pakicetids and raoellids). Determining other morphological correlates of hearing ability is thus important, as it is the only way to comment on potential hearing ability for many extinct species, but we would caution against overinterpreting such results unless real functional relationships can be established.
Hearing Evolution in Eocene Cetaceans
In remingtonocetids, the anatomy of the jaw and ear region shows a broad groove that extends from the mandibular foramen to the condyle, which is medially scalloped, and continuing on the squamosal to reach the lateral tympanic (Bajpai et al. Reference Bajpai, Thewissen and Conley2011). This morphology is consistent with a soft tissue connection between the lower jaw and ear region. The exact nature of the soft tissue morphology in Eocene cetaceans is unknown; these early species may not have had a fat pad as modern odontocetes do, and other types of tissue, such as a vascular plexus, could have filled this area, as in modern mysticetes (Fig. 5E,F). Regardless, it is known that this fat pad connection in modern odontocetes is the most important transducer of high-frequency sounds (Møhl et al. Reference Møhl, Au, Pawloski and Nachtigall1999; Popov et al. Reference Popov, Supin, Klishin, Tarakanov and Pletenko2008). Thus, in modern species, the fat pad is known to transmit sound at frequencies that remingtonocetids possibly could not hear (based on their wider laminar gap).
Remingtonocetids had relatively small eyes, and their fossils are found in rocks indicating a depositional environment that included marshes and coal swamps, where underwater vision was of little use. This makes it likely that hearing was their most important sense (Bajpai et al. Reference Bajpai, Thewissen and Conley2011). Modern species, including odontocetes, do not appear to use the mandible pathway to hear lower frequencies in open water; instead, bone conduction mechanisms are likely sufficient (Popov et al. Reference Popov, Supin, Klishin, Tarakanov and Pletenko2008; Cranford et al. Reference Cranford, Krysl and Amundin2010; Cranford and Krysl Reference Cranford, Krysl, Würsig, Thewissen and Kovacs2018). Remingtonocetids must then have been using the soft tissue structures in the mandibular canal to facilitate hearing in a different way (assuming the structures carried adaptive significance for hearing at all), possibly acting as an adaptation for inertial hearing of low-frequency ground vibrations.
An enlarged mandibular foramen, compared with pakicetids, occurs in Ambulocetus natans, where the mandible also has a direct bony articulation with the tympanic (Nummela et al. Reference Nummela, Thewissen, Bajpai, Hussain and Kumar2007; Thewissen et al. Reference Thewissen, Cooper, George and Bajpai2009). Given the similar morphological features and ecology between Ambulocetidae and Remingtonocetidae, where both occupied a similar ecological niche to extant crocodilians (Thewissen and Williams Reference Thewissen and Williams2002), we suggest they likely possessed similar hearing ability. Thus, a shift toward lower-frequency hearing was possibly already present in ambulocetids. This has also been suggested by others based on ambulocetids having a thicker lateral wall on the mandible, and the direct bony connection with the tympanic acting as an adaptation to detect substrate vibration (Nummela et al. Reference Nummela, Thewissen, Bajpai, Hussain and Kumar2007).
The shift toward higher-frequency hearing beginning in protocetids was likely facilitated by the presence of this mandible–tympanic connection. Remingtonocetids and early protocetids had two pathways to transmit sound to the ear: one via the tympanic membrane and a second via the mandible (Nummela et al. Reference Nummela, Thewissen, Bajpai, Hussain and Kumar2004, Reference Nummela, Thewissen, Bajpai, Hussain and Kumar2007; Mourlam and Orliac Reference Mourlam and Orliac2019). The presence of this second sound transmission pathway made improved reception of underwater sound at higher frequencies possible, because a middle ear adapted for impedance transformation in air will not be effective in water, where impedance is much greater (see, e.g., Ketten et al. [Reference Ketten, Simmons, Riquimaroux and Simmons2021] for further discussion). The protocetids used the mandible–soft tissue pathway for hearing in open water, as these species were active pursuit predators, as opposed to facilitating inertial hearing through ground vibrations, as in remingtonocetids. Although we have no direct evidence of the soft tissue morphology, we think it likely that the modern fat pad was present at least in the protocetids, because these are the species that begin hearing higher frequencies that would make this adaptation beneficial.
The auditory ossicles of the earliest protocetids display advanced medio-anterior rotation and the beginnings of the isolation of the ears from the skull (Nummela et al. Reference Nummela, Thewissen, Bajpai, Hussain and Kumar2004; Mourlam and Orliac Reference Mourlam and Orliac2019); in the basilosaurids, both of these features appear fully like those in modern odontocetes. The rotation of the ossicles may indicate decreasing reliance on sound transmission via the tympanic membrane, while the ear isolation is presumably an adaptation to aid in sound localization by reducing crosstalk between the two ears. The possible coincidence of the narrowing laminar gap (indicating a move toward higher-frequency hearing) and the isolation of the ears from the skull suggests that selection for improved sound localization was driving both changes.
Our results indicate that the sister group to modern Neoceti was not specialized for high-frequency hearing as in modern Odontoceti; however, it was also not specialized for hearing lower frequencies as in modern Mysticeti. Thus, our data support the conclusions of Fleischer (Reference Fleischer1976), Mourlam and Orliac (Reference Mourlam and Orliac2017), and others that the move toward both high-frequency and low-frequency hearing in modern whales occurred after the divergence of the modern suborders. The ancestral neocete has a fully modern outer and middle ear: the external auditory meatus is lost, the ossicles are fully rotated, the ears are isolated from the skull, and it likely possessed a functional mandibular fat pad.
While all our measured odontocetes display a narrow laminar gap consistent with high-frequency hearing, we do note a smaller Rosenthal’s canal area in a basal odontocete closely related to Olympicetus (Fig. 3D). This specimen has a laminar gap profile similar to that of the orca but a smaller Rosenthal’s canal area, suggesting poorer ability to discriminate between frequencies and extract sophisticated information. Other studies of cochlear morphology in this specimen have suggested that the species did not echolocate (Racicot et al. Reference Racicot, Boessenecker, Darroch and Geisler2019) and, while our data supports that it likely could not echolocate with the same sophistication as modern odontocetes, the suggestion that it did not engage in any form of active echolocation is not supported (see also later discussion).
The diminutive fat pad seen in the bowhead (Fig. 5D–F) is unlikely to be involved in sound transmission. This loss of the fat pad (or soft tissue connection), is documented in fossils that show early mysticetes having an enlarged foramen similar to that of modern odontocetes (Steeman Reference Steeman2009; Bisconti and Carnevale Reference Bisconti and Carnevale2022). Thus, the sound transmission pathway that emerged in ambulocetids appears to have been mostly lost in mysticetes as they shifted toward lower-frequency hearing. The exact sound transmission pathways of modern mysticetes remain poorly understood, and they may still make use of other fat bodies for sound transmission (Yamato et al. Reference Yamato, Ketten, Arruda, Cramer and Moore2012).
\Many early mysticetes were not large bodied, and we think it unlikely that their enlarged laminar gap can be attributed to increased body sizes alone. Indeed, previous studies have also suggested that low-frequency hearing predates large body sizes (Park et al. Reference Park, Evans, Gallagher and Fitzgerald2017). We hypothesize that low-frequency hearing was driven by the development of complex vocalizations used for long-distance, intraspecific communication (Edds-Walton Reference Edds-Walton1997; Noad et al. Reference Noad, Cato, Bryden, Jenner and Jenner2000; Allen et al. Reference Allen, Garland, Garrigue, Dunlop and Noad2022; Elemans et al. Reference Elemans, Jiang, Jensen, Pichler, Mussman, Nattestad, Wahlberg, Zheng, Xue and Fitch2024), and that this was possibly facilitated by the development of filter feeding, which reduced pressure to maintain accurate sound localization abilities.
In summary, we propose that: the sound conduction pathway through the mandible originated as a low-frequency pathway for detecting substrate vibrations in Eocene cetaceans similar to ambulocetids; that this later played an essential role in facilitating higher-frequency hearing and improved sound localization beginning with protocetids and developing toward ultra-high-frequency hearing in odontocetes; and that it was lost in mysticetes as they adapted toward filter feeding, diminishing the need for accurate sound localization abilities, and developed their low-frequency intraspecific communication.
Brain Size, High-Frequency Hearing, and Echolocation
It has been hypothesized that high-frequency echolocation was a major factor in driving brain-size increases in cetacean evolution (Ridgway Reference Ridgway, Schusterman, Thomas and Wood1986; Ridgway and Au Reference Ridgway, Au and Squire2009). Our new estimates of brain size of the earliest-diverging branches on the cetacean phylogenetic tree indicate a previously unrecognized encephalization increase at the ambulocetid node of the cladogram. This coincides with the development of low-frequency bone conduction or inertial hearing through the mandible, although we do not claim that there is a definite causal relation. Other increases in relative brain size occurred at the basilosaurid node and, in the Miocene, in delphinoid odontocetes. Neither of these appear to coincide with any major shift in hearing specialization. We find no increase in relative brain size at the origin of odontocetes, near the Eocene/Oligocene boundary, at which time high-frequency echolocation may have already evolved (Geisler et al. Reference Geisler, Colbert and Carew2014; Churchill et al. Reference Churchill, Martinez-Caceres, de Muizon, Mnieckowski and Geisler2016; Park et al. Reference Park, Fitzgerald and Evans2016; Racicot et al. Reference Racicot, Boessenecker, Darroch and Geisler2019). Thus, it is unlikely that high-frequency hearing was a primary driver of increased encephalization.
However, while periods of increasing encephalization do not correlate with high-frequency hearing, this does not imply an absence of correlation with echolocation. Modern odontocete echolocation depends on high-frequency sound reception and vocalization, but a less sophisticated form is possible, and some intermediate forms must have been present at least in earlier odontocetes. Simpler forms of echolocation can be effective for different tasks, and low-frequency echolocation is known in various bird (Brinkløv et al. Reference Brinkløv, Elemans and Ratcliffe2017) and mammal (Siemers et al. Reference Siemers, Schauermann, Turni and von Merten2009) species. Indeed, it has been suggested that a rudimentary form of echolocation with low-frequency click trains occurs in hippopotamuses (Maust-Mohl et al. Reference Maust-Mohl, Soltis and Reiss2018), the extant sister group to cetaceans, and in mysticete whales such as the bowhead (Clark and Ellison Reference Clark, Ellison, Thomas, Moss and Vater2004).
Complex communication vocalizations occur in early-diverging members of the two modern suborders of cetaceans: for example, the codas of sperm whales (Andreas et al. Reference Andreas, Beguš, Bronstein, Diamant, Delaney, Gero and Goldwasser2022) and the songs of humpback and bowhead whales (Elemans et al. Reference Elemans, Jiang, Jensen, Pichler, Mussman, Nattestad, Wahlberg, Zheng, Xue and Fitch2024). While the acoustic properties of these signals are very different, both serve as intraspecific communication. Hippopotamuses vocalize loudly above- and underwater to communicate with group members, warn non-group members, and mark territories (Barklow Reference Barklow1997, Reference Barklow2004; Thévenet et al. Reference Thévenet, Grimault, Fonseca and Mathevon2022). Thus, the three modern end-members of interest (mysticetes, odontocetes, and hippos) all have complex acoustic communication behaviors. This does not suggest that such communication is ancestral to this clade, but perhaps that such traits have a high evolvability in this lineage. This makes it possible that Eocene relatives of cetaceans and hippos also displayed complex vocalization behaviors, potentially indicating that they could produce the vocalizations necessary for some forms of primitive echolocation. However, whether or not they were echolocating cannot be determined from current data.
Thus, while we find no strong evidence of a link between encephalization and echolocation, determining whether a species was actively echolocating is a difficult task. We may be able to rule out sophisticated echolocation as in modern odontocetes based on the sort of morphological data presented here, but the presence or absence of less sophisticated echolocation cannot be determined. Most species can localize sound to some degree, and to be actively echolocating only requires that a species can produce some sounds that it can subsequently extract spatial information from. Changes in how the animal is processing and making use of sound are not always reflected in changes to frequency perception, and we cannot rule that other aspects of auditory processing, including some forms of echolocation or social communication, may yet have been drivers of increased encephalization in cetaceans.
Conclusion: The Evolutionary Trajectory of Cetacean Hearing and Brain Size
Our hypothesis on the evolutionary changes in cetacean hearing and brain size is illustrated in Figure 6. No well-preserved cochleas were available for raoellids, pakicetids, or ambulocetids, and thus our estimates here are based on similarities (or dissimilarities) in other morphological features and ecology with other species. We suspect the raoellids and pakicetids had hearing abilities similar to those of modern terrestrial artiodactyls: there are no morphological features indicating any specialization, and they had a much more terrestrial lifestyle compared with later cetaceans. This hypothesis could be tested if better preserved cochleas can be found for these species.
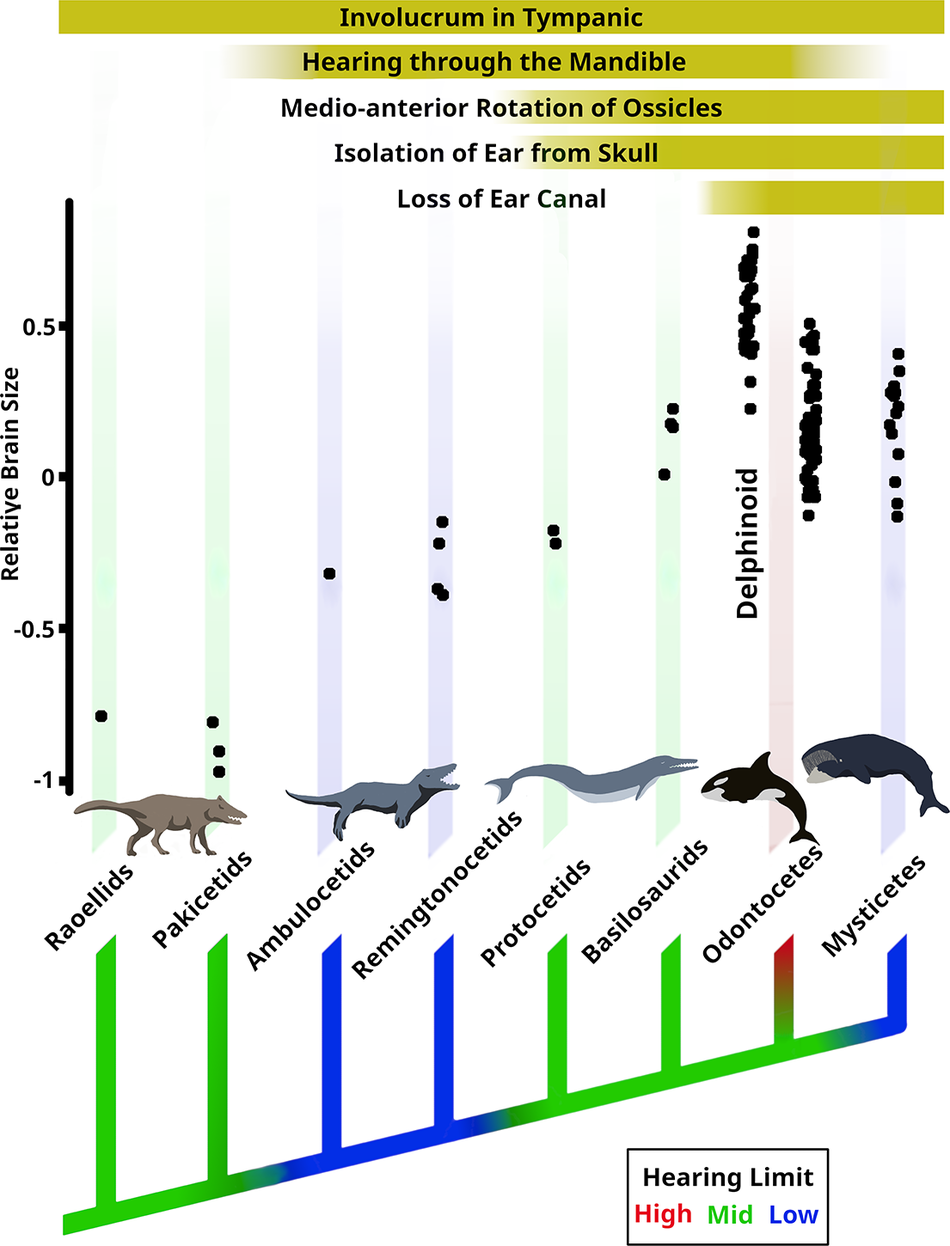
Figure 6. Charting the evolution of cetacean hearing and brain size from the raoellid Indohyus (~48 Ma) through the basilosaurid Zygorhiza (~36 Ma) to modern-day species. A cladogram is colored to illustrate changes in the upper limit of hearing. Morphological changes in the outer and middle ear are indicated at the top.
The Eocene epoch encompassed many critical changes in both brain size and morphological ear evolution. Notable shifts in hearing took place at three nodes of the phylogenetic tree, likewise for brain size, which shows three notable periods of increased encephalization (Fig. 6). However, changes in these systems do not always align.
Shifts in brain size and possibly hearing ability occur simultaneously at the ambulocetid node, coinciding with the entry of cetaceans into shallow, marine waters. The occurrence of the hearing shift is based on the wider laminar gap (observed in remingtonocetids) and the enlarged mandibular foramen (observed in ambulocetids and remingtonocetids), which all suggest a move toward low-frequency hearing. These species were ambush predators: they were likely listening for low-frequency ground vibrations of approaching prey, and hearing was likely their primary sense organ.
The second shift in hearing occurred at the protocetid node, where the laminar gap narrows, indicating a move to higher-frequency hearing in the range of modern terrestrial artiodactyls. However, the sound path differs; these higher frequencies are now received primarily through the mandibular route in water. This change does not coincide with any brain-size changes.
The second increase in brain size occurs at the basilosaurid node. It is at this node that whales become fully aquatic and their ears become fully isolated from the skull as in modern species, consistent with improved sound localization ability. However, even though the second increase in brain size does coincide with the improvement in localization ability, this does not include high-frequency perception of the kind found in modern odontocetes. Thus, this change does not coincide with any shift in frequency perception.
The third major shift in hearing occurs after the divergence of Neoceti, where the Odontoceti built upon preexisting sound localization ability by adding ultra-high-frequency sound reception to develop refined echolocation. Meanwhile, the Mysticeti reverted back to lower-frequency hearing, losing the fat pad in the mandible, but retaining and developing complex vocal behaviors. There is no brain-size increase that accompanies the origin of sophisticated echolocation in Odontoceti.
The third increase in brain size occurs in delphinoid odontocetes in the Miocene. The hearing and echolocation abilities of these delphinoids is not notably improved over those of other modern odontocetes, and this encephalization event is likely not connected with hearing or echolocation.
Acknowledgments
We would like to thank L. Cook, B. Gragg, M. Kline, K. Mars, A. Rautela, S. Usip, and B. White for their technical support; C. Gabrielle for providing the humpback ear; and L. Wild for providing the orca. We further thank the Iñupiat people of Utqiagvik and Point Lay, the Alaska Eskimo Whaling Commission, and the Alaska Beluga Whaling Committee for granting us access to their specimens, with thanks to C. George, R. Suydam, and R. Stimmelmayr. Samples of bowhead and beluga were collected under permit NOAA-NMFS 17350–02 to T. Hepa. We thank the personnel of the Geological Survey of Pakistan and the Indian Institute of Technology, Roorkee, India, for help with fieldwork. Creation of datasets accessed on MorphoSource was made possible by the following grant: NSF DBI-1902242. The files were downloaded from www.MorphoSource.org, Duke University. Funding for this research was provided by the Hennecke Family Foundation and the National Science Foundation Grant EAR-2142526 to J.G.M.T. S.B. received funding from the Department of Science and Technology, Government of India, and IITR Chair Professorship grants for part of this research. Finally, we thank N. Fröbisch, P. Li, Z.-X. Luo, M. Mourlam, R. Racicot, and M. Uhen for their contribution to the peer review of this work. All figures in this paper were produced entirely by the lead author.
Competing Interests
None of the authors have any conflict of interest.
Data Availability Statement
Data available from the Dryad Digital Repository: https://doi.org/10.5061/dryad.sf7m0cgh1. All data used to support the findings of this study are included in the article and Supplementary Material. Data can be provided in other formats on request.


 Open access