


Health constitutes an important resource for participating in politics (Burden et al., Reference Burden, Fletcher, Herd, Moynihan and Jones2017; Mattila et al., Reference Mattila, Rapeli, Wass and Söderlund2018; Pacheco & Fletcher, Reference Pacheco and Fletcher2015), similarly to money and time (Brady et al., Reference Brady, Verba and Schlozman1995). Scholars of health and political behavior have provided extensive empirical testing for this Resource Hypothesis (Gidengil & Wass, Reference Gidengil and Wass2024), according to which political participation requires resources, such as good health. Thus, it is the disparities in these resources that cause differences in political participation. The voting gap between people in very good health and people in very poor health is estimated to be around ten percentage points (Mattila et al., Reference Mattila, Söderlund, Wass and Rapeli2013). The Resource Hypothesis has found support, particularly on voting, when scholars have examined various measures of health and disabilities (Mattila et al., Reference Mattila, Rapeli, Wass and Söderlund2018; Stockemer & Rapp, Reference Stockemer and Rapp2019; Sund et al., Reference Sund, Lahtinen, Wass, Mattila and Martikainen2017). However, the story we gather from the literature on health and voting is not as clear when other forms of political participation are examined (Kirbiš et al., Reference Kirbiš, Mattila and Rapeli2024; Mattila, Reference Mattila2020; Mattila et al., Reference Mattila, Rapeli, Wass and Söderlund2018; Söderlund & Rapeli, Reference Söderlund and Rapeli2015; Stockemer & Rapp, Reference Stockemer and Rapp2019). There is even some evidence that some psychological conditions, such as ADHD, are correlated with increased political participation (Waismel-Manor et al., Reference Waismel-Manor, Kaplan, Shenhav, Zlotnik, Dvir and Ifergane2023). Hence, poor health seems to have heterogeneous effects on participation in that people in poor health are more likely to take part in activities, particularly if these activities do not require much physical effort.
The bulk of the evidence comes from the literature on physical health. But mental health is equally important and, just like its physical sibling, constitutes an important resource for participating in politics. It is not a coincidence that the OECD deems both mental health and civic engagement as two important aspects of people’s wellbeing (OECD, 2023a). According to the WHO, there are approximately 1 billion people worldwide who experience a mental disorder (WHO, 2022), and mental disorders constitute a major part of the global disease burden (GBD, 2022).Footnote 1 Despite these alarming figures, what we know about mental health as a resource for political participation is still very limited. The literature has so far approached the problem by using two survey instruments: self-reports of one’s general mental health and symptoms of depression. Studies show that poor mental health, either conceptualized as depression (Bernardi et al., Reference Bernardi, Mattila, Papageorgiou and Rapeli2023; Landwehr & Ojeda, Reference Landwehr and Ojeda2021; Sund et al., Reference Sund, Lahtinen, Wass, Mattila and Martikainen2017), self-rated mental health (Couture & Breux, Reference Couture and Breux2017; Denny & Doyle, Reference Denny and Doyle2007), or malaise (Bernardi et al., Reference Bernardi, Bridger and Mattila2024; Girard & Okolikj, Reference Girard and Okolikj2024), is associated with lower voting probability and participation in forms that are particularly demanding. Yet, though one of the most prevalent, depression is only one of the many mental health problems people experience.
Thus, our research note has a clear, simple goal: to evaluate the Resource Hypothesis by offering the most comprehensive analysis ever on the study of mental health problems and political participation, beyond depression. Our approach is broad and, in many ways, exploratory. As we use existing surveys, we are limited by the questions posed in these studies. This means that our results from different surveys are not directly comparable with each other, as the questions on mental health problems vary in which types of problems they focus on or whether they approach these problems with a symptomatic approach, or by asking about medically diagnosed conditions. In a similar way, the questions on voting and political participation vary from one survey to another. This non-comparability is a limitation of our study, but it can also be seen as an advantage, as different ways of measuring similar phenomena can strengthen our conclusions if they point in the same direction.
Our review of existing socio-political surveys has produced the following results. Unlike previous research on depression, we find only limited evidence for the Resource Hypothesis that mental health problems reduce political participation, except in the case of voting. In addition, we find mixed evidence that mental health problems and their comorbidity (that is, experiencing more than one mental health problem) are associated with increased political participation. Our research suggests that, at least for those mental health problems that do not imply severe cognitive deterioration, mental health problems may actually mobilize people into politics.
Methodology
We map existing socio-political surveys that include questions on mental health and political participation, and select those that ask questions on different mental health conditions. We exclude the European Social Survey, the British Household Panel Study, the General Social Survey, and the GESIS Panel because they either only ask questions on depression and political participation already been analyzed elsewhere (Landwehr & Ojeda, Reference Landwehr and Ojeda2021) or they only include general questions on mental health. We also prefer panel datasets, as they provide more reliable information on the potential link with mental health and participation than cross-sectional surveys, as with fixed effects models, we are able to focus on within-person changes and eliminate the confounding effects of overtime constant factors. With the exception of Bernardi et al. (Reference Bernardi, Mattila, Papageorgiou and Rapeli2023) and Landwehr and Ojeda (Reference Landwehr and Ojeda2021), all the previous studies analyzing this link have used cross-sectional data. However, the two studies only cover depression and voting. Thus, we are the first ones to study non-voting participation with panel data. Having said so, we also include cross-sectional data or panel data used cross-sectionally if the necessary information is available.
This review leaves us with the following data available in English: the Dutch Longitudinal Internet Studies for the Social Sciences (LISS panel, 2007–2010) (Scherpenzeel & Das, Reference Scherpenzeel, Das, Das, Ester and Kaczmirek2010); the Swiss Household Panel (SHP, 1999–2009) (SHP 2022); Understanding Society, the UK Household Longitudinal Study (UKHLS, 2019–2020, wave 11) (University of Essex, 2022); the US-based Americans’ Changing Lives (ACL, 1989, wave 2) (House, Reference House2018); and an original survey conducted with YouGov in the UK between February and May/June 2022. As an exception, we include the German Socio-Economic Panel (SOEP, 2009–2019) as Landwehr and Ojeda (Reference Landwehr and Ojeda2021) have not analyzed it in their study on depression.
Mental health measures
We first provide information about the mental health measures available in the YouGov survey. Depression symptoms were measured with the 9-item form of the Center for Epidemiologic Studies Depression Scale (Radloff, Reference Radloff1977). Respondents were asked about their feelings in the past 2 months on the following items: “I felt depressed”; “I felt that everything I did was an effort”; “I felt hopeful about the future”; “my sleep was restless”; “I was happy”; “I felt lonely”; “I enjoyed life”; “I felt sad”; and “I could not get ‘going.” Response options ranged from 1 (rarely or none of the time) to 4 (most or all of the time). Scores on the CESD-9 ranged from 0 to 27 and were recoded so that higher values denote higher levels of depressive symptoms. Cronbach’s alpha is 0.90.
Anxiety symptoms were measured with the 6-item form of the State–Trait Anxiety Inventory (Marteau & Bekker, Reference Marteau and Bekker1992). Respondents were asked how often they have felt calm/tense/relaxed/upset/content/worried in the past 2 months. Response options ranged from 1 (never) to 4 (always). Scores on the STAI-6 ranged from 2 to 16 and were recoded so that higher values denote higher levels of anxiety symptoms. Cronbach’s alpha is 0.89.
Stress symptoms were measured with the 4-item form of the Perceived Stress Scale (Cohen et al., Reference Cohen, Kamarck and Mermelstein1983). Respondents were asked how often in the past 2 months have they felt: “that you were unable to control the important things in your life”; “confident about your ability to handle your personal problems”; “that things were going your way”; and “difficulties were piling up so high that you could not overcome them.” Response options range from 1 (never) to 5 (all of the time). Scores on the PSS-4 ranged from 0 to 16 and were recoded so that higher values denote higher levels of stress symptoms. Cronbach’s alpha is 0.78. The correlation among symptoms of depression, anxiety, and stress in our dataset was r = 0.73, confirming the comorbidity of mental disorders.
To measure long-term mental health conditions (lasting at least 6 months), respondents were asked to report whether a doctor or a health professional had ever diagnosed them with a mental health problem. Options inspired by the DSM-5 were: schizophrenia or other psychotic disorders (N = 6); bipolar disorder (N = 14); depressive disorder (N = 277); anxiety disorder (N = 266); obsessive-compulsive disorder (N = 23); trauma and stress-related disorder (N = 77); feeding and eating disorder (N = 46); personality disorder (N = 21). Descriptions provided in the option other (N = 32) were used to classify cases in any of the above categories. (Schizophrenia and other psychotic disorders are omitted from the analyses with separate mental disorders due to the insufficient number of observations.)
In the LISS data, we use the Brief Symptom Inventory (Derogatis Reference Derogatis and Melisaratos1983), which identifies self-reported clinically relevant psychological symptoms and is available in the LISS’ “Mental Health” Assembled Studies. The BSI consists of 53 items covering nine symptom dimensions: Somatization (in LISS called somatic complaints), Obsession-Compulsion (in LISS called problems in cognitive functions), Interpersonal Sensitivity, Depression, Anxiety (in LISS called fear), Hostility, Phobic Anxiety (in LISS called phobic fear), Paranoid Ideation, and Psychoticism. Respondents rank each feeling item (e.g., “your feelings being easily hurt”) on a 5-point scale ranging from 0 (not at all) to 4 (extremely). Rankings characterize the intensity of distress during the past 7 days. The original survey question reads as follows: “Here I have a list of problems people sometimes have. As I read each one to you, I want you to tell me how much that problem has distressed or bothered you during the past 7 days, including today.”Footnote 2
In the SHP survey, we could only rely on the following question: “Do you often have negative feelings such as having the blues, being desperate, suffering from anxiety or depression, if 0 means “never” and 10 “always”? SOEP only covers depression as a mental health problem. We used the following question: “Has a doctor ever diagnosed you to have one or more of the following illnesses?” (response options: yes; no). ACL only covers depression as a mental health problem. A shorter 13-item version of the CES-D scale was asked to respondents. Scores on the CESD-13 ranged from 0 to 24 and were recoded so that higher values denote higher levels of depressive symptoms. Cronbach’s alpha is 0.83.
Lastly, to measure mental health conditions, UKHLS respondents were asked to report if they were ever diagnosed with a psychiatric, nervous, or emotional disorder by a doctor or a health professional. Wave 11 of the UKHLS includes: anxiety, depression, psychosis/schizophrenia, PTSD, bipolar, and eating disorders. Respondents had to answer yes or no to each item. The question was asked to both respondents who were interviewed in previous waves and those who entered the survey in Wave 11. Our self-reported diagnosis variables include both sets of respondents. Therefore, our number of cases for each condition is the following: anxiety (N = 455), depression (N = 418), psychosis/schizophrenia (N = 23), PTSD (N = 89), bipolar (N = 32), and eating disorders (N = 28).
We provide extensive details for each survey in Section A of the Supplementary Material and for the question wording and survey items included in our study in Section B of the Supplementary Material. Although our measures of mental disorders are not directly comparable across surveys, they are based on a wide array of survey items, including validated scales of symptoms (LISS, ACL, YouGov), self-rated feelings of depression/anxiety (SHP), or self-reported diagnoses of mental health conditions (YouGov, UKHLS, SOEP). When the survey asked about self-reported diagnoses, we have provided prevalence estimates for validation (Table B1).
Political participation measures
While voting is included in all surveys (either as vote recall or voting propensity), there is variation in the other forms of participation. YouGov asked if the respondent had: contacted a politician; worked in a political party; worked in another organization; worn or displayed a campaign badge/sticker; signed a petition; taken part in a lawful public demonstration; boycotted a product; or posted or shared anything about politics online. LISS asked for help from radio, television, or newspaper to raise a political issue; by making use of a political party or organization; participated in a government-organized public hearing, discussion, or citizens’ participation meeting; contacted a politician or civil servant; participated in an action group; participated in protest; participated in a political discussion or campaign on the internet, by e-mail or SMS. SHP: take part in a boycott/strike/demonstration. SOEP: participation in political parties, municipal politics, and citizens’ initiatives. ACL: volunteering in a political organization. Descriptive statistics are in Section D of the Supplementary Material.
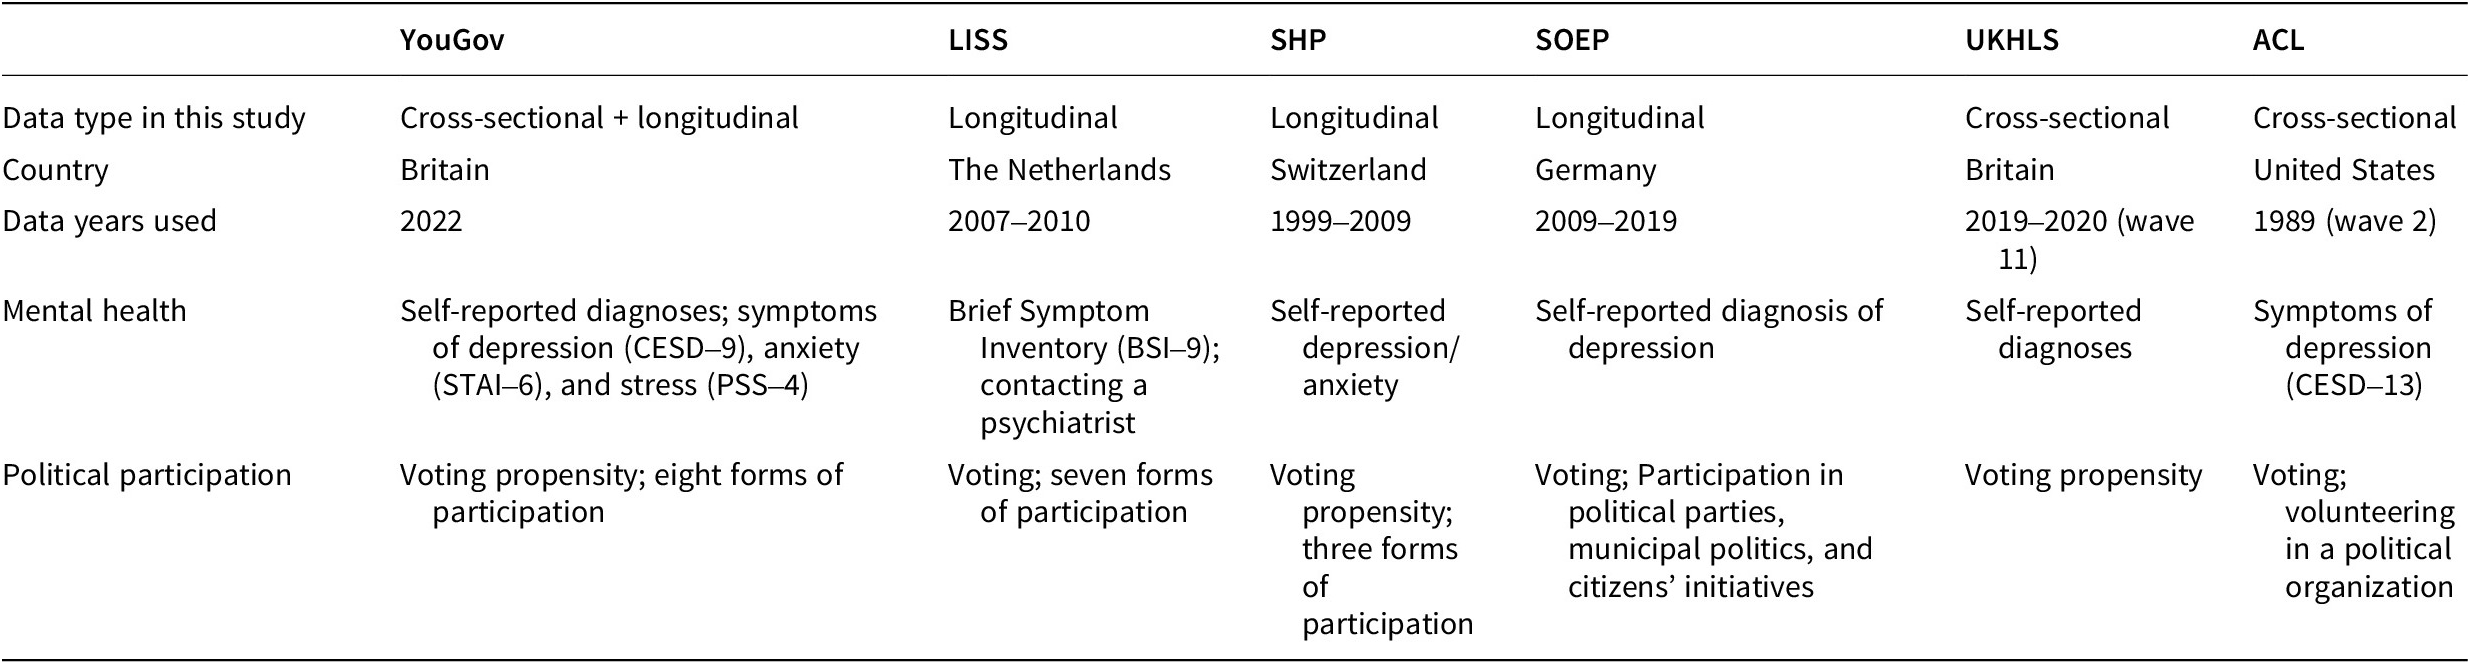
As for the mental health measures above, we provide extensive details for the question wording and survey items on political participation included in our study in Section B of the Supplementary Material. An overview of our data is presented in Table 1.
Table 1. Data summary
Results
We present findings of fixed-effect logistic regressions (where the dependent variable was voting propensity or vote recall) and Poisson pseudo-likelihood regression with fixed effects (where the dependent variable was the count of various political participation forms in which the respondent participated) and robust standard errors. The exception is the dependent variable for political participation in the SOEP data, which is ordinal; therefore, we use fixed effects ordered logistic regression. The advantages of the fixed-effect estimator are that they restrict the analysis to within-person changes in mental health and participation and deal with the endogeneity resulting from the correlation between the omitted (time-invariant) variables and the explanatory ones (Baltagi, Reference Baltagi2008). Therefore, although they are less likely to produce statistically significant coefficient estimates, they produce unbiased ones (Clark & Linzer, Reference Clark and Linzer2015), regarding the magnitude and direction of the effect on the outcome. Our models with panel data include wave dummies. In the ACL and the UKHLS datasets, we used cross-sectional OLS and logistic regression models, as the datasets included the relevant questions only in a single wave. Although the correlation between the self-reported diagnoses is generally moderate at best, the one between symptom scales is strong (Section F of the Supplementary Material). With this in mind, we estimate our models separately for each mental health factor.
We control for the standard idiosyncratic variables commonly included in health and political participation studies, which are common to the surveys. We utilize: sex, age, age squared, education, marital status, employment status, with the exceptional inclusion of race in the United States. The inclusion of such variables follows the guidance by King et al. (Reference King, Keohane and Verba1994): we control for the factors that may cause our dependent variable and may correlate with our main independent variable. To put it differently, we have controlled for the factors that may act as risk factors for mental health, but which are also determinants of political participation.Footnote 3 Due to an issue of convergence in the SOEP model with voting, we have omitted education to be able to estimate fixed effects. Section C of the Supplementary Material provides details on control variables for each survey. Below we present plots of coefficients with 95% confidence intervals while reporting all regression tables in Section E of the Supplementary Material.
Finally, it is important to notice that with multiple measures of both mental health and participation and with several datasets, it is possible that the large number of models we present may produce type I errors, that is false positives indicating that there is a statistically significant association between mental health and participation while in the population such relation does not exist. In practice, this means that we need to be very careful in our interpretations of the results and in general conclusions.
Figure 1 reports the coefficient plots of the tests for our hypotheses using self-reported diagnoses of mental disorders (YouGov), the items from the Brief Symptom Inventory (LISS), and the self-reported diagnosis of depression (SOEP)Footnote 4. Except for OCD, we find no statistically significant association between mental health issues and voting. Analyses of wave 11 of the UKHLS also show no evidence for the Resource Hypothesis (see Section E of the Supplementary Material).
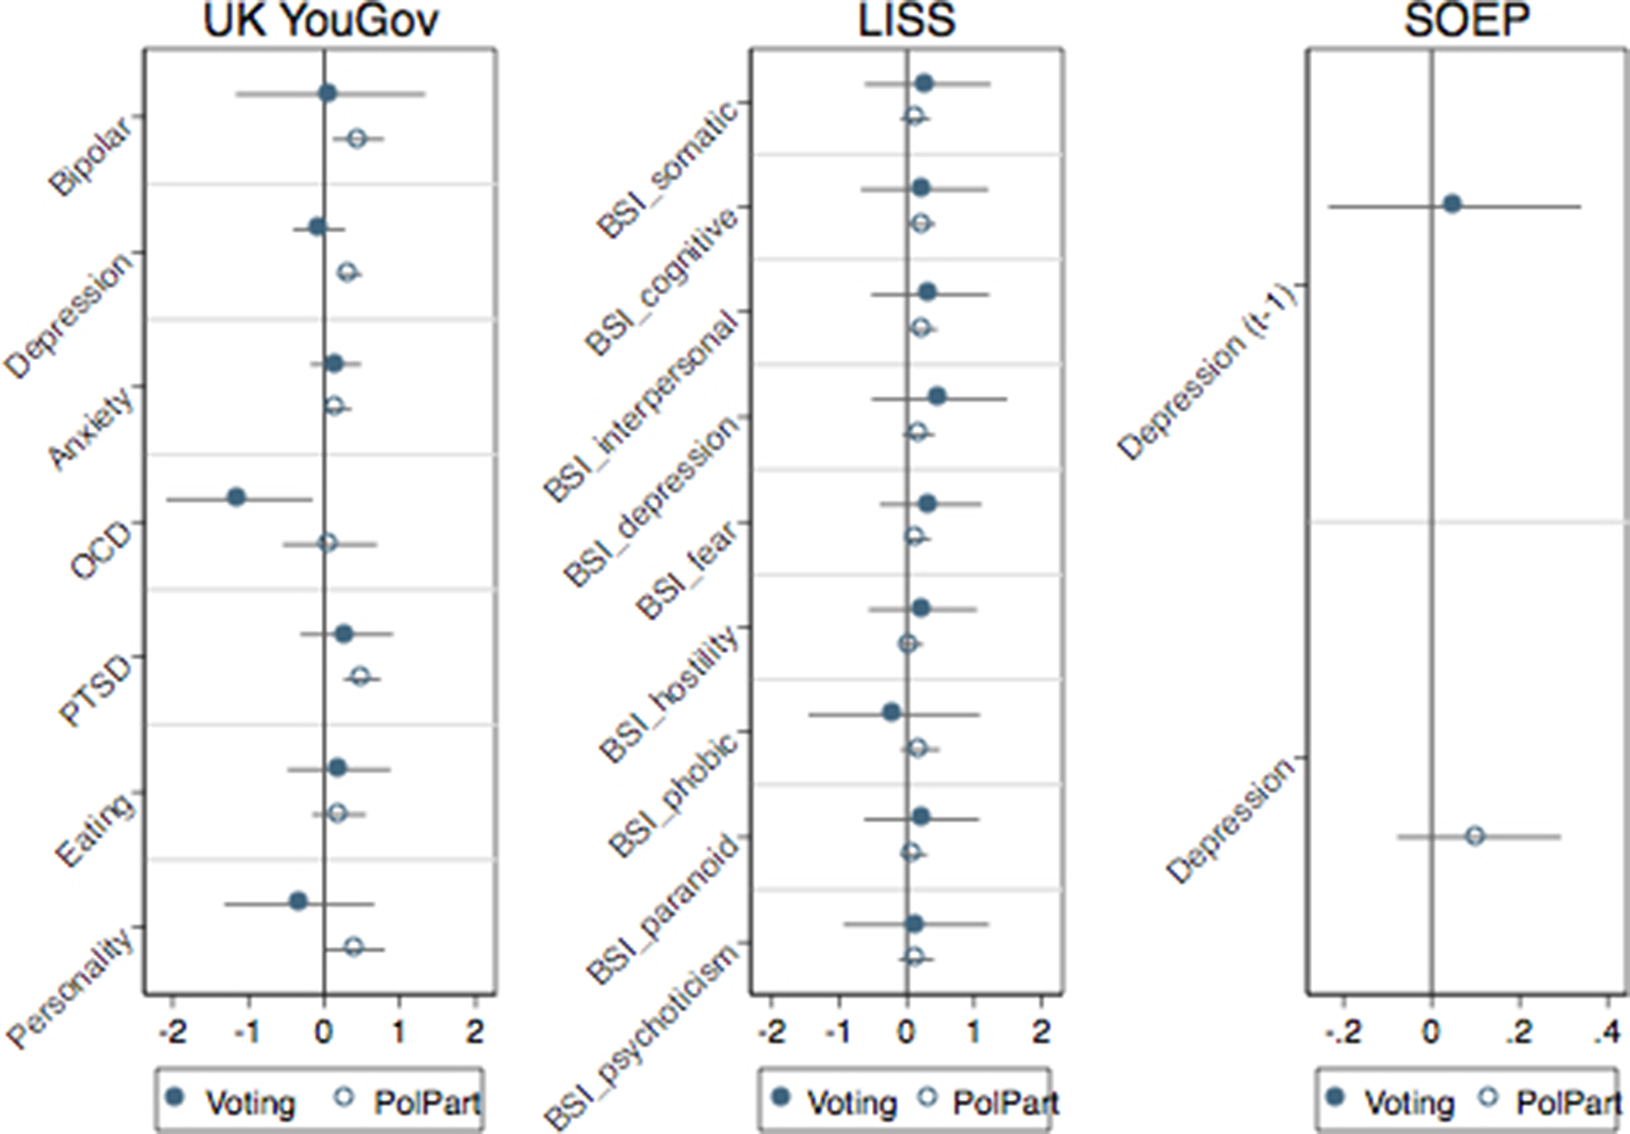
Figure 1. Evidence from self-reported diagnoses and symptoms.
Turning to other forms of political participation, Figure 1 finds evidence that depression, anxiety, PTSD, personality, and bipolar disorders are associated with higher levels of political participation (left panel). All BSI-9 coefficients are on the right-hand side of the zero line, with three (cognitive function, interpersonal sensitivity, and fear/anxiety) reaching conventional levels of statistical significance. The coefficient on depression in the SOEP data is positive for political participation but not significant.
Figure 2 reassesses the Resource Hypothesis using self-reported symptoms instead of self-reported diagnoses. The YouGov data include validated scales for depression (CESD-9), anxiety (STAI-6), and stress (PSS-4). Here we can test whether symptoms measured in February 2022 predict participation in May/June 2022, controlling for voting in the last general elections in 2019. In line with our previous analyses, we find no evidence that higher symptoms are associated with lower voting propensity. Instead, for depression and anxiety, we find that higher symptoms are associated with higher political participation and, especially, the nonphysical one. We replicate the analyses on depressive symptoms with the US ACL data with their wave II (1989), which included questions on vote recall and volunteering in a political organization. Here, it is noteworthy that the coefficient on depression is negative in both cases, implying that higher symptoms of depression are associated with lower voting and participation in a political organization in the US case. This is the only case in our analysis where depression is negatively related to decreased nonvoting political participation, although this result comes from a cross-sectional survey, which does not benefit from the more rigorous analysis possible with panel data, and the question was related only to one form of participation (volunteering in political organizations).
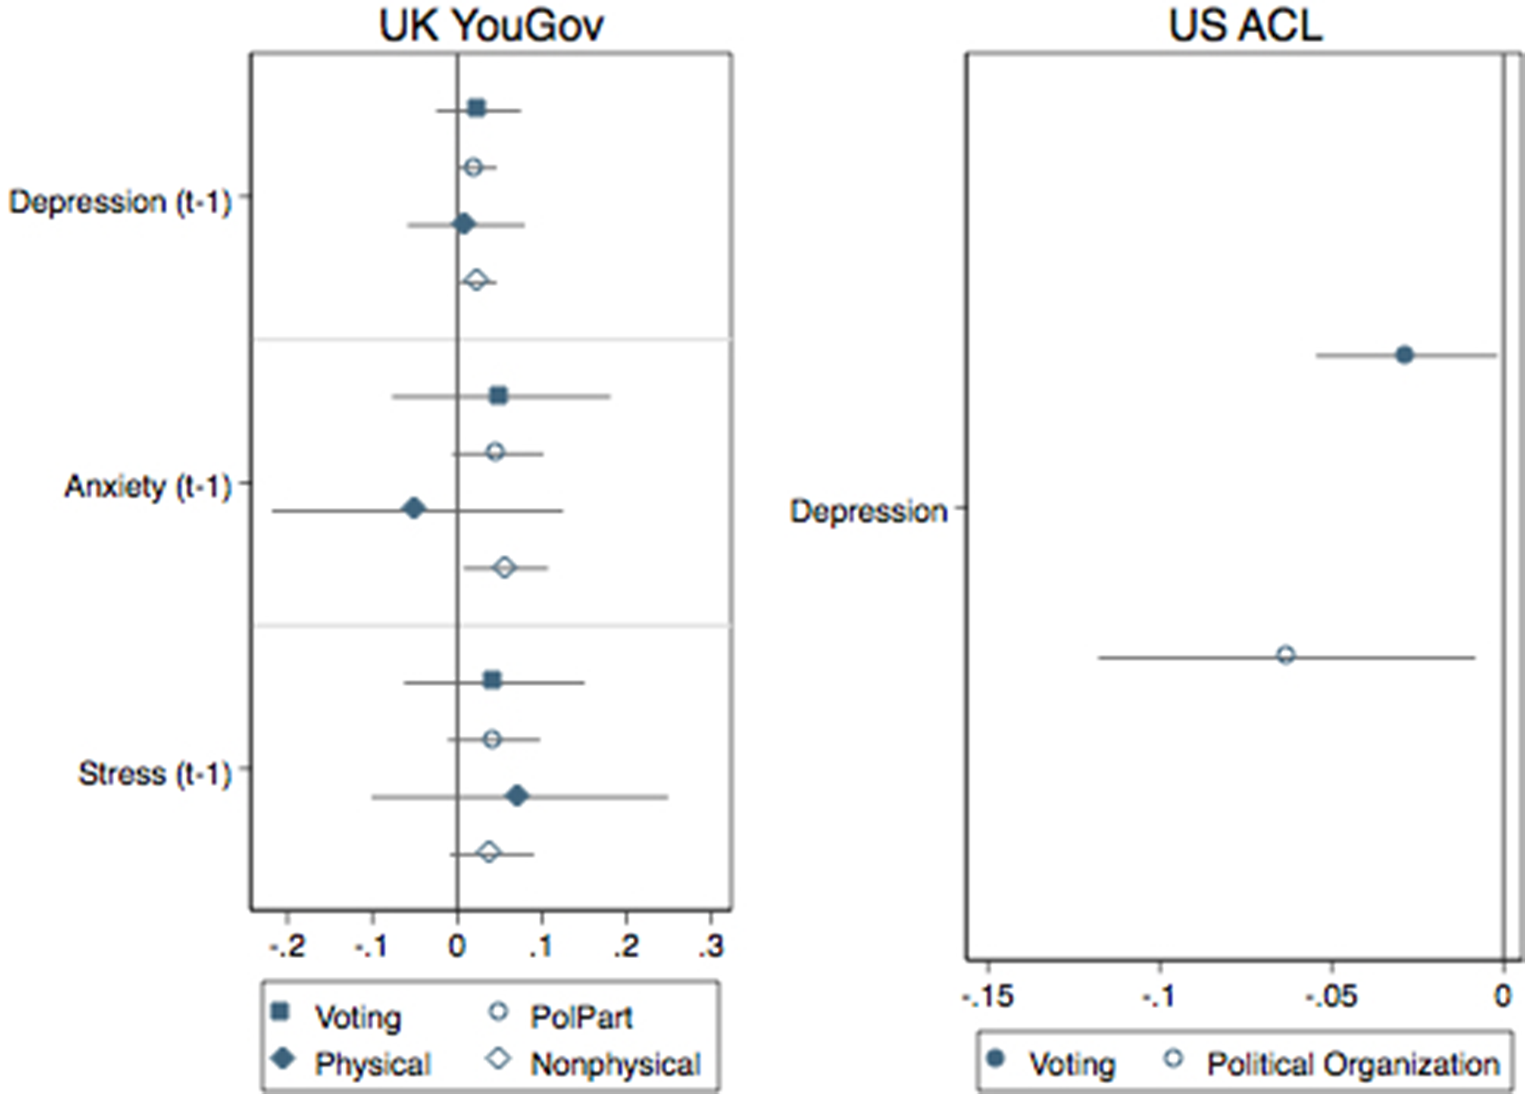
Figure 2. Evidence from validated scales of depression, anxiety, and stress symptoms.
Figure 3 is based on previous research on depression and political participation (Landwehr & Ojeda, Reference Landwehr and Ojeda2021) (Landwehr & Ojeda, Reference Landwehr and Ojeda2021) and breaks down nonvoting participation into physical and nonphysical forms, as the energy required for physical forms of participation (e.g., demonstrating or working in a political party) may be larger than for participation forms that do not involve major physical efforts (e.g., signing petitions or online participation). Our classification based on YouGov and LISS data is reported in Section B of the Supplementary Material. Again, results are against the Resource Hypothesis. In contrast with previous research, we find no evidence that mental health problems reduce physical political participation. Rather, in some instances—PTSD in the YouGov data and fear, hostility, phobic anxiety, and psychoticism in the LISS data—physical participation increases with mental health problems. Unlike previous research that found evidence that depression does not reduce nonphysical participation, we find that mental health problems are positively associated with nonphysical political participation for depression, anxiety, bipolar, PTSD, and personality disorders in the YouGov data and for cognitive functioning and interpersonal sensitivity in the LISS data.
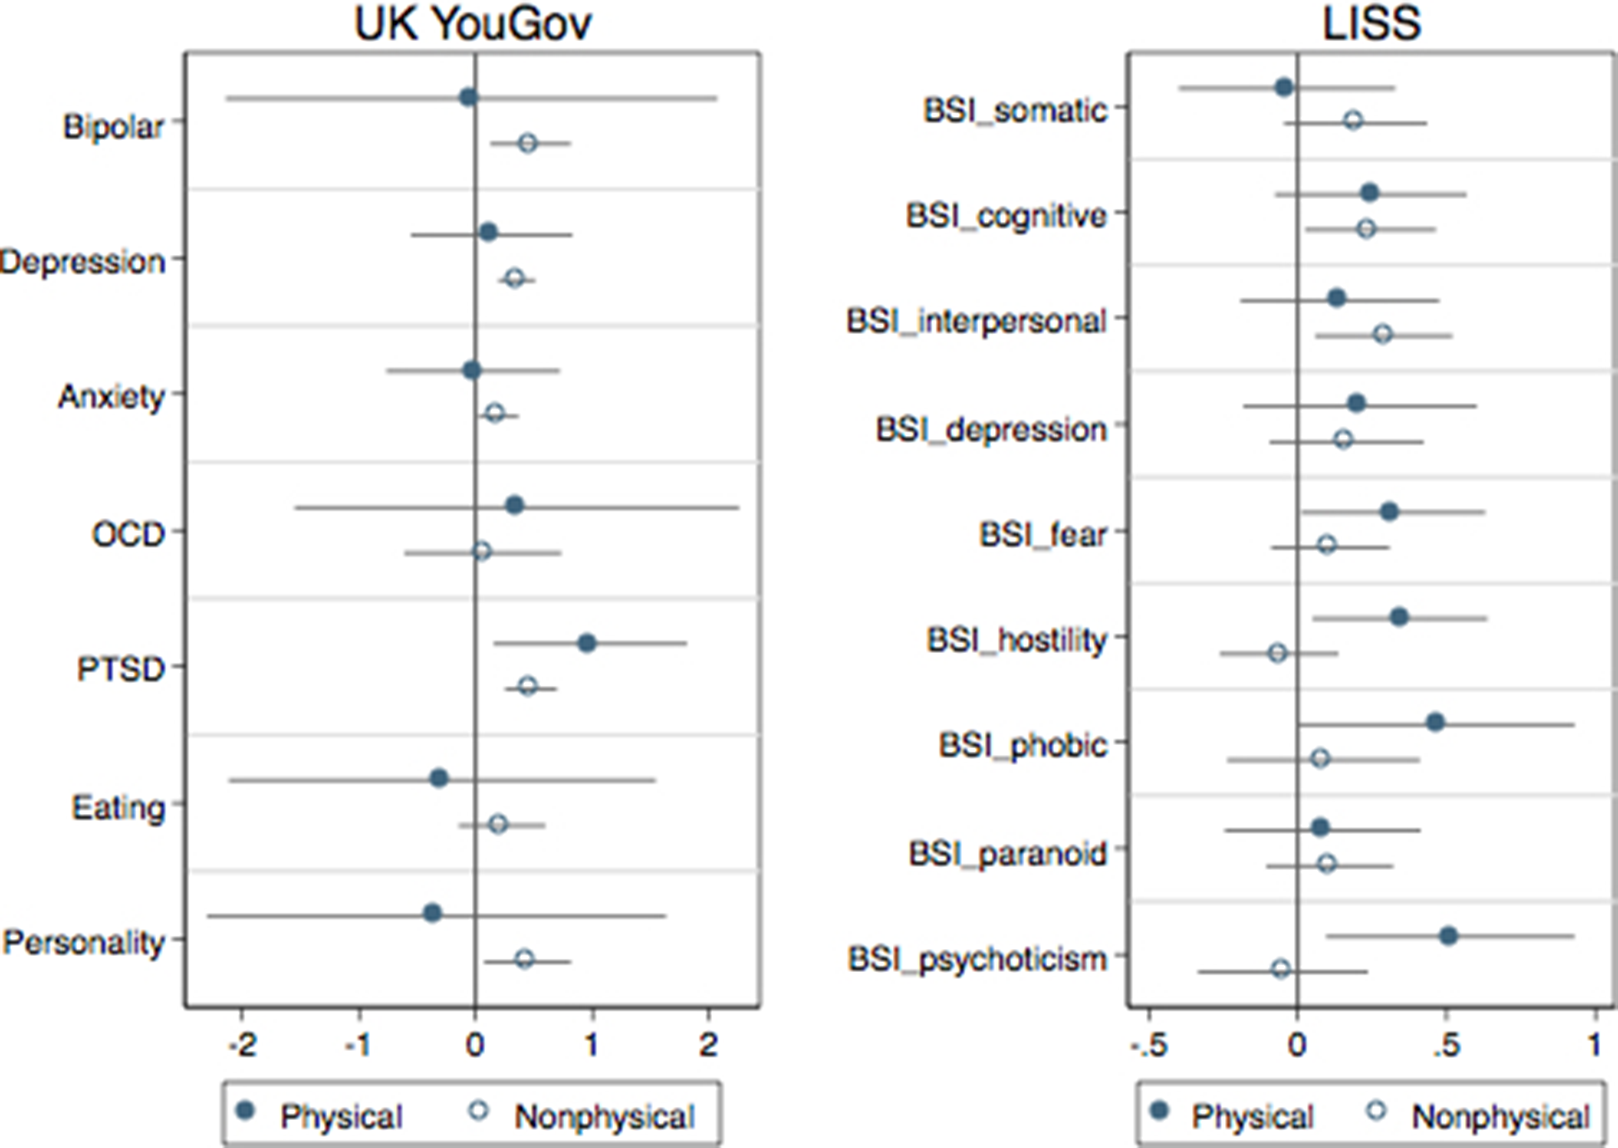
Figure 3. Physical and nonphysical participation.
Finally, we provide a tougher test for our hypothesis. We assume that comorbidity, that is, the simultaneous occurrence of more than one mental health condition, may heighten the effect of mental disorders. Psychological research has showed that it is quite typical that persons with mental health issues actually display symptoms that satisfy the criteria for more than one diagnosis at a time (Dalgleish et al., Reference Dalgleish, Black, Johnston and Bevan2020) Furthermore, research has found that, for example, accumulation of depressive episodes has a stronger effect on perceptions of government responsiveness (Bernardi et al., Reference Bernardi, Mattila, Papageorgiou and Rapeli2023). The YouGov data allowed us to create an additive index based on the number of diagnoses a respondent reported (75% of the sample reported 0 diagnoses; 13% reported 1; 8% reported 2; 2% reported 3; less than 1% reported 4; 0.3% reported more than 4 diagnoses) and the LISS data already had a variable that calculated the total of the BSI items for each respondent. The results presented in Figure 4 indicate that experiencing more than one mental health condition does not reduce voting. However, we find that the comorbidity of mental disorders is associated with higher participation in most forms other than voting.
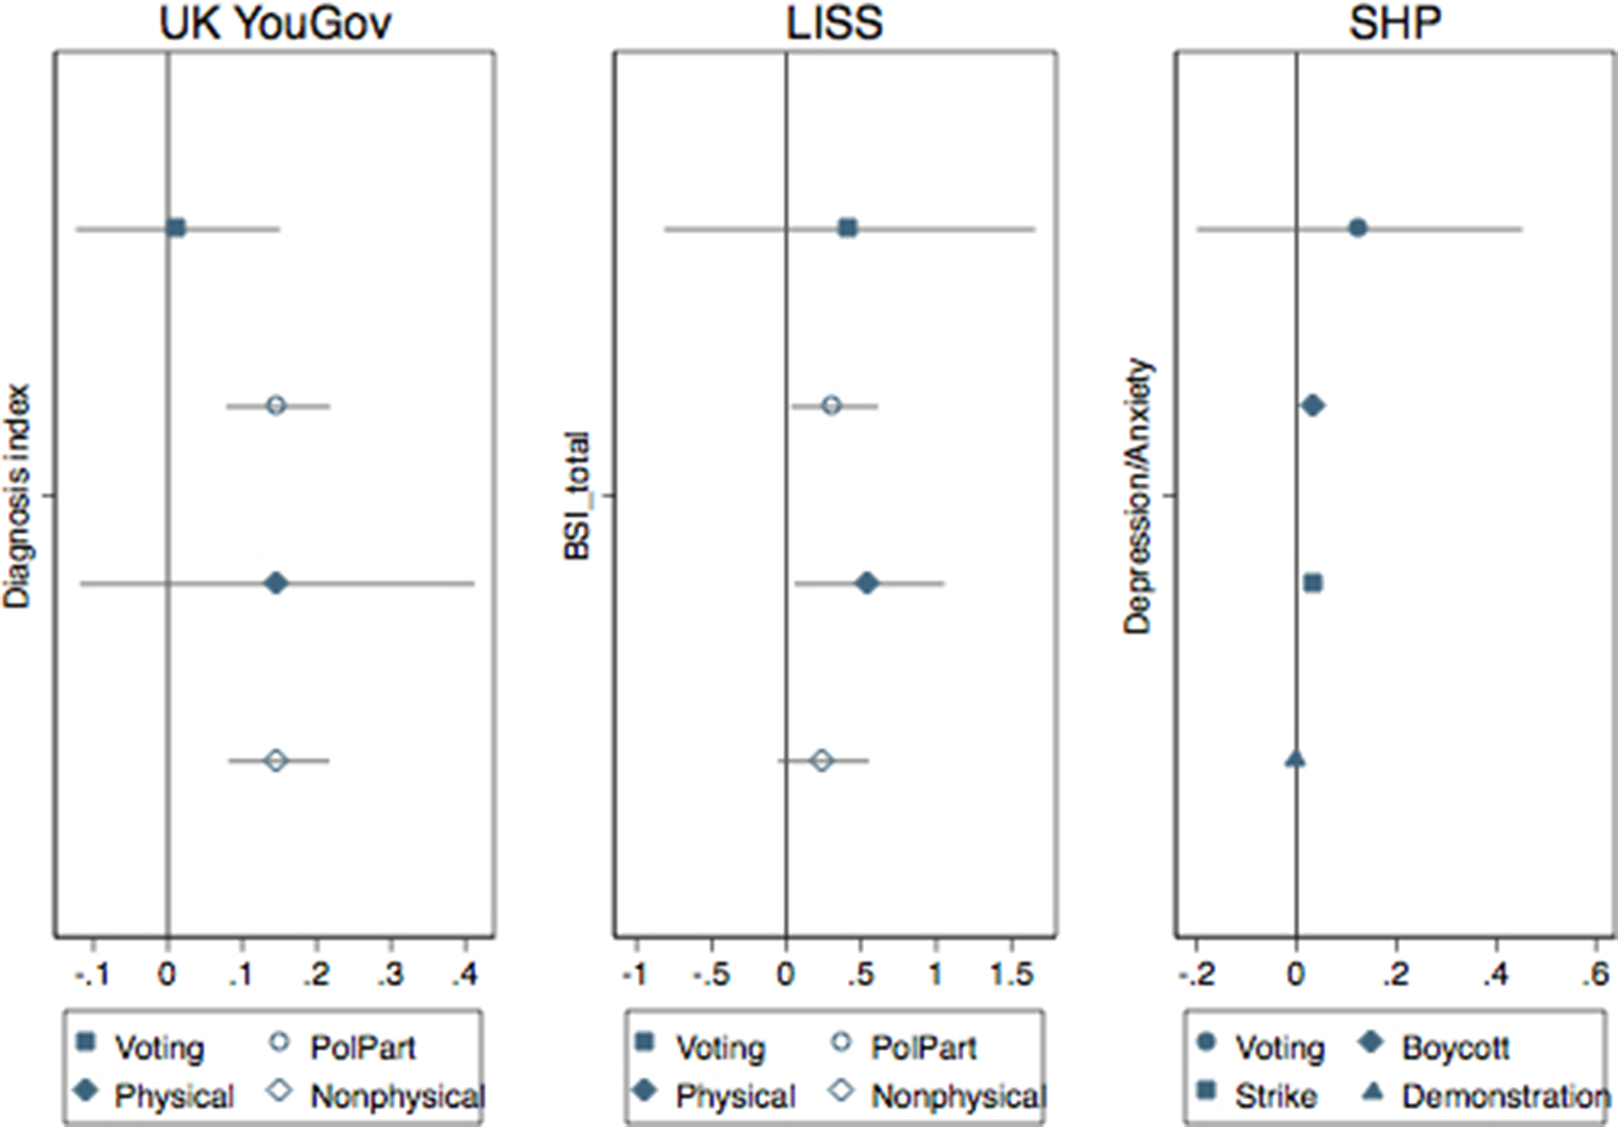
Figure 4. The comorbidity test.
Discussion
Our research note reports findings on mental health and political participation that are in many ways different from what we used to know. The assumption that poor mental health reduces political participation finds little evidence when tested in six different (cross-sectional and longitudinal) surveys. This does not mean that we do not find support at all for the Resource Hypothesis. In our extensive analyses, we find some evidence that mental health problems are correlated with reduced voting. The UK data from the YouGov survey showed that OCD is related to a lowered probability of voting, and the data from the US indicated similar results with depression. Nevertheless, with other datasets, the results on voting were non-significant. Instead, the associations we find between mental disorders and other forms of political participation are sometimes positive, potentially suggesting a mobilization effect—both when analyzing physical and nonphysical forms of participation and when accounting for comorbidity of mental disorders. In this respect, given that our findings come from alternative nationally representative samples, it seems that at least for mental disorders that do not imply severe cognitive deterioration, mental health problems may mobilize people into political action. This finding echoes the results from previous studies with physical health conditions reviewed above, which also show that health conditions may actually activate participation; although we do not find any evidence that mental health problems increase voting propensity in the same way as some chronic health conditions can do (Gollust & Rahn, Reference Gollust and Rahn2015; Sund et al., Reference Sund, Lahtinen, Wass, Mattila and Martikainen2017). Our findings may be linked to both individualistic aims (the need to influence public services) and to social factors, such as shared identities with people with similar health problems and joint memberships in various health advocacy organizations. In this respect, our finding speaks well to some of the scholarship on disability and political participation, whereby disabled people are found to be more active in demonstrations and direct contact with politicians (Mattila & Papageorgiou, Reference Mattila and Papageorgiou2017).
What is the takeaway of our research? A first point of consideration is devoted to depression, the most widely studied mental health problem by political scientists due to data availability. Taken together, our findings and the ones offered in previous research lead us to state that the story is far from being settled. A potential explanation is related to the meaning of the depression scales normally available to measure symptoms in the general public. Psychologists who have long studied the issue and proposed that such measures capture something closer to dissatisfaction and distress rather than symptoms of depression (Gotlib, Reference Gotlib1984). This would also explain why, in some instances, scales of depression and, for instance, anxiety tend to move together. When studying the association between mental distress and political support, research has found that scales of depression, anxiety, and stress are all associated with lower external political efficacy, trust in, and satisfaction with government (Bernardi & Gotlib, Reference Bernardi and Gotlib2022). We find the same tendency here with nonphysical participation, except that the sign goes in the opposite direction.
Our mapping and its findings suggest new ideas in the field of mental health and political participation that require scholarly attention. It is possible that public opinion surveys suffer from self-selection, misreporting, and nonresponse biases. First, if mental health problems really reduce political participation, and those who take these surveys tend to be more active citizens, then we may get a distorted view of the relationship we are studying.
Second, the stigma associated with mental illness may lead to misreporting—and underreporting—of one’s mental health conditions (Hinshaw & Stier, Reference Hinshaw and Stier2008; OECD, 2023b). Particularly, if similar types of respondents were to misreport both their mental health status and the amount of their political activities, our results could be biased, although the direction of the bias would depend on the severity and direction of misreporting. As for political participation, there is always a risk of slight overreporting due to social desirability, especially in the case of voting, which is often considered to be a civic duty. As far as we are aware, there are studies only on the misreporting of turnout, not other forms of participation. But Quintelier and Blais (Reference Quintelier and Blais2016) show that intention to participate correlates strongly with reporting actual participation 2 years later, which suggests self-reports of participation could be reasonably accurate. On the other hand, there is strong evidence from cohort studies that self-reported mental health measures are invariant over time (and generations), which means that mean differences across groups and regressions coefficients are not biased, but that the location of the mean may be (Ploubidis et al., Reference Ploubidis, Sullivan, Brown and Goodman2017; Ploubidis et al., Reference Ploubidis, McElroy and Moreira2019). Self-reported survey questions on mental health are not usually affected by systematic sources of error (Ploubidis et al., Reference Ploubidis, McElroy and Moreira2019). Having said so, we cannot rule out the possibility that the kinds of people who report (or misreport) mental health problems might be the same kinds of people who report (or misreport) being politically active.
In addition, we cannot exclude potential bias depending on the nature of measurement error. Random error in exposure measurements, Berkson or otherwise, reduces the power of a study, making it more likely that real associations are not detected (Armstrong, Reference Armstrong1998).
Relatedly, researchers have recently identified disadvantaged socioeconomic background in childhood, worse mental health and lower cognitive ability in early life, and lack of civic and social participation in adulthood as predictors of survey nonresponse (Mostafa et al., Reference Mostafa, Narayanan, Pongiglione, Dodgeon, Goodman, Silverwood and Ploubidis2021).
Thus, the questions for survey researchers become: how can we access people who experience mental health problems, which lead to severe cognitive deterioration, or those who may be distressed but are still less politically active? What kind of survey instruments do we need to go beyond general population scales that may not capture symptom specificities? Are we controlling for the key predictors of survey nonresponse? Can we successfully reduce measurement error?
Finally, we flag some challenges in studying cross-national effects of mental health conditions with survey data. First, individuals with severe conditions may be unable to participate in surveys (Korkeila et al., Reference Korkeila, Suominen, Ahvenainen, Ojanlatva, Rautava, Helenius and Koskenvuo2001), and our results might not extend to those with severe mental disorders. Second, although used in other surveys (e.g., UK Household Longitudinal Survey), self-reported measures of longstanding mental health problems are not as reliable as thorough psychiatric interviews. Third, our study reveals cross-country variation in the measures of mental health problems. Hence, contextual cross-country variation can affect our results. Previous studies have shown, for example, that the relationship between (general) health and participation is conditioned by the welfare state context (Shore et al., Reference Shore, Rapp and Stockemer2019). Because of these reasons, we follow the suggestion of the OECD (2023a) and invite researchers to try to homogenize survey data across countries to provide more comprehensive measures of mental disorders that allow us to study the effect of the severity of the disorder and expand on population samples beyond traditional social surveys.
Supplementary material
The supplementary material for this article can be found at http://doi.org/10.1017/pls.2025.10004.
Acknowledgments
We thank the Democracy, Elections and Citizenship group at the Autonomous University of Barcelona and the participants at the Elections, Public Opinion and Parties conference for their feedback. We also thank the editor and the reviewers for helping us improve the manuscript and George Ploubidis for his precious comments on misreporting and errors in surveys.
Data availability statement
All data, except for the YouGov survey, are publicly accessible upon request.
Competing interests
The authors declare none.


 Open access