


I. INTRODUCTION
Anisomycin (C14H19NO4, also known as flagecidin) is an antibiotic isolated from various Streptomyces species. It interferes with protein and DNA synthesis by inhibiting peptidyl transferase or the 80S ribosome system. Anisomycin has a role as an antiparasitic agent, a DNA synthesis inhibitor, a protein synthesis inhibitor, an antineoplastic agent, an antimicrobial agent, a bacterial metabolite, and an anticoronaviral agent (PubChem; Kim et al., Reference Kim, Chen, Cheng, Gindulyte, He, He and Li2023). The systematic name (CAS Registry No. 22862-76-6) is [(2R,3S,4S)-4-hydroxy-2-[(4-methoxyphenyl)methyl]pyrrolidin-3-yl] acetate. A two-dimensional molecular diagram of anisomycin is shown in Figure 1.
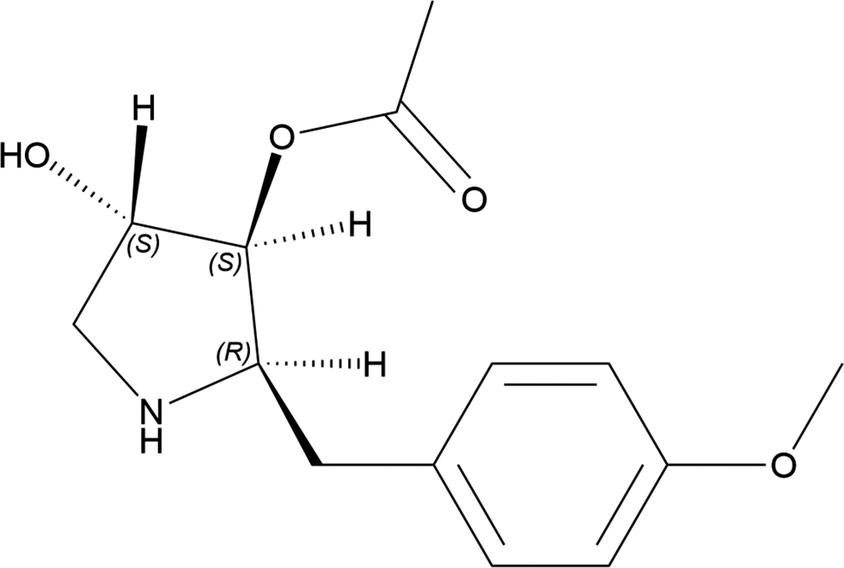
Figure 1. The two-dimensional structure of anisomycin.
The crystal structure of N-acetylbromoanisomycin has been reported (Schaefer and Wheatley, Reference Schaefer and Wheatley1968; CSD Refcode ANSMYC10). This structure was used to assign the stereochemistry of the parent anisomycin compound. There are 11 instances of anisomycin as a ligand in the Protein Data Bank (Berman et al., Reference Berman, Westbrook, Feng, Gilliland, Bhat, Weissig, Shindyalov and Bourne2000), but we are unaware of any published X-ray powder diffraction data for anisomycin.
This work was carried out as part of a project (Kaduk et al., Reference Kaduk, Crowder, Zhong, Fawcett and Suchomel2014) to determine the crystal structures of large-volume commercial pharmaceuticals and include high-quality powder diffraction data for them in the Powder Diffraction File™ (Kabekkodu et al., Reference Kabekkodu, Dosen and Blanton2024).
II. EXPERIMENTAL
Anisomycin was a commercial reagent, purchased from TargetMol (Batch #148686) and was used as received. The white powder was packed into a 0.5-mm-diameter Kapton capillary and rotated during the measurement at ~2 Hz. The powder pattern was measured at 298(1) K at the Wiggler Low Energy Beamline (Leontowich et al. Reference Leontowich, Gomez, Diaz Moreno, Muir, Spasyuk, King, Reid, Kim and Kycia2021) of the Brockhouse X-ray Diffraction and Scattering Sector of the Canadian Light Source using a wavelength of 0.819820(2) Å (15.1 keV) from 1.6 to 75.0° 2θ with a step size of 0.0025° and a collection time of 3 minutes. The high-resolution powder diffraction data were collected using eight Dectris Mythen2 X series 1K linear strip detectors. NIST SRM 660b LaB6 was used to calibrate the instrument and refine the monochromatic wavelength used in the experiment.
The pattern was indexed using JADE Pro (MDI, 2024) on a primitive orthorhombic unit cell with a = 5.80213, b = 8.58159, c = 28.64755 Å, V = 1,426.41 Å3, and Z = 4. The suggested space group was P212121, which was confirmed by the successful solution and refinement of the structure. A reduced cell search of the Cambridge Structural Database (Groom et al., Reference Groom, Bruno, Lightfoot and Ward2016), with the chemistry H, C, N, and O only, yielded 31 hits, but no structures for anisomycin or its derivatives.
The crystal structure was solved by direct methods as implemented in EXPO2014 (Altomare et al., Reference Altomare, Cuocci, Giacovazzo, Moliterni, Rizzi, Corriero and Falcicchio2013). All of the non-H atoms were assigned correctly. The opposite enantiomer to that indicated by PubChem (Kim et al., Reference Kim, Chen, Cheng, Gindulyte, He, He and Li2023) was obtained, so the structure was inverted using Mercury (Macrae et al., Reference Macrae, Sovago, Cottrell, Galek, McCabe, Pidcock and Platings2020), and the hydrogen atoms were added.
Rietveld refinement was carried out with GSAS-II (Toby and Von Dreele, Reference Toby and Von Dreele2013). Only the 3.0–50.0° portion of the pattern was included in the refinements (d min = 0.970 Å). All non-H-bond distances and angles were subjected to restraints, based on a Mercury/Mogul Geometry Check (Bruno et al., Reference Bruno, Cole, Kessler, Luo, Motherwell, Purkis and Smith2004; Sykes et al., Reference Sykes, McCabe, Allen, Battle, Bruno and Wood2011). The Mogul average and standard deviation for each quantity were used as the restraint parameters. The phenyl ring was restrained to be planar. The restraints contributed 1.6% to the overall χ 2. The hydrogen atoms were included in calculated positions, which were recalculated during the refinement using Materials Studio (Dassault Systèmes, 2023). The U iso of the heavy atoms were grouped by chemical similarity. The U iso of the H atoms were fixed at 1.3× the U iso of the heavy atoms to which they are attached. The peak profiles were described using the generalized (Stephens, Reference Stephens1999) microstrain model. The background was modeled using a six-term shifted Chebyshev polynomial, with a peak at 10.54° to model the scattering from the Kapton capillary and any amorphous component.
The final refinement of 84 variables using 18,401 observations and 48 restraints yielded the residual R wp = 0.05776. The largest peak (1.68 Å from C5) and hole (1.93 Å from O4) in the difference Fourier map were 0.47(11) and − 0.45(11) eÅ−3, respectively. The final Rietveld plot is shown in Figure 2. The largest features in the normalized error plot are in the shapes of some of the strong low-angle peaks. These misfits probably indicate subtle changes in the specimen during the measurement.

Figure 2. The Rietveld plot for anisomycin. The blue crosses represent the observed data points, and the green line represents the calculated pattern. The cyan curve indicates the normalized error plot, and the red line indicates the background curve. The vertical scale has been multiplied by a factor of 10× for 2θ > 19.4̊ and by a factor of 40× for 2θ > 35.0̊.
The crystal structure of anisomycin was optimized (fixed experimental unit cell) with density functional theory techniques using VASP (Kresse and Furthmüller, Reference Kresse and Furthmüller1996) through the MedeA graphical interface (Materials Design, 2024). The calculation was carried out on 32 cores of a 144-core (768-GB memory) HPE Superdome Flex 280 Linux server at North Central College. The calculation used the GGA-PBE functional, a plane wave cutoff energy of 400.0 eV, and a k-point spacing of 0.5 Å−1, leading to a 3 × 2 × 1 mesh, and took ~3.6 hours. Single-point density functional calculations (fixed experimental cell) and population analysis were carried out using CRYSTAL23 (Erba et al., Reference Erba, Desmarais, Casassa, Civalleri, Donà, Bush and Searle2023). The basis sets for the H, C, N, and O atoms in the calculation were those of Gatti et al. (Reference Gatti, Saunders and Roetti1994). The calculations were run on a 3.5-GHz PC using eight k-points and the B3LYP functional and took ∼1.5 hours.
III. RESULTS AND DISCUSSION
The root-mean-square (rms) Cartesian displacement of the non-H atoms in the Rietveld-refined and VASP-optimized molecules is 0.111 Å (Figure 3); the largest difference is 0.288 Å at O3. The agreement is within the normal range for correct structures (van de Streek and Neumann, Reference van de Streek and Neumann2014). The asymmetric unit is illustrated in Figure 4. The remaining discussion will emphasize the VASP-optimized structure.
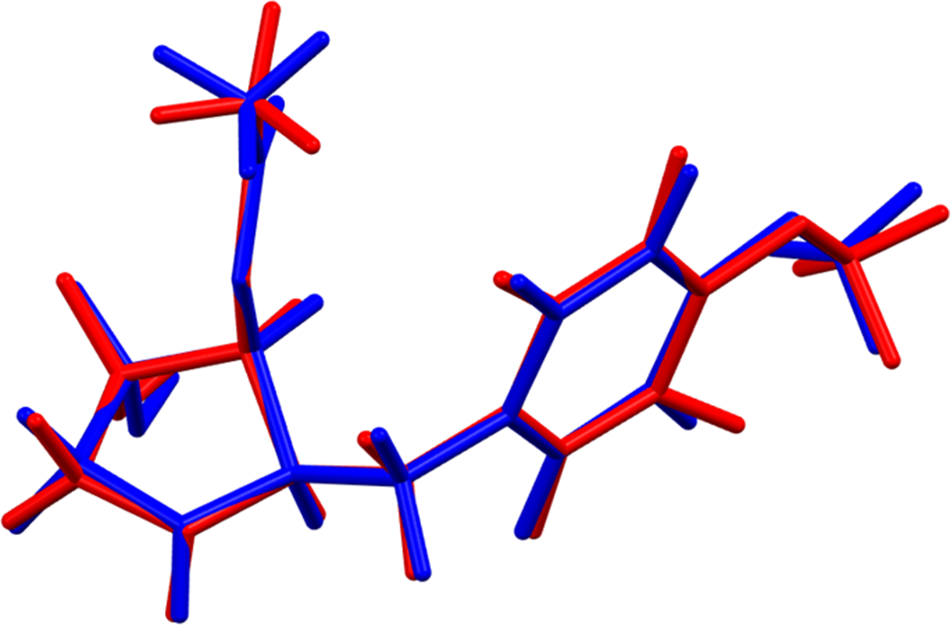
Figure 3. Comparison of the Rietveld-refined (red) and VASP-optimized (blue) structures of anisomycin. The root-mean-square Cartesian displacement is 0.111 Å. Image generated using Mercury (Macrae et al., Reference Macrae, Sovago, Cottrell, Galek, McCabe, Pidcock and Platings2020).
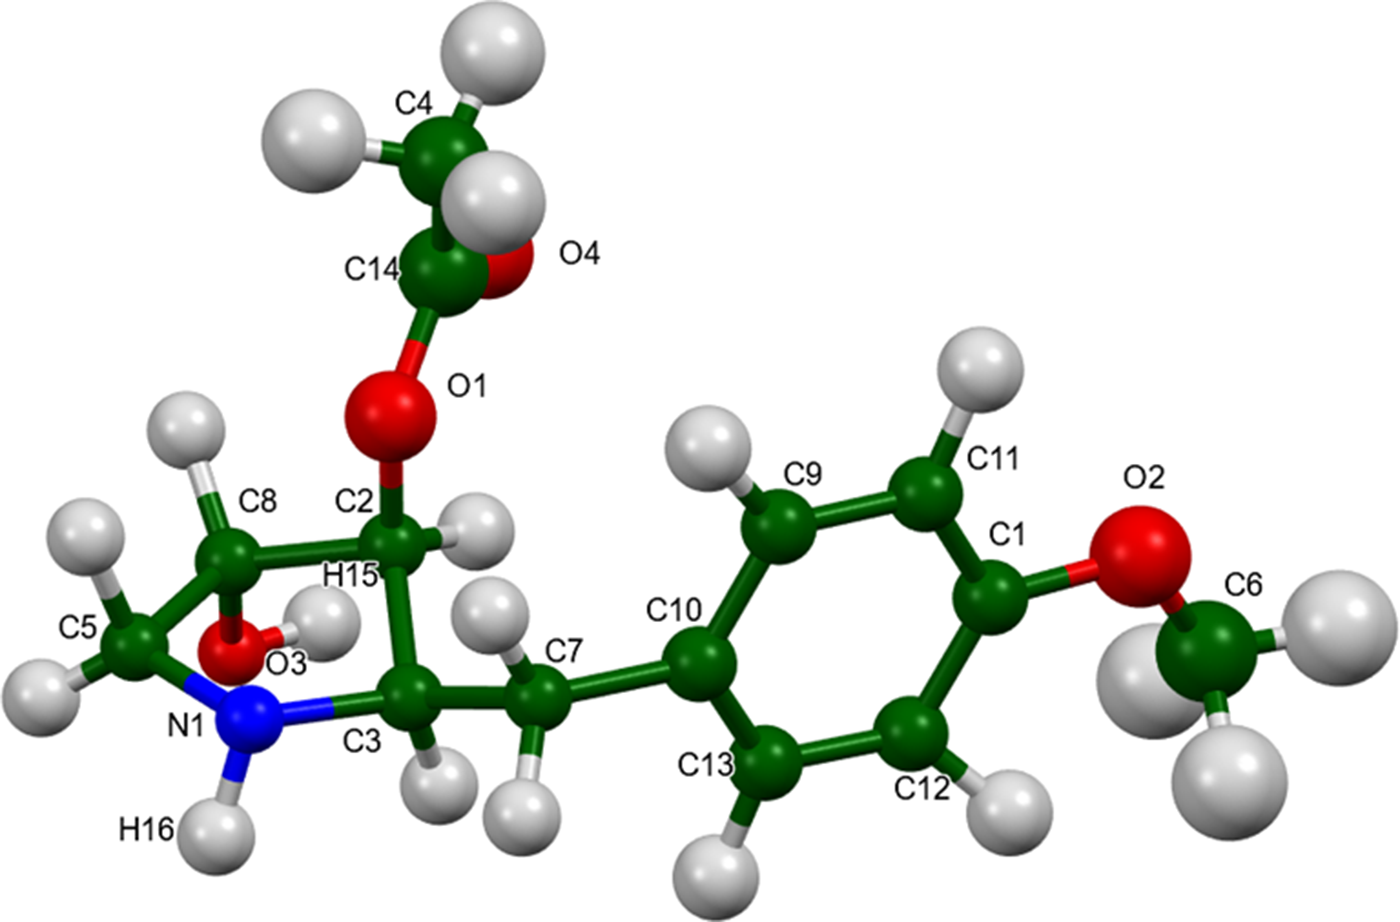
Figure 4. The asymmetric unit of anisomycin, with the atom numbering. The atoms are represented by 50% probability spheroids. Image generated using Mercury (Macrae et al., Reference Macrae, Sovago, Cottrell, Galek, McCabe, Pidcock and Platings2020).
All of the bond distances, bond angles, and torsion angles fall within the normal ranges indicated by a Mercury Mogul Geometry check (Macrae et al., Reference Macrae, Sovago, Cottrell, Galek, McCabe, Pidcock and Platings2020). The anisomycin of this study and the previously mentioned N-acetylbromoanisomycin molecules have different conformations (Figure 5), but all of the torsion angles fall within the normal ranges. Quantum chemical geometry optimization of the isolated anisomycin molecule (DFT/B3LYP/6-31G*/water) using Spartan ‘24 (Wavefunction, Inc., 2023) indicated that the observed conformation is 4.3 kcal/mol higher in energy than a local minimum, but very similar in geometry (rms Cartesian displacement = 0.268 Å). The global minimum-energy conformation is very similar.
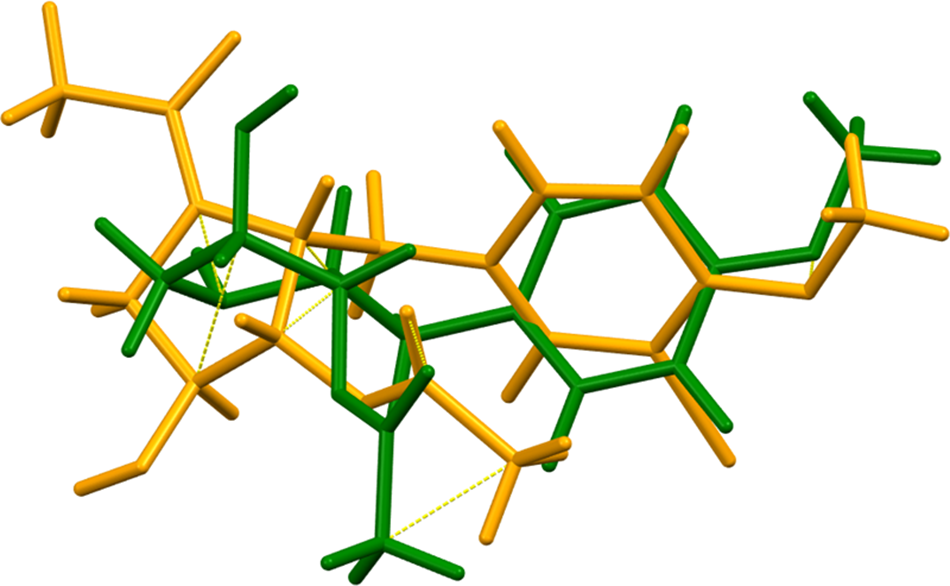
Figure 5. Comparison of the molecular structures of anisomycin (green) and N-acetylbromoanisomycin (orange).
The crystal structure (Figure 6) consists of layers of anisomycin molecules parallel to the ab-plane. The molecules form hydrogen-bonded chains along the a-axis. The mean plane of the phenyl ring is approximately (5, 7, 19). The Mercury Aromatics Analyser indicates a moderate interaction, with a minimum ring–ring distance of 5.8 Å.
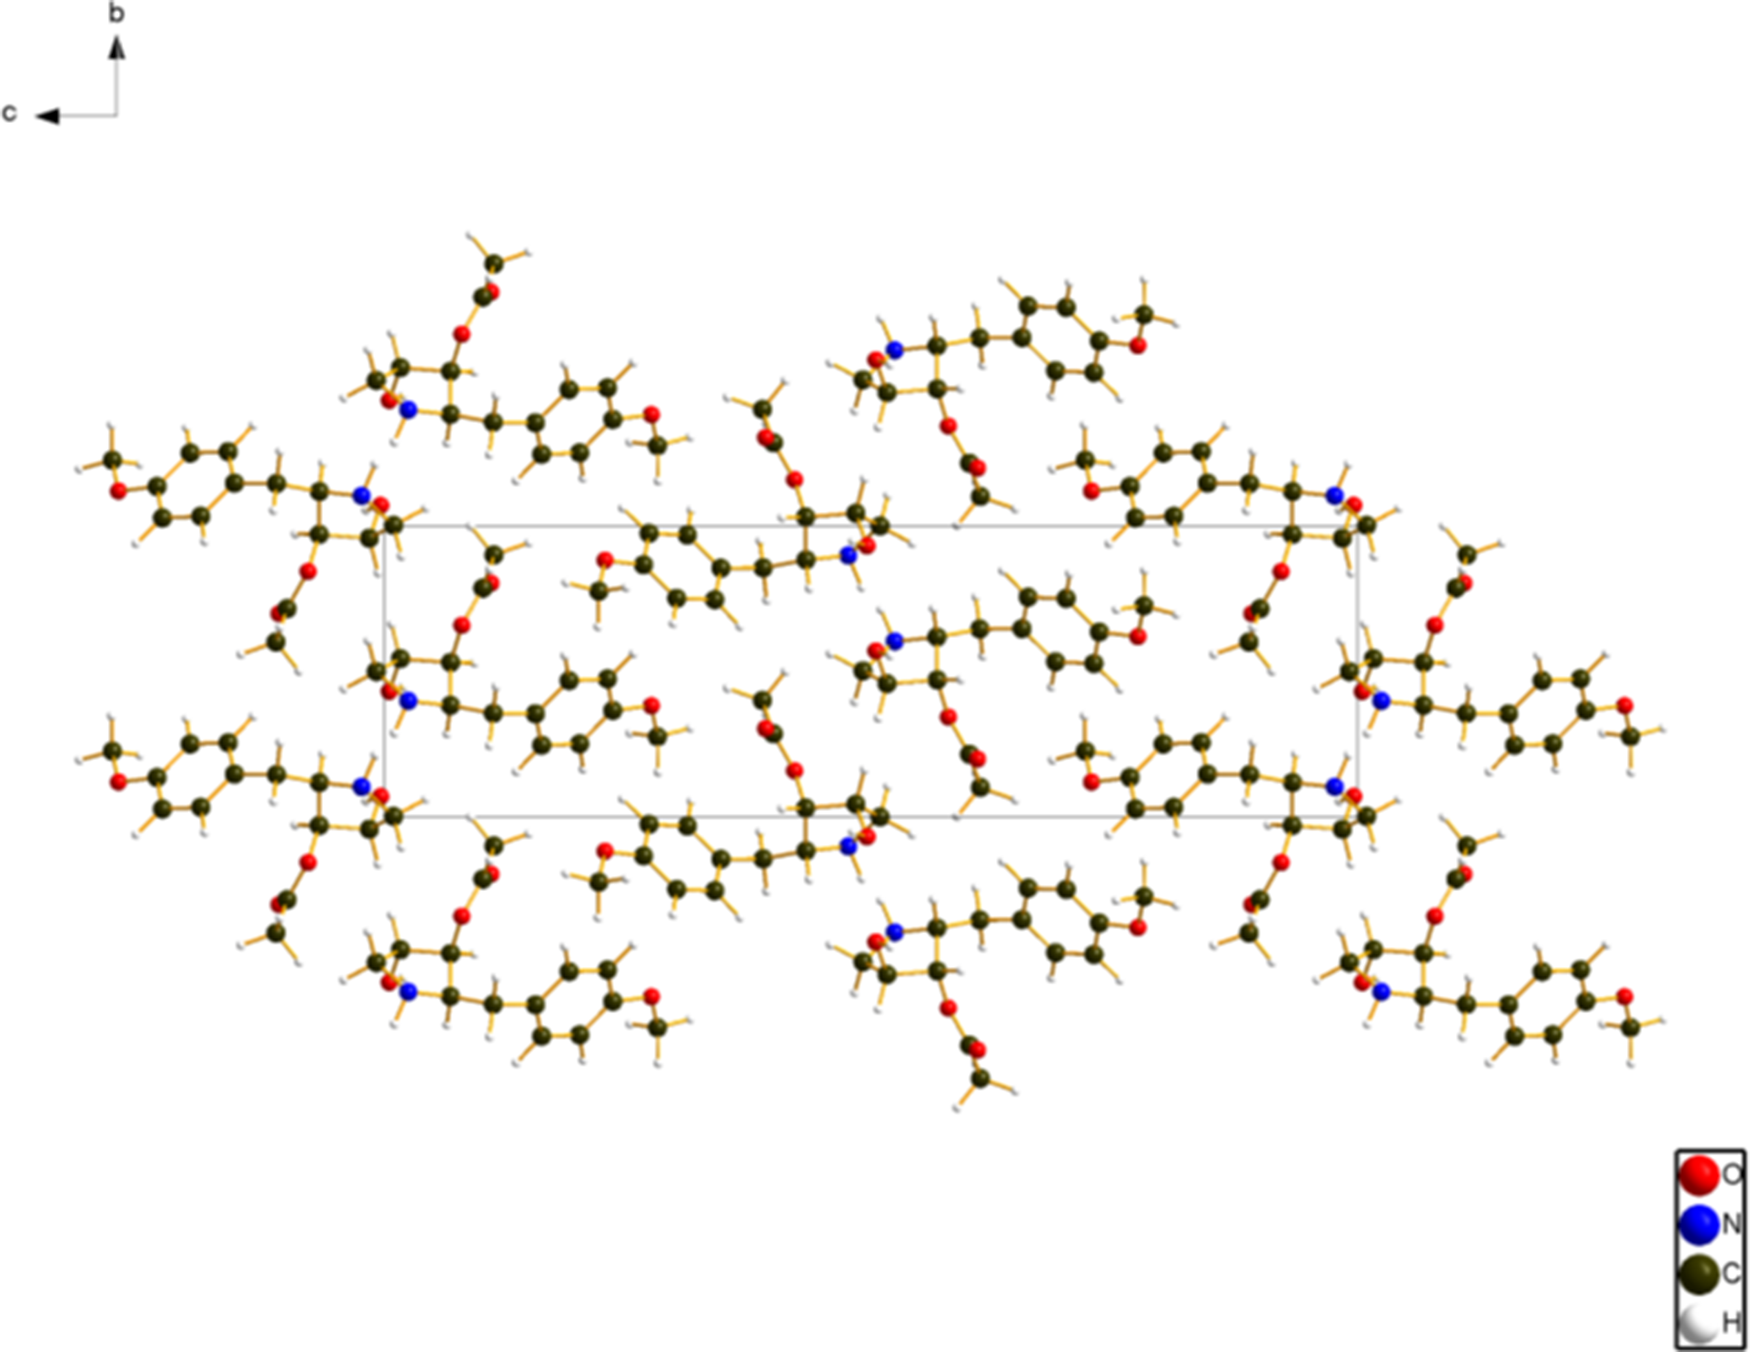
Figure 6. The crystal structure of anisomycin, viewed down the a-axis. Image generated using Diamond (Crystal Impact, 2023).
Analysis of the contributions to the total crystal energy of the structure using the Forcite module of Materials Studio (Dassault Systèmes, 2023) indicates that bond, angle, and torsion distortion terms contribute significantly to the intramolecular energy. The intermolecular energy is dominated by electrostatic attractions, which, in this force field-based analysis, also include hydrogen bonds. The hydrogen bonds are better discussed using the results of the density functional theory (DFT) calculation.
There are two classical hydrogen bonds in the structure (Table I), between the hydroxyl group O3 and the amino group N1. These form zig-zag chains along the c-axis (Figure 7). The energy of the N–H···O hydrogen bond was calculated using the correlation of Wheatley and Kaduk (Reference Wheatley and Kaduk2019). Several C–H···O hydrogen bonds also contribute to the lattice energy.
TABLE I. Hydrogen bonds (CRYSTAL23) in anisomycin
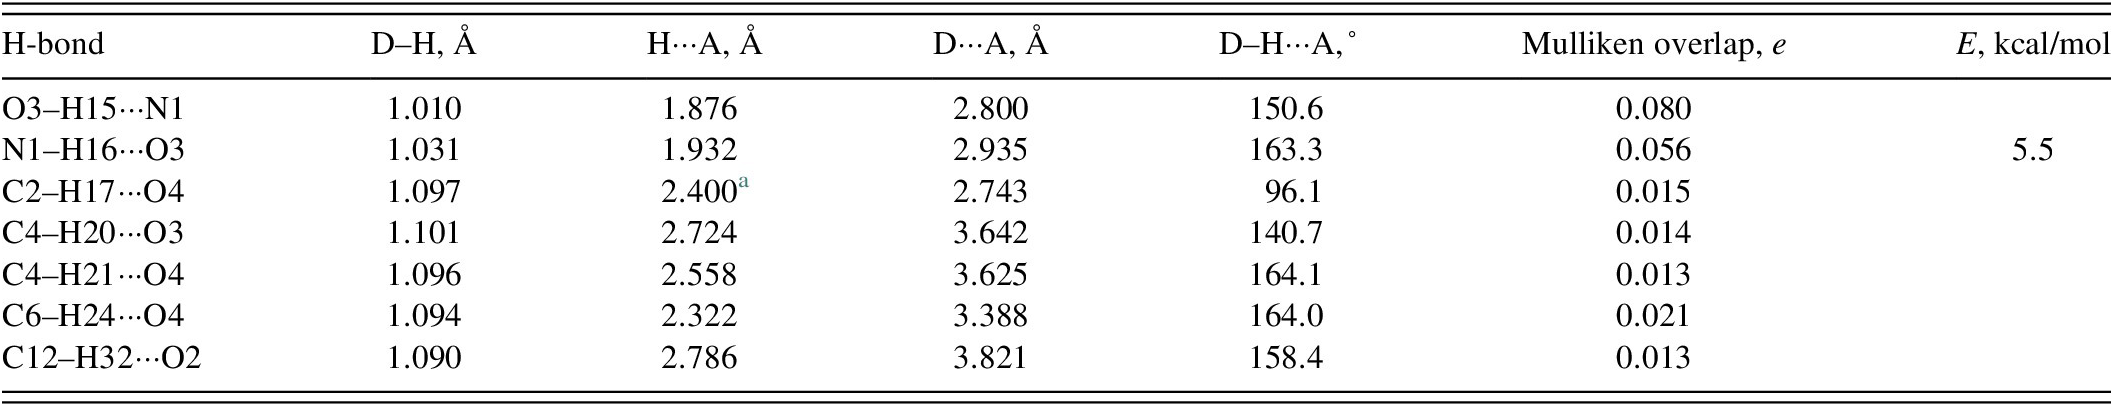
a Intramolecular.
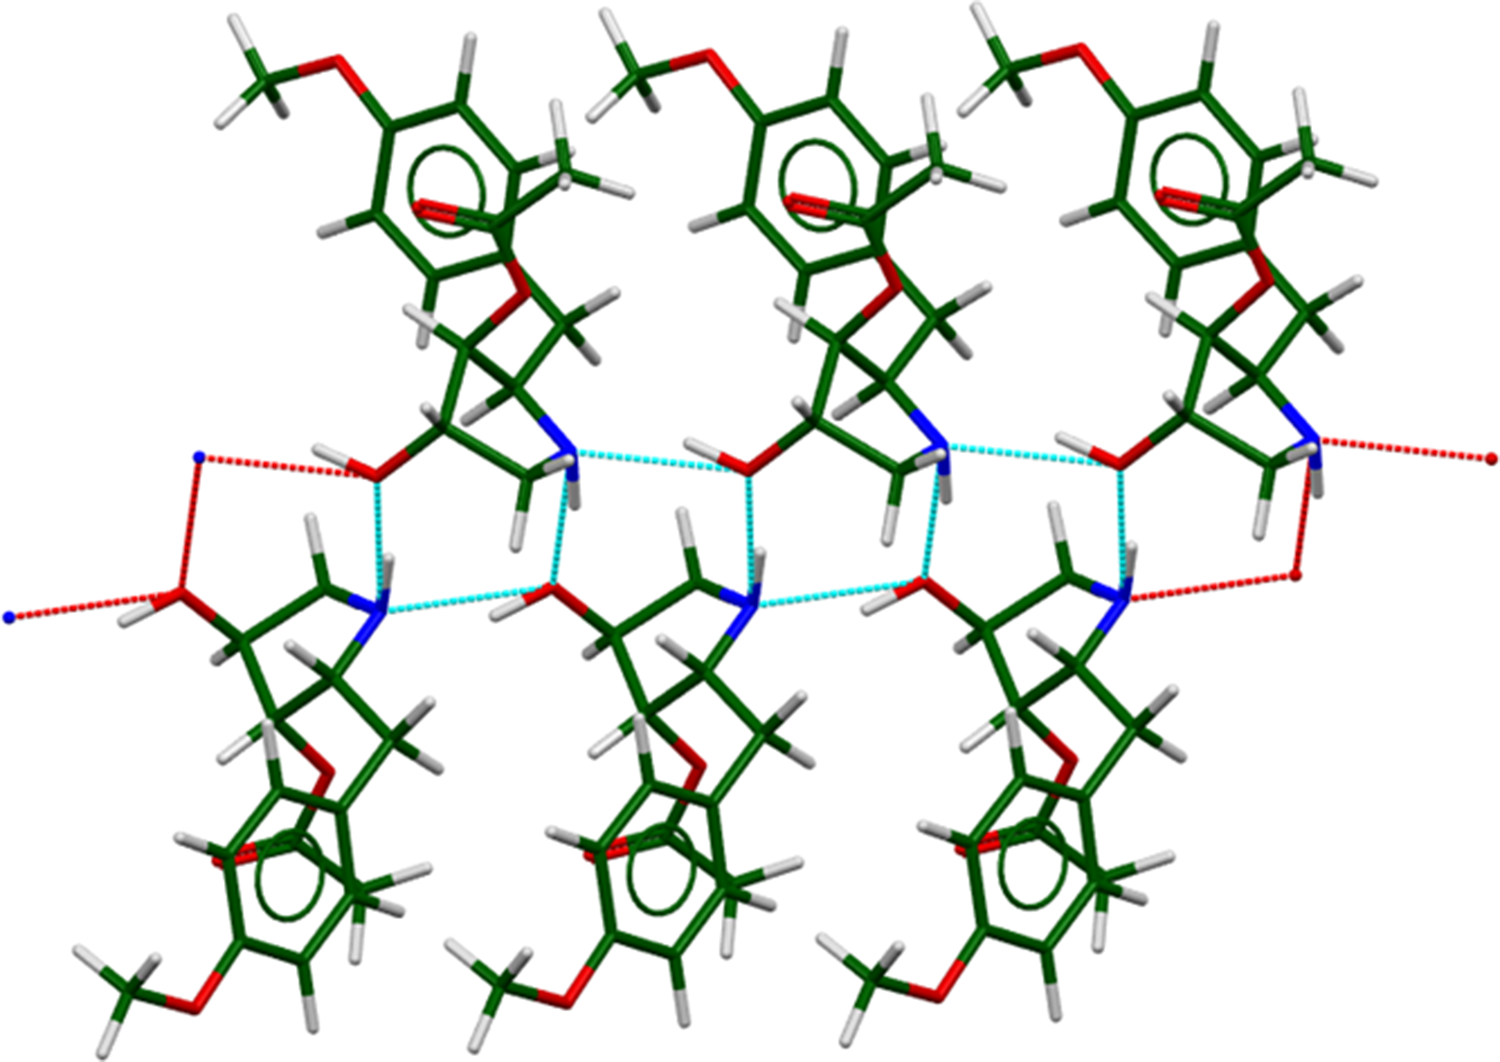
Figure 7. The hydrogen-bonded chains in anisomycin. Image generated using Mercury (Macrae et al., Reference Macrae, Sovago, Cottrell, Galek, McCabe, Pidcock and Platings2020). The cyan dashed lines are hydrogen bonds within a single asymmetric unit, and the red lines are those between asymmetric units. The c-axis is horizontal, the a-axis is vertical, and the view is down the b-axis.
The volume enclosed by the Hirshfeld surface of anisomycin (Figure 8; Hirshfeld, Reference Hirshfeld1977; Spackman et al., Reference Spackman, Turner, McKinnon, Wolff, Grimwood, Jayatilaka and Spackman2021) is 350.09 Å3, 98.19% of half the unit cell volume. The packing density is, thus, looser than normal. The only significant close contacts (red in Figure 8) involve the hydrogen bonds. The volume/non-hydrogen atom is higher than normal at 18.8 Å3.

Figure 8. The Hirshfeld surface of anisomycin. Intermolecular contacts longer than the sums of the van der Waals radii are colored blue, and contacts shorter than the sums of the radii are colored red. Contacts equal to the sums of radii are white. Image generated using CrystalExplorer (Spackman et al., Reference Spackman, Turner, McKinnon, Wolff, Grimwood, Jayatilaka and Spackman2021).
The Bravais–Friedel–Donnay–Harker (Bravais, Reference Bravais1866; Friedel, Reference Friedel1907; Donnay and Harker, Reference Donnay and Harker1937) algorithm suggests that we might expect platy morphology for anisomycin, with {001} as the principal faces. A second-order spherical harmonic model was included in the refinement. The texture index was 1.012(0), indicating that the preferred orientation was not significant in this rotated capillary specimen.
ACKNOWLEDGEMENTS
We thank Adam Leontowich for his assistance in the data collection.
DATA AVAILABILITY STATEMENT
The powder pattern of anisomycin from this synchrotron dataset has been submitted to the International Centre for Diffraction Data (ICDD) for inclusion in the Powder Diffraction File. The Crystallographic Information Framework (CIF) files containing the results of the Rietveld refinement (including the raw data) and the DFT geometry optimization were deposited with the ICDD. The data can be requested at pdj@icdd.com.
FUNDING STATEMENT
Part or all of the research described in this paper was performed at the Canadian Light Source, a national research facility of the University of Saskatchewan, which is supported by the Canada Foundation for Innovation (CFI), the Natural Sciences and Engineering Research Council (NSERC), the Canadian Institute of Health Research (CIHR), the Government of Saskatchewan, and the University of Saskatchewan. This work was partially supported by the International Centre for Diffraction Data.
CONFLICTS OF INTEREST
The authors have no conflicts of interest to declare.


 Open access