


Introduction
Single-molecule methods have revolutionized our understanding of how proteins interact with DNA. Many important details such as structure, dynamics, and kinetics, that are hidden in bulk methods, can be readily resolved using such techniques. Pioneering methods include optical (Wang et al., Reference Wang, Yin, Landick, Gelles and Block1997; Heller et al., Reference Heller, Hoekstra, King, Peterman and Wuite2014) and magnetic tweezers (Haber and Wirtz, Reference Haber and Wirtz2000) for longer DNA substrates and TIRF-based assays (Zhang and Guo, Reference Zhang and Guo2014) for shorter DNA. These methods rely on anchoring the DNA at one or two ends, which makes it difficult to study reactions that occur on the DNA ends, in particular for very long DNA.
We and others have extensively used nanofluidic channels to study DNA-protein complexes (Wang et al., Reference Wang, Tegenfeldt, Reisner, Riehn, Guan, Guo, Golding, Cox, Sturm and Austin2005; van der Maarel et al., Reference van der Maarel, Zhang and van Kan2014; Jiang et al., Reference Jiang, Zhang, Guttula, Liu, van Kan, Lavelle, Kubiak, Malabirade, Lapp and Arluison2015; Frykholm et al., Reference Frykholm, Berntsson, Claesson, de Battice, Odegrip, Stenmark and Westerlund2016, Reference Frykholm, Nyberg and Westerlund2017; Öz et al., Reference Öz, Sriram and Westerlund2019). Nanochannels have several properties that make them unique compared to other single DNA molecule methods. First of all, the DNA is stretched in nanochannels to almost its full contour length only due to confinement (Tegenfeldt et al., Reference Tegenfeldt, Prinz, Cao, Chou, Reisner, Riehn, Wang, Cox, Sturm, Silberzan and Austin2004; Reccius et al., Reference Reccius, Stavis, Mannion, Walker and Craighead2008), which means that no handles are required at the DNA end(s). This in turn makes it possible to stretch any DNA, for example DNA directly extracted from cells, including circular DNA. It also means that nanochannels can be used to study interactions between the ends of long DNA substrates (Jiang et al., Reference Jiang, Humbert, Sriram, Lequeu, Lin, Mely and Westerlund2019, Reference Jiang, Humbert, KK, Rouzina, Mely and Westerlund2021; Öz et al., Reference Öz, Wang, Guerois, Goyal, Kk, Ropars, Sharma, Koca, Charbonnier and Modesti2021). Secondly, nanofluidics is a high-throughput method where thousands of molecules can be imaged in just a few hours (Öz et al., Reference Öz, Howard, Sharma, Törnkvist, Ceppi, Kk, Kristiansson, Cejka and Westerlund2020). A commercial nanofluidics-based platform has been developed for enzymatic labeling-based optical genome mapping (Lam et al., Reference Lam, Hastie, Lin, Ehrlich, Das, Austin, Deshpande, Cao, Nagarajan, Xiao and Kwok2012). However, so far there are no reports of similar automated high-throughput platforms for studying DNA–protein interactions in nanochannels.
Our first DNA–protein interaction study was on RecA, a bacterial protein that is involved in DNA repair and forms filaments on DNA. We were able to determine the persistence length of such filaments without any tethering of the DNA (Frykholm et al., Reference Frykholm, Alizadehheidari, Fritzsche, Wigenius, Modesti, Persson and Westerlund2014). We later extended our studies to several other proteins, including proteins involved in DNA repair, such as Ku and LigD involved in non-homologous end-joining in bacteria (Öz et al., Reference Öz, Wang, Guerois, Goyal, Kk, Ropars, Sharma, Koca, Charbonnier and Modesti2021) as well as the human protein CtIP (Öz et al., Reference Öz, Howard, Sharma, Törnkvist, Ceppi, Kk, Kristiansson, Cejka and Westerlund2020), mostly known to be a cofactor of the MRX complex, and the MRX complex itself (Möller et al., Reference Möller, Sharma, Öz, Reginato, Cannavo, Ceppi, Sriram, Cejka and Westerlund2024). For CtIP, we demonstrated that it also has the capability to, on its own, bridge two DNA ends. In both the latter studies, we took advantage of the fact that it is easy to differentiate linear and circular DNA in nanochannels (Alizadehheidari et al., Reference Alizadehheidari, Werner, Noble, Reiter-Schad, Nyberg, Fritzsche, Mehlig, Tegenfeldt, Ambjornsson and Persson2015), where circular DNA forms when two ends of the same DNA molecule hybridize, while concatemers form via intermolecular hybridization. We have also studied the nuclear chaperone NC from HIV (Jiang et al., Reference Jiang, Humbert, KK, Rouzina, Mely and Westerlund2021). This protein has several important functions in protecting the viral RNA, condensing the viral DNA when it is formed inside the virus capsid, and promoting the formation of the most stable structure of the viral RNA genome. We demonstrated several of these features, such as that the protein forms local condensates along stretched DNA, and that the protein promotes annealing of single-stranded overhangs on long DNA, using nanofluidic channels and long DNA (Jiang et al., Reference Jiang, Humbert, Sriram, Lequeu, Lin, Mely and Westerlund2019). Both of these observed features are of importance in the current study.
DNA is structured inside cells by chromatin proteins. The best-studied examples are eukaryotic histones that wrap 147 bp DNA around an octameric protein core (Luger et al., Reference Luger, Mäder, Richmond, Sargent and Richmond1997). These so-called nucleosomes are responsible for DNA compaction and are involved in the repression of transcription, which can be regulated via posttranslational modifications. Prokaryotes use various chromatin proteins to compact and organize their genomes. These proteins can be classified based on their architectural properties: they can bend, bridge, loop, and wrap DNA or form a nucleofilament (Luijsterburg et al., Reference Luijsterburg, White, Van Driel and Dame2008; Amemiya et al., Reference Amemiya, Schroeder and Freddolino2021). The variety of DNA-binding proteins in prokaryotes makes them interesting objects to study chromatin structure as a factor in gene regulation (Felsenfeld et al., Reference Felsenfeld, Boyes, Chung, Clark and Studitsky1996; Amemiya et al., Reference Amemiya, Schroeder and Freddolino2021).
Well-studied nucleoid-associated proteins (NAPs) found in various bacteria are members of the Histone-like nucleoid structuring (H-NS) protein family (Qin et al., Reference Qin, Erkelens, Ben Bdira and Dame2019). H-NS binds DNA with a preference for AT-rich regions (Sette et al., Reference Sette, Spurio, Trotta, Brandizi, Brandi, Pon, Barbato, Boelens and Gualerzi2009; Gordon et al., Reference Gordon, Li, Cote, Weirauch, Ding, Hughes, Navarre, Xia and Liu2011), which relates to the fact that such regions have been generally obtained via horizontal gene transfer and that xenogeneic DNA is often AT-rich. Most H-NS family members can bridge two dsDNA segments and form a nucleoprotein filament along dsDNA, dependent on physicochemical conditions (Dame et al., Reference Dame, Wyman and Goosen2000, Reference Dame, Noom and Wuite2006; Amit et al., Reference Amit, Oppenheim and Stavans2003; van der Valk et al., Reference van der Valk, Vreede, Qin, Moolenaar, Hofmann, Goosen and Dame2017).
Many Bacillus species express a NAP-protein called Rok (reviewed in Erkelens et al., Reference Erkelens, van Erp, Meijer and Dame2025) that has been previously classified as an atypical H-NS-like protein. Rok was found to be able to bridge two DNA duplexes in vitro irrespective of environmental cues, which sets it apart from most H-NS proteins (Erkelens et al., Reference Erkelens, Qin, van Erp, Miguel-Arribas, Abia, Keek, Markus, Cajili, Schwab and Meijer2022). The DNA bridging mediated by Rok is associated with its function of silencing the transcription of certain competence genes, as well as organizing the genome (Hoa et al., Reference Hoa, Tortosa, Albano and Dubnau2002; Serrano et al., Reference Serrano, Torres and Alonso2021). Analogous to H-NS, Rok exhibits a preference for AT-rich regions of DNA (Seid et al., Reference Seid, Smith and Grossman2017; Duan et al., Reference Duan, Ding, Hughes, Navarre, Liu and Xia2018). However, Rok has a less pronounced charge distribution than H-NS and a neutrally charged linker as opposed to the positively charged linker in H-NS, which plays a role in the cooperativity of Rok-DNA binding (Öz et al., Reference Öz, Sriram and Westerlund2019; Erkelens et al., Reference Erkelens, Qin, van Erp, Miguel-Arribas, Abia, Keek, Markus, Cajili, Schwab and Meijer2022). In contrast, an internally truncated variant of Rok, called sRok, encoded on Bacillus plasmids of the pLS20 family, binds DNA but does not induce DNA compaction (Singh et al., Reference Singh, Ramachandran, Durán-Alcalde, Alonso, Wu and Meijer2012; Val-Calvo et al., Reference Val-Calvo, Miguel-Arribas, Abia, Wu and Meijer2021; Erkelens et al., Reference Erkelens, Qin, van Erp, Miguel-Arribas, Abia, Keek, Markus, Cajili, Schwab and Meijer2022). sRok also switches from a nucleofilament formation mode to a DNA-bridging mode in response to changes in physicochemical conditions.
Here, we extend the studies of DNA–protein interactions using nanofluidic channels to a multiplexed device, previously used for optical DNA mapping of plasmids (Kk et al., Reference Kk, Lin, Sewunet, Wrande, Sandegren, Giske and Westerlund2021), where up to 10 different conditions can be imaged in parallel. The nanofluidic device in conjunction with an automated fluid-handling and image-acquisition platform enables high-throughput studies of DNA–protein interactions. Using this platform, we have studied three variants of Bacillus subtilis Rok: wild-type, the engineered variant ∆Rok, and the naturally occurring variant sRok. The specific DNA-binding properties of Rok make it an interesting target and a robust example of a DNA-bridging protein to investigate in our single-molecule assay. Doing this, we confirm the DNA-bridging properties of Rok and its specificity for AT-rich DNA and reveal a novel activity in stabilizing the hybridization of complementary single-stranded overhangs at DNA ends.
Methods
Nanofluidics and automation
A multiplexed nanofluidic device (Kk et al., Reference Kk, Lin, Sewunet, Wrande, Sandegren, Giske and Westerlund2021) capable of processing 10 samples at a time was used for the experiments (Figure 1). As described previously (Öz et al., Reference Öz, Sriram and Westerlund2019), Kk et al., Reference Kk, Lin, Sewunet, Wrande, Sandegren, Giske and Westerlund2021), the device was fabricated on a Si wafer using standard fabrication techniques, such as photolithography and e-beam lithography. The nanochannels in the device have dimensions of 100 nm × 150 nm × 500 μm (width × height × length). The device consists of 10 separate blocks of nanochannels, with each block containing 400 nanochannels. Each block is connected to a separate microfluidic channel (50 μm × 1.5 μm (width × height)), which has two loading wells. The sample is loaded into one of the loading wells, while the buffer is loaded into the other. A single microfluidic channel that connects to all 10 blocks of nanochannels serves as the drain.
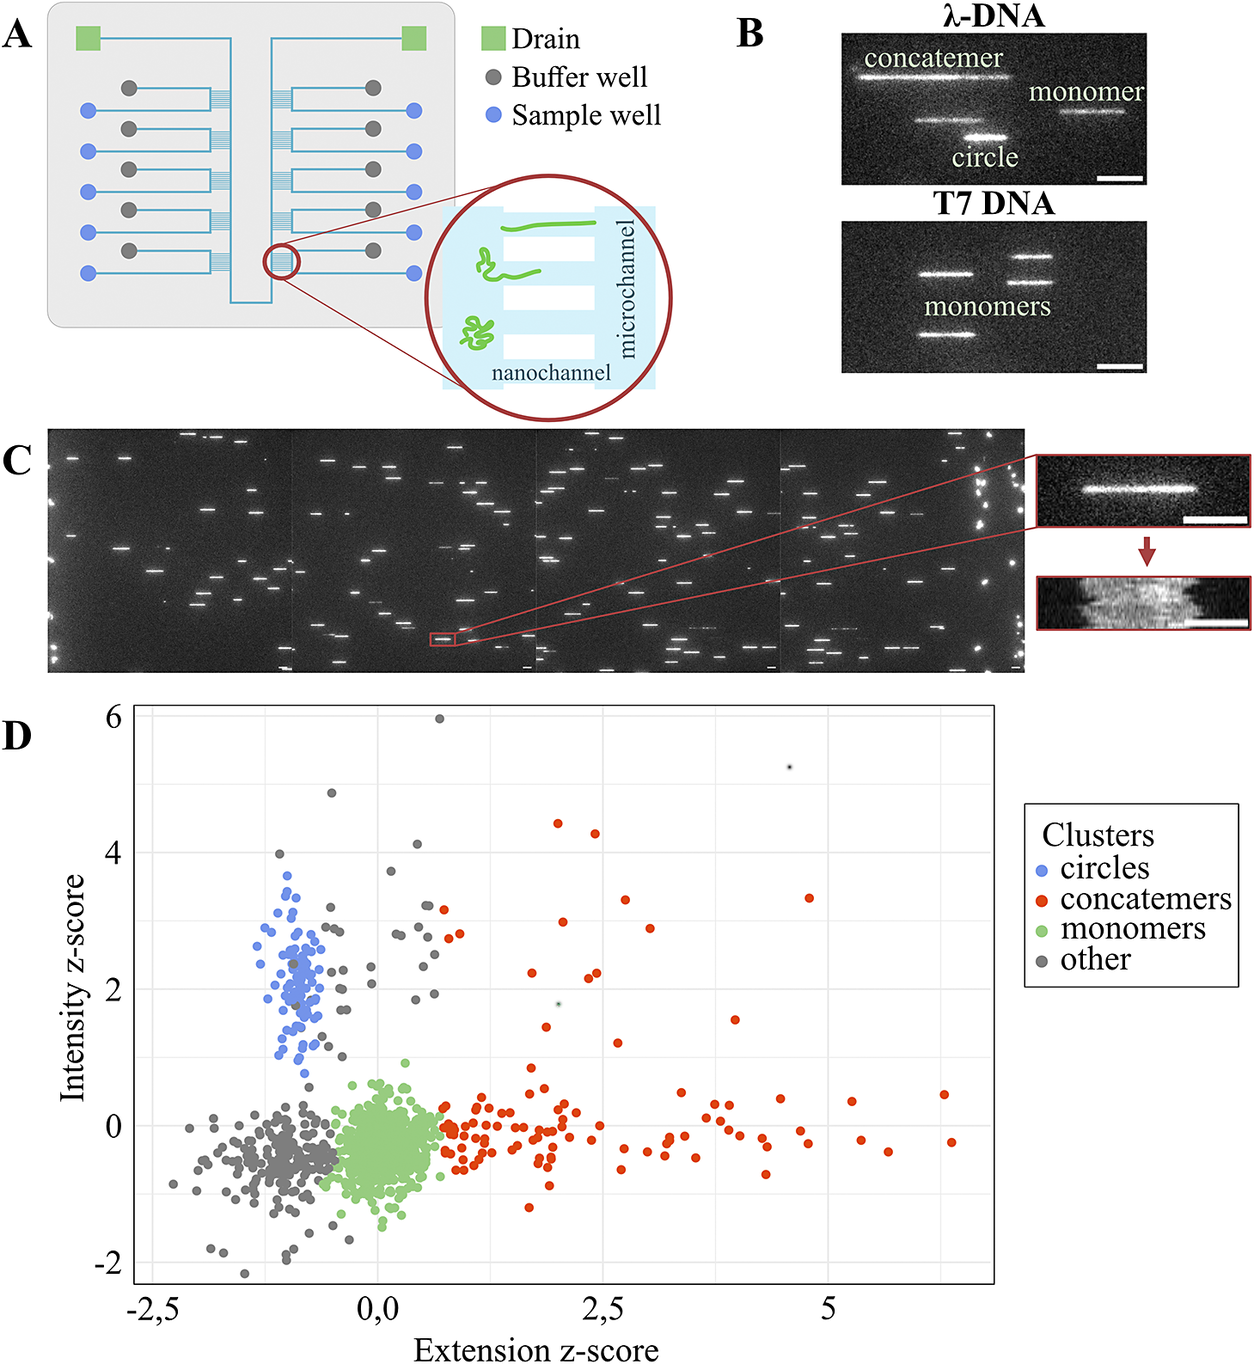
Figure 1. Experimental outline. (A) Schematic of the multiplexed nanofluidic device showing the stretching of DNA in nanochannels. (B) Examples of observed molecule types for λ-DNA and T7-DNA. The scale bar in the images represents a length of 5 μm. (C) Representative images of λ-DNA stretched in nanochannels, an individual λ-DNA molecule, and a kymograph resulting from stacking 15 consecutive frames. The scale bar in the images and the kymograph represents a length of 5 μm. (D) Representative scatter plot of 4 μM λ-DNA incubated with 165 nM Rok, illustrating the relationship between intensity and extension, with clustering based on the DNA molecule type.
The nanofluidic device is mounted on an acrylic chuck that has four inlets for nitrogen gas flow. One of the inlets is connected to the sample loading wells, one to the buffer loading wells, and two inlets are connected to the drain. All sample loading wells (from all 10 sets) are connected to a single inlet. The buffer loading wells are connected in a similar fashion. Thus, all 10 samples can be pushed into the nanochannels simultaneously by controlling the nitrogen flow at the two inlets. The nitrogen flow is controlled by a pressure control system consisting of a pressure controller (OB1 MK3 from Elveflow), a valve controller (Mux wire), and a pair of solenoid valves (SMC LVM10R6-5B1U-60). The pressure control system was modulated by means of a custom script written using the ESI software from Elveflow.
The imaging system consists of a Zeiss Observer Z1 inverted fluorescence microscope equipped with a 100X NA 1.46 objective, a high-power LED light source (Colibri 7), and an sCMOS camera (Photometrics Prime 95B 22 mm). For these experiments, a fluorescence filter-set consisting of a band-pass excitation filter (455–495 nm), a dichroic mirror (500 nm), and a band-pass emission filter (505–555 nm) was used. The microscope is also equipped with a motorized stage and focus control. A custom script was written using the Zen Pro macro module to control the microscope. A trigger box from Zeiss (SVB-1) was used to synchronize the trigger signals to the microscope and the pressure control system to facilitate the automated image acquisition.
The samples are first flushed through the microchannels for 30 s. Following this, the DNA molecules are pre-concentrated at the nanochannel entrance by applying pressure (500 mbar) through both the sample and buffer inlets for 2 min 30 s. Finally, the molecules are pushed into the nanochannels by applying an impulse pressure of 2000 mbar for 1.2 s. After the pressure pulse, the pressure controller sends a trigger signal to the trigger box, which then signals the microscope to commence image acquisition. A lookup table consisting of X, Y stage positions and focus positions determines the movements of the microscope stage. The microscope moves to each position on the chip according to the table and captures 15 frames per FOV (exposure of 100 ms per frame). This image-acquisition sequence is repeated for all positions in the lookup table. Once the image acquisition is completed, the microscope sends a signal to the pressure control subsystem to start the pumping sequence and the whole cycle starts again. The pumping-imaging cycle takes approximately 8 min for each imaging set. An average of 15 such cycles was captured for each experiment.
The device surface was not passivated prior to the experiments as we did not notice significant surface adhesion of proteins during the initial experiments. However, on prolonged and repeated exposure to the protein, the nanochannels did experience blockage at which point we would switch to a fresh device. We observed some variations in measured extensions of the same sample over multiple trials, which could be attributed to progressive thinning of the channels due to protein adhesion. As described in the data analysis section, we overcame this issue by imaging a control sample in all channels prior to imaging the sample and following a baseline correction protocol.
Protein preparation
Proteins were expressed and purified as previously described (Gao et al., Reference Gao, Foo, Winardhi, Tang, Yan and Kenney2017). In short, pRD231 (Rok), pRD415 (Rok ∆75–96, ∆Rok), or pRD411 (sRok) were transformed in E. coli BL21 (DE3) pLysS. Six-liter shake flask cultures were grown (37°C. 200 RPM, 0.5 liter. 2* YT in 2-liter Erlenmeyer flasks). Following this, protein expression was induced with IPTG after which the cultures were grown overnight (16°C, 180 RPM). Cells were harvested and stored at −70°C until purification. For purification, cells were lysed with a pressure homogenizer. DNAse1, PMSF, benzamidine, and complete inhibitor pills (Roche) were added. The suspension was cleared by ultracentrifugation (Beckman Coulter, 70 TI rotor, 35k RPM, 4°C, 30 min). The supernatant was filtered (0.2 μm) and applied on pre-equilibrated P11 (for sRok). Elution with a gradient of NH4Cl resulted in pooled fractions that were dialyzed overnight to 130 mM NaCl Tris–HCl pH 8, 10% glycerol. The resulting protein suspension was applied on a pre-equilibrated heparin column (Cytiva, 1 ml), while Rok and ∆Rok were applied directly to a heparin column. A NaCl gradient was applied, protein fractions were pooled and diluted, after which the resulting pool was applied to a pre-equilibrated SP column (Cytiva, 1 ml). Protein was eluted with a NaCl gradient, and the peak fraction was concentrated using 3 kDa MW cut-off centrifugal filters (Pall). The concentrated sample was applied to a Superdex G200 increase column pre-equilibrated with storage buffer (20 mM Tris HCl pH 8, 300 mM KCl, and 10% glycerol). The concentration was determined by Qubit. The verified peak fraction was aliquoted and stored at −70°C. Every purification step was analyzed using SDS-PAGE, and the integrity and folding of the final product were verified using intact protein LC–MS and CD.
Sample preparation for nanofluidics experiments
The protein samples were diluted in a buffer consisting of 10 mM Tris–HCl pH 7.8 and 10 mM KCl. Different concentrations of the protein (165, 330, and 660 nM) were mixed with 4 μM ‘sticky’ end (12 nt complementary overhangs) λ-phage DNA (λ-DNA, 48 502 bp, Thermo Fisher) or 3.3 μM blunt-ended T7 DNA (39 936 bp, York Bio), corresponding to DNA bp-to-protein ratios of 24, 12, and 6 bp per Rok protein, respectively. The samples were incubated at 37°C for 30 min. After incubation, YOYO-1 was added at a 1:5 dye:bp ratio, and the mixture was incubated for an additional 10 min. Then, the sample was diluted five times with Buffer S (10 mM Tris–HCl pH 7.8, 10 mM KCl, 0.06% (w/w) SDS, and 5 mM DTT) to obtain optimal DNA-stretching conditions and immediately loaded onto the device, where DNA molecules were stretched within the nanochannels and subsequently imaged.
Data analysis
The images were processed using a custom-made MATLAB script to extract information about DNA molecules from each sample and to generate kymographs for each DNA molecule. The mean extension, mean standard deviation of the extension, and the mean total intensity of the individual DNA molecules were calculated from the kymographs. Further data analysis and clustering were performed using a custom R script designed for this study. Z-scores of mean DNA molecule extensions were plotted against z-scores of the mean intensities of the DNA molecules and against z-scores of the standard deviations of the DNA molecule extensions, resulting in scatter plots, where each dot represents a DNA molecule (Figure 1D and Figure S1 in Supplementary Information). The dataset was subjected to clustering analysis using the k-means algorithm with the number of clusters (k-value) empirically set to 15. In the ‘Extension vs Intensity’ scatter plot (Figure 1D), three distinct clusters were then defined by merging previously identified clusters according to the criteria mentioned below: monomeric DNA, circular DNA, and concatemeric DNA. The monomeric cluster was composed of data points centered around the (0, 0) coordinate (Figure S1 in Supplementary Information). The circular DNA cluster was refined to include only DNA molecules with z-scores of extensions smaller than the minimum z-score of extension in the monomer cluster, z-scores of intensity above zero, and z-scores of standard deviations below zero (Figure 1D and Figure S1A in Supplementary Information). DNA concatemers were defined as DNA molecules with extensions exceeding the maximum extension in the monomer cluster. DNA molecules not belonging to any of the identified clusters were classified as unclustered fragmented DNA. Subsequent analysis was performed on DNA molecules that fit into the identified clusters.
In every experiment, prior to imaging samples on the multiplexed device, several sets of images of λ-DNA were captured from all the nanochannel blocks on the device. This data was used as a control to eliminate the bias in the measured DNA molecule extensions introduced by conditions within each block of nanochannels. The relative extension of the DNA molecules was calculated by dividing the mean DNA molecule extensions for each sample molecule by the mean value of the extensions for λ-DNA imaged in the same nanochannel block prior to imaging the sample. The binary logarithm of the relative extension was used to facilitate graphical data representation.
For data visualization, OriginPro 2023 was used. The extensions of the monomeric clusters are presented in the box plot to investigate the compaction of DNA. Statistical testing (one-way analysis of variance (ANOVA)) was performed prior to result interpretation. The information on all DNA molecule extensions is used to assess the concatemer formation of DNA in the form of a ridgeline plot.
Intensity profiles of the DNA molecules were used to characterize the effect of the proteins on the DNA. Individual time frames in a movie are stacked on top of each other to obtain kymographs. The average intensity profile of the DNA molecule is then extracted by averaging the kymograph. The profiles were analyzed using Fiji ImageJ to determine the qualitative characteristics of Rok, ∆Rok, and sRok binding to DNA.
To study the AT-selective binding of the Rok variants, a custom MATLAB script was used. Kymographs of the linear monomeric DNA molecules from each experiment were first clustered based on the size of the DNA molecule. The intensity profiles in each size cluster were then compared and aligned to generate similarity clusters. The similarity of the intensity profiles was calculated by means of the Pearson correlation coefficient (PCC), where a PCC score of 1 indicates 100% similarity. Only intensity profiles with a PCC score of 0.8 were retained in the similarity cluster. The results are visually represented by linear stacked plots where each line in the plot represents the intensity pattern of an individual DNA molecule, and the topmost line represents the consensus pattern.
Glass slide deposition experiment
Glass coverslip functionalization was adapted from published protocols (Goyal et al., Reference Goyal, Ekedahl, Nyblom, Krog, Fröbrant, Brander, Sewunet, Tangkoskul, Giske, Sandegren, Thamlikitkul, Ambjörnsson and Westerlund2022; Möller et al., Reference Möller, Sharma, Öz, Reginato, Cannavo, Ceppi, Sriram, Cejka and Westerlund2024). In short, coverslips (Corning 18 × 18 mm, thickness 1) were silanized by incubating them in a mixture of allyltrimethoxysilane (ATMS, 95%, Sigma-Aldrich), (3-aminopropyl)triethoxysilane (APTES, ≥98%, Sigma-Aldrich), and acetone (Sigma-Aldrich) in a 1:1:100 ratio for at least 40 min at room temperature. Prior to loading a sample, the coverslip was rinsed in MilliQ (MQ) water and dried with nitrogen, and the microscope slide was rinsed with 70% acetone and dried with nitrogen. A 3.5 μl drop of sample was loaded onto one side of a ‘sandwich’ comprised of a functionalized coverslip and microscope slide and immediately imaged.
For the reactions, 4 μM λ-DNA (48 502 bp with 12 nt complementary overhangs) was incubated with increasing concentrations of the protein (660 nm, 990 nm, and 1.32 μM) in a buffer consisting of 10 mM Tris–HCl pH 7.8 and 10 mM KCl at 30°C for 30 min. Following this incubation, YOYO-1 was added at a 1:5 dye to base pair ratio and incubated at 30°C for 5–10 min. The samples were then diluted 20-fold in 0.5x TBE (44,5 mM Tris, 44,5 mM boric acid, 1 mM EDTA) to achieve optimal stretching conditions and deposited onto a glass slide ‘sandwich.’
Results
Multiplex nanofluidic device is a suitable tool to study DNA–protein interactions
The combination of the multiplexed nanofluidic device and the automated imaging platform enabled us to capture single molecule data on the interactions of Rok with DNA. Figure 1 shows a schematic of the multiplex device and an overview of the captured data and subsequent data analysis. As shown in the figure, 10 different samples can simultaneously be loaded onto the device. All 10 samples are simultaneously, yet independently of each other, pushed into the nanochannels by applying nitrogen pressure. Thousands of DNA-protein complexes are stretched in the nanochannels. An average DNA contour length of 8 μm was achieved for control DNA, which corresponds to a stretch of 6 bp per nm. DNA and DNA-protein complexes were then imaged under different conditions, 70% of the molecules fit the criteria for further analysis, as specified in the Methods section. To reiterate, the protein-bound λ-DNA (48 502 bp long) can appear in three forms: monomers, circles, or concatemers (Figure 1C). The circles have approximately half the extension of linear λ-DNA molecules (Alizadehheidari et al., Reference Alizadehheidari, Werner, Noble, Reiter-Schad, Nyberg, Fritzsche, Mehlig, Tegenfeldt, Ambjornsson and Persson2015), while the concatemers have a length of two or more monomers. Circles form when the 12 bases of the complementary overhangs of λ-DNA hybridize in an intramolecular fashion while concatemers form via intermolecular hybridization. Figure 1D shows an example of the data captured from a single experiment with Rok and λ-DNA from a single block of nanochannels with the different groups representing the monomer, concatemer, and circle fractions. Molecules classified into one of the defined groups were selected for further analysis and comparative evaluation across samples.
During the experiments, we noted variations in DNA extensions also between the control samples containing only DNA. These variations may stem from slight differences in channel widths due to fabrication procedure inconsistencies, or from residual nonspecific adsorption of Rok to the channel walls, potentially altering the channel dimensions. Such effects could lead to unintended changes in DNA extension, complicating direct comparisons across different experimental conditions. To handle the variations in extensions between the replicates of the same sample, we developed a baseline correction procedure. It is based on stretching and imaging bare λ-DNA in all nanochannel blocks prior to each experiment and using the extension of the bare λ-DNA as a baseline for the corresponding block. This approach allows for the calculation of the relative changes of extensions of protein-bound DNA while minimizing the influence of any potential variations in nanochannel dimensions. By calculating and plotting the binary logarithm of the relative change, we visualize the effects more clearly. On this scale, 0 represents λ-DNA molecules of a size equal to one monomer of λ-DNA without protein bound, 1 represents DNA molecules of a size equal to two monomers of λ-DNA, and −1 represents DNA molecules of a size equal to half a monomer of λ-DNA, and so forth. This scale is applied in Figures 2 and 3 to compare the effects of varying concentrations of the same protein on DNA, as well as the impact of different protein variants on DNA.
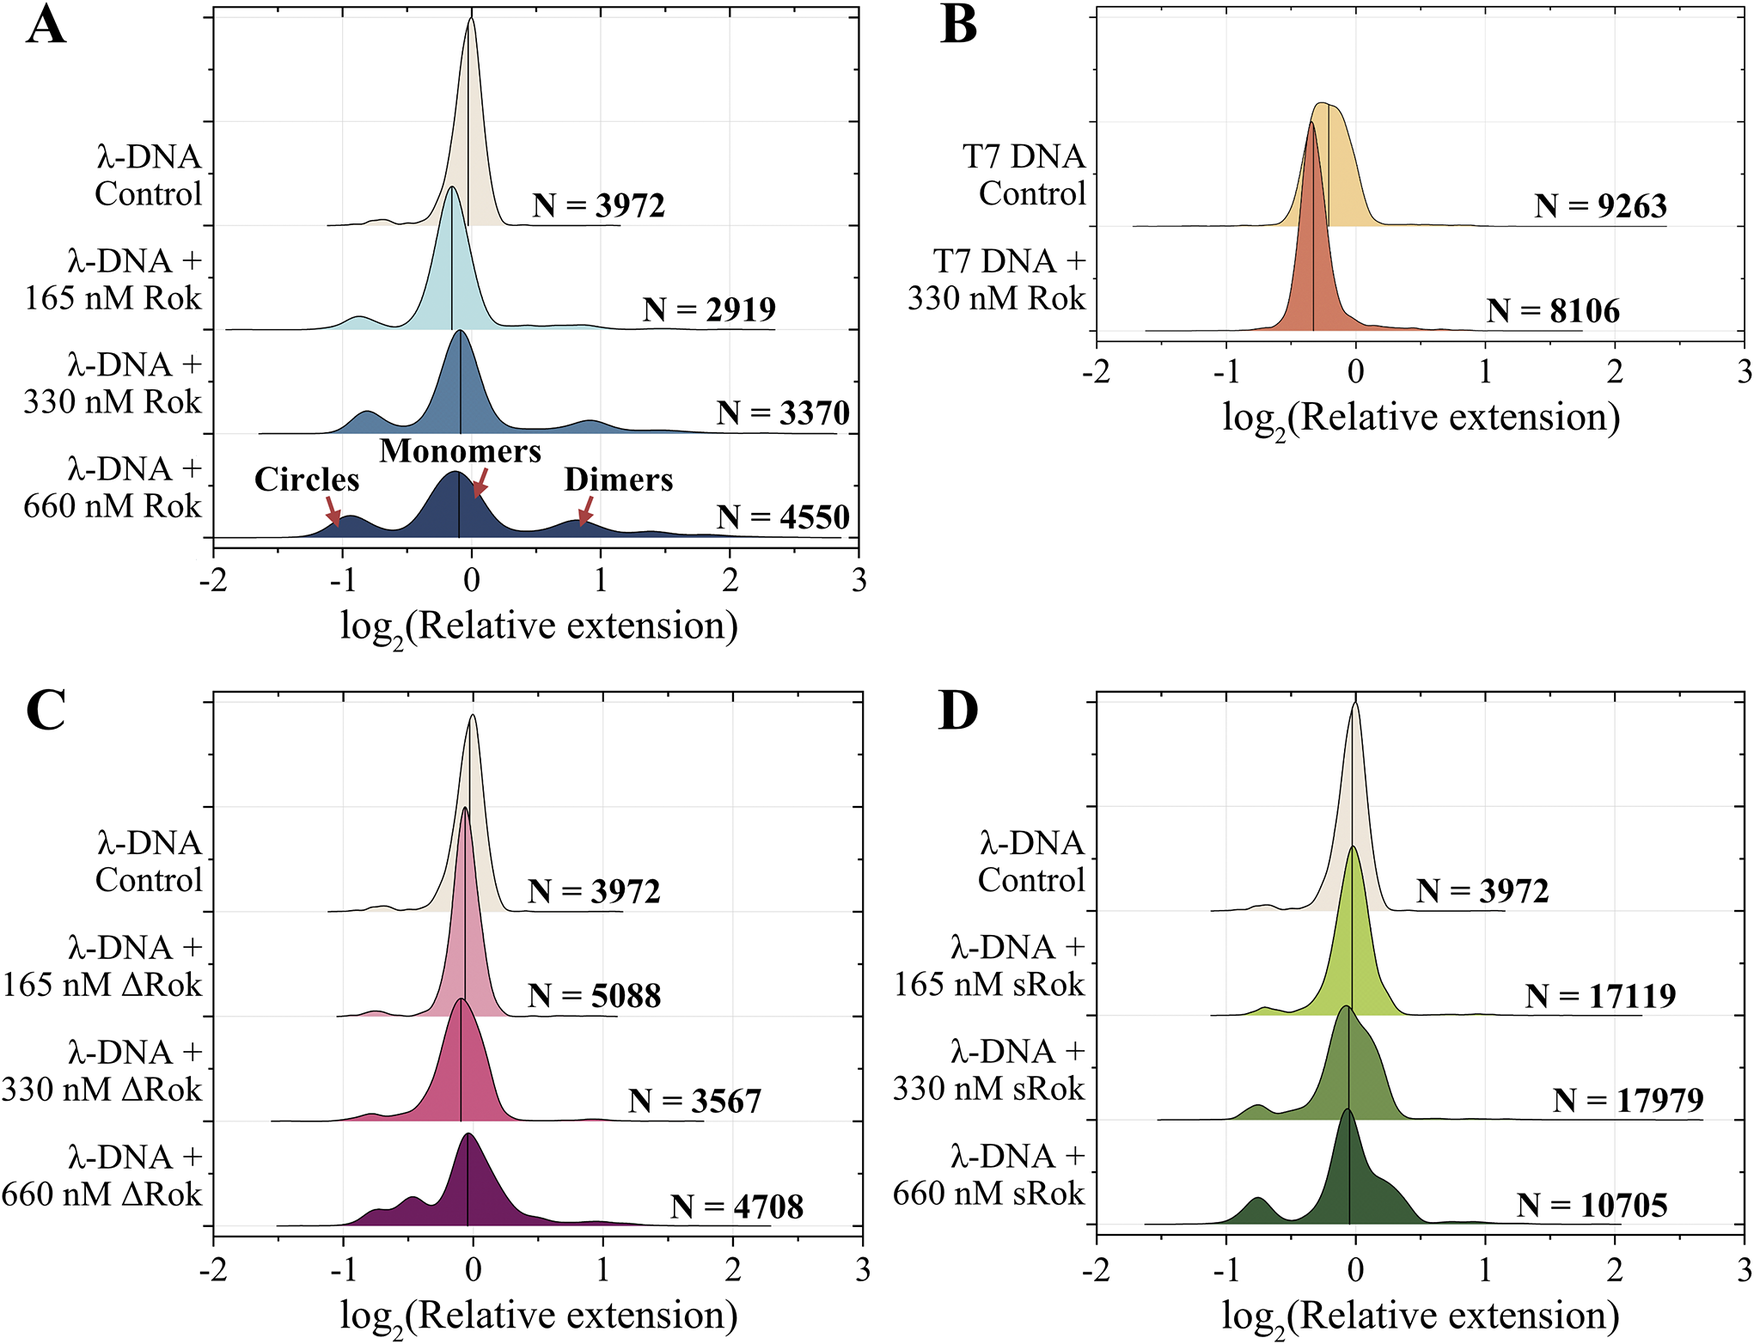
Figure 2. End-bridging activity of the Rok variants illustrated by the relative DNA extensions in response to: (A) Rok titration with λ-DNA; (B) Rok with T7-DNA; (C) ∆Rok titration with λ-DNA; (D) sRok titration with λ-DNA. DNA concentration (in base pairs) is kept constant throughout experiments (4 μM for λ-DNA and 3.3 μM for T7-DNA). The number of molecules (N) used for analysis is indicated near each corresponding plot. The binary logarithm of the relative extension of DNA molecules is used to compare samples, enabling easier visualization of different effects. For example, a value of 0 corresponds to a DNA molecule equal in length to one λ-DNA molecule without protein, a value of 1 represents a DNA molecule twice as long as λ-DNA, and a value of −1 corresponds to a molecule half the length of λ-DNA. The median of the binary logarithm of the relative extension of DNA molecules for each condition is represented by a vertical line.
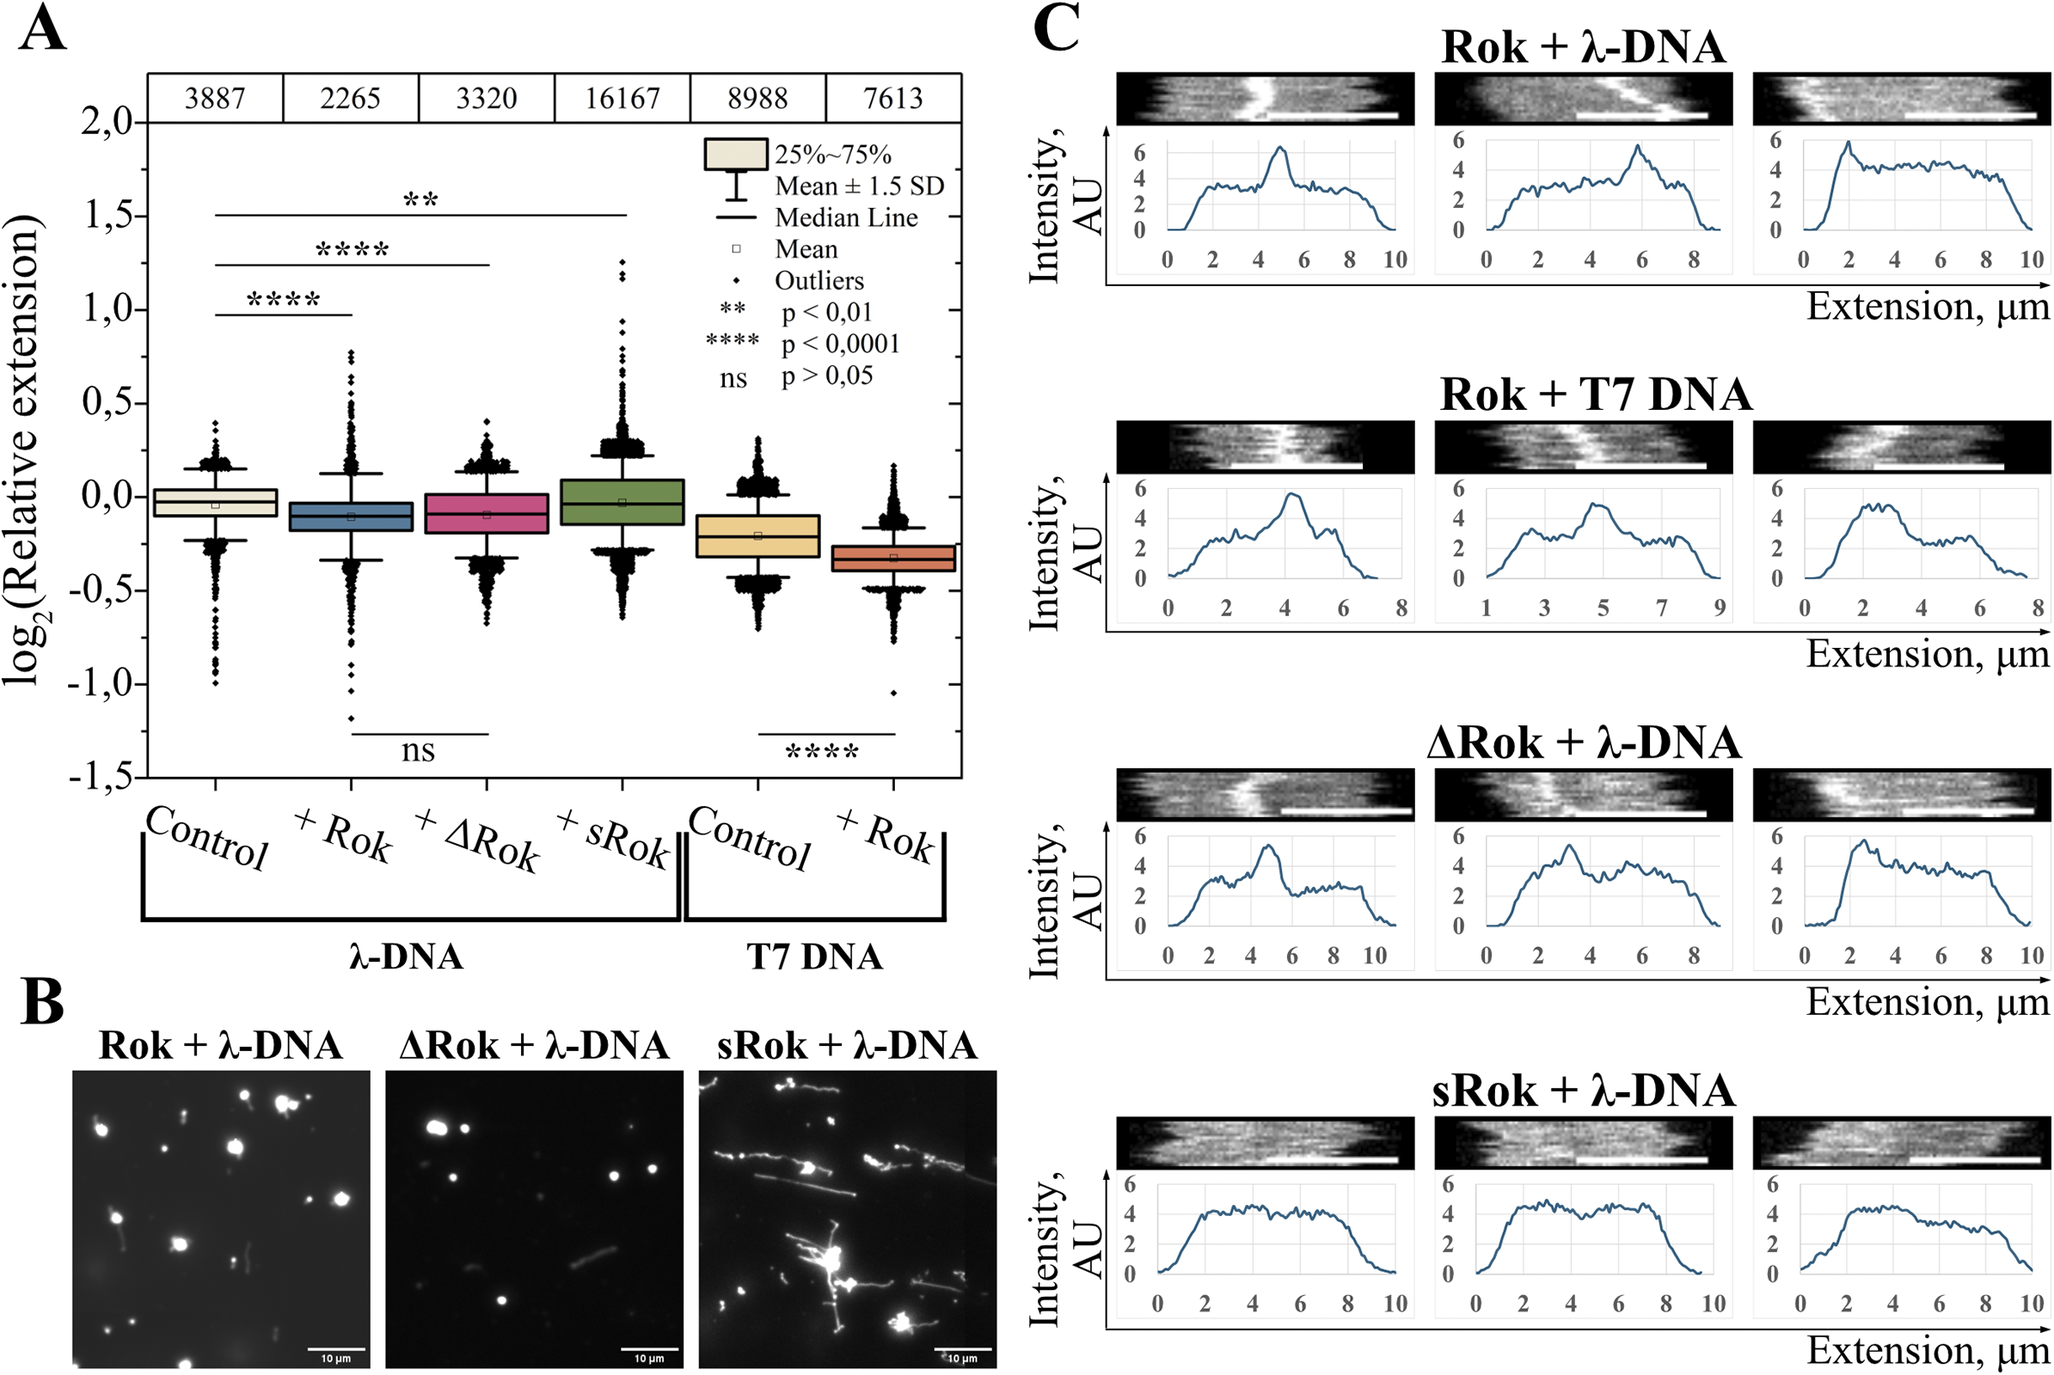
Figure 3. DNA condensation by the Rok variants. (A) Binary logarithms of the relative DNA extensions of monomeric clusters for 4 μM λ-DNA alone, as well as 4 μM λ-DNA incubated with 330 nM Rok, ∆Rok, and sRok; as well as for 3.3 μM T7-DNA alone or incubated with 330 nM Rok. The top panel shows the number of molecules analyzed for each case. (B) Glass slide deposition images of 4 μM λ-DNA incubated with 1.32 μM Rok, ∆Rok, and sRok. The scale bar in the images represents a length of 10 μm. (C) Examples of monomeric DNA molecules with a narrow band of high intensity, alongside their intensity profiles, for 4 μM λ-DNA and 3.3 μM T7-DNA incubated with 330 nM Rok, as well as for 4 μM λ-DNA incubated with 330 nM ∆Rok and 4 μM λ-DNA incubated with 330 nM sRok. The scale bar in the kymographs represents a length of 5 μm.
Rok stabilizes the hybridization of complementary 12 base ssDNA overhangs
We applied the nanofluidic setup to study the DNA structuring properties of Rok on λ-DNA (which has 12 base overhangs) and blunt-ended T7-DNA at different DNA:protein ratios. The DNA was incubated with the protein, stained with YOYO-1, stretched in the multiplexed nanofluidic device, and imaged using fluorescence microscopy. We observed several distinct effects of Rok on DNA.
The addition of Rok to λ-DNA leads to an increase in the number of overhang hybridization events, that is, the formation of circular DNA and concatemers (Figure 2A). The peak at relative extension close to 0 corresponds to an average monomeric DNA molecule, while the peak to the left of the monomeric DNA peak represents circular DNA. Peaks to the right of the monomeric DNA peak indicate concatemers, such as dimers and trimers. The addition of Rok to blunt-ended T7 DNA does not lead to end hybridization (Figure 2B). This indicates that Rok promotes the annealing of complementary ssDNA at the λ-DNA ends.
Analogous nanofluidic experiments were performed to investigate the interaction of DNA with a Rok mutant (∆Rok) missing the linker region separating the dimerization and DNA binding domains. The linker in Rok is neutrally charged, compared to mostly positively charged linkers in other H-NS-like proteins. Usually, the deletion of the linker in H-NS-like proteins results in them forming filaments on the DNA, and in a reduction of DNA bridging activity (Shahul Hameed et al., Reference Shahul Hameed, Liao, Radhakrishnan, Huser, Aljedani, Zhao, Momin, Melo, Guo and Brooks2019; Qin et al., Reference Qin, Bdira, Sterckx, Volkov, Vreede, Giachin, van Schaik, Ubbink and Dame2020). However, removing the linker in ∆Rok has been previously shown to have no effect on DNA filament formation and bridging. Instead, it was found to affect the cooperativity of DNA binding (Erkelens et al., Reference Erkelens, Qin, van Erp, Miguel-Arribas, Abia, Keek, Markus, Cajili, Schwab and Meijer2022). We observed that the deletion of the linker leads to a decrease in circularization and concatemer formation of λ-DNA compared to the wild-type Rok (Figure 2C). This indicates that the linker plays a significant role in the ability of Rok to stabilize the annealing of DNA overhangs. We also investigated the sticky end-annealing activity of sRok, a naturally occurring variant of Rok without a linker. A similar result to ∆Rok was observed where fewer circles and concatemers were formed compared to native Rok (Figure 2D). These results highlight the importance of the linker for the protein activity in promoting complementary ssDNA hybridization.
Rok and ∆Rok condense DNA, while sRok does not affect DNA conformation
The binding of Rok to DNA also induces DNA compaction as observed by a decrease in the median extension for both λ-DNA and T7-DNA with increasing Rok concentration in the nanofluidic experiments (Figure 3A). Deletion of the neutrally charged linker in ∆Rok does not significantly affect the extent of DNA compaction (Figure 3A). This is in agreement with previously reported results, where deletion of the neutrally charged linker affected the cooperativity of binding, but not the bridging of segments along the DNA duplex, which is the main property that governs DNA compaction (Erkelens et al., Reference Erkelens, Qin, van Erp, Miguel-Arribas, Abia, Keek, Markus, Cajili, Schwab and Meijer2022). To confirm that Rok and ∆Rok can fully compact DNA, we conducted glass slide deposition experiments at increasing Rok and ∆Rok concentrations. Glass slide experiments were used since high protein concentrations are challenging to work with in the nanofluidic setup, and fully condensed molecules are difficult to visualize in nanochannels. Incubation with high concentrations of Rok and ∆Rok resulted in complete DNA compaction, confirming the condensing effect of these proteins (Figure 3B and Figure S2 in Supplementary Information).
sRok, on the other hand, does not exhibit the same effect in the nanofluidic setup: sRok binding to DNA induces slight stiffening, that is, an increase in the median extension (Figure 3A). Although significant, the increase in the median extension of λ-DNA is small (Figure S3 in Supplementary Information) and can be attributed to either sRok activity or extension variation due to method limitations. Incubation of DNA with high sRok concentrations, followed by glass slide deposition, resulted in moderate compaction, to a much lesser extent than that observed for Rok and ∆Rok (Figure 3B and Figure S2 in Supplementary Information).
In addition to characterizing and comparing molecule extensions, we also investigated the kymographs of individual molecules (Figure 3C and Figures S4 and S5 in Supplementary Information). As explained in the Methods section, a kymograph is created by stacking individual time frames on top of each other and offers a visual representation of variations in the fluorescence intensity along the DNA molecule. The average intensity profile along a DNA molecule can be extracted from the kymograph. For a small fraction of DNA-protein complexes (approximately 5%), we observed a narrow band of significantly increased emission intensity, which was never observed for naked DNA. This type of profile was observed for both λ-DNA and T7-DNA molecules and for molecules that fall into the circle, monomer, and concatemer length clusters (Figure 3B and Figure S4 in Supplementary Information). The fluorescence signal observed is due to emission from DNA-bound YOYO-1 and hence reports the local DNA concentration. The narrow band of high intensity is thus indicative of a high local DNA concentration in this region. This means that Rok locally compacts DNA by bridging two or more segments of the DNA duplex. Similar local compaction of DNA as observed for full-length Rok was also observed for ∆Rok but not for sRok (Figure 3B).
We also observed a few instances of kymographs displaying molecules with a broader region of higher intensity in the presence of Rok and ∆Rok (Figure S5 in Supplementary Information). This broader band likely reflects the overlap of DNA molecules and illustrates Rok bridging two independent DNA duplexes. Similar bridging was again not observed for sRok (data not shown).
Rok preferentially binds to AT-rich regions of DNA and competes in binding with YOYO-1
A close inspection of the intensity profiles obtained from the nanofluidic experiments revealed that some patterns appeared with high frequency. Kymographs for the Rok bound DNA, where one half of the λ-DNA has a significantly higher intensity than the other, are shown in Figure 4A. This pattern is similar to when YOYO-1 and netropsin are added together to DNA. Netropsin has a high affinity for AT-rich regions and forces YOYO-1 to bind to regions that are not bound by netropsin. This results in an intensity pattern along DNA where AT-rich regions appear dark and GC-rich regions appear bright (Nyberg et al., Reference Nyberg, Persson, Berg, Bergström, Fransson, Olsson, Persson, Stålnacke, Wigenius and Tegenfeldt2012; Müller et al., Reference Müller, Nyblom, Johnning, Wrande, Dvirnas and Kk2020; Nyblom et al., Reference Nyblom, Johnning, Frykholm, Wrande, Müller, Goyal, Robertsson, Dvirnas, Sewunet and Kk2023). For λ-DNA, half the molecule is AT-rich, and half the molecule is GC-rich, which leads to a signature half-dark, half-bright pattern as shown in Figure 4Ai. The same observation can be made for all three Rok variants, indicating a similar AT-binding selectivity.
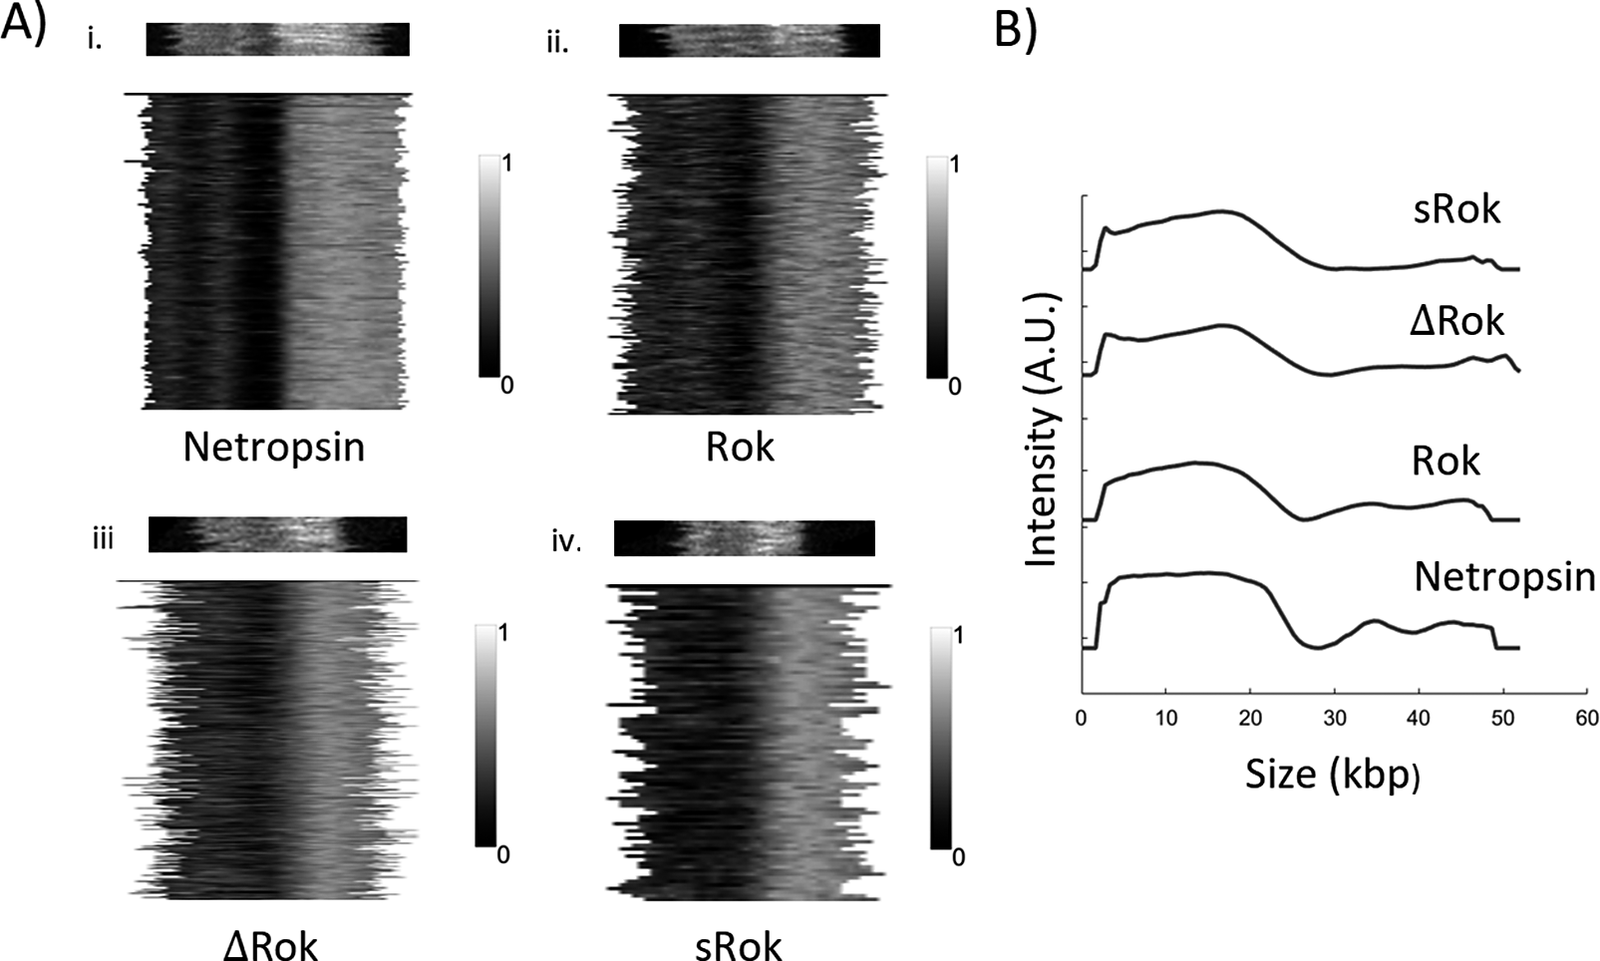
Figure 4. Comparison of Rok variants bound to DNA and netropsin-bound DNA (A) Kymographs and intensity pattern similarity cluster plots of i) netropsin-bound λ-DNA, ii) Rok-bound λ-DNA iii) ∆Rok-bound λ-DNA, and iv) sRok-bound λ-DNA. (B) Comparison of consensus intensity profiles of Rok variants-bound λ-DNA and the netropsin-bound λ-DNA.
To identify significant trends in the intensity variation along the molecules, the intensity patterns of all molecules in the linear monomeric cluster of 660 nM Rok variant bound to 4 μM λ-DNA were compared to each other using a custom script. As explained in the Methods section, kymographs with similar size and intensity patterns were clustered together, and the similarity cluster with the greatest number of molecules for each Rok variant was used. Figure 4A shows the kymographs corresponding to either netropsin or one of the Rok variants bound to λ-DNA and the corresponding similarity cluster plots. Each line in the similarity cluster plot represents the intensity pattern of a DNA molecule and the patterns are aligned to each other with respect to regions with the maximum similarity. As shown in Figure 4A, the major cluster for all Rok variants showed a dark-bright pattern that is highly similar to that of the netropsin-bound λ-DNA. The p-values of the correlation analysis are listed in Table S1 in Supplementary Information. A consensus intensity pattern can be extracted from each similarity cluster plot by averaging the intensity pattern of all the molecules in the cluster. Figure 4B shows the comparison of the consensus intensity patterns for the Rok variants to that of netropsin. In Figure 4B and Figure S6 in Supplementary Information, the consensus intensity patterns are stretched to the same length in order to compare the patterns. The Rok-bound molecules exhibit a very similar binding pattern to that of the netropsin-bound molecules demonstrating an AT-specific binding of all three Rok variants to long DNA. The patterns are significantly similar to each other as shown in Table S1 in Supplementary Information.
Discussion
In this work, we have established an automated multiplex nanofluidic setup for high-throughput studies of DNA–protein interactions. Previously, we have extensively used a nanofluidic device consisting of a single block of nanochannels which was controlled manually to study such interactions (Öz et al., Reference Öz, Sriram and Westerlund2019, Reference Öz, Howard, Sharma, Törnkvist, Ceppi, Kk, Kristiansson, Cejka and Westerlund2020; Möller et al., Reference Möller, Sharma, Öz, Reginato, Cannavo, Ceppi, Sriram, Cejka and Westerlund2024). Using that approach, we could only study a few samples per day due to the additional time introduced by the chip handling and washing steps between samples. In contrast, in the multiplex nanofluidic chip, 10 samples can be analyzed simultaneously. Automation makes the process so fast that it takes just 8 min to capture one set of data from all 10 samples using the current device setup as described in the methods section. We typically captured 15 such sets of data for each set of 10 samples and the entire procedure took approximately 2 h.
We applied the automated multiplexed nanofluidic system to investigate the interaction of Rok with DNA in a high-throughput fashion. We observed several distinct effects of Rok on DNA through both statistical comparisons across conditions and the analysis of individual molecular profiles. First, we demonstrated that Rok promotes the hybridization of 12-nt single-stranded overhangs at the ends of λ-DNA. Previous studies have shown that Rok differentially influences chromosomal transformation in Bacillus subtilis cells lacking recombination-related proteins (Serrano et al., Reference Serrano, Torres and Alonso2021). The observed ability to enhance interactions between complementary single-stranded DNA suggests that Rok may play a role in homology search during recombination. However, it is likely that Rok operates as part of a larger system in coordination with other homologous recombination proteins.
Rok variants, both artificial and naturally occurring, missing a neutrally charged linker displayed reduced end bridging activity in similar nanofluidic experiments. This may be due to the larger effective lateral span of the wild-type Rok along the DNA compared to the variants. For Rok, this configuration might enable one DNA-binding domain to interact with the dsDNA at the junction, while the other remains free to facilitate interactions between complementary ends. In contrast, the variants appear to be sterically hindered, preventing similar interactions.
We further utilized our setup to investigate Rok-induced DNA condensation. The results confirmed a compacting activity for both Rok and ∆Rok, consistent with previous studies (Erkelens et al., Reference Erkelens, Qin, van Erp, Miguel-Arribas, Abia, Keek, Markus, Cajili, Schwab and Meijer2022). Additionally, we identified at the single molecule level, potential Rok-DNA structures contributing to the observed condensation. These structures correspond to local DNA compaction along the contour, mediated by Rok bridging two segments of the DNA duplex. We also observe examples of inter-duplex bridging. This supports the conclusion that DNA compaction by Rok is attributable to its DNA-bridging activity.
Interestingly, no DNA compaction was observed in the presence of sRok. Instead, sRok appeared to induce DNA stiffening. Previous studies have suggested that sRok exhibits nucleoprotein filament formation (Erkelens et al., Reference Erkelens, Qin, van Erp, Miguel-Arribas, Abia, Keek, Markus, Cajili, Schwab and Meijer2022). Under our nanofluidic experimental conditions, it is possible that sRok forms filaments along the DNA molecules, leading to a slight increase in DNA extension. However, the observed difference in the mean DNA extension with sRok is considerably smaller than with Rok and ∆Rok.
Our setup also allowed us to confirm the previously reported binding preference of Rok for AT-rich regions of DNA (Seid et al., Reference Seid, Smith and Grossman2017; Duan et al., Reference Duan, Ding, Hughes, Navarre, Liu and Xia2018). We demonstrated that both wild-type Rok and its variants exhibit a λ-DNA-binding pattern similar to that of netropsin (Nyberg et al., Reference Nyberg, Persson, Berg, Bergström, Fransson, Olsson, Persson, Stålnacke, Wigenius and Tegenfeldt2012; Müller et al., Reference Müller, Nyblom, Johnning, Wrande, Dvirnas and Kk2020; Nyblom et al., Reference Nyblom, Johnning, Frykholm, Wrande, Müller, Goyal, Robertsson, Dvirnas, Sewunet and Kk2023), which has a high selectivity for AT-rich regions of DNA and prevents the binding of YOYO-1 to these regions. This observation confirms the strong preference of Rok for AT-rich DNA, a property that is independent of the presence of the internal linker.
To conclude, we have developed a multiplexed automated single-molecule nanofluidics setup to gain new insights into the interactions between Rok protein and DNA. The method was optimized specifically for DNA-protein studies. Our findings confirmed the role of Rok in DNA condensation and its AT-dependent binding pattern. We also uncovered the ability of Rok to promote the hybridization of single-stranded complementary DNA overhangs. Comparative analysis of Rok and its linker-deletion variants highlighted the linker’s importance in promoting ssDNA interactions. Together, these results deepen our understanding of the DNA-binding mechanisms of Rok and showcase the utility of the high-throughput platform for further studies on DNA–protein interactions in DNA organization and recombination processes.
Open peer review
To view the open peer review materials for this article, please visit http://doi.org/10.1017/qrd.2025.10007.
Supplementary material
The supplementary material for this article can be found at http://doi.org/10.1017/qrd.2025.10007.
Data availability statement
All data is available from the corresponding author upon reasonable request.
Financial support
We acknowledge the Swedish Research Council (grant no: 2020–03400 to F.W.), the European Research Council (consolidator grant, no. 866238, to F.W.), the Area of Advance Nano at Chalmers University of Technology (to E.P.), and the Dutch Research Council (VICI 016.160.613/533 and OCENW.GROOT.2019.012 to R.T.D.) for funding. The nanofluidic devices used in this study were fabricated at MyFab Chalmers cleanroom facility.


 Open access
Comments
No accompanying comment.