


Study quality is a foundational element of credible research. Following Plonsky (Reference Plonsky2024), study quality is a multidimensional construct that includes methodological rigor, transparency, ethics, and societal relevance. These dimensions are interconnected and ensure research upholds both scientific excellence and ethical standards. Rigor and transparency are closely tied to ethical practices, as they build trust in research outcomes while reducing the risk of ethical pitfalls, such as misconduct or questionable research practices (QRPs). Similarly, transparency plays a central role in enabling the evaluation of methods and findings, making it inseparable from rigor in promoting reproducibility and accountability (Open Science Collaboration, 2015).
When it comes to quantitative methods, structural equation modeling (SEM) has recently become a powerful and versatile modeling framework for exploring complex relationships among variables. SEM integrates factor analysis and path analysis to examine both direct and indirect effects, and mediated and moderated effects, in addition to more advanced techniques, allowing researchers to test theoretical models that include latent constructs and observed variables simultaneously (Kline, Reference Kline2023). Its ability to estimate multiple relationships within a single analysis makes SEM particularly valuable in situations where phenomena are multifaceted and interdependent (Byrne, Reference Byrne2012), such as applied linguistics. However, SEM involves complex statistical procedures, thus increasing the potential for QRPs to inadvertently occur during its application (Flores-Kanter & Mosquera, Reference Flores-Kanter and Mosquera2023; Revelle, Reference Revelle2024). Researchers face numerous decisions, including selecting appropriate indicators, specifying models, and interpreting fit indices, which could lead to issues such as cherry-picking models or selectively reporting results to support desired outcomes. Importantly, these issues often arise unintentionally, driven by a lack of training or by external pressures to publish, but they have serious ethical consequences by undermining the reliability and validity of scientific findings.
In this article, we aim to address analytical transparency in the context of SEM, specifically reflective latent variable path analysis. Although best practices in SEM have been discussed for quite some time (e.g., Hancock & Mueller, Reference Hancock and Mueller2013; Hoyle, Reference Hoyle2023), there has been limited effort to explicitly integrate these practices with the principles of open science. We argue that the reason why many QRPs in SEM persist is precisely because of a lack of transparency. To bridge this gap, we review a range of QRPs commonly encountered in SEM and provide practical, theory-informed recommendations for improving transparency, reproducibility, and research integrity. Our goal is to promote more responsible SEM use by aligning established methodological standards with emerging open science principles.
Definition and taxonomy of QRPs
Research practices are generally divided into three main levels of ethical integrity: responsible conduct of research, QRPs, and deliberate misconduct (Al-Hoorie & Hiver, Reference Al-Hoorie, Hiver and Plonsky2024; Plonsky, Larsson, et al., Reference Plonsky, Larsson, Sterling, Kytö, Yaw, Wood, De Costa, Rabie-Ahmed and Cinaglia2024; Steneck, Reference Steneck2006). Responsible conduct of research represents the gold standard, involving practices that align with ethical principles and professional standards. On the opposite end, deliberate misconduct—fabrication, falsification, and plagiarism—is universally condemned for its damaging impact on research integrity. QRPs occupy a middle ground, including behaviors that could potentially compromise the quality and credibility of research. That is, a certain behavior (e.g., excluding an outlier) may be justifiable under specific circumstances, but it can also be seen as problematic in other situations, especially when not transparently disclosed and justified.
Adopting a Delphi method, Plonsky, Larsson, et al. (Reference Plonsky, Larsson, Sterling, Kytö, Yaw, Wood, De Costa, Rabie-Ahmed and Cinaglia2024) attempted to provide a comprehensive taxonomy of QRPs in quantitative humanities. Their results pointed to a set of 58 practices falling under four categories: funding, design and data collection, data analysis and interpretation, and write-up and dissemination. When it comes to doing the research itself, QRPs related to design and data collection may undermine methodological rigor at the early stages of a study. These include inadequate sampling methods, failure to define inclusion and exclusion criteria, and selective recruitment of participants to achieve desired outcomes. Additionally, poor documentation of data collection procedures and failure to pilot-test instruments may compromise transparency and the reliability of data. Similarly, QRPs at the data analysis and interpretation stage revolve around statistical manipulation and selective reporting. Such practices include p-hacking, failing to adjust for multiple comparisons, and ignoring violations of statistical assumptions. Furthermore, misinterpreting statistical findings and overlooking alternative valid explanations of data can also mislead readers and future research. QRPs in this category are particularly relevant to SEM research because specifying and estimating latent variable models entails substantial researcher degrees of freedom (i.e., flexibility) that, if abused, can undermine the substantive conclusions drawn from such models to the detriment of knowledge in the field. These practices risk skewing the scientific record and contributing to replication crises, ultimately undermining trust in research findings.
Finally, QRPs at the write-up and dissemination stage are related to the communication of research findings. Examples include selectively reporting significant results, omitting null findings, failing to disclose study limitations, and using hyperbolic language to exaggerate the importance of findings. Plonsky, Larsson, et al. (Reference Plonsky, Larsson, Sterling, Kytö, Yaw, Wood, De Costa, Rabie-Ahmed and Cinaglia2024) argued that these practices compromise the transparency and credibility of published work. They also point out that QRP taxonomies can facilitate targeted training and the creation of clear guidelines to address them.
Prevalence of QRPs
The prevalence of QRPs is a growing concern across disciplines, including applied linguistics. Isbell et al. (Reference Isbell, Brown, Chan, Derrick, Ghanem, Gutiérrez Arvizu, Schnur, Zhang and Plonsky2022) conducted an exploratory study examining the prevalence of QRPs and scientific misconduct among applied linguists engaged in quantitative research. Drawing on responses from 351 participants, the study revealed that QRPs are widespread, with 94% of respondents admitting to engaging in at least one QRP, such as selectively reporting significant results, p-hacking, or excluding nonsignificant findings. The study also highlighted a concerning frequency of misconduct, including data fabrication and modification to achieve statistically significant results, though these behaviors were less common (approximately one in six). Interestingly, early-career researchers and those who experienced publication rejection due to non-significant results reported higher engagement in QRPs and misconduct, emphasizing the influence of systemic pressures such as the “publish-or-perish” culture. Isbell et al. (Reference Isbell, Brown, Chan, Derrick, Ghanem, Gutiérrez Arvizu, Schnur, Zhang and Plonsky2022) also underscored the importance of improved statistical training and ethical guidelines to address these issues and promote more rigorous and transparent research practices in applied linguistics.
In the same vein, Larsson et al. (Reference Larsson, Plonsky, Sterling, Kytö, Yaw and Wood2023) investigated the prevalence and perceived severity of QRPs among researchers in the quantitative humanities. Their results revealed that 96% of respondents reported engaging in at least one QRP in the past five years. They also examined the perceived severity of these practices and found a strong negative correlation between frequency and perceived severity. Researchers tended to avoid practices they considered highly severe, such as knowingly removing data to achieve favorable results or misrepresenting qualifications in funding proposals. Differences in engagement with QRPs were also observed based on researcher characteristics. Again, early-career researchers and those with a higher publication rate were more likely to report engaging in certain QRPs, suggesting that systemic pressures, such as the demand for more and more publications, may drive ethical compromises. Additionally, researchers with more quantitative training were paradoxically (weakly) associated with higher frequencies of some QRPs. Larsson et al. (Reference Larsson, Plonsky, Sterling, Kytö, Yaw and Wood2023) argued that this indicates the need for ethics-focused training in research methods courses.
Building on prior work examining QRPs in applied linguistics, Plonsky, Brown, et al. (Reference Plonsky, Brown, Chen, Ghanem, Arvizu, Isbell and Zhang2024) analyzed open-ended survey responses to provide richer insights into the contextual factors driving such practices. They identified nine themes from 1,226 qualitative comments, including researcher training, methodological conventions, the influence of top-down guidelines, circumstantial appropriateness, and pressures to publish. Participants frequently rationalized QRPs as context-dependent, citing space limitations, field-specific norms, and the need to simplify complex research processes for publication. For example, some respondents defended withholding methodological details to meet journal requirements or enhance accessibility for their target audience. The results also revealed significant variability in researchers’ ethical stances and behaviors, with some justifying selective reporting of significant results or methodological omissions as necessary for publication success. Plonsky, Brown, et al. (Reference Plonsky, Brown, Chen, Ghanem, Arvizu, Isbell and Zhang2024) therefore emphasized the role of training in perpetuating QRPs, particularly among researchers relying on coauthors or statisticians for methodological decisions. The authors argued that the variability in researcher practices highlights the need for field-specific standards and ongoing professional development to address these shortcomings.
Factors contributing to QRPs
From the above review, one running theme that has contributed to the persistence of QRPs is systemic pressures within academia and a lack of training. The relentless “publish or perish” culture plays a significant role in driving QRPs, as researchers often feel compelled to deliver impactful results that align with the expectations of high-impact journals, which tend to favor statistically significant findings over null or inconclusive outcomes. This dynamic creates incentives for behaviors like data manipulation, selective reporting, and hypothesizing after results (or HARKing) are known to achieve favorable outcomes (e.g., Plonsky, Brown, et al., Reference Plonsky, Brown, Chen, Ghanem, Arvizu, Isbell and Zhang2024). Early-career researchers are especially vulnerable to these pressures, as their career progression, including securing tenure and funding, is closely tied to their publication records. These challenges are further compounded by a lack of comprehensive training in research ethics and methodology, leaving many ill-prepared to navigate the ethical dilemmas such pressures create (De Costa et al., Reference De Costa, Sterling, Lee, Li and Rawal2021; Isbell et al., Reference Isbell, Brown, Chan, Derrick, Ghanem, Gutiérrez Arvizu, Schnur, Zhang and Plonsky2022; Larsson et al., Reference Larsson, Plonsky, Sterling, Kytö, Yaw and Wood2023).
Second, cognitive biases play a role in researchers’ engagement in QRPs. Even for well-meaning researchers, confirmation bias can lead them to selectively seek out and interpret results that support their favored hypotheses. This may be a spontaneous and unconscious decision, considering that QRPs exist in an ambiguous grey area and may be justifiable under specific circumstances (Andrieux et al., Reference Andrieux, Leonard, Simmering, Simmering and Fuller2024). Similarly, motivated reasoning encourages the individual to rationalize problematic behaviors and provide plausible justifications that appear to be in line with their moral standards (Specker Sullivan, Reference Specker Sullivan2022). Furthermore, the psychological distance between researchers and the potential consequences of their methodological decisions, combined with various self-serving biases, can create “ethical blindness”—a temporary inability to see the ethical dimensions of one’s decisions (Palazzo et al., Reference Palazzo, Krings and Hoffrage2012). As Specker Sullivan (Reference Specker Sullivan2022) pointed out, ethics training may be more effective if it highlights the impact of such cognitive biases on researcher behavior.
QRPs appear to be widespread across empirical research. Evidence for this can be seen even in relatively simple statistical procedures. For example, recent work on Cronbach’s alpha has documented systematic excesses around the conventional α = .70 threshold (Hussey et al., Reference Hussey, Alsalti, Bosco, Elson and Arslan2025), suggesting overfitting to in-sample data (i.e., α-hacking) or publication bias. If such patterns are observed for a basic and widely used statistic, it is reasonable to expect that more complex analytical procedures may be even more vulnerable to QRPs. In this sense, methodological complexity itself can contribute to the proliferation of questionable practices. Some methods, like SEM, require numerous analytical decisions and offer multiple paths to test hypotheses, creating opportunities for researchers’ degrees of freedom that can be exploited consciously or unconsciously. When faced with complex statistical procedures, researchers must make countless decisions about model specification, variable selection, and treatment of outliers, among others—with each decision point representing a potential avenue for bias to influence the research process. This complexity is further compounded by the fact that many researchers may not have received comprehensive training in these advanced methods, leading them to rely on potentially outdated rules of thumb and published examples that may themselves perpetuate questionable practices. Additionally, the inherent flexibility in these complex methods can make it difficult for peer reviewers to identify potential issues, as the sheer number of analytical decisions can obscure problematic choices behind layers of technical detail. The fact that a model converged (i.e., a computational solution in which parameter values are stable and consistent with the data and model specifications) says little about how robust or informative that model is. Even problematic or nonsensical models (i.e., those that defy logic or theory and those with serious misspecifications) can converge perfectly. This creates a particularly challenging scenario where even well-intentioned researchers might engage in QRPs without fully recognizing the implications of their methodological decisions.
SEM
SEM is a statistical framework that allows researchers to examine the relationships among variables, including multiple independent variables and multiple dependent variables. It can include latent and observed variables and can accommodate continuous, categorical, and count variables. Thus, it can be considered as a broader approach to analyzing the relationships among variables than general(ized) linear modeling (Jak & Jorgensen, Reference Jak and Jorgensen2025). In this paper, we use the term SEM primarily to refer to reflective latent variable path analysis, which is one of the most commonly used SEM approaches in applied linguistics research (Larsson et al., Reference Larsson, Plonsky and Hancock2021, Reference Larsson, Plonsky and Hancock2022). We recognize that SEM encompasses a broader family of techniques, including mixture models, growth curve models, multilevel SEM, and others. While our discussion and examples are grounded in latent variable path analysis, the underlying principles we raise—particularly those concerning assumptions, transparency, and full reporting—are also applicable to these other SEM procedures.
In SEM, models are often visually presented as path diagrams to better communicate the relationships among variables. Latent variables are represented by ovals, observed variables are represented by rectangles. Latent variables are unobservable theoretical constructs that are inferred from observed indicators, often based on prior empirical or theoretical work. Observed variables are those directly observed, such as test scores and questionnaire responses. For example, Figure 2 Panel A shows that disappointment, ideal L2 self, and demotivation are latent variables. Responses to questionnaire items (i.e., D1 and D2; I1 through I3; and De1 through De5) are observed variables. Disappointment is hypothesized to influence ideal L2 self and demotivation, whereas Ideal L2 self is hypothesized to influence demotivation, as represented by one-sided arrows. See Bollen (Reference Bollen1989) and Kline (Reference Kline2023) for further details on SEM, including those that have not been covered above, and Jak and Jorgensen (Reference Jak and Jorgensen2025) for a tutorial.
QRPs in SEM
In the context of SEM, we use QRPs to refer to methodological or analytical decisions that deviate from best practices and ethical standards and that can bias the results toward the researcher’s preferred hypotheses at the expense of the reliability, validity, and replicability of the results. In this section, we discuss QRPs that we believe are particularly related to the use of SEM in research on language learning and use. These QRPs are (1) not checking assumptions, (2) not validating a measurement model, (3) not testing competing models, (4) insufficiently justified modeling, (5) modifying the model post hoc, (6) overemphasizing global model fit indices, and (7) incomplete and nontransparent reporting. We have derived this list from SEM reporting guidelines (e.g., Appelbaum et al., Reference Appelbaum, Cooper, Kline, Mayo-Wilson, Nezu and Rao2018; Morrison et al., Reference Morrison, Morrison and McCutcheon2017), reviews of SEM applications (Hancock & Schoonen, Reference Hancock and Schoonen2015; Ockey & Choi, Reference Ockey and Choi2015; Schoonen et al., Reference Schoonen, Cheung, In’nami, Chapelle, Suvorov and Li2025; Winke, Reference Winke2014), foundational works on SEM (e.g., Byrne, Reference Byrne2012; Hancock & Mueller, Reference Hancock and Mueller2013; Hoyle, Reference Hoyle2023), research on QRPs (e.g., Flores-Kanter & Mosquera, Reference Flores-Kanter and Mosquera2023; Isbell et al., Reference Isbell, Brown, Chan, Derrick, Ghanem, Gutiérrez Arvizu, Schnur, Zhang and Plonsky2022), as well as our own experience in the field. We do not claim that this represents an exhaustive list. Our primary objective is to raise awareness of QRPs that may be unintentionally employed, consequently compromising the trustworthiness of SEM results. Finally, to enhance transparency and to explicitly integrate these practices with the principles of open science, we demonstrate in the supplementary materials how to address these QRPs (https://osf.io/xmk5b ).
1) Not checking assumptions
SEM relies on a range of assumptions that operate at different levels, including assumptions about model specification, estimation, data characteristics, and study design. Some of these assumptions are specific to the estimator used, whereas others are shared with more general statistical models. Because the relevance of particular assumptions depends on the type of data, the model structure, and the analytical choices made by the researcher, not all assumptions apply equally in every SEM study. In this section, we highlight some assumptions that commonly arise in applied SEM research and that have direct implications for model estimation, missing data handling, and sample size. Readers who are interested in more detailed and technical discussions of SEM assumptions are referred to standard methodological treatments (e.g., Hancock & Schoonen, Reference Hancock and Schoonen2015; Kline, Reference Kline2023; West et al., Reference West, Wu, McNeish, Savord and Hoyle2023).
Classical SEM estimation and model-fit testing were developed under asymptotic assumptions, particularly assuming a large number of observations relative to the number of variables in the model (e.g., Marcoulides et al., Reference Marcoulides, Yuan, Deng and Hoyle2023). Under such conditions, key statistical assumptions are more likely to be met, and commonly used test statistics behave as intended. In applied research, however, these ideal conditions are often not satisfied. Researchers frequently work with sample sizes smaller than those assumed by asymptotic theory, as well as with complex models containing many observed variables, non-normal data, and missing responses. When this mismatch between assumptions and data is not acknowledged or addressed, it can lead to estimation problems and misleading conclusions, even when the model appears to fit the data well.
In light of these considerations, one of the first assumptions to consider concerns the distribution of the observed variables and the choice of estimator. When using normal-theory maximum likelihood (ML) estimation, an important assumption is that the observed continuous variables follow a multivariate normal distribution. Data normality can be examined using univariate and multivariate indicators such as skewness and kurtosis. When this assumption is violated for continuous outcomes, robust corrections such as the Satorra–Bentler scaled chi-square and robust standard errors provide a more appropriate basis for inference (e.g., Marcoulides et al., Reference Marcoulides, Yuan, Deng and Hoyle2023). For models involving categorical observed variables, estimation approaches based on diagonally weighted least squares, such as the weighted least squares mean and variance adjusted (WLSMV) procedure, are generally preferred (e.g., Kline, Reference Kline2023).
An important implication of estimator choice is that both the relevant distributional assumptions and the available options for handling missing data differ across modeling frameworks. For models estimated using WLSMV, normality is not assumed for the observed categorical variables themselves, but rather for the latent response variables that are assumed to underlie these observed responses (Li, Reference Li2015). Latent variable normality cannot be directly assessed using empirical diagnostics in the same way as observed-variable normality; instead, its implications must be evaluated indirectly through model fit, robustness checks, and transparent reporting of modeling assumptions. Estimator choice also constrains how missing data can be handled. Full information maximum likelihood (FIML) is available when using normal-theory ML estimation and provides an effective approach for handling data assumed to be missing completely at random (MCAR) or missing at random (MAR). When models involve categorical observed variables and are estimated using WLSMV, FIML is typically not available; in such cases, alternative approaches such as pairwise maximum likelihood can be used to address missing data under MCAR or MAR assumptions (Katsikatsou et al., Reference Katsikatsou, Moustaki and Jamil2022).
Beyond estimator-specific assumptions, SEM also relies on a number of general statistical assumptions that it shares with other modeling approaches based on the general linear model. One key assumption is the independence of observations, meaning that each participant’s responses are assumed to be unrelated to those of other participants. This assumption is often violated in applied research, for example, when data are collected from clustered settings such as students nested within classes, schools, or institutions, or when convenience or snowball sampling is used. When such dependencies are ignored, standard errors and test statistics may be biased, leading to incorrect inferences. Another common concern is sensitivity to outliers, which can disproportionately influence parameter estimates and model fit. In addition, SEM assumes homoskedasticity, or equal error variances across observations or groups. When heteroskedasticity is present, standard errors may be inaccurate, even if the overall model appears to fit the data well. In cases where these assumptions are violated, alternative approaches such as multilevel SEM or the use of cluster-robust standard errors and test statistics can be used to address these issues.
Another consideration that directly affects estimation quality and model evaluation concerns sample size. Many SEM estimation methods rely on large-sample properties, and when sample sizes are small relative to model complexity, parameter estimates, standard errors, and fit statistics may become unstable (Appelbaum et al., Reference Appelbaum, Cooper, Kline, Mayo-Wilson, Nezu and Rao2018; Feng & Hancock, Reference Feng, Hancock and Hoyle2023; Morrison et al., Reference Morrison, Morrison and McCutcheon2017). In applied research, practical constraints such as limited access to participants, time, or funding often restrict achievable sample sizes. As a result, researchers have relied on simple heuristics, such as minimum sample sizes of 100 or 200 (Boomsma, Reference Boomsma1985) or the rule of ten observations per variable (Everitt, Reference Everitt1975). However, such rules of thumb provide only rough guidance, as the required sample size depends on multiple interacting factors. Simulation research has shown that sample size requirements vary as a function of factor loadings, the number of indicators per construct, and the presence of missing data. For example, Wolf et al.’s (Reference Wolf, Harrington, Clark and Miller2013) simulation showed that in a one-factor model with factor loadings of .50, a minimum sample size of approximately 200 was required when the factor had 3 or 4 indicators, whereas a sample of 100 was sufficient when the factor had 6 or 8 indicators. When factor loadings were .80, the required minimum sample size dropped to approximately 50 across all tested conditions. Moreover, the presence of missing data further increased the required minimum sample size, ranging from 200 to 300, depending on the extent of missingness. These findings highlight that sample size should be considered in relation to the specific model and data characteristics rather than evaluated against fixed numerical thresholds.
Given this complexity, sample size decisions are better treated as part of the overall model planning rather than evaluated using fixed cutoff values. One practical approach is to use simulation-based power analysis, which allows researchers to examine how a specific model is expected to perform under conditions that are similar to the intended study (Feng & Hancock, Reference Feng, Hancock and Hoyle2023). Through simulation, it is possible to evaluate power for overall model fit as well as for individual parameters, while taking into account features such as model structure, effect sizes, and missing data. The simsem package in R (Pornprasertmanit et al., Reference Pornprasertmanit, Miller, Schoemann, Jorgensen and Quick2021) provides one way to conduct such analyses across different SEM conditions. Using this approach, researchers can make more informed decisions about sample size and better evaluate whether the assumptions underlying their analyses are likely to hold (see also online supplementary materials).
Recommendation 1: Researchers should systematically assess and report the statistical issues underlying SEM, including data normality, estimator appropriateness, and sample size adequacy. Rather than relying on fixed rules of thumb, sample size decisions should be guided by model-specific factors and informed through simulation-based power analysis when possible.
2) Not validating a measurement model
The use of psychometrically sound measures is vital (e.g., Kline, Reference Kline2023; Ockey & Choi, Reference Ockey and Choi2015). In the context of L2 research, Plonsky and Derrick (Reference Plonsky and Derrick2016) examined the percentage of reliability estimates reported across various L2 subdomains, revealing that reliability was documented in 6% to 64% of studies (see also Kostromitina et al., Reference Kostromitina, Sudina and Baghlaf2025; Sudina, Reference Sudina2021, Reference Sudina2023). This suggests that reliability reporting varies across subdomains. When two measures exhibit a low correlation, it is unclear whether the constructs themselves are weakly related or whether poor measurement reliability is responsible for the weak association.
In SEM, analytical models are generally composed of measurement models and structural models. Measurement models specify the relationship among observed variables and latent (unobserved) variables, thereby assessing the extent to which constructs are effectively operationalized and measured through their indicators. Structural models, in contrast, focus on the relationships among latent constructs. Given that researchers are often primarily interested in how constructs are related, structural models are often a focal point in SEM analyses.
For structural models to be interpreted with confidence, however, the measurement model must first demonstrate good fit to the data. Poor measurement model fit suggests that the constructs may not be measured appropriately, which in turn calls into question the validity of interpreting relationships among constructs in structural models. This is analogous to ensuring that instruments such as tests and questionnaires are valid and reliable before interpreting their scores or relationships among them.
One practice that can complicate model evaluation involves modeling the measurement and structural models simultaneously rather than sequentially (the latter of which involves testing the measurement models independently before testing the structural models). This practice leads to less transparency because, if a simultaneous model shows poor fit, it is unclear whether the issue originates from the measurement models, the structural models, or both. In contrast, when researchers first ensure that the measurement models fit well, they can more confidently attribute any remaining issues to the structural models, thereby refining their theoretical understanding.
Questions about measurement model quality also extend to how reliability is assessed within SEM. Computing Cronbach’s alpha is not a requirement when using SEM. In fact, it is often better to use alternative approaches to reliability that are more suitable for SEM. Some reliability measures, such as Cronbach’s alpha coefficient, rely on the assumption of equal item precision (tau-equivalence), which in factor-analytic terms corresponds to equal factor loadings, an assumption that is often violated in practice (Raykov, Reference Raykov2004). SEM-based approaches, particularly those from confirmatory factor analysis (CFA), offer more accurate alternatives. One such approach is Composite Reliability (CR), which is a more accurate estimate of internal consistency because it accounts for the actual factor loadings of each item (Fornell & Larcker, Reference Fornell and Larcker1981). For further details on Cronbach’s alpha and CR, see Peterson and Kim (Reference Peterson and Kim2013) and Raykov (Reference Raykov1998). Another approach is Average Variance Extracted (AVE), which assesses the amount of variance captured by the construct relative to measurement error (Fornell & Larcker, Reference Fornell and Larcker1981). Using CR and AVE enables researchers to better assess a scale’s reliability and convergent validity within the specific context of their SEM model, and AVE is also commonly used as part of procedures for evaluating discriminant validity.
Recommendation 2: Because the validity of the structural model relies on the quality of the measurement model, researchers should establish and report evidence for a well-fitting measurement model before proceeding to test structural relationships.
3) Not testing competing models
In many cases, it is possible to think of alternative models that might explain the data equally well, if not better. Not testing these models gives the reader no choice but to accept the model hypothesized by the authors. This is problematic because the author’s model is usually only one of the different models potentially supported by the data. Comparing multiple models allows researchers to critically assess the theoretical framework and its application within the model (e.g., Yun et al., Reference Yun, Hiver and Al-Hoorie2018). Metrics such as Akaike Information Criterion (AIC) and Bayesian Information Criterion (BIC) can help compare competing models to determine which one provides the best fit to the data while maintaining parsimony. Selecting the most appropriate model after empirically and theoretically eliminating competing alternatives is more meaningful than testing and selecting a single model in isolation (Joe et al., Reference Joe, Hiver and Al-Hoorie2017).
Testing competing models allows researchers to evaluate both the strength of the underlying theoretical rationale and its statistical implementation. For instance, in their review of the L2 Motivational Self System, Hiver and Al-Hoorie (Reference Hiver and Al-Hoorie2020) argued that the three components of the model—the ideal L2 self, the ought-to L2 self, and the L2 learning experience—may be modeled in various ways. Figure 1 presents four alternative models. They can be modeled as (a) a correlated three-factor model, (b) a correlated three-factor model with cross-loadings, (c) a bifactor model without cross-loadings, or (d) a bifactor model with cross-loadings. In the latter two cases, a general factor exerts influence on all items in the dataset. In some cases, cross-loadings may be theoretically expected because, for example, motivational self-constructs are conceptually related, and items may reflect overlapping aspects of learners’ self-guides. Detailed treatments of competing model evaluation within SEM, including alternative measurement specifications, are found in Morin (Reference Morin and Hoyle2023) and Morin et al. (Reference Morin, Myers, Lee, Tenenbaum and Eklund2020).

Figure 1. Four competing models of L2 Motivational Self System. Id = ideal L2 self, Ou = ought-to L2 self, ATLE = attitude toward L2 learning experience, Mtv = Motivation.
Equally important to consider is how to compare models. One key issue is the evaluation of measurement equivalence/invariance. Measurement invariance testing—conducted by comparing nested models (a less constrained vs. a more constrained model) and assessing changes in fit indices such as root mean square error of approximation (RMSEA) and comparative fit index (CFI)—is a widespread application in SEM and an important step in ensuring that constructs are measured equivalently across different conditions (e.g., Kline, Reference Kline2023). Such conditions may include groups (e.g., L1 vs. L2 learners), methods (e.g., questionnaire vs. interview formats), and time points (e.g., Time 1 vs. Time 2). Failing to conduct or report invariance testing can lead to misleading conclusions. Savalei et al. (Reference Savalei, Brace and Fouladi2024) review ongoing debates on this issue and recommend the use of RMSEA values associated with the chi-square difference test, rather than relying solely on the chi-square difference test or on changes in RMSEA.
Recommendation 3: Researchers should aim to develop multiple theoretically defensible models a priori (including invariance testing), compare them systematically, and report all results transparently.
4) Making insufficiently justified modeling decisions
SEM provides researchers with a flexible framework to model relationships among variables. While SEM has been categorized into exploratoryFootnote 1 and confirmatory approaches in the literature, most applications fall somewhere in between. It is also possible to use both approaches with the same data set (Morin, Reference Morin and Hoyle2023). The exploratory approach relies on data-driven decisions to model relationships between variables without a strong theoretical basis. For example, a researcher may specify that a latent variable influences all observed variables. They may also specify directional, causal relationships among latent variables without prior theoretical justification. In contrast, the confirmatory approach is guided by theoretical foundations. This approach may involve specifying that a latent variable influences only certain observed variables rather than all of them. Similarly, it may define directional relationships based on prior theory, ensuring one latent variable influences another but not vice versa. If the model-building process is not clearly reported, readers will be left uncertain about how constructs have been operationalized in SEM and how trustworthy the results are. Nevertheless, although SEM can be used in both an exploratory and confirmatory manner, we stress prioritizing the confirmatory approach when possible. One reason is that SEM allows users to take a theory-based, causal approach. This is particularly evident when an arrow is drawn from one variable to another, indicating a directional, cause–effect relationship that should be grounded in theory or prior research (see Al-Hoorie & Hiver, Reference Al-Hoorie and Hiver2025, for more detail on causal inference from observational data).
It is worth noting that exploratory research, when conducted ethically, does not in itself constitute a QRP. The critical issue lies in ensuring that post hoc modeling decisions remain theory-guided and data-supported, rather than merely data-driven, while simultaneously considering how empirical evidence can inform the refinement of theory. As discussed above, research rarely falls neatly into purely exploratory or purely confirmatory categories; instead, it spans a continuum between these extremes. The most reliable scientific inferences arise not when data dictates questions or hypotheses after the fact, but when theoretically grounded questions are posed in advance and then empirically tested in order to minimize the risk of post hoc significance chasing. Any data-informed decisions about refining a theoretical model, even when conducted rigorously, require newly formulated hypotheses to be tested on new data, as evaluating such hypotheses using the same data that generated them does not constitute an independent test. This process, commonly referred to as cross-validation, is essential for drawing robust scientific inferences. One way to further increase transparency is preregistration, which allows researchers to make key modeling decisions explicit before data analysis.
As an illustration, in their analysis of studies on the L2 Motivational Self System, Hiver and Al-Hoorie (Reference Hiver and Al-Hoorie2020) reviewed how different studies approached causal modeling in SEM. For example, Taguchi et al. (Reference Taguchi, Magid, Papi, Dörnyei and Ushioda2009) examined the influence of (a) ideal L2 self on (b) L2 learning experience (which they called “attitudes toward learning English”), whereas Kormos and Csizér (Reference Kormos, Csizér, Dörnyei and Ushioda2009) investigated the impact of (b) L2 learning experience on (a) ideal L2 self. Despite using the same constructs, these studies specified opposite causal directions. Given that both models demonstrated data fit, this may suggest the possibility of bidirectional causality: a → b and b → a. Alternatively, as Hiver and Al-Hoorie (Reference Hiver and Al-Hoorie2020) argued, the findings may also reflect reciprocal causality, wherein both variables exert mutual influence (e.g., Kline, Reference Kline2023): a ⇄ b. It is also possible that no causal relationship exists, and the observed association is simply caused by a third variable (see Al-Hoorie & Hiver, Reference Al-Hoorie and Hiver2025).
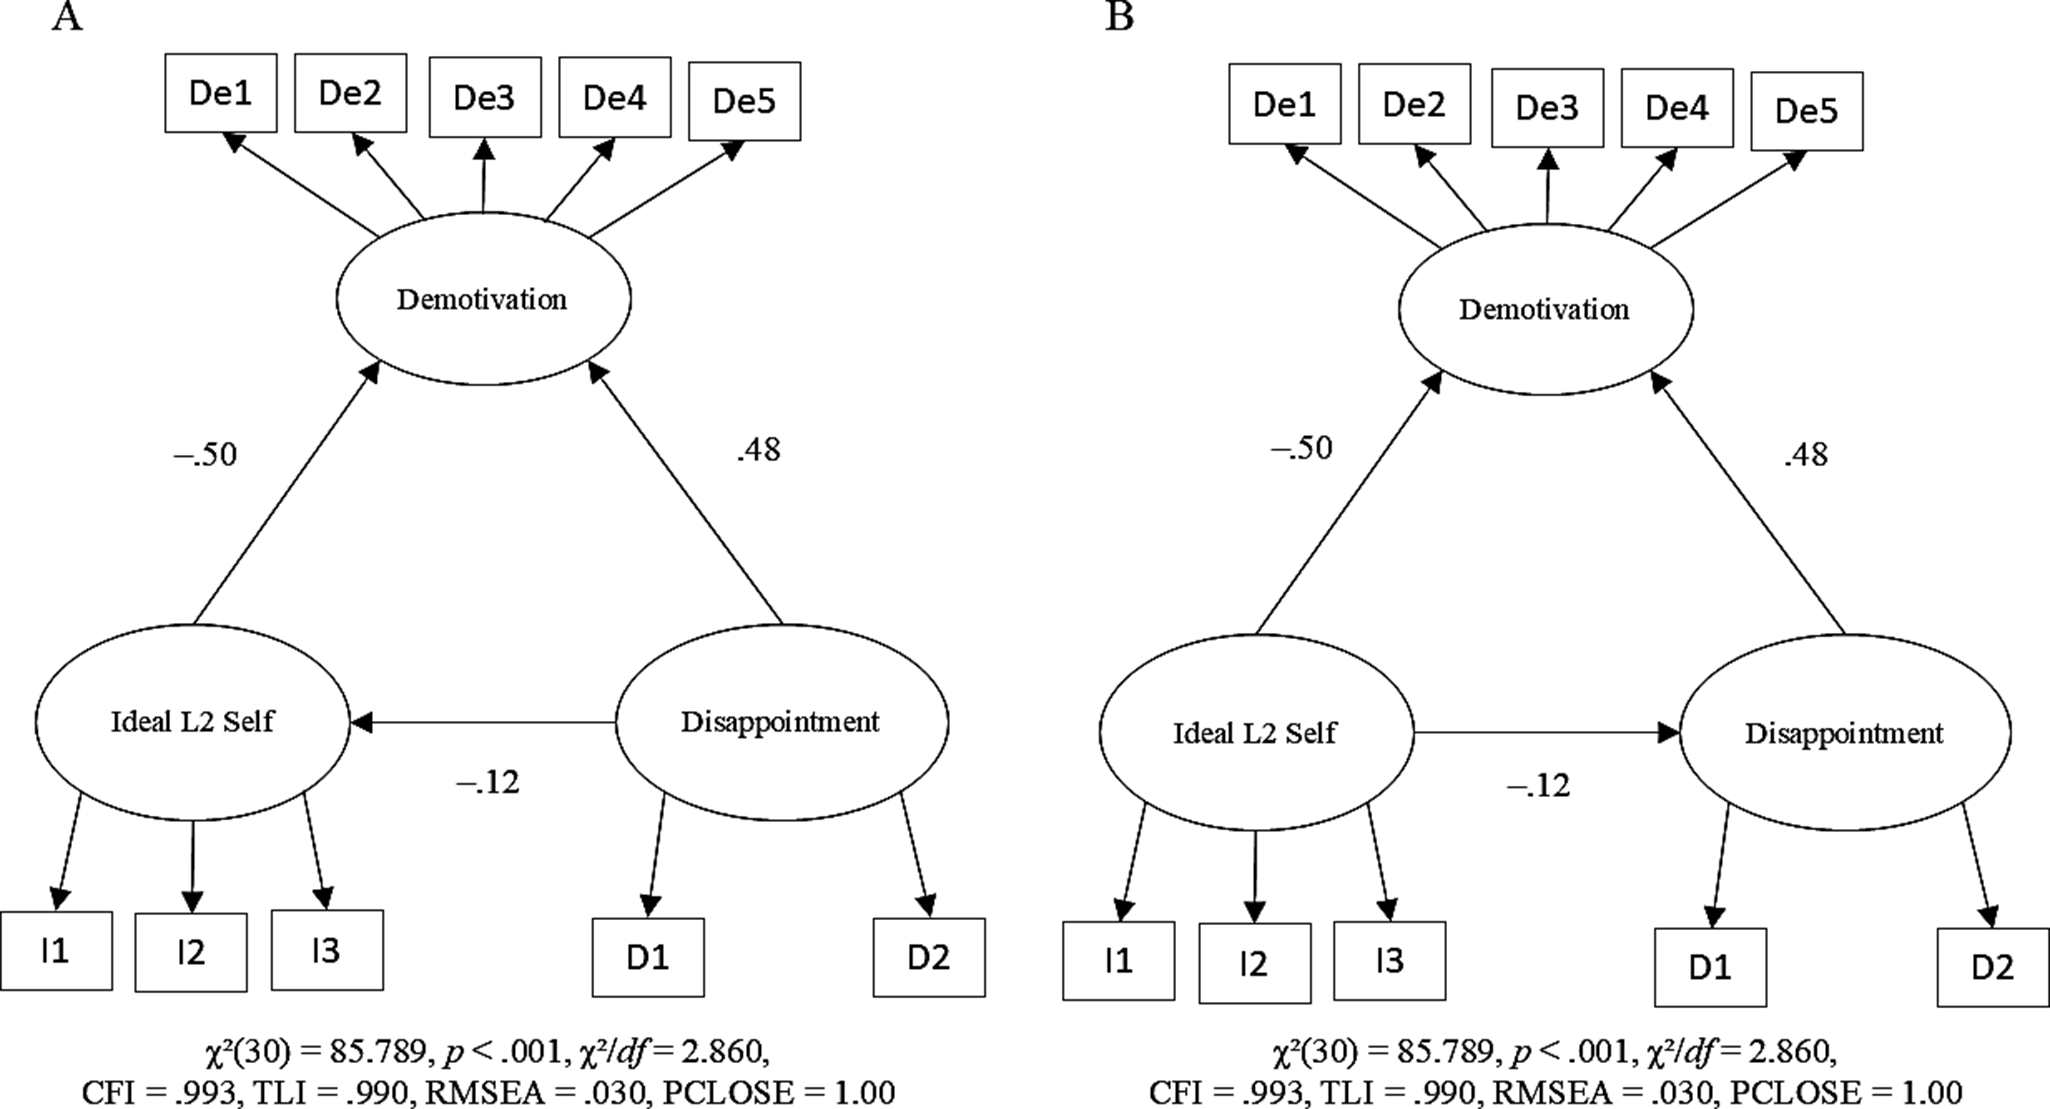
Among the three types of causality, the first two cases, a → b and b → a, produce the same statistical results under specific conditions, because the models are statistically equivalent in terms of the model-implied covariance matrix and mean vector (see online supplementary materials). This equivalence reinforces the importance of robust theory over statistical results alone. For example, Hiver and Al-Hoorie (Reference Hiver and Al-Hoorie2020) demonstrated that two models describing the relationship between (a) ideal L2 self and (b) disappointment in daily life produced identical results (i.e., path coefficients and fit indices; see Figure 2), even though the direction of the path between these two variables was reversed. In one model, the ideal L2 self appeared to be influenced by disappointment, whereas in the other model, the ideal L2 self itself seemed to influence disappointment. This result arises because only the directional path between the predictor and mediator was changed, while the remainder of the model remained unchanged. In contrast, reversing the direction of the path between a mediator and an outcome would affect parameter estimates, even though the models are still statistically equivalent and produce identical model-implied covariance matrices and mean vectors. Thus, obtaining an acceptable model fit does not support a unique, causal interpretation, stressing the need for theoretical justification when specifying paths.

Figure 2. Two models with different causal specifications resulting in identical structural coefficients and identical model fit. Error terms have been removed for simplicity.
Stronger causal inference in SEM depends not only on statistical modeling but also on theory and research design, including careful consideration of confounders, mediators, and colliders (Al-Hoorie & Hiver, Reference Al-Hoorie and Hiver2025). Longitudinal designs are particularly useful because they impose temporal ordering and allow researchers to examine change over time. Models such as the random-intercept cross-lagged panel model, the stable trait, autoregressive trait, and state model, and related dynamic panel approaches provide tools for evaluating directional hypotheses using repeated measures (Lucas, Reference Lucas2023). However, even with longitudinal data, causal interpretations cannot be based on model fit alone and must remain grounded in theory and explicit modeling assumptions.
Recommendation 4: Every modeling decision—including the selection of variables, the specification of covariances, and the direction of paths—should be grounded in theory and explicitly justified.
5) Modifying the model post hoc
Unlike insufficiently justified modeling decisions discussed earlier, where the researcher specifies the model without theoretical justification, here the researcher modifies or respecifies the model based on the results. This is often achieved using modification indices to enhance model fit. For instance, modification indices may indicate the need to add, remove, or modify paths between variables, correlate residual errors, or incorporate cross-loadings. While these changes can enhance model fit over several iterations, implementing them without a strong theoretical basis compromises the validity of the model and may constitute a QRP. Rather, such modifications should serve as signals that encourage the researcher to reconsider the theoretical model.
A key distinction must be drawn between data-driven decisions and data-supported theoretical updates. In data-driven model modification, researchers revise the model primarily in response to statistical patterns (e.g., adding paths with large modification indices), which can encourage ad-hoc rationalizations and weaken the confirmatory interpretation of SEM results. In contrast, theory-based refinement treats statistical indications as prompts to reconsider the theoretical model. For example, patterns in correlation residuals may motivate a theoretically grounded explanation for why certain variables are more or less strongly related than expected. Only when such an explanation is plausible should a corresponding modification be considered. Even when modifications are introduced post hoc, this reasoning can be made more rigorous by asking whether the same path or covariance would have been specified if the model were formulated a priori. In some cases, alternative or nested models can also be specified in advance, allowing later model comparisons to be treated as confirmatory rather than purely exploratory.
Removal of parameters or variables solely on the basis of statistical non-significance or small sizes is similarly not justifiable. If these elements are theoretically relevant to the construct, as hypothesized a priori, they should be retained in order to align with the confirmatory nature of the model. Their exclusion may result in an underrepresentation of the construct, thereby diminishing the model’s interpretability and theoretical validity.
Further, making post hoc modifications to models can result in overfitting, where the model fits the current dataset well but may not generalize to new data. This may raise concerns in cross-validation and the broader applicability of the substantive findings (e.g., West et al., Reference West, Wu, McNeish, Savord and Hoyle2023). Given that the modified model deviates from the original, theory-driven model, it should ideally be tested with an independent dataset to determine the extent to which it remains supported (e.g., Kline, Reference Kline2023; Leeming et al., Reference Leeming, Vitta, Hiver, Hicks, McLean and Nicklin2024).
Therefore, post hoc modifications should be theoretically justified. Because statistical software provides these suggestions based on statistical rather than theoretical considerations, they should be carefully reviewed and applied only when they hold substantive meaning. Otherwise, the model may achieve a strong statistical fit but lack substantive value. While we emphasize the risks associated with post hoc modifications, we also acknowledge that data often challenge theoretical expectations and that exploratory insights can play a constructive role in theory development. It is important to recognize, however, that post hoc model modifications generate new hypotheses using information from the data. As mentioned above, these hypotheses require testing on new data, as evaluating them on the same dataset does not constitute a valid confirmatory test. Adopting a transparent and self-skeptical approach helps maintain scientific integrity while still allowing theory to be refined and extended.
Recommendation 5: Post hoc modifications—whether additions or deletions—should be minimized, informed by theory, and reported transparently. Findings from post hoc modifications should be tested against new data.
6) Overemphasizing global model fit indices
Model fit in SEM is assessed at both global and local levels. Overemphasizing global fit refers to evaluating model adequacy primarily or exclusively on the basis of global fit indices, while neglecting residuals, localized misfit, and substantive theory. Global fit evaluates the overall alignment of the model with the data, relying on indices such as the chi-square test statistic (and its p-value for given degrees of freedom) and several indices of approximate fit: RMSEA, CFI, and standardized root mean square residual (SRMR). Local fit, by contrast, assesses the degree to which the model adequately reproduces relationships between each pair of variables. While global fit provides a broad measure of model-data consistency, it does not diagnose the specific areas where misfit may occur. Local fit addresses this limitation by examining the individual associations within the model, allowing researchers to pinpoint and help address discrepancies. It is typically evaluated through standardized residuals or residual covariance matrices, which help identify specific variable pairs or parameters that contribute disproportionately to overall misfit. Given that global and local fit statistics assess models from different perspectives, both should be incorporated into model evaluation (e.g., Appelbaum et al., Reference Appelbaum, Cooper, Kline, Mayo-Wilson, Nezu and Rao2018; Kline, Reference Kline2023, Reference Kline2024). While global fit indices are more commonly reported, disregarding local fit may result in models that appear well-fitting at a global level but contain numerous localized inconsistencies. Models with statistically significant global misfit might be rejected without considering local fit indices, which could indicate a major discrepancy (or several of them), the accumulation of many minor (potentially ignorable) discrepancies, or both, thereby providing a more nuanced understanding of data–model fit.
Kline (Reference Kline2023) recommends an approach to model evaluation that incorporates both global and local fit. If the chi-square test is statistically significant, indicating that the model may not fit the data well, tentatively reject the model and examine the residuals (i.e., local fit) to identify discrepancies between the model and the data. If no substantial discrepancies are detected, evaluate the model substantively and empirically. For empirical evaluation, consider RMSEA, CFI, and SRMR. If the chi-square is statistically non-significant, suggesting that the model may fit the data, inspect the residuals. If no major inconsistencies are found, evaluate the model substantively and empirically using these fit indices.
Kline’s (Reference Kline2023) approach to model evaluation merits further discussion in two points. First, regardless of whether the chi-square is statistically significant, it is critical to examine residuals. Residual analysis identifies differences between the model and the data at the level of individual variable pairs, allowing researchers to locate misfit and modify the model accordingly. Since global fit indices are not designed to reveal these discrepancies, a model should be rejected even if the chi-square is non-significant if large residuals are present (for more on residual analysis, see Kline, Reference Kline2024). Second, for models with statistically significant chi-squares, Kline (Reference Kline2023) proposed to tentatively reject the model and inspect the residuals. This approach places less emphasis on statistical significance and instead encourages researchers to diagnose whether misfit is due to large residuals in specific parts of the model.
It is important to clarify the interpretation of chi-square significance. The chi-square test does not detect sample size; rather, when the null hypothesis of exact fit is false, the test becomes increasingly capable of detecting even very small discrepancies as sample size increases (e.g., West et al., Reference West, Wu, McNeish, Savord and Hoyle2023). This behavior is not unique to SEM: for example, an independent-samples t-test gains power to detect increasingly small differences as sample size increases. In other contexts, researchers accompany statistical tests with effect-size measures to distinguish statistically significant but practically negligible results. In SEM, approximate fit indices were originally intended to serve this function by providing information about the magnitude of model misfit, rather than replacing statistical tests or local fit diagnostics. A common misunderstanding—that a significant chi-square “reflects sample size more than misfit”—may have led researchers to dismiss chi-square significance entirely. Recognizing that chi-square significance provides meaningful information about model misfit, while approximate fit indices and residuals provide complementary perspectives on its magnitude and location, helps avoid this misunderstanding and supports more defensible model evaluation.
Relatedly, evaluating models rigidly based on fit index cutoff criteria is not a recommended approach. This is because the studies that established these thresholds may not be directly applicable to all research contexts. For instance, Hu and Bentler’s (Reference Hu and Bentler1999) recommended cutoffs—CFI close to .95, RMSEA close to .06, and SRMR close to .08—are frequently used to evaluate models somewhat uncritically. However, these cutoffs were derived from a simulation study using confirmatory factor models with 3 factors and 15 observed variables, tested under specific conditions. Unless a researcher’s model and study conditions are similar to those in Hu and Bentler’s (Reference Hu and Bentler1999) study, these cutoffs should not be applied uncritically. In fact, Hu and Bentler (Reference Hu and Bentler1999) viewed these values as general guidelines rather than absolute rules. Furthermore, the cutoffs were not supported in later studies, questioning their applicability across different modeling conditions (e.g., Fan & Sivo, Reference Fan and Sivo2005; Yuan, Reference Yuan2005).
To address these challenges, one approach is to examine dynamic, study-specific cutoffs rather than strictly adhering to Hu and Bentler’s (Reference Hu and Bentler1999) criteria. Simulation-based approaches can be used not only for power and sample size planning, but also to evaluate how fit indices are expected to behave under a given model, sample size, and degree of misspecification. This strategy does not diminish the importance of local fit inspection or theoretical justification in model evaluation (see McNeish & Wolf, Reference McNeish and Wolf2023, for further discussion; see also online supplementary materials).
Recommendation 6: Researchers should avoid overreliance on global fit indices and instead adopt a comprehensive model evaluation strategy that includes both global and local fit, careful inspection of residuals, and theoretical justification. Fixed cutoff values should be interpreted cautiously and in light of model complexity, degrees of freedom, and sample size, rather than applied rigidly across contexts.
7) Incomplete or nontransparent reporting
As discussed above, SEM provides a flexible framework for modeling relationships among variables. This flexibility extends to the wide range of output options available, which depend on the type of model analyzed and the additional details requested. For example, models with a large number of variables produce extensive lists of parameter estimates. If the dataset contains non-normal data, the output may include results both with and without adjustments for nonnormality. While these analytical capabilities allow for more comprehensive analyses, they also introduce challenges in presenting results clearly. This complexity increases the risk of selective reporting, where findings that align with the researcher’s hypothesis are prioritized while contradictory results are omitted. Selective reporting, as well as incomplete or nontransparent reporting of the issues discussed above, compromises the transparency and rigor of model evaluation and interpretation.
Researchers should therefore strive for complete and transparent reporting. Rather than relying solely on data-driven decisions, they should provide theoretical justifications for model specification. Modifying the model based on results is appropriate only if the changes are substantively supported and transparently documented. Testing measurement models is an important step in model development and should be systematically reported. Evaluating competing models allows researchers to test hypotheses, and documenting this process contributes to theoretical refinement. Reporting both global and local fit statistics indices provides a comprehensive assessment of model–data fit. Because fixed cutoffs for fit indices may not always be appropriate in a given study context, incorporating dynamic cutoffs can offer additional insights. Lastly, reporting whether the necessary assumptions for SEM were met—and describing how any violations were addressed—enhances the credibility of the research.
Ensuring complete and transparent reporting is a fundamental principle of research (Al-Hoorie et al., Reference Al-Hoorie, Cinaglia, Hiver, Huensch, Isbell, Leung and Sudina2024; Liu et al., Reference Liu, Chong, Marsden, McManus, Morgan-Short, Al-Hoorie, Plonsky, Bolibaugh, Hiver, Winke, Huensch and Hui2023). However, practical constraints, such as word limits, may restrict the amount of information that can be included in published studies. Even when supplementary files are provided or data are made available through repositories such as IRIS (https://www.iris-database.org) and Open Science Framework (OSF; https://osf.io/), essential details may still be missing, or additional information may be required for future analyses. Moreover, some readers may seek to reproduce the reported models. To enhance reproducibility, researchers are encouraged to share analysis code, data, and output files whenever feasible (though see Chapelle & Ockey, Reference Chapelle and Ockey2024, for potential drawbacks associated with this practice).
Ethical concerns may prevent researchers from sharing raw data. However, they can still provide summary statistics, such as means, standard deviations, and correlations, which allow other researchers to reproduce the reported model. SEM software calculates these values during analysis, meaning that summary statistics can sometimes be sufficient for reproducing models. Thus, reproducing SEM results without raw data is possible under certain conditions, such as when the dataset is normally distributed and complete (i.e., contains no missing responses). If these conditions are not met, raw data are necessary to accurately reproduce the original model. To determine whether a model can be reproduced using summary statistics alone, researchers can compare the consistency of results derived from both raw data and summary statistics-based analyses. Regardless of whether raw data can be shared, reporting summary statistics is strongly recommended, as it provides readers with a clear overview of the dataset’s characteristics.
A recent example is provided by Nagle (Reference Nagle2023), who shared data, analysis code, and output files. In examining longitudinal change in individual difference variables, the study addressed the issue of longitudinal measurement invariance. To illustrate this approach in motivational research, the author tested invariance for the ought-to L2 self using data from 141 U.S. university students collected at three time points across a semester (beginning, midterm, and end). Results supported strong invariance, indicating the same factor structure, equal loadings, and equal intercepts across time. These findings suggest that the ought-to L2 self was measured consistently, and that observed changes reflected true change in the construct rather than changes in measurement. We ran the R code and successfully reproduced the results reported in the study.
Another example is Suzuki and Kormos (Reference Suzuki and Kormos2023), who examined the relationship between cognitive fluency and utterance fluency in second language oral proficiency among 128 Japanese learners of English. After examining measurement models for both constructs, they tested a structural model linking them. One key finding was that speed fluency—one component of utterance fluency—was related to linguistic resources—one component of cognitive fluency—only in certain task types (e.g., reading-to-speaking), highlighting the moderating role of task characteristics. Using the shared materials, we successfully reproduced the reported analyses and results.
Recommendation 7: Researchers should ensure complete and transparent reporting of SEM procedures and results, including model specifications, assumptions, fit indices, and any post hoc modifications. Whenever feasible, they should share data, analysis code, and output files to enhance reproducibility.
Table 1 provides an overview of the main QRPs discussed in this article, along with corresponding recommendations.
Table 1. SEM QRPs and Best Practice Recommendations

Conclusion
In this article, we have addressed analytical transparency in the context of SEM. Specifically, we have reviewed best practices in SEM by synthesizing insights from relevant methodological literature. While these best practices have been well documented (e.g., Hancock & Mueller, Reference Hancock and Mueller2013; Hoyle, Reference Hoyle2023), limited attempts have been made to explicitly integrate these practices with the principles of open science.
We chose to center the term fit-hacking (Flores-Kanter & Mosquera, Reference Flores-Kanter and Mosquera2023) in the title because model fit remains the final arbiter in determining whether SEM results are deemed acceptable or publishable. While QRPs in SEM may take many forms—ranging from post hoc modifications to selective reporting and under-disclosure—they are often motivated by a desire to achieve acceptable model fit indices. In this broader sense, fit-hacking is not a single technique but a unifying concept that captures the end goal of many questionable modeling behaviors. Placing fit-hacking at the conceptual center of our discussion underscores the need to reconsider the overreliance on model fit as a proxy for research quality and calls for a more balanced and transparent approach to model evaluation.
Although we have discussed seven QRPs related to SEM (Table 1), they represent only some of the key considerations for ensuring the responsible use of SEM. Other QRPs not discussed in this paper may be just as important and deserve further exploration as they become more widely utilized in the field. They should be investigated in future research to advance transparency, enhance best practices in SEM, and improve the trustworthiness of insights derived from SEM-based studies.
Furthermore, we emphasize that our goal is not to discourage researchers from using SEM, but to discourage its use without sufficient training and careful consideration of its assumptions and reporting requirements. As SEM becomes increasingly accessible through user-friendly software and brief tutorials (and now AI), there is a growing risk that powerful modeling frameworks are applied without adequate understanding or safeguards. At the same time, many of the open science concerns discussed in this piece have only gained prominence in recent years and are therefore often not addressed explicitly in classic methodological references, whether in SEM or in other statistical traditions. Experiences from neighboring fields suggest that a lack of transparency, together with growing flexibility in statistical analyses, contributed to later concerns about reproducibility and trust in published research.
Finally, in offering such guidance above, we do not intend to imply that researchers in the field engage in poor SEM practices or that findings from previous SEM-based studies are necessarily questionable. Some techniques we reviewed have only recently been developed or become widely accessible. Furthermore, the emphasis on open science, research misconduct, and QRPs has itself only recently gained prominence within the field. Indeed, we acknowledge that some of the recommendations discussed in this paper were not implemented in our own past research for these very reasons. While QRPs, including those discussed here, may be unlikely to disappear in the immediate future, we hope they will become gradually rarer over time.
Data availability statement
The experiment in this article earned Open Data and Open Materials badges for transparent practices. The data are available at https://osf.io/xmk5b.
Competing interests
The authors declare that there are no competing interests.


 Open access