


Throughout history, childless individuals have often faced scrutiny and assumptions about their interest in the wellbeing of future generations (Gouni et al., Reference Gouni, Jarašiūnaitė-Fedosejeva, Kömürcü Akik, Holopainen and Calleja-Agius2022). This longstanding stigma suggests that those without biological children may have a diminished stake in the future, particularly concerning their genetic representation among descendants. The desire to pass on knowledge, culture, and beliefs to subsequent generations remains a core motivation for many individuals in western countries (Hunter & Rowles, Reference Hunter and Rowles2005). It is common for those with adult children to wish for grandchildren and to encourage their children to continue family traditions and lineage through offspring (Axinn et al., Reference Axinn, Clarkberg and Thornton1994).
This desire for continuation and concern about genetic legacy is also significant on a global level — where having biological descendants (particularly sons) is a key driver (Gupta et al., Reference Gupta, Zhenghua, Bobua, Zbenming and Hwa-Ok2002; Vasudevan & Bhuvaneswari, Reference Vasudevan and Bhuvaneswari2023; Widge, Reference Widge, Vayena, Rowe and Griffin2002) and the wish to uphold the family line can profoundly shape these decisions, impacting those who face the prospect of childlessness. The emphasis on lineage continuation is prevalent in many cultures around the world, amid rising levels of childlessness and low fertility rates prevalent across many populations worldwide (United Nations Population Division [UNPD], 2024; World Health Organization, 2015).
Understanding gene transmission is important when examining the dynamics of family structures. It is well established that an individual shares approximately 50% of their DNA with their siblings, and this genetic similarity decreases as we move further away from an individual in the family tree. An individual — in this case, a childless individual — shares around 25% of their genes with their nieces and nephews, 12.5% with their great-nieces/nephews, and 6.25% with their great-great-nieces/nephews (Figure 1). If this individual’s sibling has five children, genes can be passed down through five distinct lineages, each carrying 25% of one’s genes. It is worth noting that genetic similarity diminishes over time, with approximately 0.8% of one’s DNA remaining by the seventh generation of direct descent. After 10 generations, there are around 757 ancestral stretches of DNA and 1024 distinct ancestors. This implies that individuals likely have several hundred ancestors from whom they have not directly inherited any DNA. After 20 generations, the number of ancestors becomes significantly greater, and individuals may not have received DNA from the majority of their direct ancestors (Reich, Reference Reich2018). Because distant relatives reappear in family trees, the number of ancestors does not exponentially surpass that of descendants, ensuring the preservation of genetic similarities within groups (Derrida et al., Reference Derrida, Manrubia and Zanette2000). We have examined more closely the extent to which the childless today contribute genetically to future generations using real-world data.

Figure 1. Representation of the approximate DNA proportions shared with descendants and ascendants among childless individuals.
Methods
We gathered data from the national population census in Norway, a country with a similar fertility trajectory and slightly lower fertility rate (births per woman) than the US (1.41 in Norway, 1.67 in the US, 1.60 in the UK, and 1.50 in the European Monetary Union (EMU) (Figure 2; World Bank Group, 2022). The population analyzed includes only ethnic Norwegians, who have a low proportion of consanguinity, at 0.1% for first cousins and 1% for distant cousins in modern times (Stoltenberg et al., Reference Stoltenberg, Magnus, Lie, Daltveit and Irgens1997).
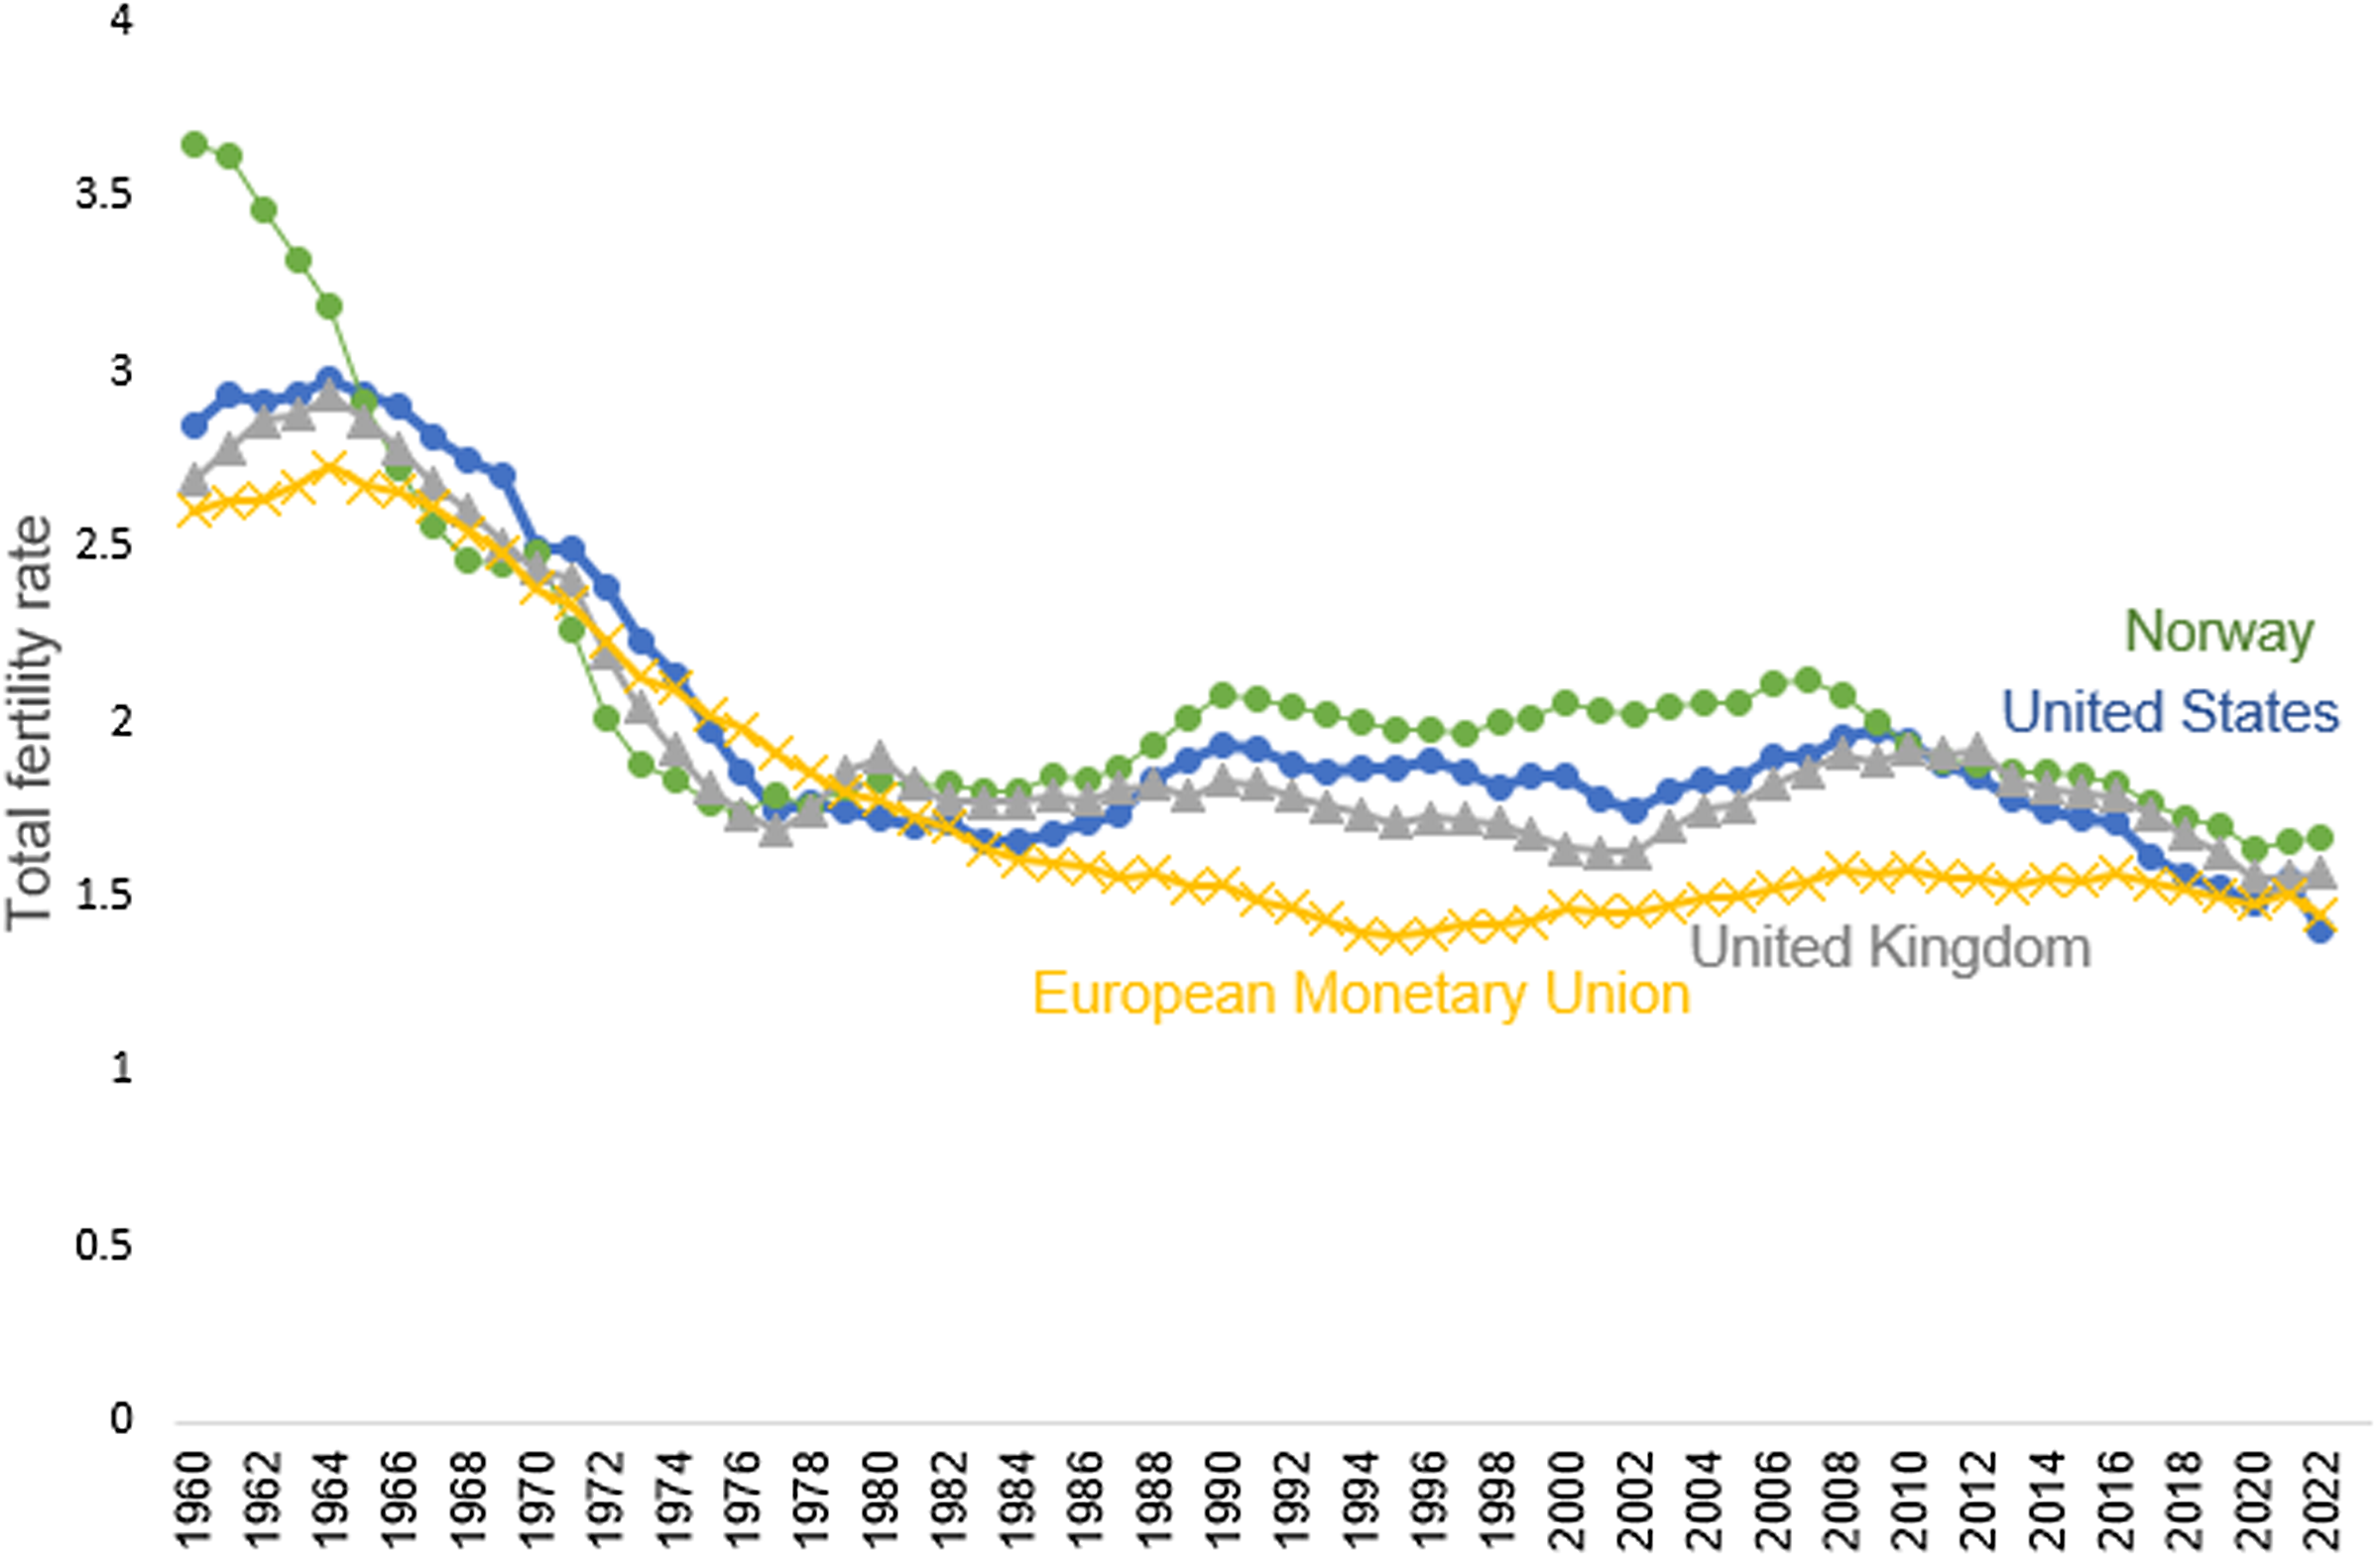
Figure 2. Total fertility rate in Norway, the United States and the United Kingdom. Source: United Nations Population Division. World Population Prospects: 2022 Revision.
Comparisons of Childless Individuals Versus Parents
We examined family dynamics for childless individuals and parents in Norway from 2005 to 2023, focusing on men and women born between 1960 and 1978. To ensure data reliability, we analyzed individuals present in Norway at age 45, resulting in a 19-year period for their parental status. We excluded men and women who died or emigrated before age 45 from the analysis, as well as intercountry adoptions. Comparisons were made between the childless and parents by age 45 to compare differences in family size and genetic legacies. A particular individual is counted as a sibling or niece/nephew only once for each individual relative. For example, a niece with four aunts will appear once in each of those four aunts’ sets of nieces, and similarly, an individual will be counted once in each of their siblings’ sets.
Two-sample Wilcoxon rank-sum (Mann-Whitney) test was used to check for significance between the average number of siblings and nieces/nephews between childless individuals and parents for men and women.
Four Generation Linkage to Track First Cousins and Children of First Cousins
To include first cousins and their children in the examination of familial relationships, it was necessary to establish connections spanning four generations. However, in our data, there is a trade-off between finding links to the grandmothers of women and men in the ‘reference generation’ and obtaining complete fertility information for their first cousins. Recent cohorts have complete links to grandmothers but are too young to have completed their reproductive years. Conversely, older cohorts may lack links to grandmothers in the registers. We narrowed our focus to women and men born between 1973 and 1978. We tracked the fertility of these women and men up until at least age 45 and captured most of the children born to their siblings and cousins (although some may not have completed their fertility by 2023). It is important to note that 10.9% of women and 11.0% of men are missing links to grandmothers, including those missing both grandmothers/grandfathers, only the maternal grandmother/grandfather, or only the paternal grandmother/grandfather. Most missing links for those born before 1960 stem from the household records in the 1960 census, which do not include links to those who died before 1960. Additionally, factors such as migration, where grandparents move in and out of Norway, contribute to this issue; any grandparent not residing in Norway would not have their information included in the national population census.
Calculation of Average Relative Genetic Fitness for the Next Generation
Genetic fitness for the next generation was assessed by calculating the proportion of genes shared with direct descendants as well as extended family members. Specifically, the genetic contribution from children was considered to be 50% (direct contribution) from nieces and nephews 25%, and from cousins’ children 6.25% (indirect contribution).
For individuals with children, we considered the genetic fitness for the average number of children among women and men who are parents. The total genetic contribution was calculated by multiplying 50% by the average number of children and adding this to the contributions from the average number of nieces and nephews and cousins’ children. For childless individuals, the calculation excluded the direct genetic contribution from children and focused solely on the contributions from nieces and nephews and cousins’ children. These individual genetic contributions were then summed to obtain the total genetic fitness score for both childbearing and childless individuals.
To determine average relative genetic fitness of childless individuals, the total genetic fitness score of childless individuals was divided by childbearing individuals and multiplied by 100.
Results
From 2005 to 2023, there were 514,777 women born in 1960–1978: 454,298 (88%) had a child by age 45 and 60,479 (12%) were childless. Among 532,832 men born in 1960–1978, 426,760 (80%) were parents by age 45 while 106,074 (20%) were childless.
Siblings and Nieces/Nephews Among Parents Versus Childless Individuals
From 2005 to 2023, there was an increase in the percentage of both men and women who remain childless by age 45 and a decrease in the average number of children they have by that age (Figure 3). There was a corresponding decrease in the percentage of both men and women with siblings and the number of siblings they had until 2022 when the proportion of the childless with siblings starts to increase. This increase is linked to the higher Norwegian fertility rates observed between 1886 and 1991 among women born between 1954 and 1960 (Figure 2).

Figure 3. Trends in the percentage and average number of siblings and nieces/nephews from 2005 to 2023 for women (red lines) and men (blue lines) who are childless and parents in Norway.
Women and men who were parents had slightly more siblings on average (women: 2.03; men: 2.03) than childless women and men (women: 1.88; men: 1.94; Mann-Whitney test p value < .001 for men and women studied separately; Figure 4). This suggests that individuals who become parents tend to come from larger families overall, which means more siblings who can have children and contribute to the family network. Interestingly, more childless women than childless men had no siblings, while men tended to come from families with more siblings. This is likely due to higher socioeconomic status in smaller families and the fact that childlessness is less common among women than among men. Women who do not have children often come from higher socioeconomic backgrounds and tend to be better educated, which are both factors associated with smaller family sizes (Fieder & Huber, Reference Fieder and Huber2007; Neyer et al., Reference Neyer, Hoem, Andersson, Kreyenfeld and Konietzka2017). Additionally, the societal expectations and pressures on women to have children might lead to fewer women remaining childless compared to men.
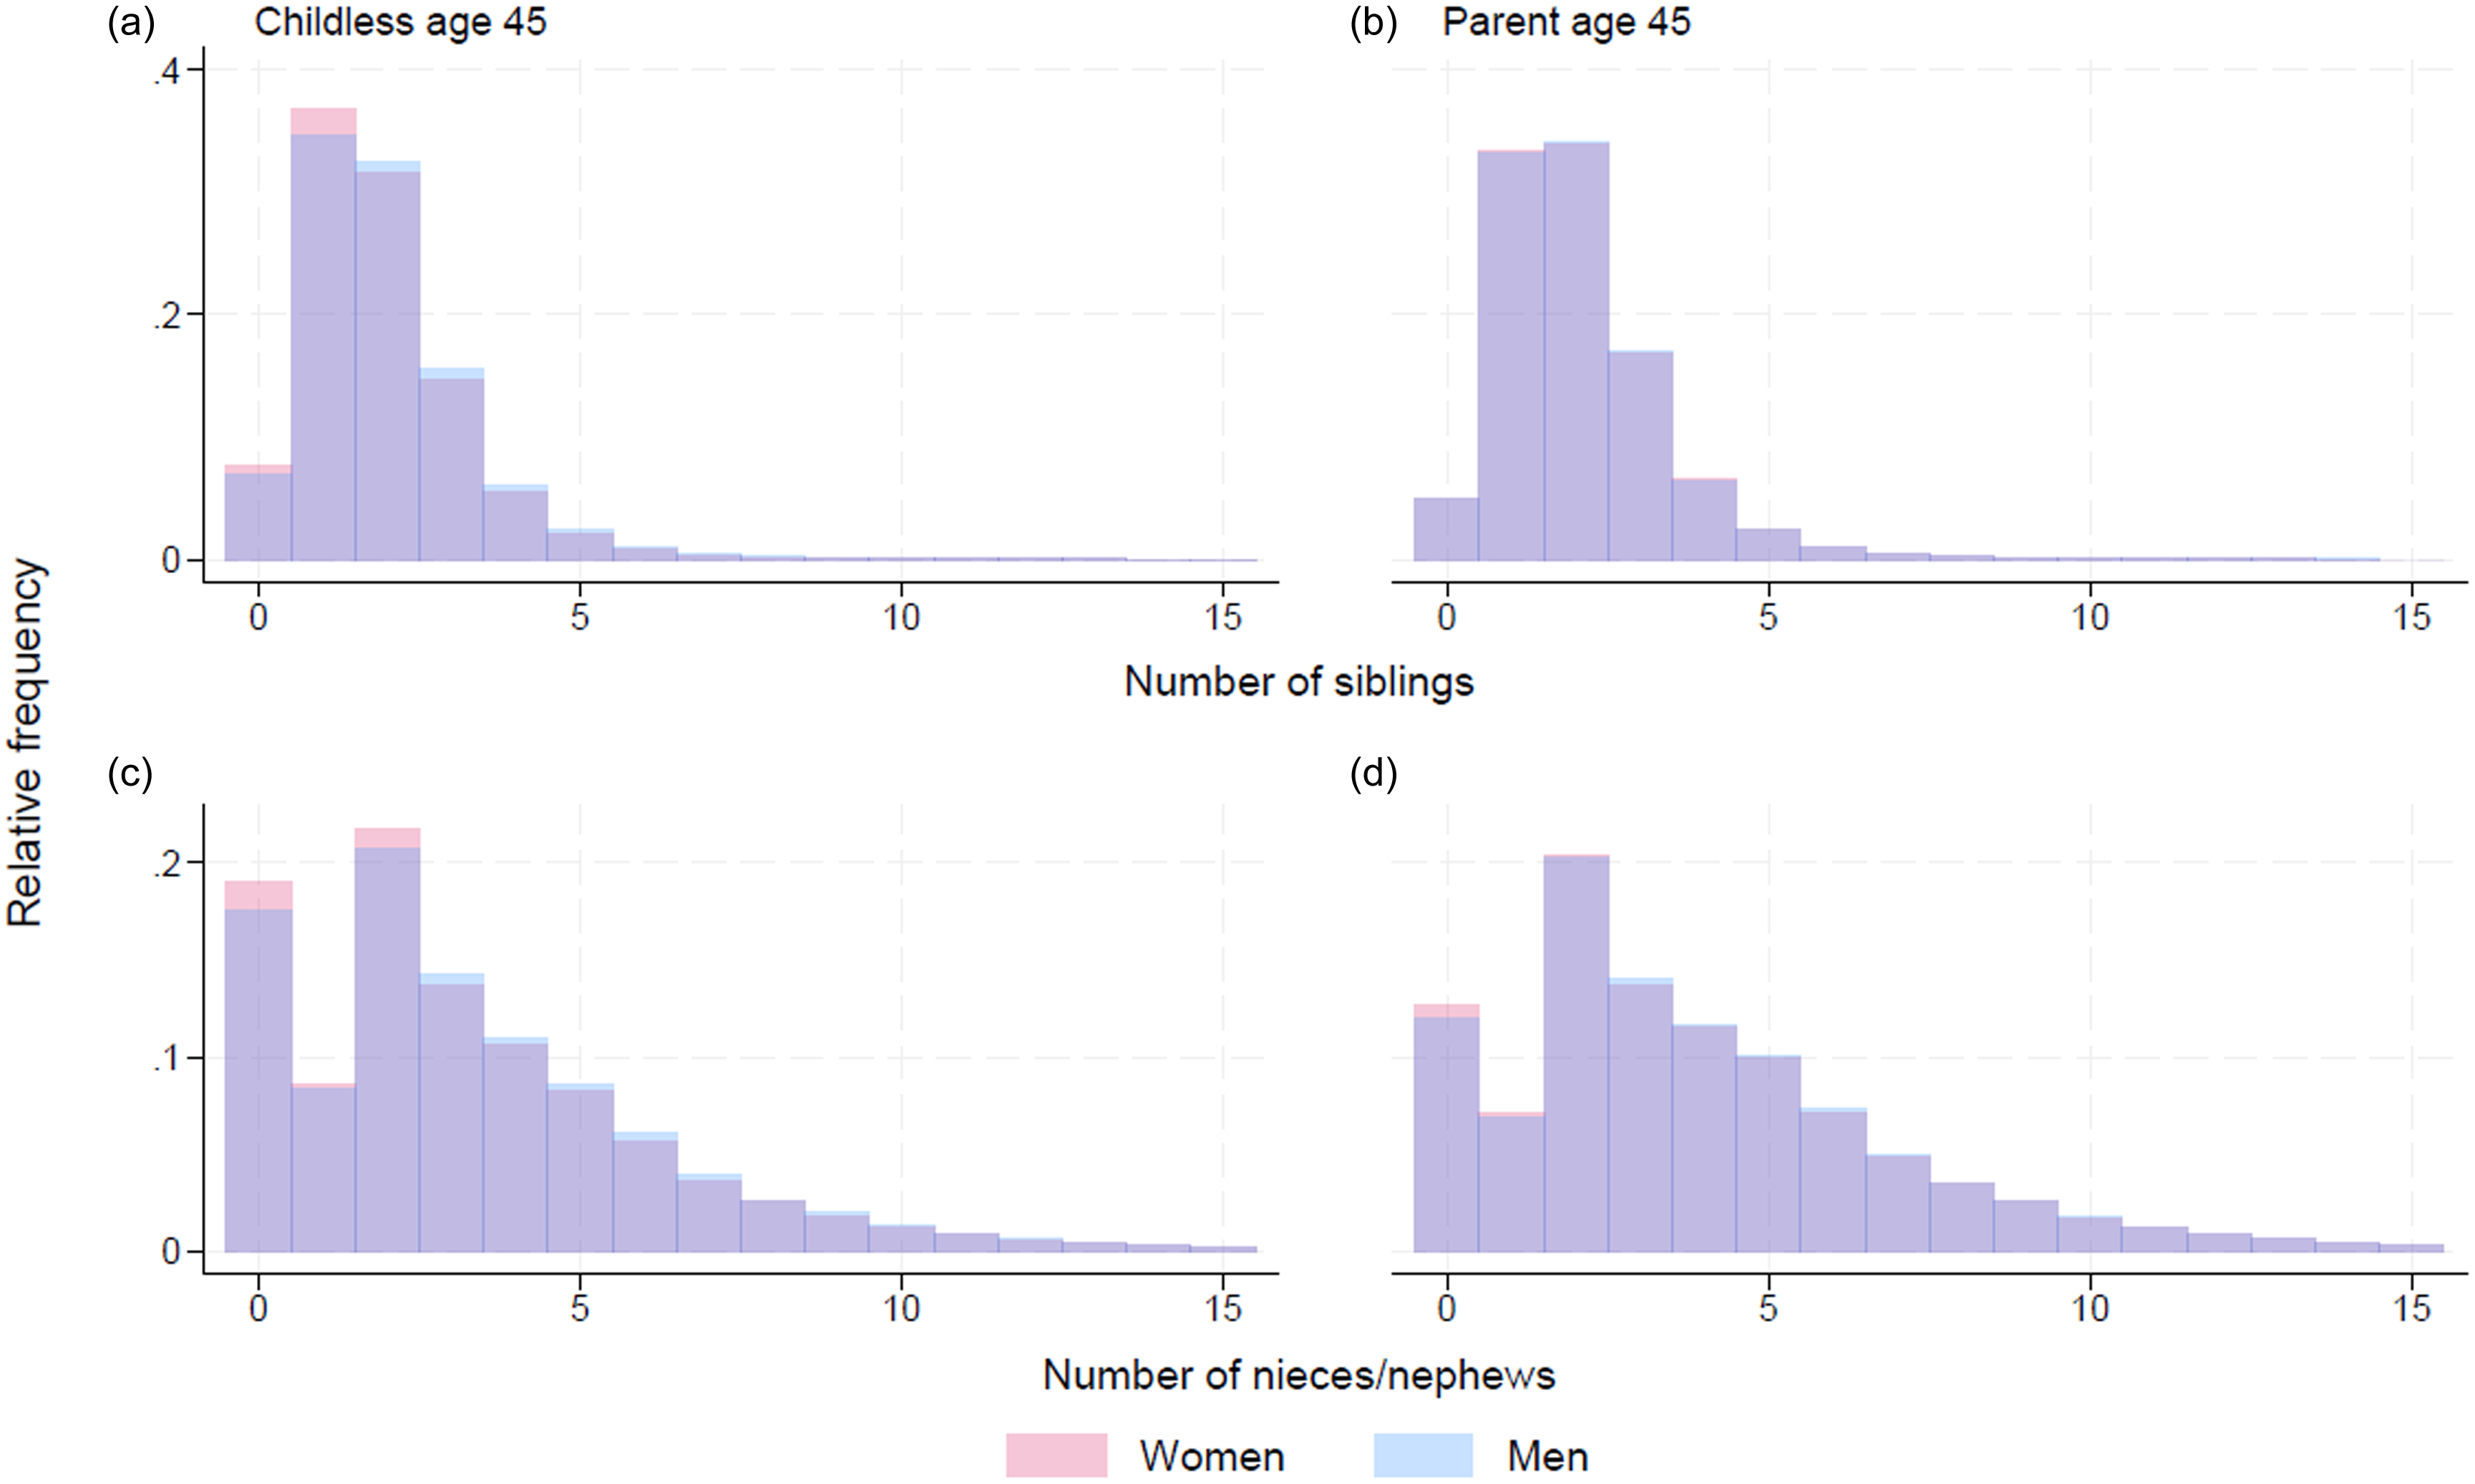
Figure 4. Frequency of siblings and nieces/nephews for childless (pink) and parent (blue) men and women by age 45 (born 1960–1978) in Norway, 2005–2023. Overlap is shown in purple. Bar height represents the percentage of women with each number of siblings or nieces/nephews. (a) Siblings for the childless (average for women: 1.88, men: 1.94), (b) Siblings for parents (average for women: 2.03, men: 2.03), (c) Nieces/nephews for the childless (average for women: 3.32, men: 3.42), (d) Nieces/nephews for parents (average for women: 3.99, men: 4.03).
The average number of nieces and nephews was also slightly higher among women and men who were parents, with an average of 3.99 nieces/nephews for women and 4.03 for men, compared to childless women and men who had an average of 3.32 and 3.42 nieces/nephews, respectively (Mann-Whitney U test p value of <.001 for men and women). Although parents had more nieces/nephews than childless individuals, this finding suggests that even in the second generation following both parents and childless individuals, both continued to have nearly the same number of biological descendants.
Four Generation Linkages — Number of First Cousins and Children of First Cousins in Parents Versus Childless Individuals
Of the 129,722 women with a link to at least one grandmother, 15,581 (12%) were childless and 144,141 (88%) were parents. Among 133,805 men born 1973–1978 with a link to at least one grandmother, 27,194 (20%) were childless while 106,611 (80%) were parents. Within the extended families, on average, childless women have 1.57 siblings, 2.56 nephews/nieces (children of their siblings), 8.66 first cousins, and 12.22 cousins’ children. Corresponding numbers for women who are parents are 1.67, 3.07, 9.63, and 15.79 (Figure 5). Among men, childless individuals have 1.60 siblings, 2.60 nephews/nieces, 8.83 first cousins, and 12.44 cousins’ children while parents have 1.69 siblings, 3.12 nephews/nieces, 9.68 cousins with 15.91 children. The Mann-Whitney tests reject equality of distributions for all comparisons between childless and parents in both men and women.

Figure 5. Four generation linkages (via grandmothers) for number of first-degree relatives (siblings), second-degree relatives (nieces/nephews), and third-degree relatives (first cousins and children of first cousins) for men and women who are childless and parents in Norway as of 2023. Overlap among men and women is in purple color. Bar height represents the percentage of women with each number of siblings or nieces/nephews.
Relative Genetic Fitness of Childless Individuals in the Next Generation
The average number of children among mothers is 2.27 while the average number for fathers is 2.23. For women, the direct genetic contribution from their average number of children (2.27 children × 50%) is 1.135. The indirect genetic contributions from nieces and nephews (3.07 × 25% = 0.7675) and cousins’ children (15.79 × 6.25% = 0.986875) were added, resulting in a total genetic fitness score of 2.889375.
For childless women, the genetic fitness was assessed by summing the indirect genetic contributions from nieces and nephews (2.56 × 25% = 0.64) and cousins’ children (12.22 × 6.25% = 0.76375), resulting in a total genetic fitness score of 1.40375.
For men with children, the direct genetic contribution from 2.23 (2.23 children × 50%) is 1.115. When the indirect genetic contributions from nieces and nephews (3.12 × 25% = 0.78) and cousins’ children (15.91 × 6.25% = 0.994375) are added, the total genetic fitness score is 2.889375.
For childless men, the genetic fitness was assessed by summing the genetic contributions from nieces and nephews (2.60 × 25% = 0.65) and cousins’ children (12.44 × 6.25% = 0.7775), resulting in a total genetic fitness score of 1.4275.
The average relative genetic fitness was determined by dividing the genetic fitness scores of childless individuals compared to parents. For women, the percentage was approximately: (1.40375/2.889375)*100 = 49%.
For men, the percentage was approximately: (1.4275/2.889375)*100 = 49%.
These calculations indicate that while the childless’ contribution to the family’s genetic legacy is not trivial, having just one child gives parents a higher genetic fitness compared to childless individuals.
Discussion
Using nationwide population registry data from Norway, a country with similar fertility rates and patterns to the US, the UK, and the EMU, we were able to track both parents and childless individuals across generations. The findings reveal that childless women and men have a nearly equivalent number of descendants to those who become parents, particularly in terms of first-degree relatives such as siblings, second-degree relatives such as nieces/nephews, and third-degree relatives (first cousins and children of first cousins). When evaluating genetic fitness — which considers the average proportion of genes shared with the next generation of descendants — the childless had an average genetic fitness that is 49% of women and men with children.
Throughout history, childlessness has often been scrutinized, with assumptions about diminished interest in future wellbeing. This scrutiny often differs for men and women due to the culturally assigned roles and expectations in reproduction and parenting (Moss & Baden, Reference Moss and Baden2015; Rich et al., Reference Rich, Taket, Graham and Shelley2011). Women have faced more intense scrutiny regarding childbearing due to societal norms that link female identity and worth to motherhood, while selfishness or materialism are attributed to women who remain childless (Abma & Martinez, Reference Abma and Martinez2006). This viewpoint has deep roots in cultural, economic, and political conditions that have historically valorized biological continuity. Culturally, many societies have emphasized procreation as a means to maintain ancestral lineage and heritage, often reinforced by religious beliefs (Buber-Ennser & Skirbekk, Reference Buber-Ennser and Skirbekk2016). Economically, having children was historically essential in agrarian societies for labor and inheritance purposes (Engels, Reference Engels, Alber and Thelen2022), while politically, population growth is linked to national strength and welfare security (Vos, Reference Vos2009).
Men are often less scrutinized for remaining childless, yet the desire to pass on a genetic legacy remains strong. Interestingly, trends show an increasing proportion of men remaining childless — a larger proportion than women. Prior research found that highly educated women often expect to have children, but due to postponement, 44% ultimately remain childless (Gemmill, Reference Gemmill2019; Verweij et al., Reference Verweij, Stulp, Snieder and Mills2021). Reasons for childlessness among men are less associated with educational attainment. An American National Longitudinal Survey of Youth-based study identified four groups of childless men: early switchers, who adjusted their expectations at a younger age; mid-thirty switchers, who altered their plans in their mid-thirties; late or never switchers, who maintained or changed their expectations later in life; and men with unstable expectations, whose plans regarding parenthood fluctuated over time (Verweij & Keizer, Reference Verweij and Keizer2023). Unlike women, reasons for childlessness among men are more varied and take place at different timepoints in life: while some men may decide not to become fathers at an earlier age, others may be influenced by their partner’s fertility, their own infertility, or their own economic situation. Although the percentage of childless men in our study is higher compared to that of women, as previously reported in several populations (Fiori et al., Reference Fiori, Rinesi and Graham2017; Miettinen et al., Reference Miettinen, Rotkirch, Szalma, Donno and Tanturri2015), both childless individuals and parents contribute similarly to their genetic legacy through extended family networks. This parity is quite remarkable, considering the divergent paths and reasons leading to childlessness for men and women. It highlights that, irrespective of gender-specific patterns and influences, the genetic impact of childless individuals is similar for both men and women.
The calculation of genetic fitness presented in this study is a simplified model that primarily considers the average percentage of genes inherited by descendants. This approach does not account for hereditary diseases, socioeconomic factors, or other variables that could significantly affect genetic fitness in families. Importantly, the calculations are not based on genotyped data of the Norwegian population, which would provide a more precise understanding of genetic inheritance. Therefore, these numbers should be viewed as indicative averages, assuming all other factors are equal.
Contrary to the notion that childless individuals lack a stake in the future, our findings indicate that both childless individuals and parents contribute to their genetic and social legacies through their extended families. While the observed moderate deficit among childless individuals compared to parents is consistent with a small selection coefficient against childlessness, which aligns with the low heritability typical of fitness traits (Fisher, Reference Fisher1930), it does not overshadow the substantial societal roles played by childless individuals. This underscores an important point that is often neglected in scientific fields including demography, public health, and biology: the genetic contribution of childless individuals to the next generation is noteworthy and should not be overlooked.
Childless individuals contribute significantly to their families and communities, fostering strong genetic and cultural bonds through their relationships with siblings, cousins, nieces, and nephews. They also play key roles in mentorship, cultural preservation, and community engagement. Acknowledging the essential contributions of childless individuals in shaping our collective future is crucial, whether through indirect genetic lineage or active participation in extended family networks.
Sociocultural dynamics and family structures are complex and multifaceted, necessitating a comprehensive approach in research and policy. Future trends in fertility and childlessness might be influenced by advancing economic, social, and environmental shifts. Longitudinal and cross-cultural studies are needed to further unravel these dynamics. Additional research should explore the nongenetic contributions of childless individuals across various societies, such as their roles in mentorship, cultural preservation, community involvement, and emotional support.
Data availability statement
Data, code, and materials used in the analysis are available to researchers abroad by material transfer agreements with Statistics Norway-SSB the population census in Norway (Folkeregisteret).
Author contributions
Conceptualization: VFS, DK; Methodology: BB, VFS, CMP, DK; Formal analysis: BB, DK; Visualization: BB; Funding acquisition: VFS; Writing – original draft: VFS, DK; Writing – review & editing: BB, VFS, CMP, DK.
Financial support
National Institutes of Health grant U12AB123456 (PV, CHO); National Institutes of Health grant R01AB123456 (PV, GS); William K. Bowes Jr Foundation (PV); The Research Council of Norway, Centre of Excellence Grant no. 262700; National Institutes of Health-NIH, R01: R01AG069109; ERC Advanced Grant Project – 101142786 – HOMME.
Competing interests
None
Ethical standards
The authors assert that all procedures contributing to this work comply with the ethical standards of the relevant national and institutional committees on human experimentation and with the Helsinki Declaration of 1975, as revised in 2008.


 Open access