


Introduction
Waterhemp is one of the most common and troublesome weed species in corn and soybean production systems throughout the midwestern United States (Tranel et al. Reference Tranel, Riggins, Bell and Hager2011; Van Wychen Reference Van Wychen2022, Reference Van Wychen2023). Waterhemp has evolved resistance to herbicides from seven different sites of action (SOAs) (Heap Reference Heap2024). A population of waterhemp from Missouri demonstrated resistance to herbicides from six SOAs, limiting effective postemergence control options to only glufosinate and dicamba (Shergil Reference Shergill, Barlow, Bish and Bradley2018). Similarly, a comprehensive herbicide resistance screening of more than 80 waterhemp accessions from Wisconsin revealed glufosinate as the only herbicide providing complete control (>97% biomass reduction) of all accessions (Faleco et al. Reference Faleco, Oliveira, Arneson, Renz, Stoltenberg and Werle2022). Glufosinate is a broad-spectrum, nonselective, light-dependent herbicide with limited translocation that targets glutamine synthetase and is primarily effective on annual weed species (Dayan et al. Reference Dayan, Barker, Bough, Ortiz, Takano, Duke and Moo-Young2019; Steckel et al. Reference Steckel, Wax, Simmons and Phillips1997). However, its performance can vary in the field due to factors such as low humidity and temperature, time of day, and weed size (Coetzer et al. Reference Coetzer, Al-Khatib and Loughin2001; Kumaratilake and Preston Reference Kumaratilake and Preston2005; Martinson et al. Reference Martinson, Durgan, Gunsolus and Sothern2005; Tharp et al. Reference Tharp, Schabenberger and Kells1999). Glufosinate-resistant crops were rarely adopted before glyphosate-resistant weeds became widespread in glyphosate-based systems, even though both technologies were commercialized around the same time, and delayed adoption was likely due to glufosinate’s historically lower efficacy and consistency compared to glyphosate, as well as the limited availability of glufosinate-resistant soybean cultivars until 2020 (Takano and Dayan Reference Takano and Dayan2020). However, with the rising prevalence of multiple herbicide–resistant weeds, glufosinate’s role in weed management is now expanding (Takano and Dayan Reference Takano and Dayan2020; USGS 2018). Currently six instances of glufosinate resistance have been reported, with one of the six weeds being a broadleaf species, Palmer amaranth (Amaranthus palmeri) (Heap Reference Heap2024). Glufosinate should be used strategically to postpone further resistance evolution and to preserve it as a tool for effective broadleaf control.
Compelling evidence indicates that the rapid cell death in glufosinate-treated plants is mainly due to reactive oxygen species (ROS), which when produced in large quantities under light, cause severe lipid peroxidation of cell membranes leading to rapid phytotoxicity (Takano et al. Reference Takano, Beffa, Preston, Westra and Dayan2019, Reference Takano, Beffa, Preston, Westra and Dayan2020a). Herbicides that target protoporphyrinogen oxidase (PPO) lead to an accumulation of protoporphyrin IX, a compound that also produces ROS when exposed to light (Dayan et al. Reference Dayan, Barker, Bough, Ortiz, Takano, Duke and Moo-Young2019). Combinations of glufosinate and PPO-inhibitor herbicides may be more advantageous in terms of weed control when compared to individual applications of these herbicides, because of the simultaneous inhibition of glutamine synthetase and PPO, leading to elevated accumulation of protoporphyrin IX and the concomitant accumulation of ROS (Takano et al Reference Takano, Beffa, Preston, Westra and Dayan2020a). Mixtures may also alleviate environmental effects on glufosinate performance (Takano et al. Reference Takano, Beffa, Preston, Westra and Dayan2020b). Takano et al. (Reference Takano, Beffa, Preston, Westra and Dayan2020b) reported a synergistic effect in controlling Palmer amaranth and kochia [Bassia scoparia (L.) A.J. Scott] when a half rate of glufosinate (280 g ha−1) was mixed with an extremely low dose of saflufenacil (1 g ha−1). However, the utility of this mixture for postemergence weed control is limited because it caused >60% injury to both susceptible and glufosinate-resistant soybean and did not increase control of PPO inhibitor–resistant waterhemp. The strong synergistic effect initially observed on Palmer amaranth varied based on weed species treated, herbicide dosages, and PPO inhibitors tested (Takano et al. Reference Takano, Beffa, Preston, Westra and Dayan2020b). For example, when flumioxazin, pyraflufen, lactofen, or fomesafen were mixed with glufosinate and applied to kochia, the synergistic effect was less than what was observed with saflufenacil (Takano et al. Reference Takano, Beffa, Preston, Westra and Dayan2020b). The elevated soybean injury observed following postemergence applications of glufosinate + saflufenacil mixtures may portend increased soybean injury with mixtures of glufosinate with other PPO-inhibitor herbicides (Belfry et al. Reference Belfry, Shropshire and Sikkema2016; Takano et al. Reference Takano, Beffa, Preston, Westra and Dayan2020b) and slow the development of canopy formation (Priess et al. Reference Priess, Norsworthy, Roberts and Gbur2020). This may discourage use of PPO-inhibitor chemistry when it may otherwise be a valuable part of an herbicide-resistance mitigation strategy.
Another potential glufosinate mix partner is 2,4-D (categorized as a Group 4 herbicide by the Weed Science Society of America [WSSA]). Craigmyle et al. (Reference Craigmyle, Ellis and Bradley2013) indicated that addition of 2,4-D to either or both postemergence applications of glufosinate provided better waterhemp control compared to two postemergence applications of glufosinate alone. Furthermore, Joseph et al. (Reference Joseph, Marshall and Sanders2018) reported an increased spectrum in control of sicklepod [Senna obtusifolia (L.) H.S. Irwin & Barneby], pitted morningglory (Ipomoea lacunosa L.), and Palmer amaranth when glufosinate was mixed with either 2,4-D or dicamba, compared to herbicides applied alone. Lanclos et al. (Reference Lanclos, Webster and Zhang2002) reported a synergistic effect for control of spreading dayflower (Commelina diffusa Burm. f.) when glufosinate was mixed with propanil (WSSA Group 5, a photosystem II inhibitor), which also leads to accumulation of ROS. In contrast, acetyl-CoA carboxylase inhibitors and glyphosate have not always increased glufosinate control of some grass and broadleaf weed species (Besançon et al. Reference Besançon, Penner and Everman2018; Burke et al. Reference Burke, Askew, Corbett and Wilcut2005), warranting further investigation of the most effective partners with glufosinate to improve postemergence weed control in soybean production.
The proportion of herbicide-resistant weeds in the field will rapidly increase with repeated use of the same herbicide SOA (Beckie Reference Beckie2006). The strategic use of both preemergence and postemergence herbicide mixtures containing multiple effective SOAs is crucial to delaying herbicide resistance, preserving the effectiveness of new herbicide-resistant crops, and ensuring the long-term economic sustainability of agriculture (Norsworthy et al. Reference Norsworthy, Ward, Shaw, Llewellyn, Nichols, Webster, Bradley, Frisvold, Powles, Burgos and Witt2012). The combination of glufosinate with PPO inhibitors and other alternative herbicide SOAs (i.e., Group 4 or Group 6) is one research area that requires additional studies to understand their interactions and effect on weed control and crop injury (Takano et al. Reference Takano, Beffa, Preston, Westra and Dayan2020b). Our objectives were to measure the efficacy of glufosinate applied alone and mixed with other active ingredients on 1) waterhemp control and 2) soybean injury and yield.
Materials and Methods
Two separate field experiments were conducted in Illinois and Wisconsin to investigate glufosinate combinations with various herbicides on soybean phytotoxicity and yield (hereafter referred to as the crop response study), and waterhemp control (hereafter referred to as the waterhemp response study). The crop response study was conducted in 2020 and 2021 in Macomb, IL (40.4900°N, 90.6888°W), and in 2020 and 2021 at the Arlington Agricultural Research Station in Arlington, WI (43.3034°N, 89.3455°W), and the Rock County Research farm in Janesville, WI (42.7262°N, 89.0235°W), in fields with a known history of low weed infestation and no waterhemp presence (R.P. DeWerff and M.L. Bernards personal observations). The waterhemp response study was conducted in 2021 at a site in Macomb, IL (40.4795°N, 90.7208°W), and in 2020 and 2021 at the Lancaster Agricultural Research Station in Lancaster, WI (42.8313°N, 90.7880°W), and the O’Brien Family Farm near Brooklyn, WI (42.8768°N, 89.3980°W), in fields that were naturally infested with waterhemp. Experiments were established in a randomized complete block design with four replications, using experimental units that measured 3 m wide by 9.1 m long with four soybean rows planted 76 cm apart. Both studies included a preemergence herbicide–nontreated control (receiving only postemergence herbicides), while only the waterhemp response study contained a complete nontreated control (no preemergence or postemergence herbicides). In contrast, the whole-crop response study was maintained weed-free throughout the season. A more effective preemergence herbicide combination, flumioxazin + pyroxasulfone (70.4 and 89.3 g ai ha−1, respectively [Fierce; Nufarm, Morrisville, NC]), was applied at soybean planting for the crop response study to aid in weed-free maintenance during the growing season, such that any measured effects on soybean development and yield resulted solely from the effect of a postemergence herbicide treatments. In the waterhemp response study, a preemergence application of flumioxazin alone (112 g ai ha−1, Valor; Valent, San Ramon, CA) was made to all treatments at soybean planting, except for the nontreated control. The postemergence herbicide treatments were identical across both studies (Table 1). postemergence herbicide treatments were applied using a CO2-pressurized backpack sprayer, equipped with AIXR11015 spray nozzles (TeeJet Technologies, Glendale Heights, IL) on a 2.54-m-wide spray boom, calibrated to deliver 140 L ha−1 of carrier volume. Weather information for the soybean growing season at each location is presented in Table 2. Soil characteristics, soybean variety and planting dates, and soybean growth and waterhemp density and height at postemergence herbicide application for all experimental locations are displayed in Table 3.
Table 1. Postemergence herbicide treatments used in both field experiments, along with herbicide group numbers, active ingredients, and their application rates.a–c
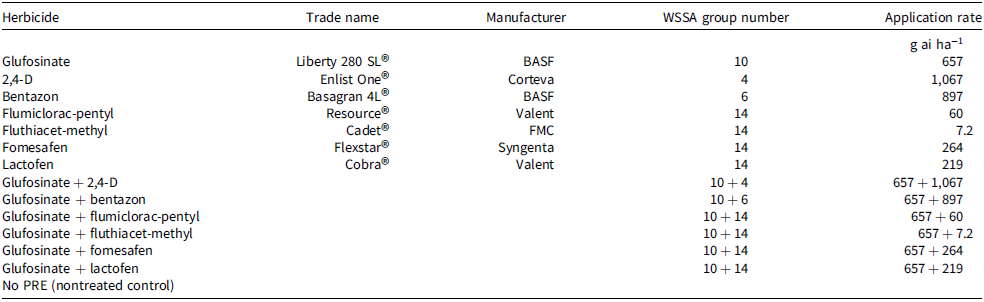
a Abbreviations: POST, postemergence; PRE, preemergence; WSSA, Weed Science Society of America.
b Herbicides in WSSA Group 14 (protoporphyrinogen inhibitor) and Group 6 (photosystem II inhibitor) applied solely were combined with a crop oil concentrate (10 mL L−1; CHS Agronomy Inc., Willmar, MN) as a surfactant, while mixes with glufosinate excluded a crop oil concentrate. Ammonium-sulfate (2,243 g ha−1) was added to all herbicide treatments.
c Both studies included a nontreated control (No PRE). However, only the waterhemp response study had a true weedy nontreated control (No PRE nor a POST herbicide application). In contrast, the whole-crop response study was maintained weed-free throughout the season.
Table 2. Monthly average air temperature and precipitation for experimental sites in 2020 and 2021 growing seasons.a,b
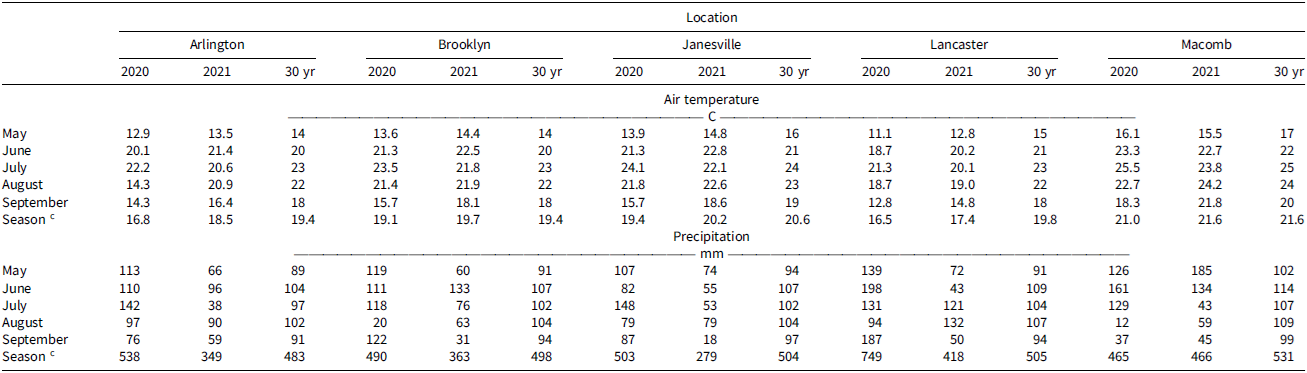
a Air, soil, and rainfall data were collected with WatchDog 2000 Series ground weather stations from an Enviro-weather station.
b Thirty-year air temperature and precipitation averages for the period 1991 to 2021 were obtained with R statistical software (v. 4.4.1) using daily Daymet weather data for 1-km grids (Correndo et al. Reference Correndo, MoroRosso and Ciampitti2021; Thornton et al. Reference Thornton, Thornton, Mayer, Wei, Devarakonda, Vose and Cook2016; daymetr package).
c Cumulative precipitation and average monthly temperature throughout the growing season.
Table 3. Information for each experimental location covering soybean variety and its planting date, herbicide application dates, herbicide application dates, soybean growth stages, the height and density of waterhemp, and soil information.a,b
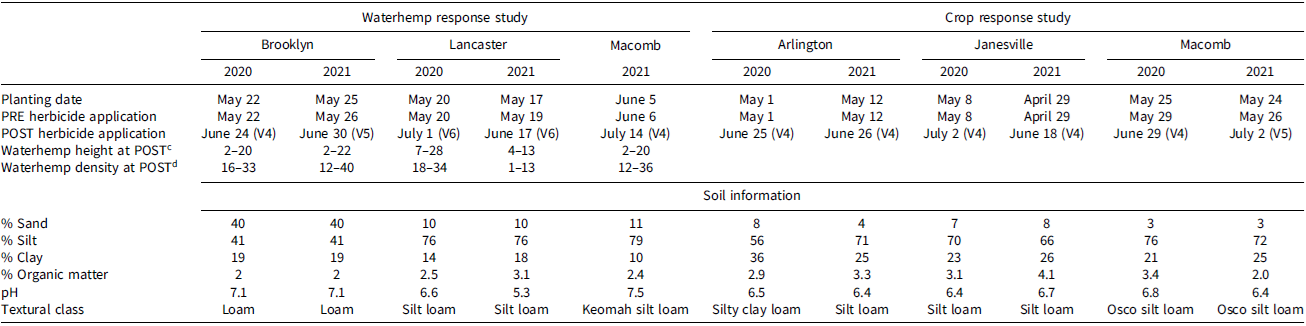
a Abbreviations: POST, postemergence; PRE, preemergence; V4, V5, and V6 refer to soybean growth stage.
b Soybean P22T86E was planted in Wisconsin in 2020 and 2021. Syngenta S33E3 was planted in 2020, and NuTech 35NO3E was planted in 2021 in Illinois.
c Waterhemp height at the time of POST herbicide application is measured in centimeters and shown as a range.
d Waterhemp density at the time of POST herbicide application is measured in square meters (m−2) and shown as a range.
Soybean Phytotoxicity and Soybean Green Cover
A visual evaluation of soybean phytotoxicity in the crop response study was made 14 DAT on a scale from 0% to 100%, where 0% represented no injury and 100% represented plant death. The most common symptoms observed were necrosis (bronzing) and stunting of soybean growth. A digital estimation of soybean canopy development was conducted to estimate soybean green cover percentage, also at 14 DAT. Three photographs, each capturing approximately 1.7 m of row of both the second and third row, were taken in each plot. A wooden L-shaped pole measuring 1.93 m in height was used to support a GoPro Hero 8 Black camera (GoPro Inc., San Mateo, CA) above soybean canopy, which was paired with an iPhone 6s (Apple Inc., Cupertino, CA) via the GoPro Quik app and used as an electronic viewfinder for the camera. Resolution of the images captured with GoPro 8 Hero Black camera was 4,000 × 3,000 pixels (aspect ratio 4:3), with linear distortion setting. The images were processed using the Canopeo add-on (Canopeo software [https://canopeoapp.com/] was developed by staff and researchers in Oklahoma State University’s Division of Agricultural Sciences and Natural Resources Soil Physics Program) with MATLAB software (MathWorks, Natick, MA). This allowed for the estimation of fractional soybean green cover within each image and served as a proxy of herbicide-induced crop injury, where a higher green cover percentage indicated lower soybean injury (Arsenijevic et al. Reference Arsenijevic, de Avellar, Butts, Arneson and Werle2021; Liang et al. Reference Liang, Ma, Xie, Zhou and Wang2012; Paruelo et al. Reference Paruelo, Lauenroth and Roset2000; Patrignani and Ochsner Reference Patrignani and Ochsner2015).
Visual Assessment of Waterhemp Control and Biomass Collection
In the waterhemp control study a visual estimate of waterhemp control was made 14 DAT, using a scale ranging from 0% to 100%, where 0% represented no control, and 100% represented complete control of all waterhemp. Waterhemp biomass was collected at 14 DAT by harvesting all waterhemp plants within two 0.25-m2 quadrats in each plot. Harvested plants were dried to a constant weight at 60 C, and waterhemp biomass reduction was compared with that of the nontreated control was calculated using Equation 1:
 $$R=100 - \left( {{{H}\over{C}}{\rm{*}}100} \right)$$
where biomass reduction (R) was estimated by comparing the dry biomass of a treated plot (H) to the average dry biomass of the nontreated control (C).
Soybean Yield
At crop maturity, the center two rows of each experimental plot were mechanically harvested using a plot combine for both studies. The soybean yield data obtained were adjusted to 13% moisture content and are presented in kilograms per hectare (kg ha−1).
Statistical Analyses
All response variables (waterhemp response study: visual assessment of waterhemp control [%], waterhemp biomass reduction [%], soybean yield [kg ha−1]; crop response study: soybean phytotoxicity [%], soybean green cover [%], and soybean yield [kg ha−1]) were analyzed using R Statistical Software (v. 4.4.1; R Core Team 2021). Data were pooled across site-years (year and location were treated as random factors). Herbicide treatment was the main effect, and replications nested within site-years were treated as random effects.
A generalized linear mixed model with Template Model Builder with beta distribution and logit link (glmmTMB package, v. 1.1.9) (Brooks et al, Reference Brooks, Kristensen, Van Benthem, Magnusson, Berg, Nielsen, Skaug, Machler and Bolker2017) was fit to soybean injury, soybean green cover percentage, visual assessment of waterhemp control, and waterhemp biomass reduction. A Pearson chi-square test (using the nortest package, v. 1.0-4) and Levene’s test (with the car package, v. 3.1-2) were used to check normality and homogeneity of variance, respectively. Response variables were logit-transformed to improve normality assumptions (Barnes et al. Reference Barnes, Knezevic, Lawrence, Irmak, Rodriguez and Jhala2020; Davies et al. Reference Davies, Hull, Moss and Neve2019; Striegel et al. Reference Striegel, Eskridge, Lawrence, Knezevic, Kruger, Proctor, Hein and Jhala2020). The analysis of variance type II Wald chi-square test was performed followed by Tukey’s honestly significant difference (HSD) test (α = 0.05) and pairwise comparisons using the emmeans package (v. 1.10.3). Back transformed means are presented for ease of result interpretation.
A linear mixed model with a normal distribution using the lme4 package (v. 1.1-35.5) was fit to soybean yield data. To better meet the normality and variance homogeneity assumptions, response variables were square root–transformed. When ANOVA results indicated a significant herbicide effect, means were compared using Tukey’s HSD test (α = 0.05). Means were separated when herbicide treatment effect was less than P = 0.05 using Tukey’s HSD test. Back-transformed means are presented for ease of interpretation.
To assess the relationship between soybean visual injury and soybean green cover (Canopeo data), a linear mixed-effects model was used (lme4 package). Soybean visual injury was the response variable, soybean green cover was the fixed effect, and replications were nested within site-years. The model was fit using maximum likelihood estimation. Predicted soybean visual injury values were calculated based on the fitted model. A simple linear regression was conducted and the predicted soybean visual injury was calculated. The goodness-of-fit of the models was assessed using the R-squared statistic (piecewiseSEM package), which represents the proportion of variance in phytotoxicity that can be explained by the models (marginal and conditional R 2). The relationship between soybean visual injury and soybean green cover was calculated according to Equation 2:
 $$V = {\beta _0} + {\beta _1} \times {\rm{C}} + r + \varepsilon $$
where V = visual injury (dependent variable); β 0 = intercept; β 1 = slope for soybean green cover (independent variable); C = green cover; r = random effect of site-year nested within rep; ϵ = error term.
Results and Discussion
Crop Response Study
Soybean Visible Phytotoxicity and Soybean Green Cover
The main effect of herbicide treatment was significant for visual soybean phytotoxicity and green cover (P < 0.05). Greater visible phytotoxicity indicates more severe soybean herbicide injury, while greater green cover suggests less herbicide injury. Herbicide treatments that caused the greatest soybean injury (27%) were lactofen and glufosinate + lactofen (Table 4). All PPO-inhibitor herbicides and PPO inhibitor + glufosinate mixtures caused greater than 10% injury (Table 4). Glufosinate, 2,4-D, and bentazon caused less than 5% soybean injury (Table 4).
Table 4. Soybean visible phytotoxicity and green cover (Canopeo) 14 d after treatment, and soybean final yield for crop response (weed-free) study.a–e
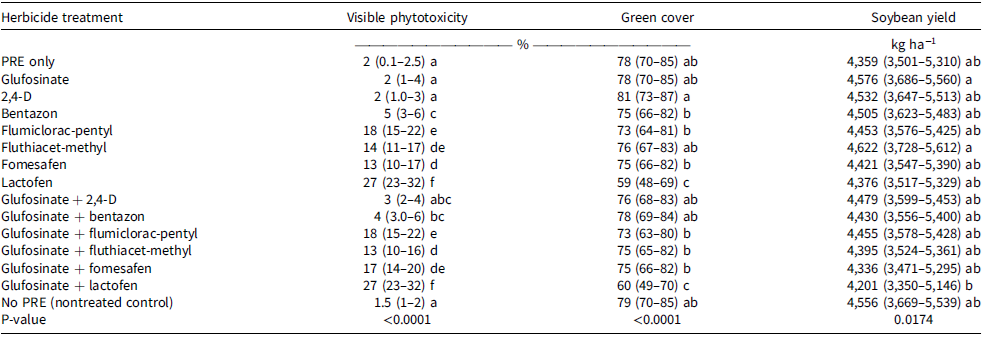
a Abbreviation: PRE, preemergence.
b Means with the same letters are not statistically different from each other according to Tukey’s honestly significant difference test (α = 0.05).
c Information presented in parentheses refers to 95% confidence intervals.
d The data presented in the table are from experimental locations in Wisconsin and Illinois during 2020 and 2021.
e Green cover refers to Canopeo data (see text).
Soybean green cover was reduced 25% by lactofen and glufosinate + lactofen when compared with the nontreated control (Table 4). Soybean is susceptible to injury from PPO inhibitors, particularly under hot and humid conditions following herbicide application (Sarangi and Jhala Reference Sarangi and Jhala2015; Whitaker et al. Reference Whitaker, York, Jordan and Culpepper2010). This injury could hinder the development of the soybean canopy (Nelson and Renner Reference Nelson and Renner2001). Differential soybean tolerance to some of the PPO-inhibitor herbicides has been reported as (least injurious to most injurious): fomesafen < acifluorfen < lactofen (Harris et al. Reference Harris, Gossett, Murphy and Toler1991). The recovery of soybean from injury that delays canopy formation depends on factors such as planting date, soybean phenology, maturity group, growth habit, and soil moisture availability (Priess et al. Reference Priess, Norsworthy, Roberts and Gbur2020). However, even when these herbicides (fomesafen, acifluorfen, lactofen) were applied to soybean at several rates between growth stages V1 and V5 and caused up to 20% of foliar injury, there was no yield loss at the end of the season (Beam et al. Reference Beam, Flessner and Pittman2018; Kapusta et al. Reference Kapusta, Jackson and Mason1986; Riley and Bradley Reference Riley and Bradley2014; Wichert and Talber Reference Wichert and Talbert1993; Young et al. Reference Young, Young, Matthews, Owen, Zelaya, Hartzler, Wax, Rorem and Bollero2003).
Relationship Between Soybean Green Cover and Visible Soybean Injury
Our analysis revealed a negative correlation between soybean green cover (the Canopeo data) and visual injury (Figure 1). This negative correlation is intuitive; as visual injury increases soybean green cover decreases, which is reflected by the downward slope of the regression line. The marginal R 2 value was 0.51, indicating that soybean green cover alone accounted for approximately 51% of the observed variation in soybean visible injury. The remaining 26% of the variation (yielding a conditional R 2 value of 0.77) was attributed to differences across site-years.
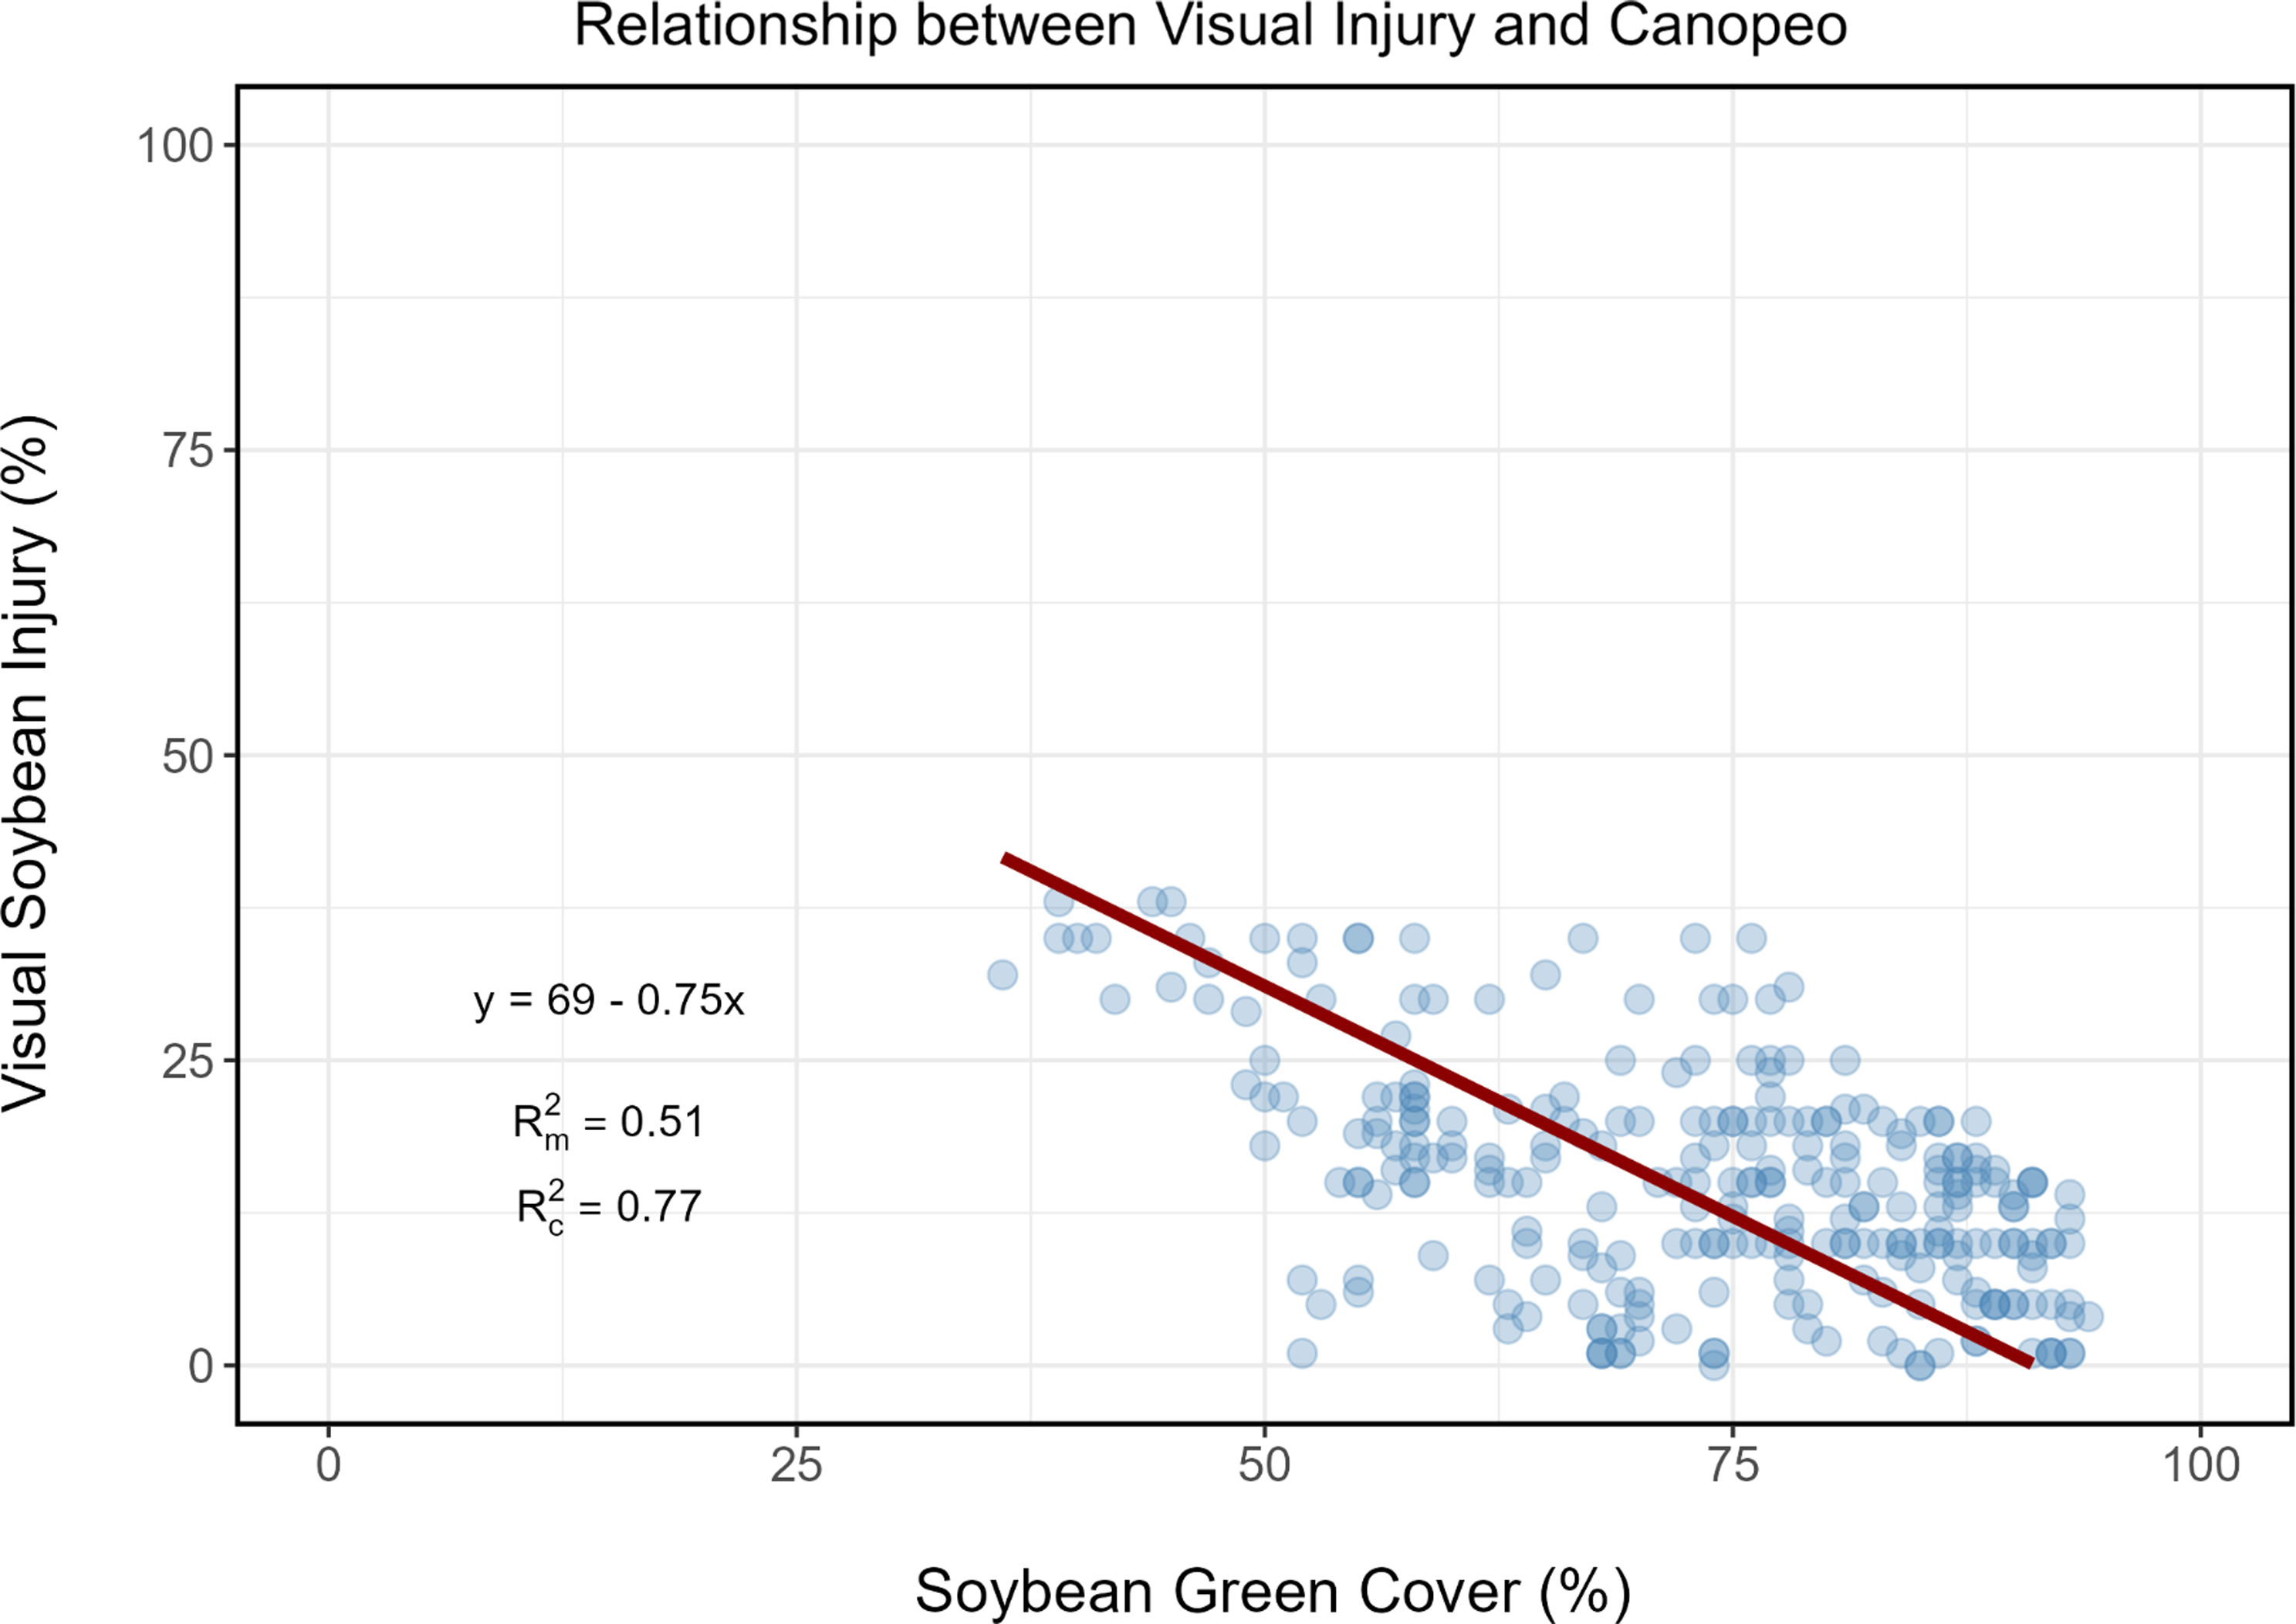
Figure 1. Relationship between visual soybean injury and soybean green cover (Canopeo data). R2m signifies that site-year as a random effect is not considered (marginal); R2c signifies that site-year as a random effect is considered (conditional).
Soybean Yield
The main effect of herbicide treatment was significant for soybean yield (P < 0.05; Table 4). However, no herbicide treatment was different when compared to the no-preemergence (nontreated) and preemergence-only treatments. When herbicides are applied within labeled rates early in the season, soybean injury is generally transitory with minimal impact on grain yield (Beam et al. Reference Beam, Flessner and Pittman2018; Kapusta et al. Reference Kapusta, Jackson and Mason1986; Riley and Bradley Reference Riley and Bradley2014; Wichert and Talber Reference Wichert and Talbert1993; Young et al. Reference Young, Young, Matthews, Owen, Zelaya, Hartzler, Wax, Rorem and Bollero2003). However, Priess et al. (Reference Priess, Norsworthy, Roberts and Gbur2020) found that soybean injured when herbicide was applied at the V2 stage exhibited slower canopy formation. Delaying application of injurious herbicides until near the flowering stage or when moisture availability limits canopy growth may have more lasting negative effects because grain yield is linked to the canopy present at the onset of reproductive development (Edwards and Purcell, Reference Edwards and Purcell2005). PPO-inhibitor herbicides should be applied early enough to allow the crop to reach full canopy closure, which is crucial for end-of-season weed suppression and maximizing soybean yield (Arsenijevic et al. Reference Arsenijevic, DeWerff, Conley, Ruark and Werle2022; Edwards and Purcell Reference Edwards and Purcell2005; Jha and Norsworthy Reference Jha and Norsworthy2009).
Waterhemp Response Study
Visual Assessment of Waterhemp Control and Dry Biomass at 14 DAT
The main effect of herbicide treatment was significant for visual assessment of waterhemp control and dry biomass reduction (P < 0.05; Table 5). All glufosinate mixtures provided ≥88% control of waterhemp, equal to glufosinate applied solo (90%). In addition, 2,4-D, fomesafen, and lactofen applied alone provided ≥88% control (Table 5). Flumiclorac-pentyl (73%) and fluthiacet-methyl (71%) applied individually showed limited activity on waterhemp and were similar to the preemergence-only flumioxazin treatment (60%). Bentazon applied alone (54%) showed the lowest control of waterhemp.
Table 5. Visible assessment of waterhemp control and waterhemp dry biomass reduction 14 d after treatment, and soybean final yield for the waterhemp response study.a–d
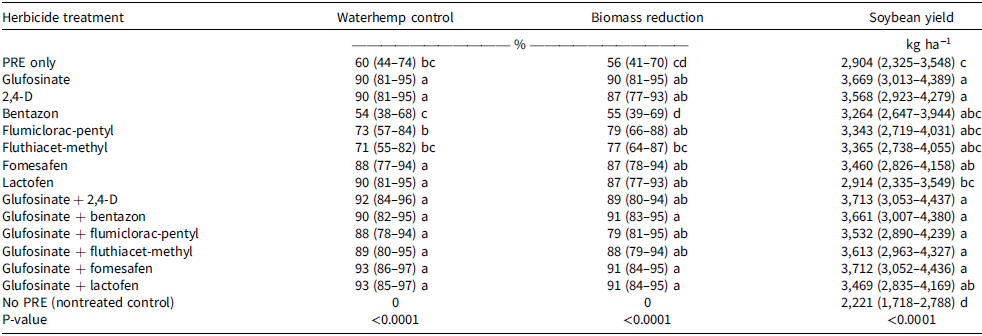
a Abbreviation: PRE, preemergence.
b Means with the same letters are not statistically different from each other according to Tukey’s honestly significant difference test (α = 0.05).
c Information presented in parentheses refers to 95% confidence intervals.
d The data presented in the table are from experimental locations in Wisconsin during 2020 and 2021, and from experimental location in Illinois in 2021.
Waterhemp biomass reduction measurements generally paralleled the visual assessments of waterhemp control results (Table 5). Effective control was defined as herbicide treatments achieving an efficacy of ≥90% (Arneson et al. Reference Arneson, Smith, DeWerff, Oliveira and Werle2020; Etheridge et al. Reference Etheridge, Hart, Hayes and Mueller2001; Werle et al. Reference Werle, DeWerff, Mobli and Arneson2023). Three treatments resulted in 91% waterhemp biomass reduction: glufosinate + fomesafen, glufosinate + lactofen, and glufosinate + bentazon. Glufosinate applied alone was the only single active ingredient treatment that resulted ≥90% waterhemp biomass reduction. However, the only postemergence treatment to provide less waterhemp biomass reduction than glufosinate applied alone was bentazon applied alone, which provided no biomass reduction (55%; Table 5), similar to the preemergence-only treatment (56%; Table 5).
Although glufosinate, 2,4-D, fomesafen, and lactofen applied individually resulted in high levels of waterhemp control in this study, repeated use of single SOA herbicides increases the risk of herbicide resistance evolution (Norsworthy et al. Reference Norsworthy, Ward, Shaw, Llewellyn, Nichols, Webster, Bradley, Frisvold, Powles, Burgos and Witt2012). In bareground trials conducted in Wisconsin, Werle et al. (Reference Werle, DeWerff, Mobli and Arneson2023) reported that 2,4-D, dicamba, lactofen, and fomesafen applied alone provided variable waterhemp control (74% to 87%). The absence of crop competition in these systems likely contributed to the inability of any solo herbicide treatment to achieve the ≥90% control threshold for an excellent rating in University of Wisconsin–Madison Extension guidelines (Arneson et al. Reference Arneson, Smith, DeWerff, Oliveira and Werle2020). These results highlight both the inherent limitations of bareground systems (lacking crop-weed competition) and the practical need for mixtures to achieve commercially acceptable waterhemp control in production fields.
Takano and Dayan (Reference Takano and Dayan2020) reported that mixing glufosinate and PPO inhibitors enhanced the herbicidal activity, although other reports showed that the degree of enhancement varied depending on the weed species, herbicide dosage, and the PPO-inhibitor herbicide being evaluated (Takano et al. Reference Takano, Beffa, Preston, Westra and Dayan2020b). However, in our experiment, the herbicide combinations did not increase waterhemp control compared to glufosinate alone (Table 5). We used labeled rates of both glufosinate and the mix partners, which is encouraged to reduce the risk of herbicide-resistance evolution (Norsworthy et al. Reference Norsworthy, Ward, Shaw, Llewellyn, Nichols, Webster, Bradley, Frisvold, Powles, Burgos and Witt2012). postemergence applications of glufosinate mixtures, specifically with PPO inhibitors in XtendFlex® (Bayer Cropscience, St. Louis, MO) soybean or with 2,4-D in Enlist E3® (Corteva Agriscience, Indianapolis, IN) soybean, may provide an effective herbicide resistance management strategy when combined with effective preemergence herbicides. Furthermore, other glufosinate-resistant platforms such as LibertyLink® GT27 (MS TechnologiesTM, West Point, IA; BASF Corporation, Research Triangle Park, NC) soybean, confers additional tolerance to glyphosate and isoxaflutole, enabling preemergence isoxaflutole applications for enhanced waterhemp control (Craigmyle et al. Reference Craigmyle, Ellis and Bradley2013; Hay et al. Reference Hay, Dille and Peterson2019; Merchant et al. Reference Merchant, Sosnoskie, Culpepper, Steckel, York, Braxton and Ford2013; Smith et al. Reference Smith, Soltani, Kaastra, Hooker, Robinson and Sikkema2019). Annual rotation of herbicide SOAs and trait technologies provides optimal resistance mitigation.
Soybean Yield
The main effect of herbicide treatment was significant for soybean yield in the waterhemp response study (P < 0.05; Table 5). All herbicide treatments yielded more than the no-preemergence nontreated control (Table 5), with yield increases (yield-protection) of 31% to 67%. Postemergence-applied mixture treatments with glufosinate yielded 19% to 28% more than the preemergence-only check. Yield from plots treated individually with bentazon, flumiclorac-pentyl, and fluthiacet-methyl was not greater than preemergence-only plots (Table 5), presumably because competition from the surviving waterhemp was similar to the plot that received a preemergence-only application (Table 4). Both weed presence and herbicide injury may influence soybean yield. When glufosinate and 2,4-D were applied individually, yields were 26% and 23% greater, respectively, than yield from the preemergence-only treatment. However, when lactofen was applied alone, waterhemp control was equivalent to that of glufosinate and 2,4-D, but soybean yields were >18% lower (Table 5). In contrast, glufosinate + lactofen, which caused similar injury to lactofen applied alone (Table 4), did not reduce yield, and provided similar waterhemp control (Table 5). Fomesafen applied alone, which was less injurious to soybean than lactofen in the crop response study (Table 4), nor did it reduce yields in the waterhemp response study compared to glufosinate applications (Table 5). These data confirm that postemergence herbicide applications are critical to protect soybean yield, and that both weed control and crop safety may affect soybean yield.
Soybean yield loss from weeds is typically of greater importance than potential injury from herbicides (Young et al. Reference Young, Young, Matthews, Owen, Zelaya, Hartzler, Wax, Rorem and Bollero2003), and an application of postemergence herbicides with multiple effective SOAs is likely beneficial to delaying the evolution of herbicide resistance (Norsworthy et al. Reference Norsworthy, Ward, Shaw, Llewellyn, Nichols, Webster, Bradley, Frisvold, Powles, Burgos and Witt2012). Among the PPO inhibitor + glufosinate mixtures we tested, fomesafen presented an acceptable balance of crop safety and effective waterhemp control. Although fomesafen has been less injurious to soybean than lactofen, its weed control efficacy has not always exceeded 90% (Ellis and Griffin Reference Ellis and Griffiin2003; Hager et al. Reference Hager, Wax, Bollero and Stoller2003; Harris et al. Reference Harris, Gossett, Murphy and Toler1991; Higgins et al. Reference Higgins, Whitwell, Murdock and Toler1988; Johnson et al. Reference Johnson, Bailey, Wilson, Holshouser, Herbert and Hines2002). In our research, glufosinate + fomesafen provided 93% waterhemp control and reduced waterhemp biomass by 91%, while causing less crop injury (Table 4) and protecting yield potential (4,336 kg ha−1 [crop response study], Table 4; 3,712 kg ha−1 [waterhemp response study], Table 5). In addition, fomesafen can provide soil residual control of waterhemp for several weeks after its application (Oliveira et al. Reference Oliveira, Feist, Eskelsen, Scott and Knezevic2017).
Soybean growers, particularly those who cultivate glufosinate-resistant Enlist E3 varieties, may prefer using herbicide mixtures with 2,4-D to reduce crop injury and ensure adequate weed control, and 2,4-D has long been considered a low-risk herbicide for resistance evolution (Torra et al. Reference Torra, Alcántara-de la Cruz, de Figueiredo, Gaines, Jugulam, Merotto, Palma-Bautista, Rojano-Delgado and Riechers2024). However, resistance to 2,4-D is increasing in waterhemp populations across the Midwest (Bernards et al. Reference Bernards, Crespo, Kruger, Gaussoin and Tranel2012; Evans et al. Reference Evans, Strom, Riechers, Davis, Tranel and Hager2019; Faleco et al. Reference Faleco, Machado, Bobadilla, Tranel, Stoltenberg and Werle2024; Heap Reference Heap2024; Shergill et al. Reference Shergill, Barlow, Bish and Bradley2018). Resistance to 2,4-D by weeds is typically a single-gene trait and confers elevated 2,4-D detoxification using cytochrome P450 monooxygenases or glycosyltranferases (Torra et al. Reference Torra, Alcántara-de la Cruz, de Figueiredo, Gaines, Jugulam, Merotto, Palma-Bautista, Rojano-Delgado and Riechers2024). Weeds metabolize 2,4-D more rapidly at higher temperatures, which may be problematic when it is mixed with glufosinate because glufosinate performs best under high temperature and humidity conditions (Coetzer et al. Reference Coetzer, Al-Khatib and Loughin2001). While PPO inhibitor-resistant waterhemp populations (Heap Reference Heap2024) with target-site mutations (Barker et al. Reference Barker, Pawlak, Duke, Beffa, Tranel, Wuerffel, Young, Porri, Liebl, Aponte, Findley, Betz, Lerchl, Culpepper, Bradley and Dayan2023; Lillie et al. Reference Lillie, Giacomini and Tranel2020; Shoup et al. Reference Shoup, Al-Khatib and Peterson2003) may still show some susceptibility to soil-applied PPO inhibitors, the duration and level of control are typically reduced compared to populations that have been confirmed to be susceptible (Lillie et al., Reference Lillie, Giacomini and Tranel2020). Agrichemical and seed companies are developing new soybean stacked traits that will alleviate injury caused by PPO-inhibitor herbicides, and new PPO-inhibitor herbicides are being developed that are expected to provide improved weed control (Prade Reference Prade2022).
It is crucial to preserve the efficacy of glufosinate, 2,4-D, and PPO-inhibitor herbicides as essential tools for effective weed management in soybean production, especially given the rise of genetically modified crops that are resistant to multiple herbicides and the increasing prevalence of herbicide-resistant weed populations (Takano and Dayan Reference Takano and Dayan2020). Although resistance to glufosinate has not yet become widespread, implementing proactive and diverse management strategies now is essential to maintaining the herbicide’s long-term effectiveness and mitigating the further evolution of multiple herbicide resistance (Takano and Dayan Reference Takano and Dayan2020). One step is by applying them only with effective mix partners in diversified preemergence-postemergence herbicide programs. A second step is to employ practices that enhance soybean competitiveness such as early planting, narrow row spacing, and well-timed termination of cover crops to aid in weed suppression. A third step is by integrating diversified management approaches, including conservation practices such as cover cropping for increased weed suppression, crop rotation and diversification, mechanical cultivation where feasible, and by implementing innovative technologies such as targeted herbicide application technologies and weed seed destruction. This multi-tactic approach could help eliminate viable weed seed return to the soil and interrupt the perpetuation of resistant alleles.
Practical Implications
Mixing glufosinate with PPO-inhibitor herbicides, 2,4-D, or bentazon is unlikely to cause injury that will result in yield loss when they are applied before the V6 soybean growth stage. However, caution is recommended when it comes to lactofen, which showed the highest potential for soybean injury in this study. Although these mixtures may not consistently enhance waterhemp control compared to glufosinate alone, they offer an important benefit for herbicide resistance management. By incorporating additional SOAs, such mixtures help reduce selection pressure, an important strategy for delaying the evolution of herbicide resistance in waterhemp and other challenging weed species. Bentazon, flumiclorac-pentyl, and fluthiacet-methyl do not provide commercially acceptable waterhemp control. Fomesafen, lactofen, and 2,4-D all provided good waterhemp control in individual applications (>88%) and are effective partners for glufosinate. Less soybean injury occurred with 2,4-D than any PPO-inhibitor herbicide, and mixtures with glufosinate provided effective waterhemp control. Mixing the herbicides evaluated in this study with glufosinate may help protect against yield loss from weed competition compared to applying those herbicides alone. Our findings also suggest that including glufosinate as part of a preemergence-postemergence herbicide program can improve waterhemp control under the conditions evaluated herein.
Acknowledgments
We thank Rachel Renz, Frank Lazar, and Matt Humbert, undergraduate students in the Wisconsin Cropping Systems Laboratory, for their assistance with data collection. We also thank Kinsey Tiemann, Laine Crawford, Nathan Stufflebeam, Luke Bergschneider, Christian Reiner, Stephanie Reiter, and Dustin Steinkamp, undergraduate students at Western Illinois University, for their assistance with herbicide mixing, application, and treatment data collection. We are especially grateful to Brent Heaton for his efforts in conducting the trials at the Illinois experimental locations.
Funding
This research was partially funded by the Wisconsin Soybean Marketing Board.
Competing interests
The authors declare they have no competing interests.


 Open access