


Introduction
The weed community in Argentina’s agricultural systems has undergone remarkable transformations, driven primarily by changes in tillage practices (Oreja et al. Reference Oreja, Vera, Kruk, Fuente and Scursoni2024) and the near-exclusive reliance on herbicides as the sole weed control method (Shaner Reference Shaner2014). These shifts have favored a select group of species, particularly those capable of adapting to these new conditions (Satorre et al. Reference Satorre, de la Fuente, Mas, Suárez, Kruk, Guglielmini and Verdú2020). Among the weeds that have thrived under such circumstances, the genus Echinochloa is notable for its rapid growth, high seed production with varying levels of dormancy, and adaptability to diverse environments (Shabbir et al. Reference Shabbir, Chauhan and Walsh2019).
Within this genus, junglerice stands out owing to its fast growth rate and significant dry matter accumulation during early stages, enhancing its competitive ability and adaptation to agricultural systems (Vulchi et al. Reference Vulchi, Guan, Clark and Brim-DeForest2024). Intensive herbicide use facilitates the selection of resistant individuals, exerting pressure on heterogeneous populations where susceptible and resistant individuals coexist (Asaduzzaman et al. Reference Asaduzzaman, Koetz, Wu, Hopwood and Shephard2021). The proportions of susceptible and resistant individuals within these populations are dynamic and can shift depending on the ability of each biotype to produce propagules and replenish the soil seedbank. Resistance mechanisms may also impose a fitness cost, potentially resulting in lower fitness for resistant individuals in the absence of herbicide selection pressure (Damalas and Koutroubas Reference Damalas and Koutroubas2024).
Analyzing the fitness of these biotypes is crucial for understanding the evolution of resistance within a population (Chauhan et al. Reference Chauhan, Kaur and Salgotra2022). Assessing fitness under herbicide-free conditions allows researchers to evaluate the potential costs of resistance (Damalas and Koutroubas Reference Damalas and Koutroubas2024). Some studies have reported that glyphosate-susceptible biotypes of junglerice exhibit higher fitness, while others have found no significant differences in seed production between susceptible and resistant plants (Mollaee et al. Reference Mollaee, Mobli and Chauhan2020; Mutti et al. Reference Mutti, Mahajan, Jha and Chauhan2019). In certain cases, however, glyphosate-resistant populations have been shown to exhibit higher fitness compared to susceptible ones, both under nonrestrictive conditions and in response to saline stress (Shrestha et al. Reference Shrestha, De Souza, Yang, Sosnoskie and Hanson2018).
Interactions among individuals, in addition to determining population fitness differences, provide insights into the competitive dynamics of plant–plant relationships (Radosevich et al. Reference Radosevich, Holt and Ghersa2007). These interactions are generally negative, meaning one species may experience greater suppression than the other. Understanding these dynamics is essential for elucidating patterns of species composition and dominance within agroecosystems (Lau and Funk Reference Lau and Funk2023). Competition studies enable the assessment of competitive ability through indices such as aggressiveness (AGR) and resource complementarity using the total relative yield (RYT), which ultimately shapes the success of a species within a community (Roush and Radosevich Reference Roush and Radosevich1985; Swanton et al. Reference Swanton, Nkoa and Blackshaw2015).
Given the growing importance of junglerice in the Pampas region, particularly due to the selection of glyphosate-resistant populations, understanding the competitive dynamics between susceptible and resistant individuals is essential. Such insights will not only clarify potential fitness costs associated with resistance but also inform the development of improved management programs and more effective control strategies (Mutti et al. Reference Mutti, Mahajan, Jha and Chauhan2019). Furthermore, studies involving both weed–weed and weed–crop interactions under a density-dependent gradient are critical for enhancing management strategies (Baucom Reference Baucom2019).
The objective of this study was to quantify the individual and areal productivity of two junglerice populations, glyphosate-resistant (EC-R) and glyphosate-susceptible (EC-S), at different densities and under coexistence with a soybean plant. It was hypothesized that glyphosate-susceptible individuals would have greater biological fitness (as determined by aboveground dry matter, seed number, and seed weight) and superior competitive ability (AGR > 0). Additionally, it was hypothesized that intraspecific interactions between susceptible and resistant individuals would result in full competition (RYT = 1), whereas interspecific interactions with soybean would reduce the productivity of both susceptible and resistant individuals.
Materials and Methods
Two experiments were conducted at the National Institute of Agricultural Technology (INTA) in Pergamino, Argentina (33.947°S, 60.564°W), under controlled conditions in 2018 and 2019. A growth chamber was used with a 12-h photoperiod and a constant temperature of 26 C. Light was provided by 1,000-W full-spectrum LED panels. These conditions replicate the ideal environment for the development of junglerice.
Sample Collection and Seedling Obtention
Two junglerice seed samples were used, following the procedure described by Shrestha et al. (Reference Shrestha, De Souza, Yang, Sosnoskie and Hanson2018), ensuring that the progeny originated from field-collected seeds rather than clonal propagation. Seeds were collected in March 2018 and stored in a dry chamber at 21 C. In accordance with Goh et al. (Reference Goh, Vila-Aiub, Busi and Powles2016), the collected seeds were sown and treated with glyphosate at the labeled dose (0.86 kg ae ha−1) to corroborate resistance. The EC-S population exhibited 100% mortality, whereas the EC-R population had a survival rate of 93.3%, exceeding the 85% threshold proposed by Goh et al. (Reference Goh, Vila-Aiub, Busi and Powles2016).
Although species in the Echinochloa genus exhibit a high degree of self-pollination, genetic differences between the seed samples and the mother plants may exist (Liu et al. Reference Liu, Singh, Abugho, Lin, Zhou and Bagavathiannan2022). Owing to the possibility that field-collected seed samples contain individuals with varying levels of susceptibility or resistance to glyphosate, it is appropriate to consider these as heterogeneous populations—glyphosate-susceptible and —resistant—rather than as biotypes (Asaduzzaman et al. Reference Asaduzzaman, Koetz, Wu, Hopwood and Shephard2021).
After 5 mo of storage (Picapietra and Acciaresi Reference Picapietra and Acciaresi2022), seeds were placed in plastic boxes with a moistened paper substrate inside the same growth chamber. Once a seedling fully developed its first leaf, it was transplanted into a container. The germination and transplant process were repeated in August 2019 using the same seeds stored in 2018 for a second experimental cycle.
Pots and Experimental Design
Plastic pots of 6.2 L were used as experimental units. They were filled with soil substrate of a silty loam texture (22.7% clay, 64.8% silt, and 12.5% sand) and a nitrogen (N-NO₃) content of 11.8 mg kg−1. Containers were watered twice a week with 100 ml of water per irrigation to ensure nonrestrictive water conditions.
The experiment was conducted under a completely randomized design with a factorial arrangement involving three factors (α, β, γ). Factor α was the density of junglerice with three levels (i = 3) defined by the number of plants per pot (2, 4, and 6 plants pot−1). Factor β was the proportion of EC-S and EC-R individuals, with four levels (j = 4): pure EC-S (100% EC-S), pure EC-R (100% EC-R), and mixed populations where EC-S and EC-R individuals grew at a 50:50 ratio but were evaluated separately as EC-S in mixture and EC-R in mixture. Factor γ was the inclusion of one soybean plant, with two levels (k = 2), defined as “with” and “without” soybean (0 and 1 plants pot−1).
Junglerice seedlings were transplanted equidistantly between the center and the margin of each pot (Figure 1 A and C). Then, two seeds of the soybean cultivar ‘DM 4612’ (treated and inoculated) were sown at the centers of the designated pots (Figure 1 B). Five days after sowing, soybean plants emerged and were subsequently thinned to leave only one plant per pot. Each pot with an α–β–γ treatment combination had three replicates, which were labeled and randomly arranged inside the growth chamber.
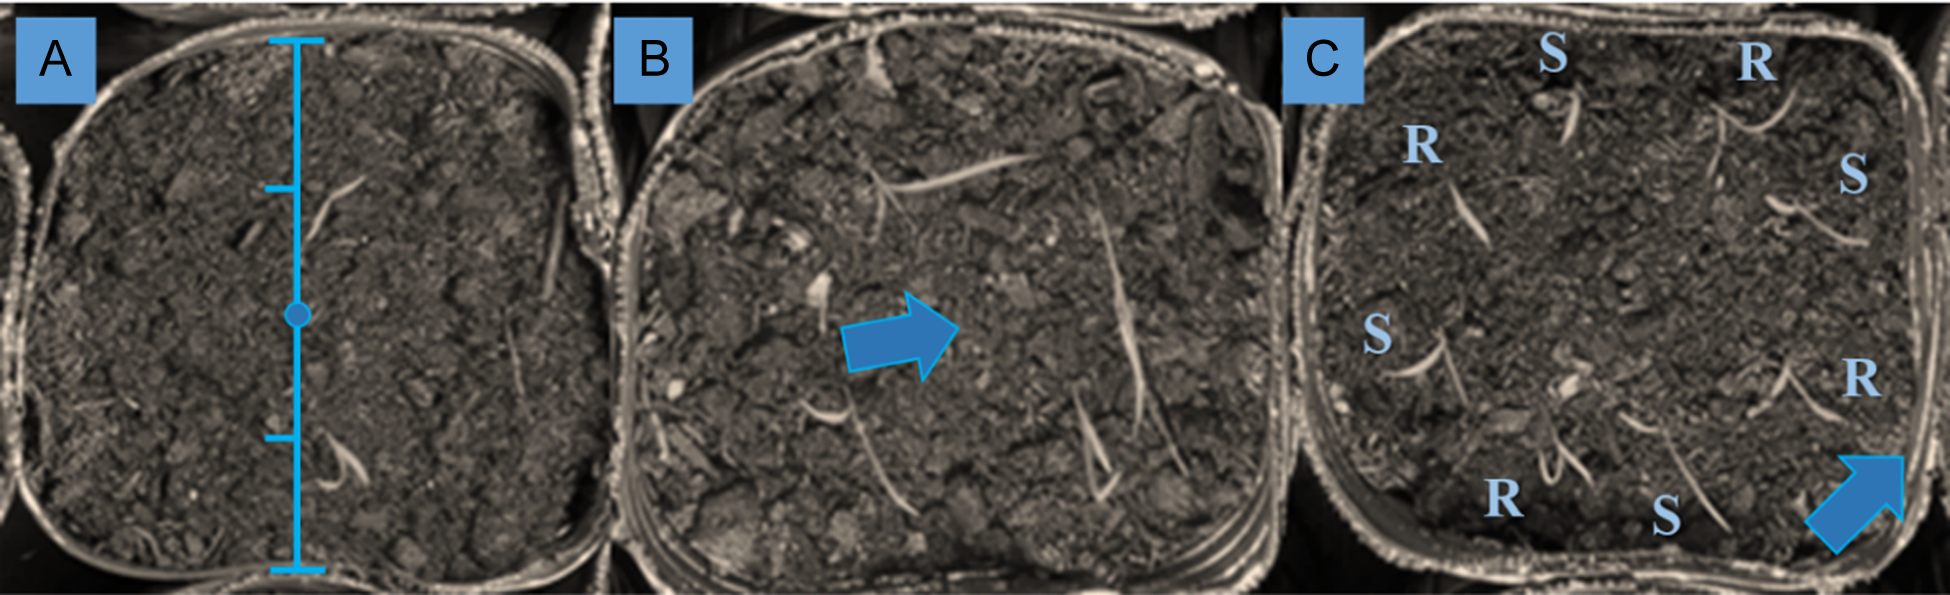
Figure 1. Description of pot procedure. Seedlings arranged equidistantly between the pot margin and center (A). Soybean planted after junglerice transplanting in the center of the pot (B). In mixtures EC-S and EC-R, seedlings were intercalated, and the margin of the pot was labeled to identify EC-R individuals (C).
Plant Measurements
At plant maturity (65 d after transplanting), plant height (PLH; cm) was measured from the base to the most distant panicle, and the number of tillers per plant (TIL) was counted. Seeds were extracted from the panicles, cleaned, and placed in glasses. Seed number per plant (SEN), seed weight (SEW; g), and the hundred-seed weight (HSW; g) per plant were measured using a digital balance (d = 0.01 g). Finally, the aerial parts of each plant were placed in paper bags, oven-dried at 52 C for 72 h, and weighed to determine aboveground dry matter (ADM; g) per plant.
Determination of Competitiveness and Aggressiveness
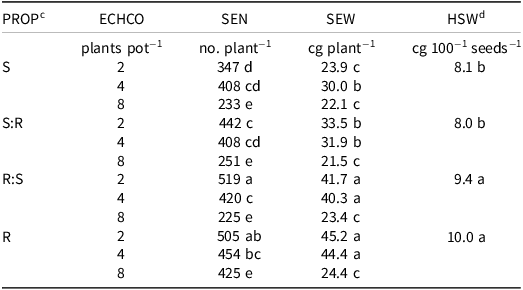
Relative yield (RY) for TIL, ADM, SEN, and SEW per pot was calculated (Equation 1). Subsequently, RYT (Equation 2) and aggressiveness (AGR) (Equation 3) were determined, following the methods described by Cheng et al. (Reference Cheng, Cao, Yang, Yue, Xin and Chen2022) and Cao et al. (Reference Cao, Yao, Wei, Zhang, Liu and Li2024):
 $${\rm{R}}{{\rm{Y}}_a} = {Y_{ab}}/{Y_{aa}} {\rm\ and}\ {\rm{R}}{{\rm{Y}}_b} = {Y_{ba}}/{Y_{bb}}$$
 $${\rm{RYT}} = {\rm{R}}{{\rm{Y}}_a} + {\rm{R}}{{\rm{Y}}_b}$$
 $${\rm{AGR}} = {\rm{R}}{{\rm{Y}}_a} - {\rm{R}}{{\rm{Y}}_b}$$
where Y ab (or Y ba) is the yield per pot of susceptible (or resistant) individuals grown in mixtures with resistant (or susceptible) individuals and Y aa (or Y bb) is the yield per pot of susceptible (or resistant) individuals grown in monoculture.
An RYT of 1.0 indicates full competition between EC-R and EC-S, whereas RYT > 1.0 suggests resource complementarity and RYT < 1.0 indicates antagonism or mutual negative effects. Similarly, AGR identifies whether one population has greater competitive ability (AGR > 0) or whether both populations share equal ability (AGR = 0).
Data Analysis
Individual productivity data were analyzed using a linear mixed model (LMM) that included the main effects of density (α), population proportion (β), and soybean presence (γ), as well as their respective two-way and three-way interactions. Given the experimental design, all factors were treated as fixed effects. Because no significant differences were detected between the two experimental years, data from both cycles were combined for analysis.
To assess fitness differences, an LMM was applied based on the type of junglerice individuals per pot. The analysis considered three groups: pure EC-S pots, pure EC-R pots, and EC-S:EC-R mixture pots, with this new three-level variable defined as “combination.” Data were further analyzed by partitioning according to α and γ effects, allowing comparisons among individual types without accounting for variations from intra- or interspecific interactions.
The RYT and AGR indexes were analyzed using ANOVA with a factorial arranged to include the effects of density (α) and soybean presence (γ), as well as their interaction (α × γ). Additionally, two bivariate comparisons (Snaydon and Satorre Reference Snaydon and Satorre1989) were conducted to contrast the productivity of EC-S and EC-R (TIL, ADM, SEN, and SEW). In the first comparison, RY was evaluated to illustrate the RYT and AGR indexes. In the second, double-logarithmic scales of productivity from pure EC-S and EC-R pots were constructed to visualize intra- and interspecific relationship projections.
Results and Discussion
Individual Productivity of Junglerice
The density of junglerice (α) and the inclusion of soybean (γ) were the only treatments that significantly affected all analyzed variables (P < 0.05) (Table 1). On one hand, the intraspecific density effect demonstrated that the species exhibited a density-dependent behavior, showing extensive plasticity in its vegetative structures (TIL, ADM) and reproductive variables (SEW and SEN). This finding aligns with previous studies (Romillac et al. Reference Romillac, Piutti, Slezack-Deschaumes and Gaba2023; Weiner Reference Weiner2004) that emphasize that these traits are highly plastic and responsive to neighbor presence. Additionally, no significant differences related to glyphosate susceptibility or resistance were observed in these variables, suggesting that resistance does not directly impact individual vegetative productivity.
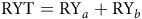
Table 1. Junglerice height, aboveground dry matter, seed number, seed weight, hundred-seed weight, and tiller number per plant, as influenced by the significant interaction between junglerice density and soybean inclusion.a,b
a Abbreviations: ADM, aboveground dry matter; ECHCO, junglerice density; GLYMA, soybean inclusion; HSW, hundred-seed weight; PLH, junglerice height; SEN, seed number; SEW, seed weight; TIL, tiller number.
b Different letters indicate significant differences according to Fisher’s LSD (α = 0.05).
c Owing to the nonsignificant interaction, TIL average values are shown for each junglerice density.
On the other hand, when soybean was included, the productivity of ADM, SEN, and SEW of junglerice significantly increased (P < 0.05), particularly at densities of 2 and 4 plants pot−1. However, at 8 plants pot−1, no significant differences were observed (P > 0.05). In contrast to previous reports on competition between junglerice and crops such as beans [Vigna radiata (L.) R. Wilczek] (Mutti et al. Reference Mutti, Mahajan, Jha and Chauhan2019), soybean (Matloob and Chauhan Reference Matloob and Chauhan2021), and rice (Oryza sativa L.) (Hu et al. Reference Hu, Liu, Mao, Xu, Chen, Li and Yang2023), this experiment showed that the presence of one soybean plant increased individual productivity at a density of 2 plants pot−1. This increase could be attributed to greater resource acquisition by junglerice and soybean’s ability to supply nitrogen through biological fixation, given that water and light were not limiting factors and soybean seeds were inoculated in soil with an initial availability of 11.8 ppm of N-NO₃.
The proportion of EC-S and EC-R individuals (β) did not significantly affect PLH, ADM, or TIL. Adjustments in ADM, TIL, and PLH were strongly conditioned by population density. However, variations in SEN, SEW, and HSW were significantly more favorable for EC-R individuals (Table 2). These findings are consistent with Shrestha et al. (Reference Shrestha, De Souza, Yang, Sosnoskie and Hanson2018), who reported that resistant individuals produce more seeds under intraspecific competition, although these differences tend to disappear with greater resource limitations.
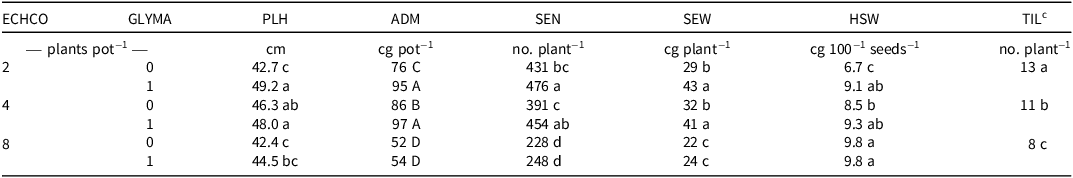
Table 2. Junglerice seed number, seed weight, and hundred-seed weight per plant, as influenced by the significant interaction between the proportion of glyphosate-resistant and -susceptible junglerice and junglerice density.a,b
a Abbreviations: ECHCO, junglerice density; HSW, hundred-seed weight; PROP, proportion; R, glyphosate-resistant; S, glyphosate-susceptible; SEN, seed number; SEW, seed weight.
b Different letters indicate significant differences according to Fisher’s LSD (α = 0.05).
c Proportion of EC-S and EC-R individuals per pot: pure EC-S (S), pure EC-R (R), EC-S from the mixture (S:R), and EC-R from the mixture (R:S).
d Owing to the nonsignificant interaction, HSW average values are shown for each proportion.
The interaction α × β was significant for SEN and SEW, whereas for HSW, only the β effect was significant (P < 0.05). The lowest SEN per plant was observed at a density of 8 plants pot−1, with no significant differences between EC-S and EC-R individuals (P > 0.05), yielding values of 225 and 250 seeds plant−1, respectively. The highest seed number per plant was recorded for EC-R individuals at a density of 2 plants pot−1, averaging 505 to 519 seeds plant−1.
Similarly to SEN, the lowest SEW plant−1 was observed at a density of 8 plants pot−1, regardless of the junglerice individual type. However, at densities of 2 and 4 plants pot−1, EC-R individuals showed the highest SEW (Table 2). Accordingly, HSW values were also higher for EC-R individuals (P < 0.05). At the pot level, adjustments in junglerice productivity were strongly influenced by plant density. However, at 8 plants pot−1, no significant differences were found between EC-S and EC-R individuals, whether alone or mixed, with or without soybean. Among the variables analyzed, the total number of tillers per pot varied the least in relative terms. This is consistent with Vulchi et al. (Reference Vulchi, Guan, Clark and Brim-DeForest2024), who observed that tiller number tends to stabilize, but does not agree with Matloob and Chauhan (Reference Matloob and Chauhan2021), who observed that the presence of cover crop plants in the vicinity suppressed the tillering of junglerice. At lower densities, EC-R individuals exhibited higher SEN and SEW, partially supporting the findings of Mahajan et al. (Reference Mahajan, Kaur, Thompson and Chauhan2020), who reported that glyphosate resistance does not significantly influence junglerice productivity in mixed populations.
Fitness Differences between Glyphosate-Susceptible and -Resistant Junglerice Individuals
The results cannot be strictly interpreted as the absence of a fitness cost associated with resistance, as the EC-S and EC-R populations analyzed originate from distinct environments and may differ in genetic and adaptive backgrounds. The observed results indicated that SEN and SEW per plant were higher in EC-R individuals compared to EC-S individuals (Figure 2). This difference was particularly evident at a density of 2 plants pot−1, where soybean significantly increased the productivity of EC-R individuals, leading to an increase in SEN by 46 ± 14 seeds plant−1 and in SEW by 0.14 ± 0.02 g plant−1. However, at a density of 8 plants pot−1, no productivity differences were observed between EC-R and EC-S populations, nor were significant differences found in junglerice plants growing with or without soybean (P > 0.05).

Figure 2. Bivariate plot of relative yield as proposed by Snaydon and Satorre (Reference Snaydon and Satorre1989), adapted to total number of tillers (TILR) (A), aboveground dry matter (ADMR) (B), seed number (SENR) (C), and seed weight (SEWR) (D) from glyphosate-susceptible (EC-S; x axis) and -resistant (EC-R; y axis) junglerice at densities of 2 plants pot−1 (circles), 4 plants pot−1 (triangles), and 8 plants pot−1 (diamonds), grown without (open symbols) and with (filled symbols) soybean. The solid diagonal line represents RYT = 1.0, and the dashed diagonal line represents AGR = 0.
No differences were observed at 8 plants pot−1 in vegetative and reproductive productivity, and considering that resource availability was not measured in this study, this behavior could be associated with allometric relationships, where increasing density leads to an asymptotic decrease in plant size (Weiner Reference Weiner2004). Nevertheless, this pattern will be further analyzed in the following section, considering relative yield and aggressivity indexes.
Regarding areal productivity, junglerice density had a statistically significant effect on all studied variables (P < 0.05), similar to individual productivity. However, soybean significantly affected ADM, SEN, and SEW (P < 0.05) but not TIL (P > 0.05). When evaluating productivity per pot, the total number of tillers was related only to population density, with no differences between EC-S and EC-R individuals. These results suggest that under the evaluated conditions, glyphosate resistance does not appear to be associated with a significant fitness cost. The findings presented here align with those of Damalas and Koutroubas (Reference Damalas and Koutroubas2024), who stated that the biological cost associated with herbicide resistance may not express or may only occur under specific conditions. Additionally, they are consistent with the findings of Tillería et al. (Reference Tillería, Pandolfo, Presotto and Ureta2024), who observed no differences in fitness components between susceptible and resistant plants, even in the absence of the herbicide.
The variation in ADM pot−1 was explained by junglerice density and soybean presence, independently of the EC-S and EC-R (Figure 3). In terms of reproductive productivity, at low densities (2 and 4 plants pot−1), soybean significantly increased SEN and SEW in EC-R individuals, which showed greater population fitness compared to EC-S individuals. At high density (8 plants pot−1), no significant differences were observed between populations. The SEN and SEW increased by soybean in EC-R individuals, contrasting with the results of Barroso et al. (Reference Barroso, Michelon, da Costa Aguiar Alves, Han, Yu, Powles and Vila-Aiub2022), who observed that soybean competence significantly reduced the relative fitness of resistant individuals due to decreased catalytic activity of the EPSPS enzyme. These results reinforce Li et al.’s (Reference Li, Guo, Jin, Yang and Kong2023) hypothesis that not all herbicide-resistant weeds have fitness costs and that herbicide resistance could lead to improved fitness even in the absence of herbicides.
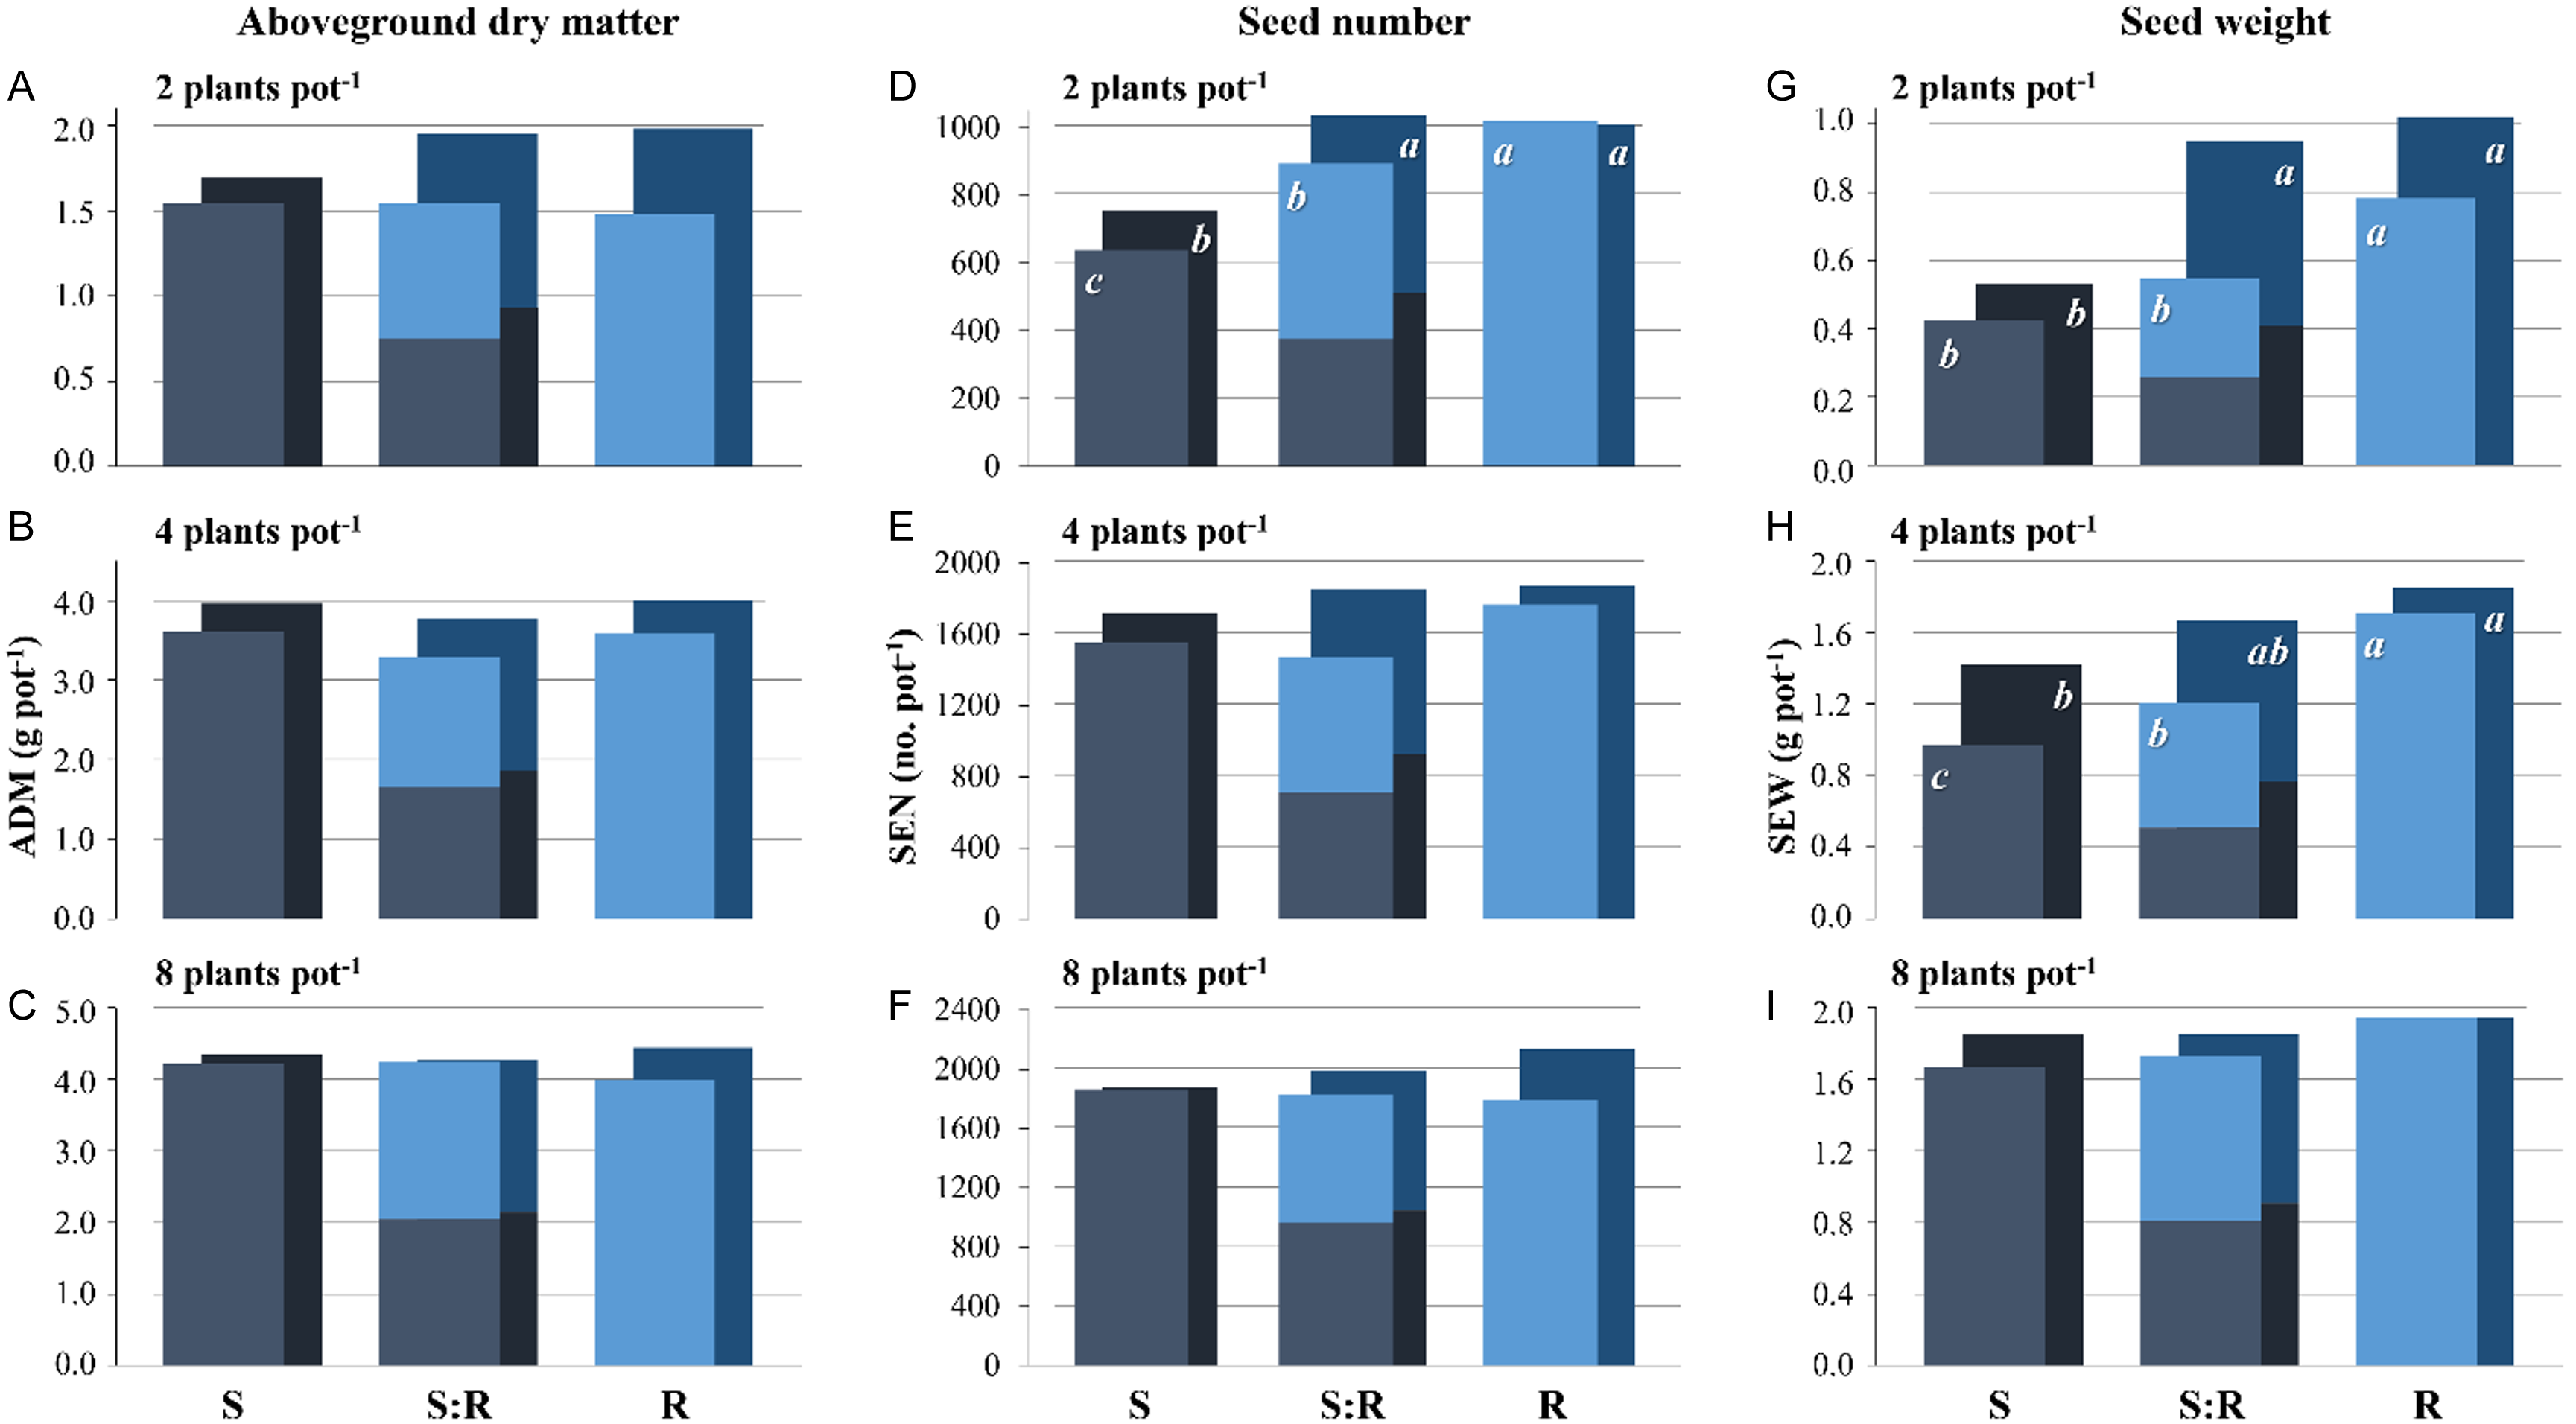
Figure 3. Junglerice ADM (A to C), SEN (D to F), and SEW (G to I) at 2, 4, and 8 plants pot−1 (top to bottom) for susceptible individuals (S; blue), resistant individuals (R; cyan), and the mixture (S:R), grown without (front bars) or with (back bars) one soybean plant. Different letters indicate significant differences between S and R combinations according to Fisher’s LSD (α = 0.05).
This behavior is striking given that, despite the difference in resistance traits, both EC-R and EC-S individuals belong to the same species. However, EC-R individuals appear to have a greater advantage in resource acquisition, particularly at low densities, in the presence of soybean and in the absence of glyphosate. Nevertheless, the lack of productivity differences at 8 plants pot−1 suggests a reduction in EC-R performance at higher densities. This could be attributed to resource limitations and, more importantly, a lower resource-use efficiency, which might be linked to differences in fitness associated with the genetic backgrounds of these individuals.
Additionally, although no significant differences in ADM were observed between populations, while EC-R exhibited higher SEN and SEW, this pattern suggests that resistant individuals may be reallocating resources toward reproduction, thereby gaining a differential advantage in biomass allocation. Such a compensatory mechanism could confer a net reproductive benefit. This phenomenon may be driven by pleiotropic effects or inherent differences in the genetic backgrounds of the resistant populations. This association with genetic background could be linked to phenotypic plasticity or genetic diversity, as suggested by Romillac et al. (Reference Romillac, Piutti, Slezack-Deschaumes and Gaba2023), supporting the need for further studies to better understand these mechanisms.
Relative Yield and Aggressiveness of Junglerice
The analysis of the RYT index adapted to TIL and ADM variables showed no significant differences (P > 0.05). This indicates that the index was statistically similar to 1.0 across all density levels (2, 4, and 8 plants pot−1), both with (C) and without (O) soybean. These results suggest that EC-S and EC-R individuals grew under full competition (Figure 2). These findings align with their classification as the same species, where symmetric competition relationships are typically described under intraspecific competition between plants of similar size (Tomiolo et al. Reference Tomiolo, Damgaard, Gay, Ronfort and Ehlers2022).
However, for SEN and SEW variables, significant differences (P < 0.05) were observed only at a density of 2 plants pot−1 with soybean, where RYT indexes were 1.25 and 1.36, respectively. This suggests resource complementarity under these conditions. In the remaining treatments, the indexes were not significantly different from 1.0. This situation, suggesting resource complementarity, could be attributed to the fact that at 2 plants pot−1 in association with soybean, resources were not limiting for junglerice seed formation and filling.
Regarding the AGR index, no significant differences were found in TIL or ADM of junglerice between EC-S and EC-R individuals (AGR ∼ 0). However, differences emerged in reproductive variables. For SEN, at a density of 2 plants pot−1, AGR was 0.19, whereas for SEW, at the same density, AGR reached values of 0.29 and 0.26 when plants grew C and O, respectively (Figure 2). These results indicate that under these conditions, EC-S individuals show higher competitive ability than EC-R individuals (P < 0.05). This is reflected by the greater reduction in relative yield when EC-S and EC-R grew in mixture. These differences were evidenced in the bivariate diagram, as described by Snaydon and Satorre (Reference Snaydon and Satorre1989).
The double-logarithmic bivariate representations for EC-S and EC-R per pot (Figure 4) indicated no differences in ADM and SEN between EC-S and EC-R individuals (Figure 4 B and C). However, slight differences were observed in TIL at a density of 4 plants pot−1 without soybean (Figure 4 A) and in SEW at densities of 2 and 4 plants pot−1 with soybean and 8 plants pot−1 without soybean (Figure 4 D). In these cases, EC-R individuals outperformed EC-S, as evidenced by the differences in confidence intervals (α = 0.05).
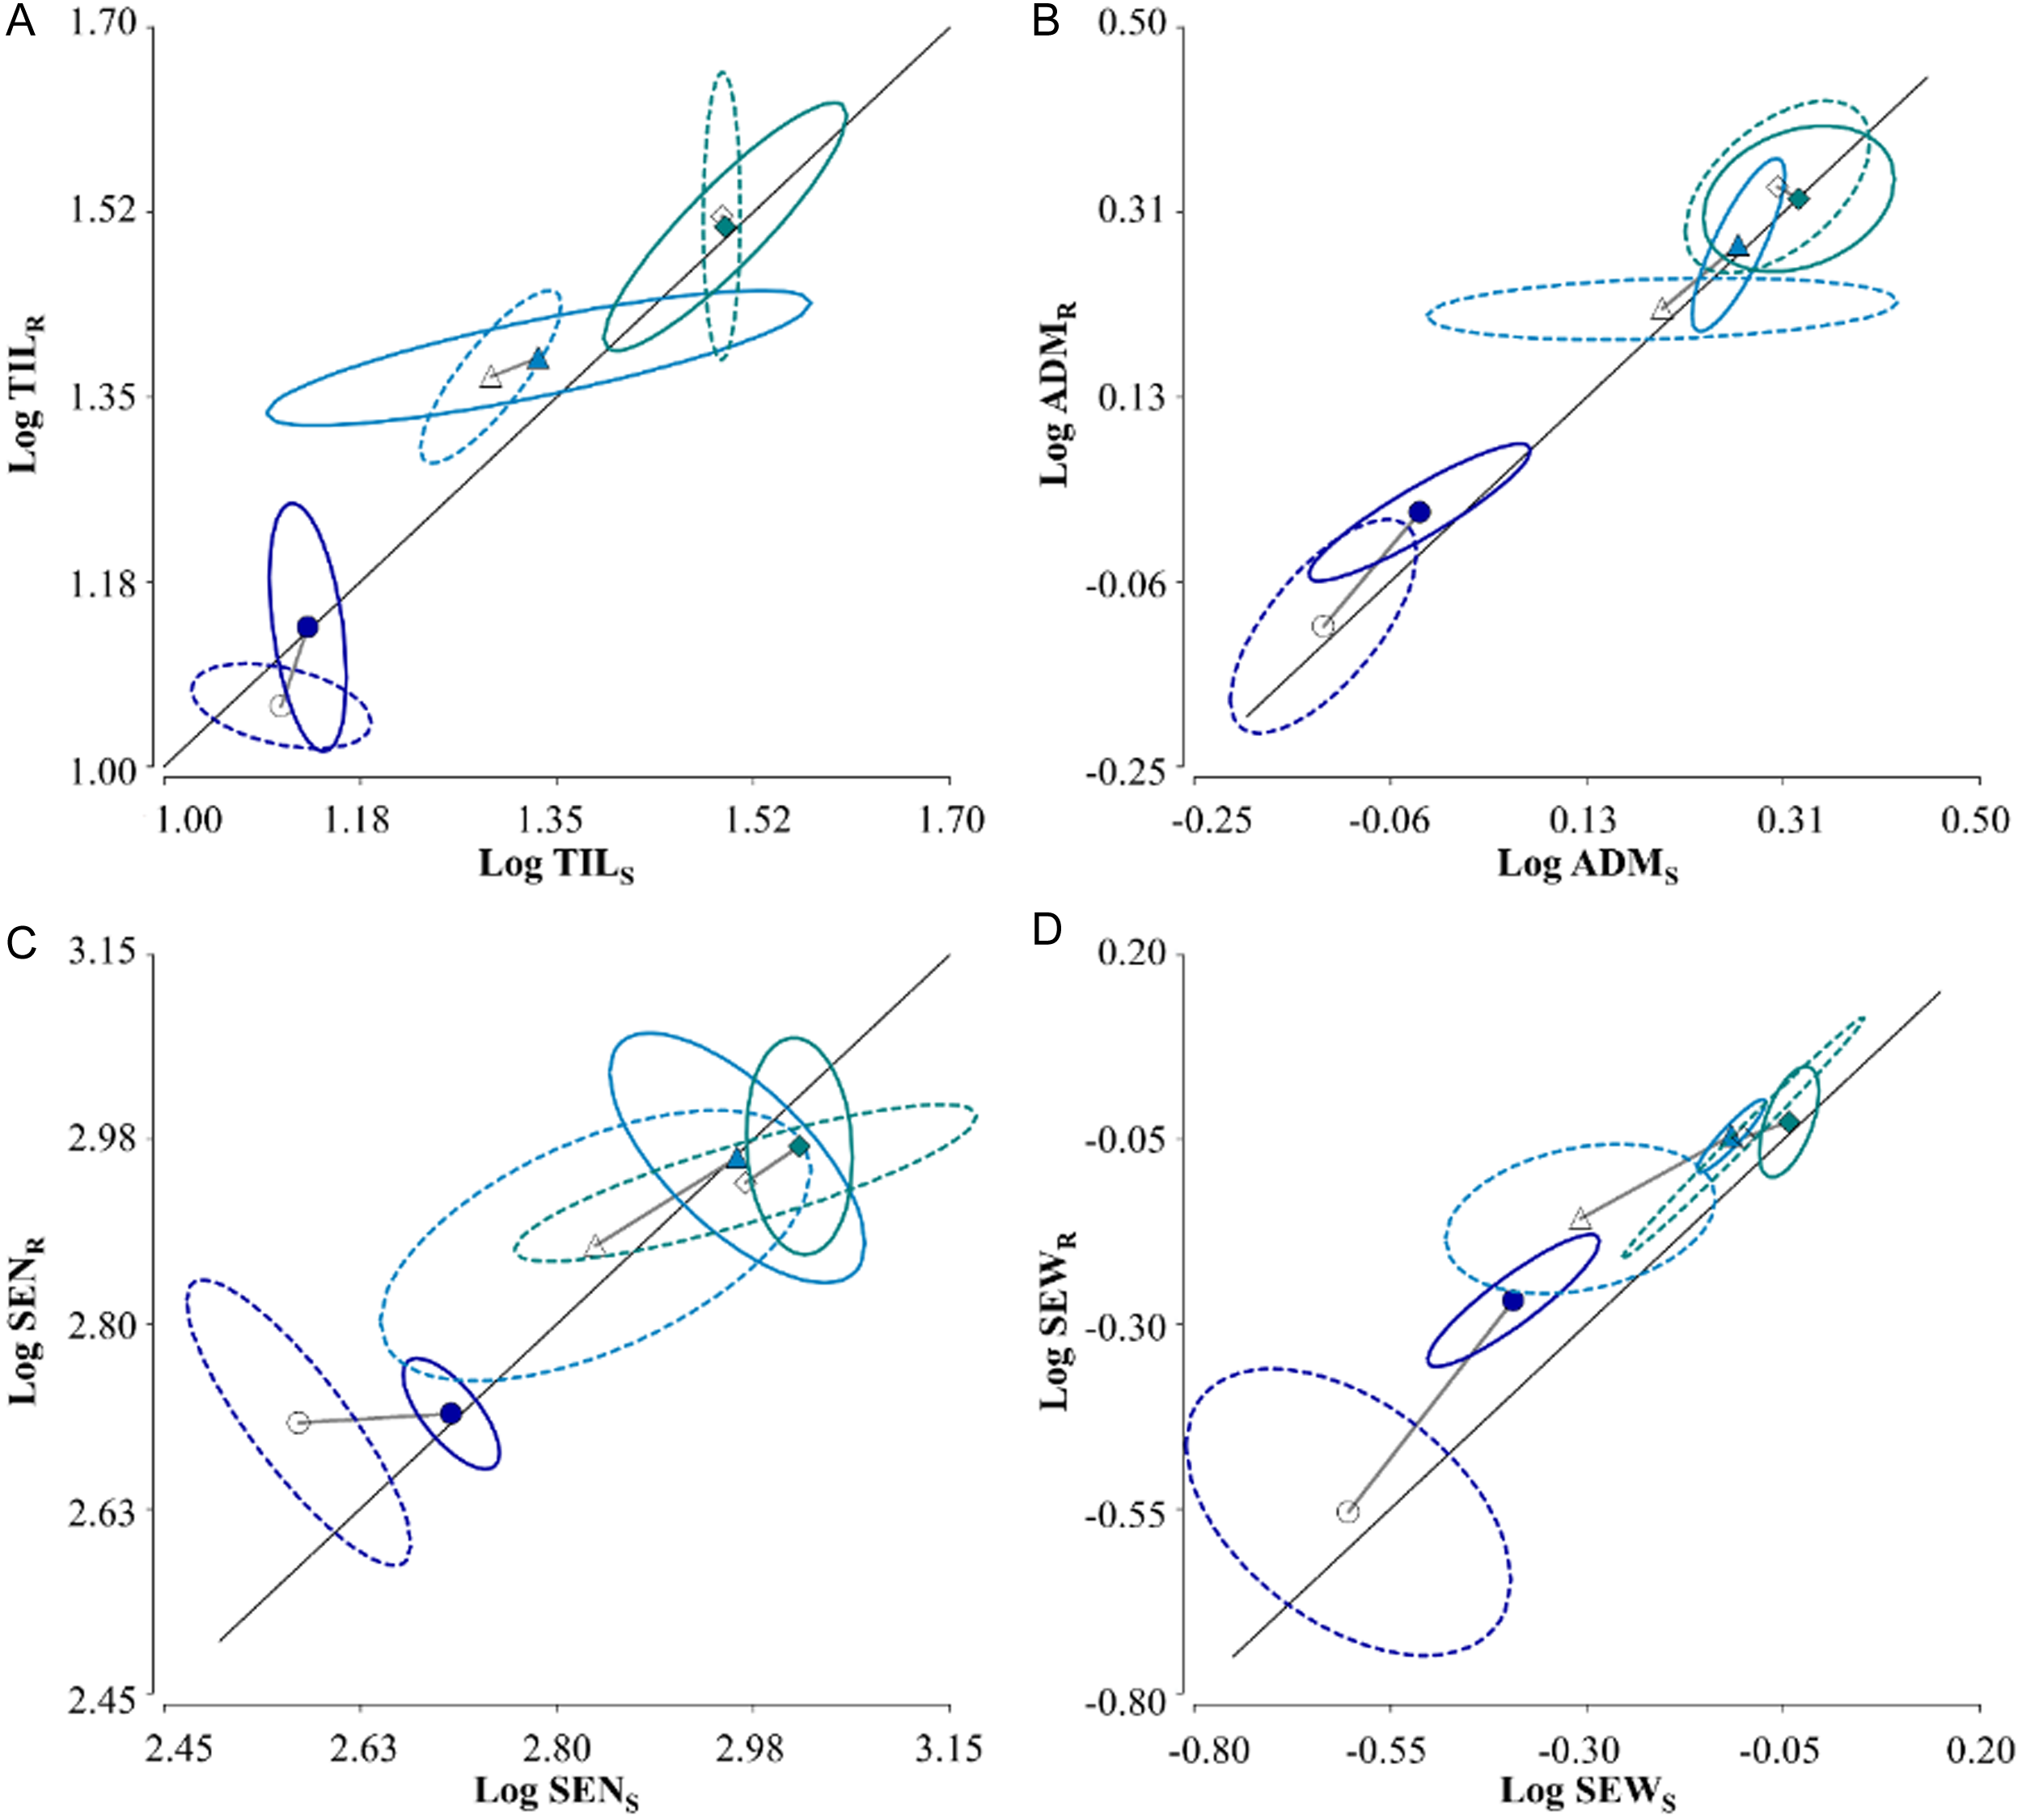
Figure 4. Bivariate double-logarithmic plot of yield per pot, based on Snaydon and Satorre (Reference Snaydon and Satorre1989), adapted to TIL (A), ADM (B), SEN (C), and SEW (D) from glyphosate-susceptible (S; x axis) and -resistant (R; y axis) junglerice at 2 plants pot−1 (circles), 4 plants pot−1 (triangles), and 8 plants pot−1 (diamonds), grown without (open symbols) and with (filled symbols) one soybean plant. The solid diagonal line represents equality of the variable between S and R individuals, and the ellipses represent the 95% confidence area for the bivariate comparison.
These results indicate that the differences between EC-S and EC-R are observed primarily at low densities in the determination of SEN and SEW. Under the experimental conditions evaluated, no differences were observed in TIL, ADM, SEN, or SEW that would indicate a fitness difference favoring susceptible individuals over resistant ones, leading to the rejection of the first hypothesis.
The higher productivity observed in EC-R at low densities can be interpreted as an intrinsic characteristic of that population rather than being solely an attribute associated with resistance biology. While this trait has implications for resistance ecology—by conferring an intraspecific competitive advantage that could potentially favor the evolution of a higher frequency of resistant individuals—at a density of 8 plants pot−1, these individuals exhibited a greater relative loss in yield. This resulted in a higher competitive ability for EC-S, particularly under this condition, supporting the partial acceptance of the hypothesis regarding the aggressiveness index.
This suggests that the productive advantage of resistant individuals is highly dependent on the competitive context (i.e., density dependent). This dynamic underscores the importance of evaluating competition between populations of different origins, as might occur in a scenario where resistant individuals invade or are introduced into a predominantly susceptible population.
Regardless, our findings generally indicate that the populations were engaged in full competition in relative terms, which is partly attributable to their intraspecific nature. The only exception was observed at a density of 2 plants pot−1 in the presence of soybean, where resource complementarity was evident for both SEW and SEN. Consequently, this supports the partial acceptance of the third hypothesis.
Finally, the competitive advantage of junglerice was attributed not only to its growth traits but also to its earlier emergence relative to soybean. At the time of soybean emergence, junglerice seedlings had already developed one to two fully expanded leaves, likely providing an initial establishment advantage and greater resource capture by the weed. Instead of exerting negative effects, the presence of soybean significantly improved junglerice productivity at the lowest density and maintained or slightly increased weed productivity at the remaining densities. Consequently, the fourth hypothesis is completely rejected, as soybean did not decrease the productivity of susceptible or resistant populations.
This finding underscores the importance of carefully timing junglerice management strategies, particularly considering that soybean is the predominant crop in Argentina and cultural management decisions are made early in the season. Therefore factors like planting date, crop density, and row spacing should be carefully evaluated due to their potential influence on the competitive advantage of junglerice. In this context, the widespread adoption of glyphosate-resistant soybean plays a key role in the coevolution of herbicide resistance, further emphasizing the relevance of herbicide resistance ecology.
Practical Implications
The findings of this study provide valuable insights into the competitive dynamics between glyphosate-resistant and -susceptible junglerice populations in the presence and absence of soybean. These results demonstrate that glyphosate-resistant individuals can produce a higher seed number and weight, particularly at lower densities, which may enhance their persistence and proliferation in agroecosystems where glyphosate use is frequent. However, susceptible individuals exhibit a greater competitive ability when grown alongside resistant ones, especially under conditions of resource limitation or soybean competition.
For field practitioners, this information underscores the importance of considering population heterogeneity in weed management strategies. The coexistence of resistant and susceptible populations could influence the effectiveness of cultural and chemical control methods. For example, integrated management practices that reduce seed production at low densities, such as targeted herbicide applications or increased crop competition through adjustments in crop stand density, row spacing, planting date, and the selection of a competitive cultivar, may help to suppress resistant populations. Furthermore, these findings highlight the potential risks of relying solely on glyphosate-based management and the need to implement diverse approaches, such as crop rotation and the use of preemergence herbicides, to mitigate the spread of resistance.
Overall, this study emphasizes the ecological dynamics driving herbicide resistance and provides actionable knowledge for developing sustainable weed management strategies in glyphosate-dependent cropping systems.
Acknowledgments
We thank Marcelo González, support staff from INTA, for his valuable assistance in preparing the containers and collecting data. We also extend our gratitude to Professor Daniel Tuesca for his insightful feedback and collaboration in reviewing this work.
Funding
This research was funded by INTA through doctoral training support.
Competing interests
The authors declare no conflicts of interest.


 Open access