


Statement of Research Significance
Research Question(s) or Topic(s): This study explored whether advanced computer-based methods can accurately predict which individuals with mild cognitive problems are at higher risk of developing dementia in the coming years. Main Findings: Using data from a memory clinic in Gothenburg, the study tested several computer-based prediction methods on clinical information from 347 patients. About one in four patients later developed dementia. The most accurate methods used a combination of medical test results, thinking and memory test scores, and measures of change in cognitive performance over time. The best-performing models correctly identified future dementia in about 9 out of 10 cases. Study Contributions: The findings show that prediction tools based on clinical and cognitive information, including how thinking skills change over time, can help identify individuals at higher risk for dementia. This has important implications for earlier diagnosis, timely intervention, and improved planning for research and treatment trials.
Introduction
Alzheimer´s disease (AD) and other forms of dementias represent some of the most challenging global health issues, with profound societal, economic, and personal consequences (Wimo et al., Reference Wimo, Seeher, Cataldi, Cyhlarova, Dielemann, Frisell, Guerchet, Jönsson, Malaha, Nichols, Pedroza, Prince, Knapp and Dua2023). Mild cognitive impairment (MCI) is widely recognized as a putative stage of dementia and defined as a measurable decline in one or more cognitive domains that is greater than expected for an individual´s age and education level without significantly interfering with daily functional abilities, thus not meeting the criteria for dementia (Petersen et al., Reference Petersen, Smith, Waring, Ivnik, Tangalos and Kokmen1999; Reference Petersen, Lopez, Armstrong, Getchius, Ganguli, Gloss and Rae-Grant2018). While MCI increases the risk for future cognitive decline, only about 30% to 50% of individuals with MCI will progress to dementia within a period of several years (Mitchell & Shiri-Feshki, Reference Mitchell and Shiri-Feshki2009; Salemme et al., Reference Salemme, Lombardo, Lacorte, Sciancalepore, Remoli, Bacigalupo, Piscopo, Zamboni, Rossini, Cappa, Perani, Spadin, Tagliavini, Vanacore and Ancidoni2025). Accurate prediction of which individuals with MCI are at highest risk for progression is essential for early intervention, targeted monitoring, and optimized clinical trial design.
A variety of machine learning (ML) algorithms have recently emerged as powerful tools for modeling complex and potentially nonlinear associations using high-dimensional data, offering significant promise in the context of individualized risk prediction. While previous studies have demonstrated the utility of ML algorithms in predicting dementia risk (e.g., Agostinho et al., Reference Agostinho, Simões and Castelo-Branco2024; Bucholc et al., Reference Bucholc, Titarenko, Ding, Canavan and Chen2023; Franciotti et al., Reference Franciotti, Nardini, Russo, Onofrj and Sensi2023; Valsdóttir et al., Reference Valsdóttir, Jónsdóttir, Magnúsdóttir, Chang, Hu, Gudnason, Launer and Stefánsson2024), few have conducted comprehensive comparative evaluation of multiple ML algorithms using a multimodal set of baseline predictors in a well-characterized MCI population. Notably, many of the existing studies (e.g., Cui et al., Reference Cui, Liu, Luo, Zhen, Fan, Liu and Jin2011; Massetti et al., Reference Massetti, Russo, Franciotti, Nardini, Mandolini, Granzotto, Bomba, Delli Pizzi, Mosca, Scherer, Onofrj and Sensi2022) have relied on data from the Alzheimer’s Disease Neuroimaging Initiative (ADNI), which provides a rich and reliable dataset. However, to strengthen and validate these findings, there is a need for additional studies based on independent cohorts with different recruitment settings and clinical characteristics (see e.g., Borchert et al., Reference Borchert, Azevedo, Badhwar, Bernal, Betts, Bruffaerts, Burkhart, Dewachter, Gellersen, Low, Lourida, Machado, Madan, Malpetti, Mejia, Michopoulou, Muñoz‐Neira, Pepys, Peres and Rittman2023).
In the present study, we applied and compared 11 different ML algorithms to predict conversion from MCI to dementia, using baseline data collected during individuals’ initial visits to a memory clinic. Our focus was on predicting dementia conversion occurring between two to six years following the baseline assessment. The predictive models incorporated a broad range of baseline variables reflecting multiple domains of relevance for dementia risk. These included, among others, data from a comprehensive neuropsychological assessment of cognitive function, cerebrospinal fluid (CSF) biomarkers, apolipoprotein E (APOE) allele status, clinical indicators of cerebrovascular and cardiovascular health, anthropometric measures, and basic demographic information.
In a second analytical step, we also evaluated whether the inclusion of cognitive decline over time would improve the prediction. Specifically, we added the differences score (T2-T1) from the cognitive assessments to our model, reflecting change in cognitive performance between the baseline and two-year follow-up assessment. This is based on prior evidence showing that cognitive decline is associated with elevated dementia risk (Amieva et al., Reference Amieva, Jacqmin-Gadda, Orgogozo, Carret, Helmer, Letenneur, Barberger-Gateau, Fabrigoule and Dartigues2005; Thorvaldsson et al., Reference Thorvaldsson, MacDonald, Fratiglioni, Winblad, Kivipelto, Laukka, Skoog, Sacuiu, Guo, Östling, Börjesson-Hanson, Gustafson, Johansson and Bäckman2011).
By evaluating the predictive performance across a broad range of ML algorithms, we aimed to identify the approaches offering the most accurate and clinically informative predictions of dementia progression. Additionally, whenever possible, we explored the relative importance of each predictor across models, offering insight into cognitive, genetic and biological factors most relevant to dementia conversion prediction among individuals with MCI.
Whereas most previous studies have developed and validated ML models for predicting dementia conversion using large-scale research datasets such as ADNI, the present study used data derived from a memory clinic cohort. This distinction is important because memory clinic patents represent the population in which such predictive algorithms would ultimately be implanted in clinical practice. Compared with research database cohorts, memory clinic samples are more likely to be heterogenous, encompassing a broader spectrum of cognitive impairment, comorbidities, educational background, and medication use (see Farias et al., Reference Farias, Mungas, Reed, Harvey and DeCarli2009; Gianattasio et al., Reference Gianattasio, Bennet, Wei, Mehrotra, Mosley, Gottesman and Power2020; Snitz et al., Reference Snitz, Wang, Cloonan, Jacobsen, Chang, Huges, Kamboh and Ganguli2018). Consequently, they provide a more ecologically valid representation of real-world diagnostic populations. By evaluating the performance of multiple ML algorithms in this clinical context, the present study contributes to bridging the gap between research-oriented prediction models and their potential application in the routine diagnostic setting, offering insight into the generalizability and clinical utility of ML derived dementia prediction.
Methods
Participants
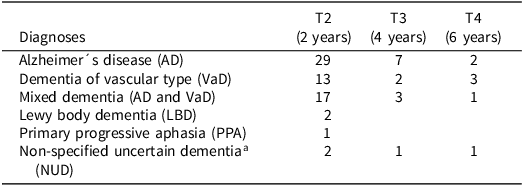
Data for the present study were drawn from the Gothenburg MCI Study (Wallin et al., Reference Wallin, Nordlund, Jonsson, Lind, Edman, Göthlin, Stålhammar, Eckerström, Kern, Börjesson-Hanson, Carlsson, Olsson, Zetterberg, Blennow, Svensson, Öhrfelt, Bjerke, Rolstad and Eckerström2016), a longitudinal investigation of individuals with MCI. The sample consisted of 347 participants (201 females) who were identified with MCI at study entry. Participants had an average of 12.4 years of formal education (SD = 3.6), and the mean age at baseline was 63.8 years (SD = 7.7). Approximately 75% of the participants were referred to the memory clinic by general practitioners or medical specialists due to suspected MCI, whereas 25% were self-referred following concerns about cognitive decline. Baseline assessments began in the year 2000, with subsequent waves of data collection initiated in 2002, 2004, and 2006. Over the follow-up period of two to six years, 84 participants received a clinical diagnosis of dementia (see Table 1). Further details regarding the sample composition, including comparisons between individuals with stable MCI and those who converted to dementia, are presented in Table 2.
Table 1. Frequency of dementia diagnoses at each follow-up in the Gothenburg MCI study (n = 84)

a Etiology could not be determined.
Note.
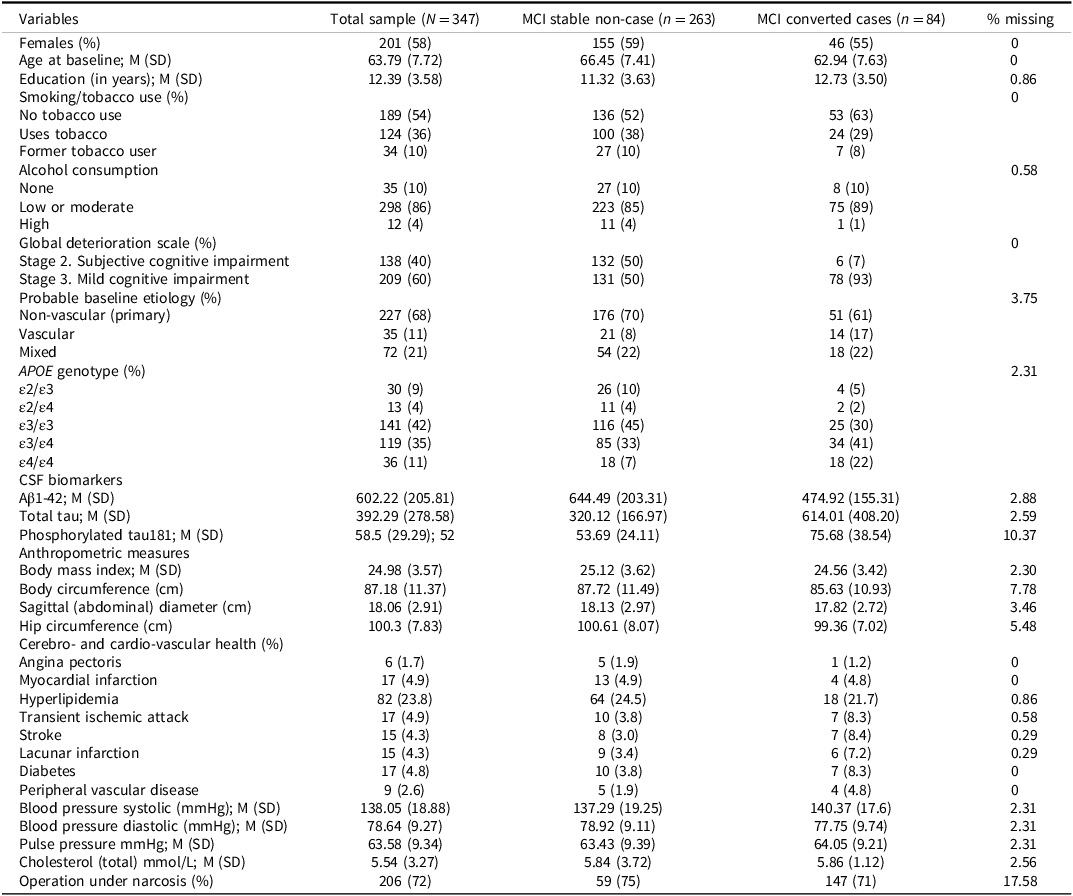
Table 2. Descriptive statistics for variables included in the machine learning prediction analysis of dementia conversion among individuals with mild cognitive impairment (MCI; excluding cognitive tests variables)

The study was approved by the Regional Ethical Review Board in Gothenburg, Sweden (diary numbers: L091-99 and T479-11), and was conducted in accordance with the principles of the Declaration of Helsinki (1975, as revised). Written informed consent was obtained from all participants prior to their inclusion in the study.
Diagnosis of dementia disease
In patients who converted to dementia, the specific diagnoses were established using well-recognized clinical criteria. Alzheimer’s disease (AD) was diagnosed according to the Diagnostic and Statistical Manual of Mental Disorders criteria for dementia, Third Edition, Revised (DSM-III-R; American Psychiatric Association, 1987), in conjunction with the NINCDS-ADRDA criteria for probable AD (McKhann et al., Reference McKhann, Drachman, Folstein, Katzman, Price and Stadlan1984). More specifically, for an AD diagnosis, the patient had to have a predominant parietotemporal lobe syndrome and no, or insignificant, cerebrovascular pathology on magnetic resonance imaging (MRI). Vascular dementia (VaD) was diagnosed based on the National Institute of Neurological Disorders and Stroke and Association Internationale pour la Recherché et l’Enseignement en Neurosciences (NINDS-AIREN) criteria (Román et al., Reference Román, Tatemichi, Erkinjuntti, Cummings, Masdeu, Garcia and Scheinberg1993) and by the criteria for subcortical VaD proposed by Erkinjuntti et al. (Reference Erkinjuntti, Inzitari, Pantoni, Wallin, Scheltens, Rockwood, Roman, Chui and Desmond2000). The latter emphasizes predominant impairments in executive functioning, processing speed, and gait, together with magnetic resonance imaging (MRI) evidence of cerebrovascular pathology judged to impose a significant burden on brain function. Mixed dementia (combined AD and VaD) was diagnosed in individuals who met the NINCDS-ADRDA criteria for AD and also demonstrated cerebrovascular changes on MRI, though not of a severity deemed to cause major cerebral burden independently. Less common dementia subtypes were diagnosed using established consensus criteria: frontotemporal dementia (FTD) according to Neary et al. (Reference Neary, Snowden, Gustafson, Passant, Stuss, Black, Freedman, Kertesz, Robert, Albert, Boone, Miller, Cummings and Benson1998), Lewy body dementia (LBD) according to McKeith et al. (Reference McKeith, Perry and Perry1999), and primary progressive aphasia (PPA) according to Gorno-Tempini et al. (Reference Gorno-Tempini, Hillis, Weintraub, Kertesz, Mendez, Cappa, Ogar, Rohrer, Black, Boeve, Manes, Dronkers, Vandenberghe, Rascovsky, Patterson, Miller, Knopman, Hodges, Mesulam and Grossman2011). A diagnosis of non ultra descriptum was assigned when the patient fulfilled the general criteria for clinical dementia, but did not meet the specific diagnostic criteria for any recognized dementia subtype. Importantly, information from cognitive assessments or other variables later used as predictors in the ML models was not incorporated into the clinical diagnostic decision-making process.
Identification of MCI
Global deterioration scale. Cognitive impairment was assessed using the Global Deterioration Scale (GDS; Auer & Reisberg, Reference Auer and Reisberg1997), which rates the severity of cognitive decline across seven stages. In the present study, only stages 2 and 3 were included: stage 2 reflects subjective cognitive impairment, and stage 3 corresponds to MCI. Stage 1, indicating cognitively healthy individuals, and stages 4–7, reflecting dementia stages, were not represented (i.e., at baseline) in this sample. Detailed information on the GDS assessment procedure within the Gothenburg MCI study is provided in Wallin et al. (Reference Wallin, Nordlund, Jonsson, Lind, Edman, Göthlin, Stålhammar, Eckerström, Kern, Börjesson-Hanson, Carlsson, Olsson, Zetterberg, Blennow, Svensson, Öhrfelt, Bjerke, Rolstad and Eckerström2016).
Probable baseline etiology. At baseline, all patients were assessed for probable etiological subtype based on vascular burden (i.e., the level of systemic and cerebrovascular risk factors) and classified into one of three categories: (1) vascular etiology, (2) mixed etiology, or (3) nonvascular etiology (i.e., primary degenerative etiology). This method differs from that of the assessment of the specific dementia diagnosis, which is based on cerebral manifestations without taking into account systemic manifestations. For further details, see Wallin et al. (Reference Wallin, Nordlund, Jonsson, Lind, Edman, Göthlin, Stålhammar, Eckerström, Kern, Börjesson-Hanson, Carlsson, Olsson, Zetterberg, Blennow, Svensson, Öhrfelt, Bjerke, Rolstad and Eckerström2016).
Neuropsychological assessments
The cognitive assessments followed the recommendations of the American Academy of Neurology, covering the domains of learning and memory, speed and attention, visuospatial ability, language, and executive functions. Multiple tests were included within each domain to obtain a comprehensive profile of cognitive functioning.
Learning and memory were measured using the Rey Auditory Verbal Learning Test (RAVLT; Geffen et al., Reference Geffen, Butterworth and Geffen1994), Wechsler Logical Memory Test (WLM; Wechsler, Reference Wechsler1987), and Rey Complex Figure (RCF; Meyers & Meyers, Reference Meyers and Meyers1995) delayed recall.
Speed and attention were assessed using the Digit Symbol Substitution and Digit Span subtests from the Wechsler Adult Intelligence Scale–Revised (WAIS-R; Wechsler, Reference Wechsler1981), along with Trail Making Tests A and B (Reitan, Reference Reitan and Wolfson1985).
Visuospatial ability was evaluated with the Rey Complex Figure copy task (Meyers & Meyers, Reference Meyers and Meyers1995), the Block Design subtest from the WAIS-R (Wechsler, Reference Wechsler1981), and the Silhouettes subtest from the Visual Object and Space Perception Battery (VOSP; Binetti et al., Reference Binetti, Cappa, Magni, Padovani, Bianchetti and Trabucchi1996).
Language function was assessed using the Token Test (Part V; Bandera et al., Reference Bandera, Capitani and Della Sala1985), the Boston Naming Test (Kaplan & Weintraub, Reference Kaplan and Weintraub1983), Word Fluency (FAS; Crossley et al., Reference Crossley, D’Arcy and Rawson1997), the Similarities subtest from the WAIS-R (Wechsler, Reference Wechsler1981).
Executive functions were evaluated using a range of tasks including Parallel Serial Mental Operations (PaSMO; Nordlund et al., Reference Nordlund, Rolstad, Hellström, Sjögren, Hansen and Wallin2005), Dual Task performance (Della Sala et al., Reference Della Sala, Baddeley, Papagno, Spinnler, Grafman, Holyoak and Boller1995), the computerized short version of the Wisconsin Card Sorting Test (WCST-CV64; Paolo et al., Reference Paolo, Axelrod, Tröster, Blackwell and Koller1996), and the Victoria version of the Stroop Test (Spreen & Strauss, Reference Spreen and Strauss1998).
General cognitive function was also evaluated using the Mini-Mental State Examination (MMSE; Folstein et al., Reference Folstein, Folstein and McHugh1975) and the Cognitive Estimation Test (CET; Shallice & Evans, Reference Shallice and Evans1978).
Testing was carried out across two sessions of approximately one to two hours each, alternating verbal and non-verbal tasks to minimize fatigue and test contamination. Special attention was given to avoid interference with memory assessments between immediate and delayed recall phases. Six trained psychologists administered the tests using a standardized procedure. About one-quarter of the sample received the Block Design, Similarities, and Digit Symbol Substitution subtests from the WAIS-III battery, while the remaining three-quarters completed the corresponding subtests from the older WAIS-R version. To integrate results across test versions and avoid extensive missing data imputation, raw scores from these tests were z-score transformed and combined. Additional details regarding the cognitive tests and their application within the Gothenburg MCI Study are available in Nordlund et al. (Reference Nordlund, Rolstad, Hellström, Sjögren, Hansen and Wallin2005).
Other predictors
Smoking and alcohol. Smoking and alcohol consumption were assessed through interviews conducted by a memory clinic physician or nurse. Participants were asked about their use of tobacco products, smoking habits, and alcohol consumption, and the responses were recorded by the clinician. Tobacco use was categorized as no tobacco use/smoking, current tobacco use/smoking, or former tobacco user/current non-smoker. Alcohol consumption was classified into three categories: none, low or moderate consumption, and high consumption. No specific quantitative thresholds were predefined for these categories.
Cerebrospinal fluid biomarkers. CSF was obtained via lumbar puncture at the L3/L4 or L4/L5 interspace using a 22-gauge Quincke needle. Approximately 20 mL of CSF was collected into polypropylene tubes after discarding the initial fraction to avoid blood contamination. Samples were sent to the Clinical Neurochemistry Laboratory at Sahlgrenska University Hospital, Mölndal, where they were gently mixed, centrifuged at 2,000 g for 10 minutes at room temperature, and aliquoted into labeled polypropylene tubes. Aliquots designated for AD core biomarker analysis – amyloid-β1–42 (Aβ42), total tau (T-tau), and phosphorylated tau (P-tau181) – were stored at −20°C for a maximum of one week prior to analysis. The remaining CSF was stored at −80°C.
The core CSF AD biomarker concentrations were measured using commercially available enzyme-linked immunosorbent assays (INNOTEST, Fujirebio, Ghent, Belgium) in accordance with established protocols (Andreasen et al., Reference Andreasen, Hesse, Davidsson, Minthon, Wallin and Winblad1999; Blennow et al., Reference Blennow, Wallin, Agren, Spenger, Siegfried and Vanmechelen1995; Vanmechelen et al., Reference Vanmechelen, Vanderstichele, Davidsson, Van Kerschaver, Van Der Perre, Sjögren, Andreasen and Blennow2000). All analyses were conducted by board-certified laboratory technicians under a standardized laboratory quality control program to ensure consistency and reliability (Palmqvist et al., Reference Palmqvist, Zetterberg, Blennow, Vestberg, Andreasson, Brooks and Hansson2014). To minimize between-assay variability, two or more internal control samples (aliquots of pooled CSF) were included in each analytical run. All procedures for lumbar puncture, pre-analytical handling, and biomarker analysis adhered to standardized protocols (Blennow et al., Reference Blennow, Hampel, Weiner and Zetterberg2010) and were conducted under accreditation by the Swedish Board for Accreditation and Conformity Assessment.
Apolipoprotein E. APOE genotyping in blood was performed at baseline using minisequencing, as previously described (Blennow et al., Reference Blennow, Ricksten, Prince, Brookes, Emahazion, Wasslavik, Bogdanovic, Andreasen, Båtsman, Marcusson, Nägga, Wallin, Regland, Olofsson, Hesse, Davidsson, Minthon, Jansson, Palmqvist and Rymo2000).
Cerebrovascular, cardiovascular, and metabolic health markers. History of angina pectoris, myocardial infarction, peripheral vascular disease, hyperlipidemia, transient ischemic attack, and stroke was recorded at the baseline clinical investigation. Diabetes was defined according to the 2006/2011 World Health Organization diagnostic criteria (Rydén et al., Reference Rydén, Grant, Berne, Cosentino, Danchin, Deaton, Javier, Hans-Peter, Heikki, Michel, Nikolaus, Linda, Jan, Carlo, Petar, Miguel, Marja-Riita, Michal and Xuereb2013) as having a fasting plasma glucose level ≥7.0 mmol/L (126 mg/dL), a two-hour plasma glucose level ≥11.1 mmol/L (200 mg/dL) during an oral glucose tolerance test, or ongoing treatment with oral antidiabetic medication and/or insulin therapy.
Anthropometric measures. Body mass index was calculated as weight in kilograms (measured after an overnight fast and with light clothing) divided by height in meters squared (kg/m2). Waist circumference was measured at the midpoint between the lower margin of the last palpable rib and the top of the iliac crest, using a non-stretchable measuring tape, with the participant standing and breathing out gently. Hip circumference was measured at the widest portion of the buttocks, with the tape held horizontally without compressing the skin. Sagittal abdominal diameter was measured in the supine position at the level of the iliac crest using a sliding-beam abdominal caliper, after a normal expiration. This measurement reflects abdominal height and serves as an indicator of visceral adiposity.
Cholesterol. Total blood cholesterol (mmol/L) was measured from fasting venous blood samples collected between 08:00 and 10:00 a.m. Analyses were conducted at the Clinical Chemistry Laboratory at Sahlgrenska University Hospital using standardized enzymatic methods.
Pulse and blood pressure. Blood pressure (BP) was measured in the sitting position after 10–15 minutes of rest. Two measurements were taken using an automated oscillometric device, and the mean of the two readings was used in the analyses. Systolic blood pressure (SBP) and diastolic blood pressure (DBP) were recorded in mmHg. Pulse pressure (PP) was calculated as the difference between systolic and diastolic blood pressure (PP = SBP − DBP). Information about operation under narcosis was derived from medical records.
Machine learning algorithms and model training
To evaluate and compare the performance of multiple ML algorithms in predicting dementia conversion, we used the caret (classification and regression training) package in R (Kuhn, Reference Kuhn2008), which streamlines data preprocessing, model training, and performance evaluation. The following classification algorithms were implemented: logistic regression, linear discriminant analysis (LDA; Fisher, Reference Fisher1936), naïve Bayes (Hand & Yu, Reference Hand and Yu2001), k-nearest neighbors (KNN; Cover & Heart, Reference Cover and Hart1967), least absolute shrinkage and selection operator (LASSO; Tibshirani, Reference Tibshirani1996), ridge regression (Hoerl & Kennard, Reference Hoerl and Kennard1970), elastic net regression (Zou & Hastie, Reference Zou and Hastie2005), decision tree (Breiman et al., Reference Breiman, Friedman, Olshen and Stone1984), random forest (Breiman, Reference Breiman2001), gradient boosting (Friedman, Reference Friedman2001), and support vector machine (SVM; Cortes & Vapnik, Reference Cortes and Vapnik1995), following standard workflow (see e.g., James et al., Reference James, Witten, Hastie and Tibshirani2021).
Model performance was evaluated using leave-one-out cross-validation (LOOCV), a resampling method well-suited for small to moderately sized datasets. In this approach, each observation serves once as the test set, while the remaining n-1 cases form the training set. Within each training set, we performed internal resampling to tune hyperparameters, ensuring that the held-out test case was never used during model selection. This corresponds to a form of nested LOOCV, where the inner loop tunes the hyperparameters and the outer loop evaluates prediction error on each left-out subject. This approach prevents data leakage and yields unbiased performance estimates, reducing both bias and variance in model evaluation.
Data preprocessing, including standardization and missing data imputation, was conducted within the caret framework. Missing values accounted for 7.8% of the total data, primarily due to study design constraints, where certain cognitive tests were occasionally omitted for time-related reasons. Missing values were handled using k-nearest neighbor imputation (k = 5), implemented via the caret package. Imputation was performed within each LOOCV training fold only, such that the imputation model was estimated using the training data and then applied to the held-out observation, thereby preventing data leakage. Where required, predictors were centered and scaled prior to model fitting. For algorithms requiring hyperparameter tuning (KNN, LASSO, ridge, elastic net, decision tree, random forest, gradient boosting, and SVM), tuning grids were specified and optimized within the LOOCV procedure. Model performance was evaluated using multiple classification metrics, including accuracy, Cohen’s Kappa, area under the receiver operating characteristic curve (AUC-ROC), F1-score, sensitivity, specificity, and the confusion matrix. Model calibration was additionally assessed using the calibration intercept and slope, obtained by fitting a logistic regression of the observed outcome on the logit of the model predicted probabilities, as well as Brier scores, which were computed as the mean squared difference between the predicted probabilities and the observed outcomes.
Results
Dementia diagnosis across follow-up visits
The frequency of dementia diagnoses across the three follow-up visits at years two, four, and six is presented in Table 1. Out of the 347 MCI patients at baseline, 84 (24%) received a dementia diagnosis during the follow-up period. Among these, 38 individuals (45%) were diagnosed with AD, 18 (21%) with VaD, 21 (25%) with mixed dementia (combined AD and VaD), 2 (2.4%) with LBD, 1 (1.2%) PPA, and 4 (4.8%) received a diagnosis of dementia of unknown etiology. None of the participants received a diagnosis of FTD. For the ML prediction models, the dementia outcome variable was coded as binary. Individuals who received any dementia diagnosis were coded as one, and those who remained stable were coded as zero. We further reiterate that none of the baseline predictors used in the ML classification was incorporated into the diagnostic decision-making.
Descriptives of predictors
Tables 2 and 3 present descriptive statistics for the predictor variables used in the ML models. Table 2 includes non-cognitive variables such as demographic characteristics (sex, age, and education), lifestyle factors (tobacco and alcohol use), clinical evaluations (GDS), APOE genotype frequency, baseline clinical etiology evaluation, CSF biomarkers, anthropometric data, cardiovascular and cerebrovascular health indicators, and information regarding past surgeries involving anesthesia.
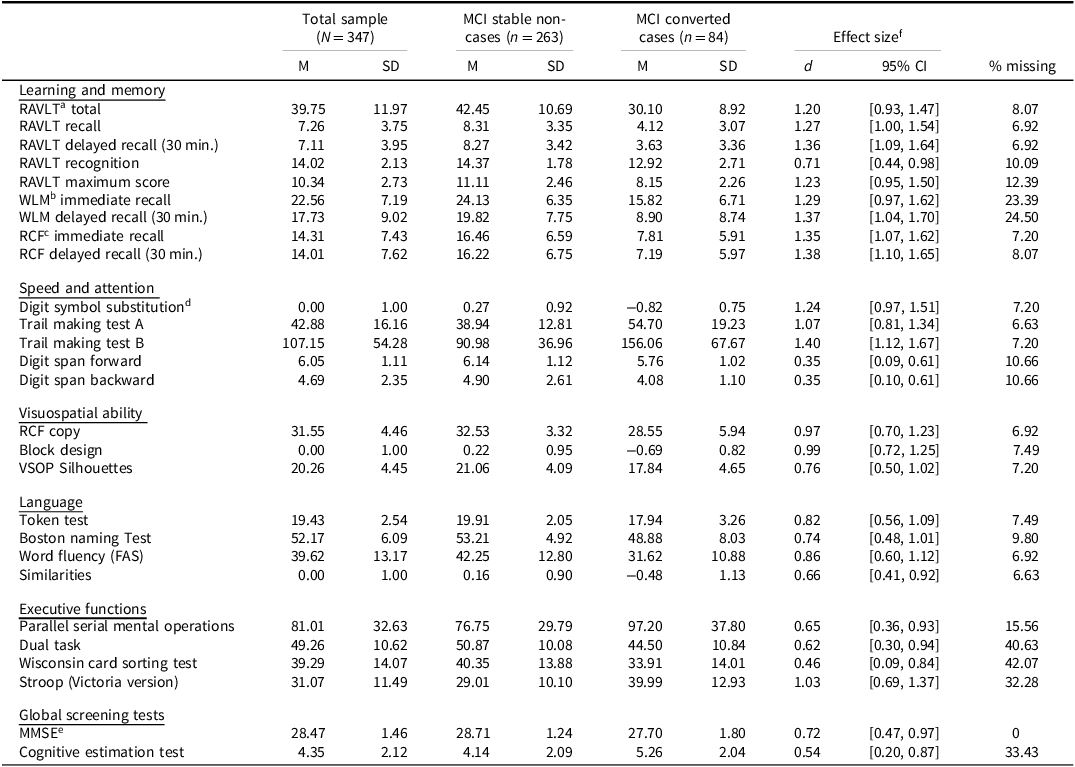
Table 3. Descriptive statistics for the neuropsychological cognitive test variables included in the machine learning prediction analyses of dementia conversion among individuals with mild cognitive impairment (MCI)

a Rey Auditory Verbal Learning Test.
b Wechsler Logical Memory.
c Rey Complex Figure.
d Digit Symbol Substitution. The Block Design, Digit Symbol Substitution, and Similarities were transformed to a z-score scale.
e Mini Mental State Examination.
f Cohen’s d effect size using pooled standard deviations.
Notes.
Table 3 summarizes cognitive test performance, organized by the following domains: learning and memory; speed and attention; visuospatial ability; language; and executive function. Information about global cognitive performance measures, including the MMSE and the CET are also presented. Cohen’s d effect sizes comparing converters to non-converters suggest substantial baseline group differences. For example, the memory domain tests showed large effect sizes (d > 1.2), with similarly large effects observed in mental speed (d = 1.07 to 1.4), and visuospatial ability (d = 0.76 to 0.99). Among non-cognitive variables, high effect sizes were noted for CSF biomarkers: Aβ42 (d = 0.88, 95% CI [0.62, 1.14]), T-tau (d = 0.79, 95% CI [0.51, 1.06]), and P-tau181 (d = 1.18, 95% CI [0.92, 1.45]). The GDS also demonstrated large group differences at baseline.
Machine learning prediction model performance
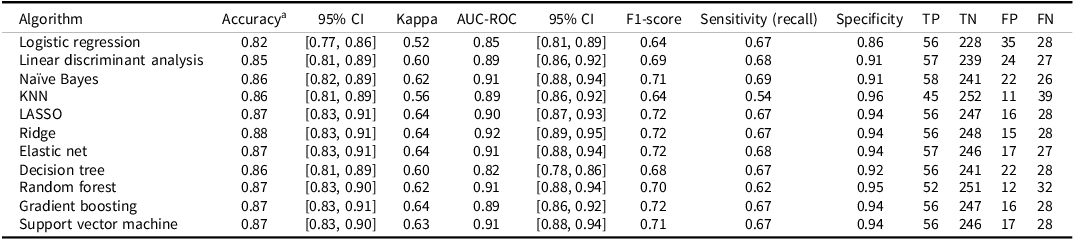
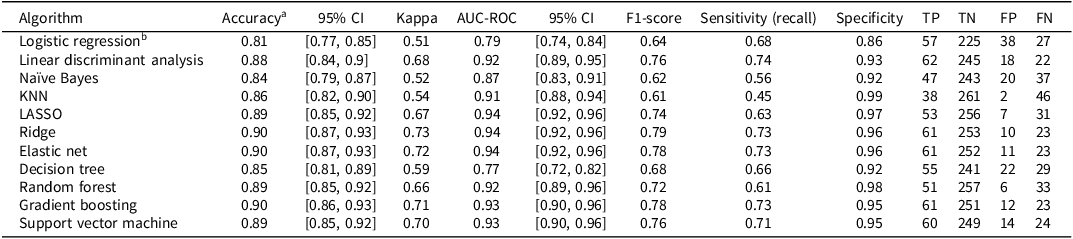
Performance metrics for each ML algorithm are summarized in Table 4. Across models, classification accuracy ranged from 0.82 to 0.88, Cohen´s kappa from 0.52 to 0.64, AUC from 0.82 to 0.92, and F1 from 0.64 to 0.72. Most models demonstrated high specificity (0.86 to 0.96) but relatively lower sensitivity (i.e., recall; 0.54 to 0.68). A summary of the calibration statistics is provided in Supplementary Table S1.
Table 4. Performance of machine learning algorithms in predicting dementia diagnosis two to six years after baseline among individuals with mild cognitive impairment (MCI; N = 347; prevalence = 84 cases, 24%)

Notes. aThe no-information rate was 0.76 (i.e., the accuracy obtained by always predicting the most common outcome, or no subsequent dementia diagnosis). All models were evaluated using leave-one-out cross validation (LOOCV). Missing data was handled using k-nearest neighbors (KNN) imputation with k = 5. The confusion matrix includes true positive (TP), true negative (TN), false positive (FP), and false negative (FN); LASSO: least absolute shrinkage and selection operator. Calibration statistics for these models are provided in Supplementary Table S1.
The regularized regression models (LASSO, ridge, and elastic net) performed well, each with accuracy of 0.87 or more, AUC values between 0.90 and 0.92, and Brier scores of 0.09 and 0.10. The elastic net model had the highest balanced accuracy ((0.68 + 0.94)/2 = 0.81). These models apply penalties to shrink or eliminate coefficients to avoid overfitting. The LASSO can reduce some coefficients to zero, effectively performing variable selection, the ridge shrinks coefficients toward zero without eliminating them, and elastic net combines both approaches. Given the observed prevalence of dementia (24%) in the MCI sample, the elastic net model achieved a positive predictive value (PPV) of approximately 0.78 and a negative predictive value (NPV) of approximately 0.90. This indicates that, when applied to a similar population, 78% of individuals predicted by the model to convert to dementia are expected to receive a future dementia diagnosis, while 90% of those predicted not to convert are expected to remain free of a dementia diagnosis. These values reflect the model’s practical utility in estimating an individual’s likelihood of future diagnostic outcomes based on the predicted conversion status.
Tree-based models also performed strongly. Random forest had an accuracy of 0.87 and AUC of 0.91 but showed lower sensitivity (0.62) but high specificity (0.95). The gradient boosting model had an AUC of 0.89, while the decision tree had higher sensitivity (0.67) but lower specificity (0.92). The SVM also performed well, with an accuracy of 0.87 and AUC of 0.91. Some models, like KNN, showed lower kappa (0.56) and poor sensitivity (0.54) but high specificity (0.96). Logistic regression and LDA had the poorest overall performance. The Naïve Bayes model yielded the highest sensitivity, though at the cost of somewhat lower specificity. The ROC for all of the algorithms are shown in Figure 1.

Figure 1. Receiver operating characteristic (ROC) curves for the machine learning algorithms predicting dementia conversion two to six years after baseline among individuals with mild cognitive impairment (MCI).
Variable importance
Figure 2 shows the standardized variable importance (relative to the top-ranked variable set at 100) for the ridge regression and random forest models. While random forest importance rankings will vary across runs due to its inherent randomness (bagging and feature sampling), consistent top predictors emerged. These included P-tau181, recall memory scores (RCF, RAVLT, WLM), mental speed (Digit Symbol Substitution, TMT-A, TMT-B), and executive function (Stroop Test). Aβ42 generally also ranked among the most important predictors. Overall, the strongest predictors of dementia conversion were cognitive measures of recall memory, speed, and executive function, along with CSF biomarkers, particularly P-tau181 and Aβ42. Comparable plots are provided in the Supplementary Material (Figures S1 to S3) for those algorithms for which variable importance ranking was feasible.

Figure 2. The 20 most important variables for predicting subsequent dementia conversion two to six years after baseline among individuals with mild cognitive impairment (MCI) in the ridge regression and random forest models. Variable importance was standardized relative to the most important variable. Comparable plots for the other models are presented in the Supplementary Material (Figures S1–S3).
Inclusion of cognitive delta scores
The findings presented in Table 4 indicate that most of the evaluated algorithms achieved relatively high specificity (>0.90) but lower sensitivity (<0.70). In an effort to improve sensitivity, we extended the models by incorporating measures of change in cognitive performance, using delta scores calculated as the difference between follow-up (T2) and baseline (T1) cognitive test results. The performance of these enhanced models is summarized in Table 5 (see also calibration statistics in Supplementary Table S1).
Table 5. Performance of machine learning algorithms in predicting dementia diagnosis two to six years after baseline among individuals with mild cognitive impairment (MCI), including cognitive delta scores (N = 347; prevalence = 84 cases, 24%)

Notes. aThe no-information rate was 0.76 (i.e., the accuracy obtained by always predicting the most common outcome, or no subsequent dementia diagnosis). bThe logistic regression model did not converge when delta scores were included. All models were evaluated using leave-one-out cross validation (LOOCV). Missing data was handled using k-nearest neighbors (KNN) imputation with k = 5. The confusion matrix includes true positive (TP), true negative (TN), false positive (FP), and false negative (FN); LASSO: least absolute shrinkage and selection operator. Calibration statistics for these models are provided in Supplementary Table S1.
Among these models, ridge and elastic net regression yielded the highest classification performance, both achieving overall accuracy above 0.90, AUC values exceeding 0.94, and Brier score of 0.08. Specifically, the elastic net model achieved a specificity of 0.96 and a sensitivity of 0.73, representing an improvement from 0.68 in the elastic net model without delta scores. Similarly, the ridge model showed a sensitivity of 0.73, up from 0.67 in its non-delta counterpart. The ridge model slightly outperformed the elastic net by correctly classifying one additional non-converter. The gradient boosting model also performed strongly, with an accuracy of 0.90, AUC of 0.93, specificity of 0.95, sensitivity of 0.73, and Brier score of 0.09. It identified the same number of true converters as the ridge and elastic net models but misclassified one additional non-converter compared to the elastic net model. Figure 3 displays the ROC curves for the ML algorithms incorporating cognitive delta information. These results illustrate substantial gains in discriminative ability when change scores are considered in the modeling process.

Figure 3. Receiver operating characteristic (ROC) curves for the machine learning algorithms predicting dementia conversion two to six years after baseline among individuals with mild cognitive impairment (MCI), based on models including cognitive delta (i.e., difference) scores. The logistic regression model did not converge when delta scores were included.
Variable importance when using delta scores
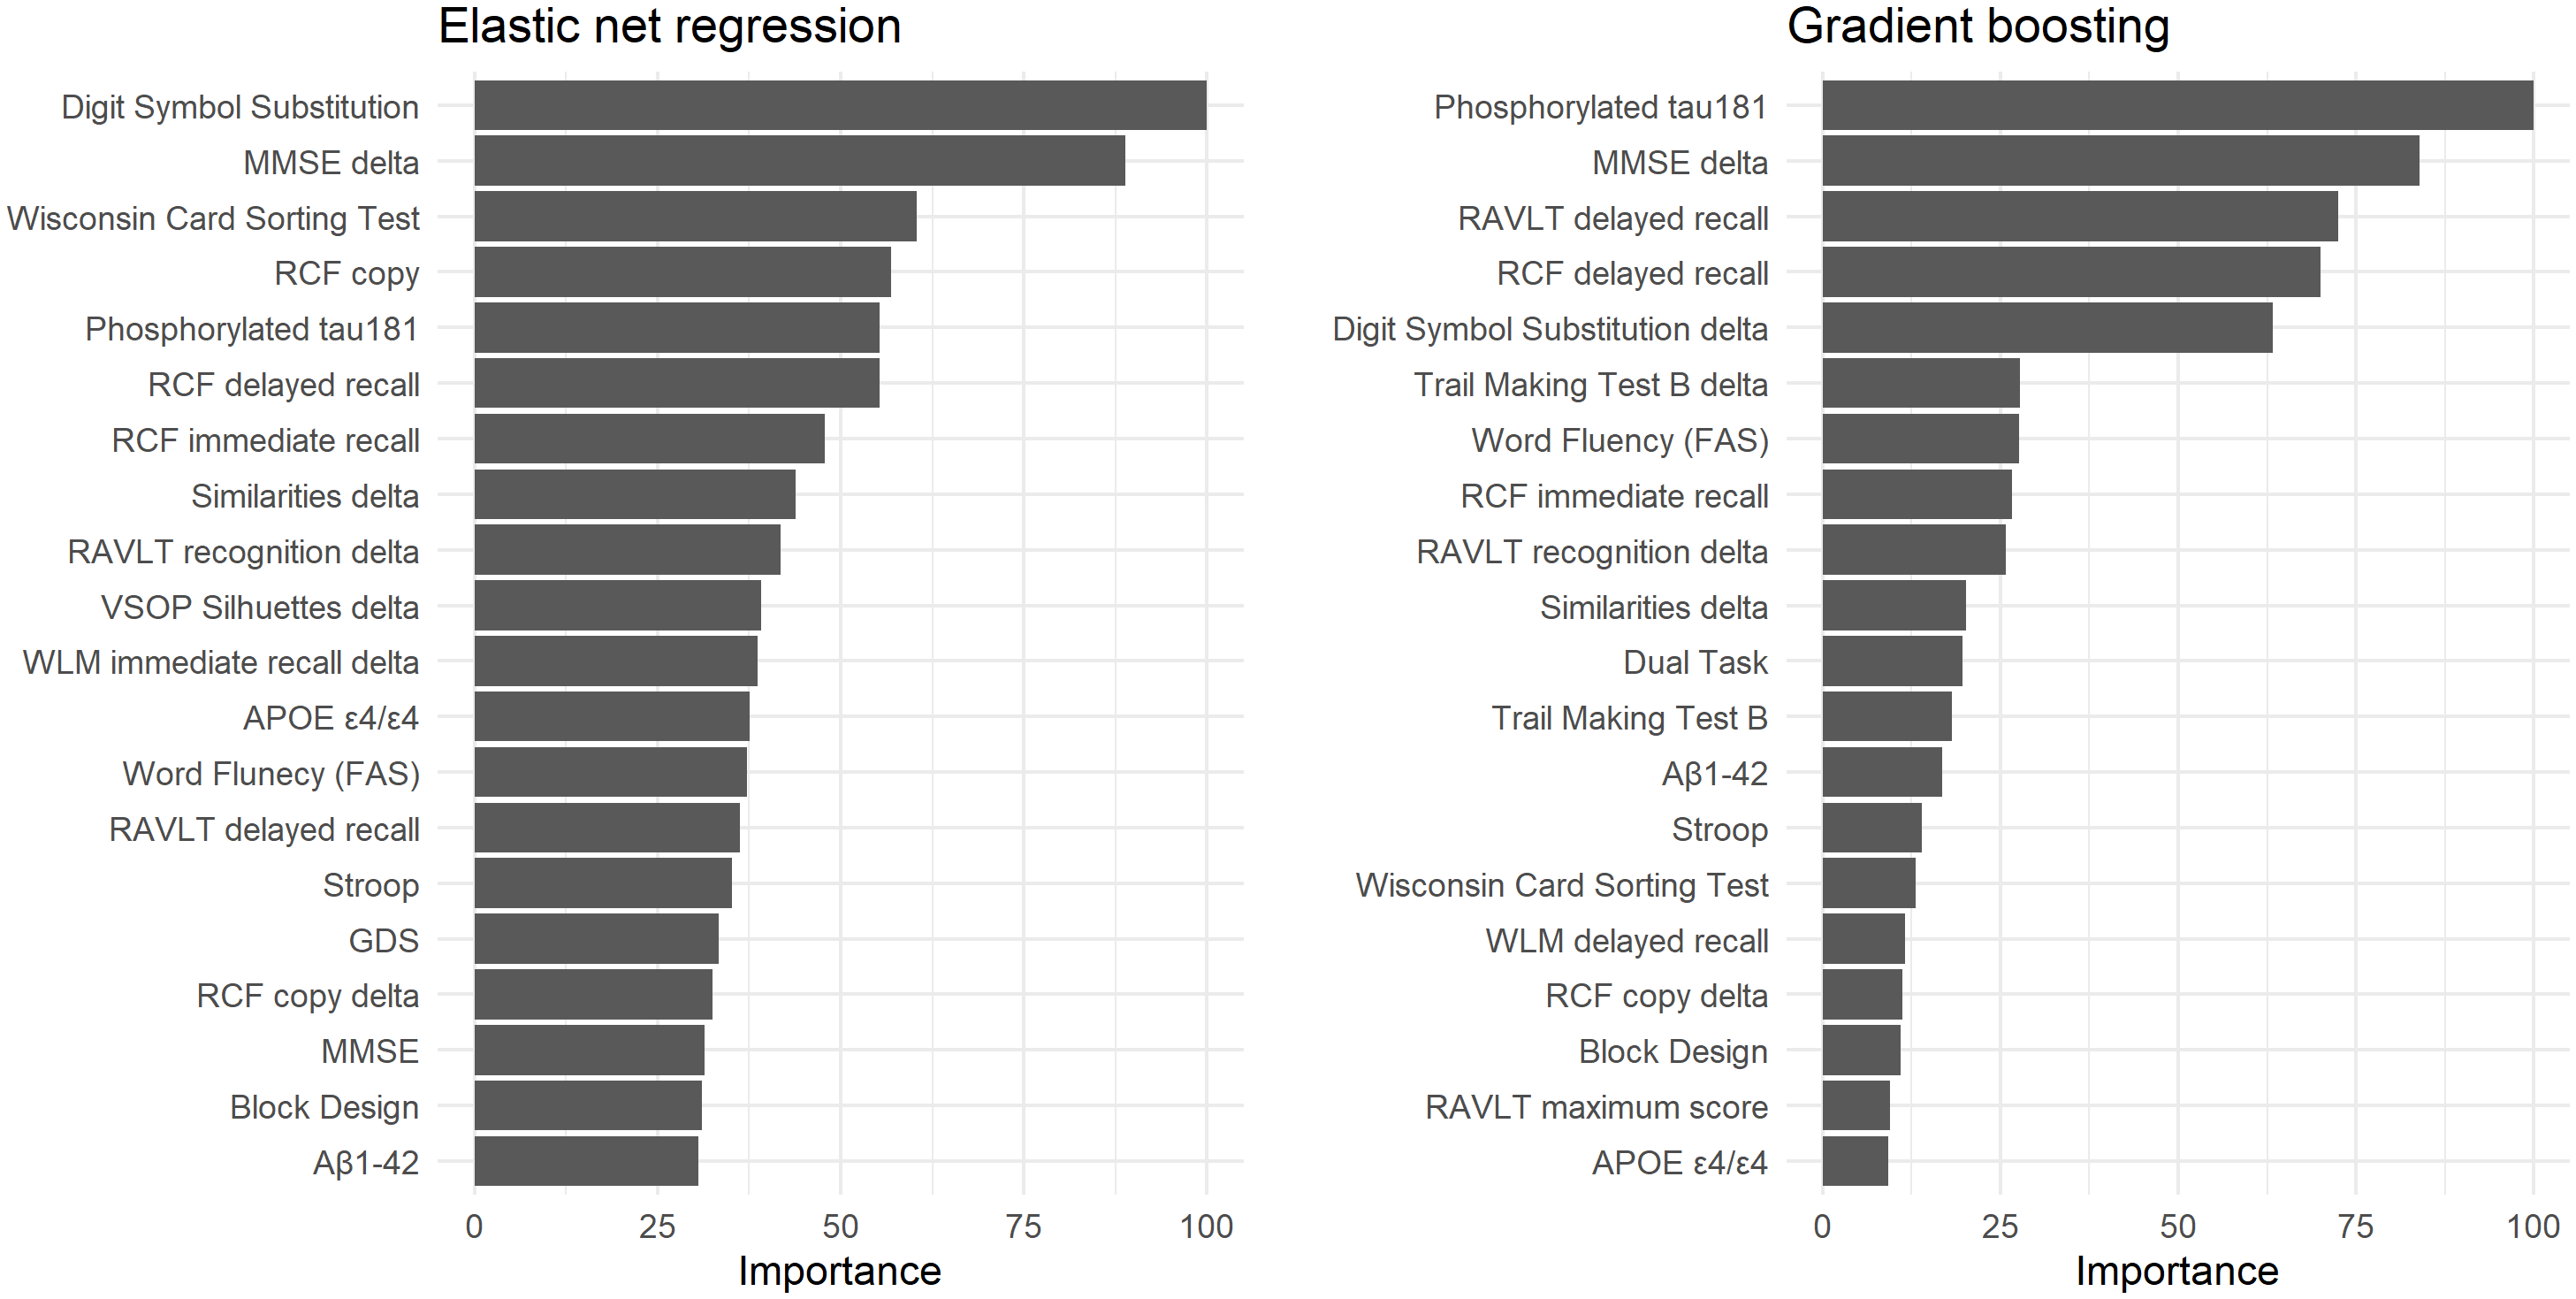
Variable importance rankings for the elastic net and gradient boosting models are shown in Figure 4. Consistent with earlier models (those not incorporating delta scores), the most influential predictors included cognitive measures of memory, processing speed, and executive functioning, as well as CSF biomarkers such as P-tau181. Notably, several delta scores contributed meaningfully to predictive performance, for example changes in MMSE and the Similarities test. Comparable plots are provided in the Supplementary Material (Figures S4 to S6) for the other algorithms where such ranking could be derived.

Figure 4. The 20 most important variables for predicting subsequent dementia conversion two to six years after baseline among individuals with mild cognitive impairment (MCI) in the elastic net regression and gradient boosting models that included the cognitive delta (i.e., difference) scores as predictors. Variable importance was standardized relative to the most important variable. Comparable plots for the other models are presented in the Supplementary Material (Figures S4–S6).
Finally, using the observed dementia prevalence of 24% in the MCI sample, and the elastic net model’s specificity (0.96) and sensitivity (0.73), we calculated a positive predictive value (PPV) of 0.85 and a negative predictive value (NPV) of 0.92. This indicates that, in a population with similar prevalence, individuals predicted to convert to dementia have an 85% probability of receiving a future dementia diagnosis, while those predicted not to convert have a 92% probability of remaining dementia-free.
Discussion
In this study, we aimed to evaluate the accuracy of ML algorithms in predicting future dementia conversion among individuals diagnosed with MCI, using clinically available baseline data and cognitive follow-up information. Our findings demonstrate that accurate and meaningful prediction of dementia conversion is feasible. Specifically, several ML algorithms, particularly regularized regression models, such as elastic net and ridge regression, achieved high levels of accuracy (up to 90%) and excellent discrimination (AUC-ROC > 0.94), with sensitivity and specificity values suggesting practical utility in identifying both converters and non-converters.
One key finding across models was the relatively high specificity (often > 0.90) compared to lower sensitivity (typically < 0.70), a pattern observed in previous studies using ML for dementia prediction in MCI populations (e.g., Bucholc et al., Reference Bucholc, Titarenko, Ding, Canavan and Chen2023; Massetti et al., Reference Massetti, Russo, Franciotti, Nardini, Mandolini, Granzotto, Bomba, Delli Pizzi, Mosca, Scherer, Onofrj and Sensi2022). This discrepancy is partly driven by class imbalance, with converters comprising only 24% of our sample. As a result, models tend to favor the majority, non-converting class, which inflates specificity. Nevertheless, the best-performing models, particularly the elastic net and ridge regression when enhanced with cognitive change scores, demonstrated improved sensitivity (0.73), highlighting the value of incorporating longitudinal data into predictive modeling.
Comparing our model performance to previous studies, our results appear relatively strong and, in some cases, comparable to or exceeding earlier findings. For instance, the ridge regression model (excluding cognitive delta scores) achieved an AUC-ROC of 0.92, an accuracy of 0.88, and a Cohen’s kappa of 0.64, indicating high discrimination and substantial agreement beyond chance, despite the modest number of converters (n = 84). These values align closely with those reported by Guo et al. (Reference Guo, Sun, Yang, Ma, Wang, Zheng, Wang and Li2024), who found AUC of 0.92 for two-year prediction and 0.89 for six-year prediction of dementia conversion based on clinical prediction scores. In contrast, Chang & Brainerd (Reference Chang and Brainerd2022), using latent neuropsychological and MRI factors, in addition to CSF, reported an AUC of 0.86 for a two-year prediction window, highlighting the strength of our neuropsychological and CSF-based model even without imaging. Furthermore, the inclusion of cognitive delta scores substantially improved performance across models. For example, in the elastic net model, sensitivity increased from 0.68 to 0.73, with accuracy rising to 0.90 and AUC reaching 0.94. These results underscore the predictive utility of changes in cognitive performance, which captures dynamic processes of decline that precede a formal dementia diagnosis (Hall et al., Reference Hall, Lipton, Sliwinski and Stewart2000; Wilson et al., Reference Wilson, Beckett, Bennett, Albert and Evans1999).
Model comparisons further illuminate the mechanisms underlying performance differences. Regularized regression methods (LASSO, ridge, and elastic net) consistently outperformed traditional statistical approaches such as logistic regression and LDA. This reflects their capacity to handle high-dimensional and multicollinear data, mitigate overfitting, and capture complex relationships through penalization strategies. In contrast, logistic regression and LDA, both linear models without built-in regularization, are more sensitive to multicollinearity and model bias, which limits their utility in heterogeneous clinical datasets.
Tree-based models showed variable performance depending on model complexity. While the simple decision tree performed modestly, the random forest and gradient boosting models yielded excellent AUC values (0.91 and 0.89, respectively) and high specificity, although sensitivity remained modest. This pattern reflects the known strengths and weaknesses of tree-based methods: Random forests reduce variance through bagging but may struggle with capturing rare outcomes, while boosting improves bias reduction but may overfit without careful tuning. The relatively poorer performance of the simple decision tree reflects a lack of pruning and regularization, causing it to fit noise rather than meaningful patterns.
Our study extends prior ML work on forecasting dementia conversion from MCI by partly replicating earlier findings while addressing key gaps. Most previous evaluations have relied on large, population-based cohort, whereas we analyzed a clinical sample. This offers a more direct view of generalizability and clinical transportability given the case-mix, comorbidities, and referral patterns typical of practice. A further contribution is our extensive neuropsychological test battery, which included multiple cognitive domains to a greater extent than is usual and provides evidence that such a battery can improve prediction relative to minimalist cognitive screens. Importantly, we also incorporated information about individual differences in change over time (i.e., delta scores), moving beyond the predominantly cross-sectional information used in many prior studies.
Variable importance
In terms of variable importance, the most influential predictors were consistent across models. Measures of delayed recall memory (e.g., RCF, RAVLT, and WLM), processing speed (e.g., Digit Symbol, TMT-A/B), and executive function (e.g., Stroop) were highly ranked, aligning with prior findings that these domains decline early in the dementia trajectory (Howieson et al., Reference Howieson, Carlson, Moore, Wasserman, Abendroth, Payne-Murphy and Kaye2008; Thorvaldsson et al., Reference Thorvaldsson, MacDonald, Fratiglioni, Winblad, Kivipelto, Laukka, Skoog, Sacuiu, Guo, Östling, Börjesson-Hanson, Gustafson, Johansson and Bäckman2011). Among the CSF biomarkers, P-tau181 emerged as the most critical predictor, followed by Aβ42. These markers are well-established indicators of Alzheimer’s disease pathology and have been shown to correlate with cognitive impairment severity and progression (see e.g., Nelson et al., Reference Nelson, Alafuzoff, Bigio, Bouras, Braak, Cairns, Castellani, Crain, Davies, Tredici, Duyckaerts, Frosch, Haroutunian, Hof, Hulette, Hyman, Iwatsubo, Jellinger, Jicha and Beach2012; Thorvaldsson et al., Reference Thorvaldsson, Nordlund, Reinvang, Blennow, Zetterberg, Wallin and Johansson2010). Interestingly, APOE ϵ4 carrier status contributed relatively little to the prediction, possibly because its effect is more pronounced earlier in the disease course or because its predictive utility is captured indirectly through CSF and cognitive variables.
Importantly, delta scores in cognition, especially changes in recall memory, MMSE and Similarities, substantially improved prediction. The finding that change in Similarities, a measure of crystallized intelligence, contributed meaningfully to prediction supports work suggesting that decline in crystallized abilities may signal neurodegeneration, even when static (baseline) performance remains within normal limits (Thorvaldsson et al., Reference Thorvaldsson, MacDonald, Fratiglioni, Winblad, Kivipelto, Laukka, Skoog, Sacuiu, Guo, Östling, Börjesson-Hanson, Gustafson, Johansson and Bäckman2011). This reinforces the importance of repeated cognitive measurements in clinical follow-up, particularly for capturing subtle intraindividual decline that may not be evident from a single time point assessment.
Across algorithms, a relatively small subset of the 54 candidate predictors consistently drove performance, appearing at the top of the importance rankings. These were primarily CSF biomarkers (i.e., P-tau181 and Aβ42) and neuropsychological measures (i.e., episodic memory, processing speed, and executive functioning). Many other variables were repeatedly down ranked and contributed little to increment value, suggesting that a more parsimonious predictor panel is both feasible and desirable for clinical use. Importantly, most of these core measures are already collected at many memory clinics, and emerging blood-based assays are likely to further enhance the practicality.
Limitations
The principal limitation is the small sample size (N = 347; converters n = 84), which increases the risk of overfitting and high variance, potentially yielding unstable coefficients and feature importance and may lead to inflated cross-validation estimates. A direct consequence of the small sample, especially the low counts within each diagnostic subtype, is that we were unable to reliably evaluate subtype-specific prediction. Replication in larger, preferable multi-site, cohorts is warranted to obtain more precise and generalizable performance estimates. A second limitation is the absence of brain imaging data (e.g., structural MRI, fluorodeoxyglucose positron emission tomography, amyloid/tau PET), which could capture neurodegeneration and pathology more precisely. Third, we lack ambulatory assessments that track short-term fluctuation and change. Finally, although the diagnostic evaluations were conducted by approximately the same team of clinicians throughout the study period, we cannot entirely exclude the possibility of minor variations in diagnostic procedures, which could introduce subtle inconsistencies in case classification.
Future research
While our models performed well, improving sensitivity remains a key challenge for future research. Enhancing sensitivity is critical for clinical applications, where the cost of false negatives (i.e., missed converters) can be substantial. Future efforts might explore the inclusion of additional longitudinal data (e.g., frequent ambulatory cognitive assessments via smartphone apps) to better capture early signs of decline (Nicosia et al., Reference Nicosia, Aschenbrenner, Balota, Sliwinski, Tahan, Adams, Stout, Wilks, Gordon, Benzinger, Fagan, Xiong, Bateman, Morris and Hassenstab2023; Polk et al., Reference Polk, Öhman, Hassenstab, König, Papp, Schöll and Berron2025; Öhman et al., Reference Öhman, Hassenstab, Berron, Schöll and Papp2021). High-resolution, temporally dense data may help to characterize short-term variability and early drift, which traditional assessments miss (Nesselroade, Reference Nesselroade, Downs, Liben and Palermo1991). Moreover, including neuroimaging biomarkers (Ewers et al., Reference Ewers, Sperling, Klunk, Weiner and Hampel2011; Mohammed & Malhotra, Reference Mohammed and Malhotra2025), genetic risk scores (Najar et al., Reference Najar, Thorvaldsson, Kern, Skoog, Waern, Zetterberg, Blennow, Skoog and Zettergren2023; de Rojas et al., Reference de Rojas, Moreno-Grau, Tesi, Grenier-Boley, Andrade, Jansen, Pedersen, Stringa, Zettergren, Hernández, Montrreal, Antúnez, Antonell, Tankard, Bis, Sims, Bellenguez, Quintela, González-Perez and Ruiz2021), and digital behavioral phenotyping (Knox et al., Reference Knox, Aghamoosa, Heider, Cutty, Wright, Scherbakov and Obeid2025; Kourtis et al., Reference Kourtis, Regele, Wright and Jones2019) may further improve individualized prediction.
It is also worth noting that the CSF biomarker P-tau181 provided the strongest signal among fluid markers, perhaps because of its closer relationship to neurofibrillary tangle pathology and cognitive symptoms than Aβ42. In parallel, there is rising interest in blood-based biomarkers (Hansson et al., Reference Hansson, Blennow, Zetterberg and Dage2023; Palmqvist et al., Reference Palmqvist, Tideman, Cullen, Zetterberg, Blennow, Stomrud, Janelidze, Mattsson-Carlgren and Hansson2021) which sensitively index tau accumulation and align well with established CSF and imaging measures. Because blood sampling is substantially easier and less invasive than CSF via lumbar puncture and imaging, these assays are scalable for large longitudinal cohorts and may become especially valuable features for ML models predicting conversion from MCI to dementia. Furthermore, the dominant role of delayed recall memory tests underscores the centrality of episodic memory in the early manifestation of AD and its strong predictive utility in identifying at-risk individuals.
Lastly, our findings underscore the importance of calculating predictive values (PPV and NPV) in the context of the actual prevalence. For instance, based on our sample’s dementia conversion rate (24%), the elastic net model performance translates to a PPV of 0.85 and NPV of 0.92. These values suggest that the model would be clinically informative. When it predicts future dementia, it is likely correct in 85% of cases, and when it predicts stability, it is correct in 92% of cases. However, these estimates will vary with base rates, and recalibration may be needed for different MCI populations.
Conclusion
Taken together, our results demonstrate that ML models, especially those incorporating regularization and cognitive change scores, can accurately predict dementia conversion in MCI patients using clinical data. Key predictors include CSF P-tau181, delayed recall memory, and cognitive processing speed. Enhancing prediction, particularly sensitivity, will likely depend on the integration of repeated measures and novel data streams, moving us closer to reliable, individualized dementia risk assessment in clinical practice.
Supplementary material
The Supplementary Material for this article can be found at https://doi.org/10.1017/S135561772510177X.
Funding statement
This work was supported by grants from the Riksbankens Jubileumsfond (P21-0112), Konung Gustaf V:s och Drottning Victorias Frimurarestiftelse, Demensfonden, Anna-Lisa och Bror Björnssons stiftelse, Axel Linders Stiftelse, Stiftelsen Handlanden Hjalmar Svenssons forskningsfond, Stiftelsen familjen Nils Winbergs fond, Maud & Birger Gustavssons Stiftelser, Agneta Prytz-Folkes och Gösta Folkes stiftelse, Gun och Bertil Stohnes Stiftelse, Gunvor och Josef Anérs stiftelse, Stiftelsen Längmanska kulturfonden, Kungliga Vetenskaps- och Vitterhetssamhället i Göteborg, Stiftelsen Psykiatriska Forskningsfonden, Magnus Bergvalls Stiftelse, Stiftelsen för Gamla Tjänarinnor, Syskonen Svenssons Fond För Medicinsk Forskning, Greta och Einar Askers stiftelse, Wilhelm & Martina Lundgrens Vetenskapsfond, Åhlénstiftelsen, and by the Swedish state: ALFGBG-965744, ALFGBG-724331, and ALFGBG-720661.
Competing interests
The authors report no conflicts of interest.


 Open access