

Introduction
The European Union (EU) is today more powerful than ever, addressing a broad array of policy challenges ranging from poverty and unemployment to environmental degradation and crisis management. This article seeks to enhance our understanding of a central precondition for effective European policy making: public support for the EU. The support of those who are governed by it enables the EU to gain governments’ support for ambitious policy goals and achieve domestic compliance with international policy. In light of this, the EU has an interest in alleviating its ‘democratic deficit’ since it undermines its capacity to address problems effectively (Caldeira & Gibson Reference Caldeira and Gibson1995), just as any other political institution depends on public support to solve problems (Weber Reference Weber1978 [1922]; Suchman Reference Suchman1995; Dellmuth & Tallberg Reference Dellmuth and Tallberg2015). Yet, despite growing interest among scholars (e.g., Hooghe & Marks Reference Hooghe and Marks2005; Maier et al. Reference Maier, Adam and Maier2012; Harteveld et al. Reference Harteveld, Meer and De Vries2013; Armingeon & Ceka Reference Armingeon and Ceka2014; Chalmers & Dellmuth Reference Chalmers and Dellmuth2015) and practitioners (e.g., Barca Reference Barca2009; Van Rompuy Reference Rompuy2012) in public support for the EU, we know little about how far the EU can build public support in its institutions.
We offer a statistical analysis of how far the EU can influence public support for European integration through public investment. When, how and why is the EU able to shape public support for the EU through spending? The answer to these questions is critical to our understanding of the determinants of public support for the EU, the ability of the EU to legitimise itself through public policies and the controversy about fiscal redistribution through the EU budget now taking place.
We make two principal contributions to the study of public opinion towards the EU and other regional and international organisations. First, we develop an argument about the effects of the fit between supranational spending priorities and regional economic circumstances on public support for the EU. The argument is in two parts. To begin with, spending that accommodates regional economic needs, whether they be related to public services, infrastructure, human capital endowment or the labour market, can positively shape how individuals in that region think about spending and, in turn, the EU. The better the fit between spending and economic need, the greater we expect the concerned individuals’ support for the EU to be. This line of reasoning is underpinned by broader insights related to policy feedback mechanisms in comparative politics and the economic impact of European integration (e.g., Pierson Reference Pierson1993; Thelen Reference Thelen1999; Pierson & Skocpol Reference Pierson, Skocpol, Katznelson and Milner2002; Campbell Reference Campbell2003; Ellis & Faricy Reference Ellis and Faricy2011). Moreover, we expect the nature of spending policies to affect how likely it is that the fit between spending and economic need matters for public opinion formation toward the EU. As redistributive spending is relatively salient and characterised by high conflict when compared to distributive spending, we expect it to be more likely that individuals’ support for the EU will depend on the fit between European spending and economic need in redistributive spending areas. We develop this argument on the basis of a broader literature on public policy spending (e.g., Lowi Reference Lowi1964; Wilson Reference Wilson1973; Ripley & Franklin Reference Ripley and Franklin1991; Smith & Larimer Reference Smith and Larimer2009; Cairney Reference Cairney2011).
Second, we compare the effects on support for the EU of European spending targeting multiple policy areas in EU regions, such as employment, social inclusion, transport, infrastructure, agriculture, energy and environment. For this purpose, we compile a unique dataset encompassing 127 EU regions in 13 member states during the period 2001–2011, which includes, for the first time, actual payment data and not, as commonly used in the literature, funding committed to regions at the beginning of a financial period (cf. Dellmuth Reference Dellmuth2011). The evidence strongly endorses our argument. We find that support is a function of the fit between regional economic need and policy areas targeted by EU spending in three of five areas: human capital, infrastructure and environment. Moreover, we find these moderating effects of economic need in those spending areas that are redistributive and not distributive in character. More generally, we demonstrate that economic theories of support for the EU need to be substantially refined to identify the impact of distributional consequences or economic benefits on attitudes toward the EU.
EU spending, policy feedback and public support for the EU
There is no paucity of literature on the determinants of citizen support for the EU. Economic theories explain support as a function of an individual's rational evaluation of the economic costs and benefits of the EU. Support is related to how the EU impacts an individual's pocketbook, either in terms of personal wellbeing or the relative economic performance of their region or country (e.g., Eichenberg & Dalton Reference Eichenberg and Dalton1993; Anderson & Reichert Reference Anderson and Reichert1995; Gabel Reference Gabel1998; Christin Reference Christin2005). Identity theories, by contrast, show how individuals with trenchant exclusive, national identities tend to be less supportive of the EU than those with inclusive, communal and European identities (e.g., McLaren Reference McLaren2002; De Vreese & Boomgarden Reference Vreese and Boomgaarden2005; Hooghe & Marks Reference Hooghe and Marks2005; Chalmers & Dellmuth Reference Chalmers and Dellmuth2015). For other scholars, the ideological positions taken up and disseminated by key domestic political actors can shape or ‘cue’ an individual's support for the EU.Footnote 1 Cognitive heuristics when evaluating supranational institutions have also been shown to matter. Several studies argue that citizens who know relatively little or nothing tend to form opinions about the EU based on their general experiences of domestic political institutions (e.g., Rohrschneider Reference Rohrschneider2002; Muñoz et al. Reference Muñoz, Torcal and Bonet2011; Harteveld et al. Reference Harteveld, Meer and De Vries2013; Armingeon & Ceka Reference Armingeon and Ceka2014). Finally, scholars have also pointed out that support is conditional on an individual's awareness of political processes and policies (e.g., Inglehart Reference Inglehart1970; Eichenberg & Dalton Reference Eichenberg and Dalton1993; Karp et al. Reference Karp, Banducci and Bowler2003). Factors like education and political awareness are closely intertwined in increasing knowledge about political institutions beyond the nation‐state (Norris & Inglehart Reference Norris and Inglehart2009), potentially inducing a global ‘skill revolution’ (Rosenau Reference Rosenau2003) and leading to learning that is supportive of dominant values toward European political institutions (e.g., Inglehart Reference Inglehart1970; Caldeira & Gibson Reference Caldeira and Gibson1995; Harteveld et al. Reference Harteveld, Meer and De Vries2013).
Despite providing a compelling picture explaining support for the EU, existing studies still tend to give short shrift to important variation in the EU's spending policies. While a central finding in existing studies is that greater fiscal transfers correlate with greater levels of public support (Anderson & Reichert Reference Anderson and Reichert1995; Gabel & Palmer Reference Gabel and Palmer1995; Karp et al. Reference Karp, Banducci and Bowler2003; Hooghe & Marks Reference Hooghe and Marks2005; Harteveld et al. Reference Harteveld, Meer and De Vries2013), these studies do not theorise this link, failing to make a distinction between the various types of funding that constitute these net transfers. Instead, previous work lumps together any number of spending strategies and policies carried out by the EU. This is a particularly grave oversight for funds transferred via the European Structural and Investment Funds (ESIF), which consist of multiple financial instruments with fiscal transfers targeting specific policy areas. Furthermore, the positive relationship between net benefits and support for the EU might also – and perhaps primarily – reflect the actual influence of a third unobserved variable: EU public investment in European subnational regions,Footnote 2 which is highly correlated with net benefits of countries from the EU budget (Chalmers & Dellmuth Reference Chalmers and Dellmuth2015). Exposed to the economic circumstances in their immediate regional social and economic environment, citizens might reward the EU with greater support for the receipt of European public investment in their region. Moreover, we know from the literature on policy feedback mechanisms that citizens might not care equally about all existing forms of public spending (e.g., Campbell Reference Campbell2003; Ellis & Faricy Reference Ellis and Faricy2011; Mettler Reference Mettler2011). Hence, as previous research treats European spending policies as a single, monolithic entity, it remains unclear how far the EU's ability to enhance citizens’ support for the EU varies across policy areas.
Our argument in this article is that understanding the impact of the EU's spending policy on support requires a more nuanced approach to the degree to which spending is appropriate given regional economic need. We assume that individuals care about whether public capital is spent appropriately given social and economic need in that individual's region. The extent to which the money that is transferred accommodates the needs of a region will influence whether the amount of money transferred influences the support for the EU of people living in that region. This insight marks a considerable advance on existing EU studies. In developing a theoretical framework, we find guidance in the well‐established literature on policy feedback mechanisms.
Effects of EU spending and economic need on support for the EU
Building on the seminal work of Schattschneider (Reference Schattschneider1935) and Lowi (Reference Lowi1964), recent scholarship demonstrates when and how policies influence individuals’ behaviours and attitudes (Wilson Reference Wilson1973; Pierson Reference Pierson1993; Thelen Reference Thelen1999; Pierson & Skocpol Reference Pierson, Skocpol, Katznelson and Milner2002). A central insight in this literature is that policy has a causal effect. For Pierson (Reference Pierson1993), policies affect behaviours and attitudes insofar as they can generate recipient constituencies with incentives to protect constituencies’ benefits accrued from policies. More recent scholarship takes this a step further, examining how policies convey information to beneficiaries and how this, in turn, affects recipients’ attitudes and behaviours. To a large extent, the successful transmission of this information is dependent on the nature and content of the policy itself – for example, the size of the policy benefits or their duration (Campbell Reference Campbell2003). For the most part, scholars have approached policy characteristics in terms of policy traceability. Neoliberal and rational choice theories have long held that constituents tend to reward legislators primarily for delivering on easy‐to‐observe benefits, such as new spending programmes, especially those related to private rather than common or shared goods (Soss Reference Soss1999, 2000; Campbell Reference Campbell2003; Morgan & Campbell Reference Morgan and Campbell2011). Even efficient and popular policies do not benefit from the same boost if they remain abstract, inconspicuous or have long‐term common good benefits. An equally large literature on pork‐barrel politics provides further support for the basic idea that discernible benefits matter for the ability of politicians to increase public support through the spending of public capital, both in the context of domestic (e.g., Golden & Picci Reference Golden and Picci2008) and EU spending (e.g., Dellmuth & Stoffel Reference Dellmuth and Stoffel2012).
Policy feedback scholars provide specific evidence about the effects of policy traceability on public attitudes and behaviours. For instance, Arnold (Reference Arnold1990) explains how policies that can be discernably traced back to specific government action tend to have greater feedback effects than policies that have no clear link to government actions. Similarly, several scholars of American politics have examined important differences in ‘high visibility’ direct spending programmes versus ‘low visibility’ tax breaks. Ellis and Faricy (Reference Ellis and Faricy2011) show how direct spending programmes in the United States tend to garner more public support than indirect programmes (like tax expenditures) simply because they are more visible to the public. Similarly, Mettler (Reference Mettler2011) explains how social policy benefits delivered through the American tax code as tax breaks tend to not be recognised by recipients as government benefits, but are instead part of an ever expanding ‘submerged state’ infrastructure. Importantly, these submerged policies do not generate the same kind of attention to government action as do traceable direct spending programmes.
Recent research into policy feedback mechanisms, however, acknowledges that feedback effects are not simply a matter of policy discernibility and traceability. Instead, the economic circumstances of beneficiaries also matter. For example, Soss and Schram (Reference Soss and Schram2007) assess policy feedback in terms of how individuals evaluate specific spending programmes. Some programmes are ‘distant’ insofar as individuals tend to think they will never draw on these benefits. Other programmes are ‘proximate’, allowing individuals to identify as potential (future) beneficiaries. Hence, attitudes about policies depend on the fit between the spending policy and an individual's specific economic circumstances. Any informational effects of specific policies are therefore conditional on the economic circumstances of the recipient of this information.
The central insight to be garnered from existing studies is that spending matters for individual opinion formation, but only insofar as spending policies are adequate given the specific economic circumstances of an individual. Any supportive attitudes towards the EU that are linked to spending policies are affected by the fit between how funds are spent and a region's immediate economic needs. The greater the fit between the two, the more transfers will be visible to the individuals receiving them and the more likely they will be traced back to the EU. This leads to our first hypothesis:
H1: Individuals support the EU more the more regions in which they live receive ESIF in ways that address regional need.
Assumptions about the fit between spending and regional economic need rest on a central causal mechanism: an individual's knowledge of policy characteristics. Just like voting behaviour (Campbell Reference Campbell2012: 337), attitudes of support might be conditionally linked to spending polices through other, more stable factors like knowledge of the policies. At one level, citizens’ only need to possess rudimentary knowledge to trace spending back to the EU. If they are not knowledgeable, they might rely on other heuristics to form their opinions. For instance, individuals only need to link broader macroeconomic local trends to EU integration. This level of awareness is consistent with assumptions in previous EU literature about how support for the EU co‐varies with perceived changes to an individual's economic circumstances (Eichenberg & Dalton Reference Eichenberg and Dalton1993; Gabel & Palmer Reference Gabel and Palmer1995; Gabel Reference Gabel1998; Karp et al. Reference Karp, Banducci and Bowler2003) and European spending in individuals’ regions (Chalmers & Dellmuth Reference Chalmers and Dellmuth2015) and countries (Anderson & Reichert Reference Anderson and Reichert1995; Hooghe & Marks Reference Hooghe and Marks2005; Harteveld et al. Reference Harteveld, Meer and De Vries2013).
At another level, however, awareness is more precise, implying some specific knowledge of EU spending policies. While this sets the bar high for individual knowledge (see also Eichenberg & Dalton Reference Eichenberg and Dalton1993: 512), recent Flash Eurobarometer (FEB) polls from 2008, 2010, 2013 and 2015 paint a rather optimistic picture.Footnote 3 These polls show that, on balance, citizens are aware of ‘EU regional policy’ and ‘EU co‐financed projects’, with more than one‐third of respondents indicating knowledge of these policies in a given year. These same polls also show a consistent link between awareness of these spending measures and receipt of more funding. For instance, awareness tends to be much higher for individuals living in regions ‘that have been eligible for funds in previous years’ (FEB 2008: 5) and that are ‘eligible for support under the Convergence objective” (FEB 2010: 8; FEB 2013: 7; FEB 2015) which, compared to other funding objectives, constitutes the vast bulk of EU funding.
Awareness can be impacted by the nature of spending policies. Lowi's (Reference Maier, Adam and Maier2012) classic distinction between distributive and redistributive policies provides some insight, especially as it applies to the ESIF (see also Wilson Reference Wilson1973; Ripley & Franklin Reference Ripley and Franklin1991; Smith & Larimer Reference Smith and Larimer2009; Cairney Reference Cairney2011; for use in the case of the EU, see Bache Reference Bache, Jorgensen, Pollack and Rosamond2007).Footnote 4 Distributive policies typically involve spending on public goods, like national defence contracts, public land management and transportation. The costs of distributive spending are diffuse with no clear winners or losers. By targeting public goods, which are non‐rivalrous and non‐excludable, such spending tends to have low levels of salience among the public and invokes low levels of conflict among competing groups. Redistributive policies, by contrast, involve spending on so‐called ‘private goods’, like in the case of progressive income tax or non‐contributive welfare programmes. Spending on private goods is ‘rivalrous’ and ‘excludable’, drawing out a clear distinction between the ‘“haves” and the “have nots”’ (Lowi Reference Lowi1964: 328). Redistributive policies therefore tend to be highly salient invoking high levels of conflict among competing groups. In sum, the nature of spending policies should have a conditional effect on the relationship stated in our first hypothesis. This leads to a second hypothesis:
H2: The relationship posited in H1 is more likely in the case of redistributive spending than in the case of distributive spending.
Data and methodology
To examine the relative explanatory power of our hypothesis, we compile a dataset from a variety of sources. Since the hypotheses predict individual‐level effects on public support for the EU as factors at the regional level, our unit of analysis is a person in a specific region (in a specific country). At the individual level, we use Eurobarometer (EB) data to create an indicator for support for the EU. At the regional level, we measure EU funding in different spending categories by drawing on data provided by the European Commission's Directorate‐General for Regional and Urban Policy (DG Regio).Footnote 5 Other regional‐level as well as country‐level factors are derived from Eurostat (2016). Our analysis is restricted to the EB surveys conducted during the years for which indicators for all theoretical concepts are available. We use all EB data available for the purpose of our analysis, which yields yearly data from 2001 to 2011. The samples are representative at the level of those regions for which we have compiled the spending data.Footnote 6 We limit our analysis to 127 regions in the following 13 EU member states for which data for this time period are available: Austria, Belgium, Germany, Spain, Finland, France, Greece, Ireland, Italy, Netherlands, Portugal, Sweden and the United Kingdom. In what follows, we detail the measurement of the variables that are included in the empirical analysis.Footnote 7
Support for the EU, our dependent variable, is measured using the responses to the following EB question: ‘Generally speaking, do you think that (our country's) membership of the European Union is: (–1) a bad thing, (0) neither good nor bad, or (1) a good thing?’ In contrast to some alternative measures for public support for the EU, this measure is consistently asked yearly in the EB (cf. Hooghe & Marks Reference Hooghe and Marks2005). The validity of this measure has been widely debated in the literature, providing evidence that respondents who support EU membership generally also support more specific integrative measures (e.g., Gabel Reference Gabel1998). The variable thus captures citizens’ short‐term satisfaction with specific EU outputs as well as long‐term attachment to the EU that is not contingent upon the satisfaction with specific outputs, over time (Online Appendix Figure B1). It is currently the accepted measure for support for the process of supranational integration (Gabel & Scheve Reference Gabel and Scheve2007).
To test our hypotheses, we have gathered European spending data through the ESIF at the regional level in €1,000 per capita for two financial perspectives: 2000–2006 and 2007–2013.Footnote 8 These data are disaggregated across a broad range of spending items. To examine differences related to the nature of spending policies (H2), we coded spending into redistributive spending categories and distributive spending categories (Online Appendix Table A4).
Redistributive spending includes: (1) human capital, physical capital and innovation; (2) transport and infrastructure; and (3) environment. In line with Lowi's (Reference Lowi1964) typology, we code spending items in the redistributive spending category that we expect to be relatively salient and characterised by high conflict. Such spending typically targets specific societal groups, economic sectors or businesses. Winners and losers are easily identifiable as benefits are concentrated. In the human capital category, spending goes to specific sectors or businesses, implying high conflict about which sector or firm receives most. In transport, most spending targets specific local road or railway projects or specific sparsely populated regions that receive support for infrastructure such as broadband and telephone networks, introducing conflict among municipalities and regions. In the area of environment, funding targets typically relatively large nongovernmental organisations (NGOs) and environmental administrations that have extensive networks and experience, at the expense of smaller and less resourceful NGOs (see the lists of funded NGOs, 2001–2011, in DG Environment 2016).
Distributive spending includes: (4) energy; and (5) egriculture, forest, tourism and fishery.Footnote 9 Energy investment flows mainly to local and regional authorities that want to promote energy investment projects or programmes on electricity, gas, noise prevention and drinking water. Agricultural spending under the ESIF – in contrast to agricultural spending under the Common Agricultural Policy (CAP) – targets public goods such as agricultural water management, land improvement, re‐parcelling, planting of non‐farm land, improving harvesting of forestry products, protection of the coast and encouragement of tourist activities. In both categories, it is hard to find losers as benefits are diffuse, which is why we code spending items in these categories as distributive.
The data on ESIF allocations cannot be broken down by year. Moreover, data on actual allocations for different spending categories for each year cannot be coded ‘bottom‐up’ using investment project data for the different regions. Instead, DG Regio provides data on the amounts spent in different policy areas only for aggregate funding periods. We merge these spending data aggregated within the two funding periods to the yearly EB data, implying that the spending variables are time‐invariant within funding periods. While yearly spending data across spending categories would have been ideal, the data at hand are suitable for our purposes for two main reasons. First, we find the yearly variation in spending levels within funding periods to be very low when depicting the yearly variation in spending levels obtained from DG Regio, that are, as mentioned above, not disaggregated by spending categories (Online Appendix Figure B1). Spending levels over time are relatively even within funding periods, with only Greece and Portugal showing slightly more variegated patterns during the period 2000–2006. Consequently, we do not expect large fluctuations in yearly spending in different spending categories either that might predict EU support. Second, that spending is decided at the beginning of a funding period and barely fluctuates yearly, strengthens our research design. Given very limited yearly variation in regional spending, the assumption is warranted that politicians and EU officials do not try to spend EU funds strategically across regions to boost people's support for the EU within budgetary periods, but rather at the outset of a budgetary period (see also Dellmuth Reference Dellmuth2011). This reduces the risk of potential endogeneity problems in our analysis.
Next, we gather data on ‘regional economic need’ using specific regional‐level economic indicators from Eurostat (2016). We assume that the regional level is a good approximation of what people perceive to be their immediate social and economic context. Furthermore, as ESIF are allocated at the regional level, we deem this to be the appropriate unit of analysis in the context of this study. All of our remaining indicators are measured yearly and at the level of the regions that received transfers through the ESIF. For each EU spending category, we derive an annual regional economic need indicator from Eurostat (2016) that taps a central aspect of a region's specific economic needs. While there are not many measures at the regional level available for the entire time period and all countries that are being studied here, we were able to select a range of appropriate regional economic need indicators from Eurostat in terms of their logical fit with our spending policy data (see Online Appendix Table A4 for more details).
We measure regional economic need relevant for human capital investment by relying on an indicator that captures a central aspect of the labour market targeted by EU investment. This indicator measures High‐skilled employment – that is, the share of the population that has tertiary education and/or is employed in science and technology. The higher the share, the less urgent people may perceive the need for investment in the high‐skilled labour force. Second, we measure regional economic need relevant for infrastructure investment using two indicators that each taps a different aspect of EU infrastructure investment – namely, EU investment in infrastructure especially in rural and urban areas. Motorways measures all navigable road networks in kilometers per 1,000 km2, and indicates the need for infrastructure investment in rural areas. Less extensive road networks indicate more need for EU investment in infrastructure and transport. Third, we measure regional economic need relevant for agricultural spending using Utilised agricultural area measured in thousand hectares. This measure indicates the extension and importance of rural areas in a region. Fourth, our proxy for regional economic need relevant for energy spending is Population density. Since energy investment flows mainly into electricity, gas, noise prevention and drinking water (see Online Appendix Table A4), more densely populated areas may be perceived as being in greater need for energy‐related spending. Given the right‐skewed distribution with a few regions with extremely dense populations, we log this variable. Last, to capture regional economic need relevant for investment in the environment, we use a measure for the degree of a region's urbanisation as most environmental investment by the EU flows into densely populated areas to maintain high levels of sanitation, clean air and water to safeguard health, and to curb pollution. A region's geographical size is a good proxy for Rurality as relatively large areas tend to be less urbanised (cf. Dellmuth & Stoffel Reference Dellmuth and Stoffel2012). We assume that people perceive regions with relatively large rural areas to be in less need of environmental investment, which should make them more negatively predisposed to EU environmental subsidies.
Next, we operationalise several alternative explanations at the individual level that are commonly tested in the EU literature. First, economic theories are tested using an interaction term between respondents’ skill levels and gross domestic product (GDP). We use a dichotomous variable coded ‘1’ if a respondent is a Manual worker and ‘0’ if otherwise, and the variable is coded so as to distinguish between unskilled workers, on the one hand, and skilled manual workers and the remaining occupational categories, on the other (cf. Hooghe & Marks Reference Hooghe and Marks2005). Furthermore, we use GDP in purchasing power standards (PPS) per inhabitant for the respondents’ region. This measure captures GDP at the regional level, which is theoretically relevant as economic theories predict an effect of the distribution of economic resources on an individual's support for the EU, depending on the economic context in which the individual lives. Given the large economic disparities among regions within countries (Boldrin & Canova Reference Boldrin and Canova2001), it is warranted to use a regional measure.
Second, we examine the degree to which people have a European identity by combining two measures. Until 2009, we use a measure for geographical identity tapping people's attachment to a geographical jurisdiction that has been frequently used to measure identification with supranational communities or groups of people (e.g., Hooghe & Marks Reference Hooghe and Marks2005; Dellmuth & Tallberg Reference Dellmuth and Tallberg2015). From 2010, we coded the identity measure using responses to a question about the extent to which people feel that they are EU citizens. The resulting variable Identity ranges from ‘0’ (‘No, definitely not’) to ‘3’ (‘Yes, definitely’). This variable captures communal identity as an identity that is not a function of a common history or territory, but shaped or generated by a common liberal democratic constitution, such as the European treaties (e.g., Bruter Reference Bruter2004; Chalmers & Dellmuth Reference Chalmers and Dellmuth2015). Ideally, we would have used the same indicator for identity over time. However, since it is not consistently included in the EB, it is not included in the main regression tables but in the robustness checks reported below.
Third, to assess the logic of extrapolation argument, we use data on individual Trust in government: whether a respondent tends to (‘1’) or tends not to (‘0’) trust his or her national government.
Fourth, theories of political awareness are accounted for using an indicator for political Knowledge about the institution that is responsible for the implementation of EU spending: the European Commission. The measure is coded ‘1’ if the respondent has heard of the Commission and ‘0’ if otherwise.
Fifth, we control for Age (a continuous variable), Gender (a dichotomous variable that equals ‘1’ for females and ‘0’ for males) and Education. Education as a nine‐point indicator measuring at what age a respondent has finished formal education. It is coded ‘1’ if the respondent was 14 years or younger and ‘9’ if he or she was 22 years or older.
Finally, there might be temporal effects. To begin with, recent literature argues that the experience of the financial crisis has affected people's beliefs that the EU exerts its authority appropriately to address financial and economic problems (Serricchio et al. Reference Serricchio, Tsakatika and Quaglia2013). Our analysis includes time periods during which European economies were deeply affected by the global financial crisis. During this period and even in the aftermath, people might judge the EU differently. We capture potential unobserved temporal effects using a dummy variable that is ‘1’ for the years 2007–2009 (the period during which the crisis was most acuteFootnote 10) and ‘0’ otherwise. We explore potential effects of time trends in the data on our results further in the robustness checks.
We checked whether some of the variables might be highly correlated. This was only the case with the spending variables, which is why we do not enter them together in a concomitant model.Footnote 11
Empirical analysis
To test the relative explanatory power of our hypothesis, we estimate a series of multilevel regression analyses.Footnote 12 As Support takes on three ordered values, we estimate the models using ordered logistic regression. We add random intercepts at the regional and country levels as we expect responses to vary across regional and national contexts and since they capture the combined potentially unobserved regional and national context effects on Support. Our level 1 data are at the individual level, clustered in 127 regions (level 2) and 13 countries (level 3).Footnote 13
Our hypotheses build on several observable implications about the ways in which the fit between policy characteristics and regional economic need has an effect on public support for the EU. These observable implications are operationalised through interaction terms between spending variables and regional economic conditions that spending is supposed to improve. We present our main results in Tables 1 and 2. Specifically, we present results of the effects of ESIF spending on Support across the different spending categories in Table 1. Table 2 tests H1 and H2 by including a series of interaction terms reflecting the ‘fit’ between policy areas and regional economic need.
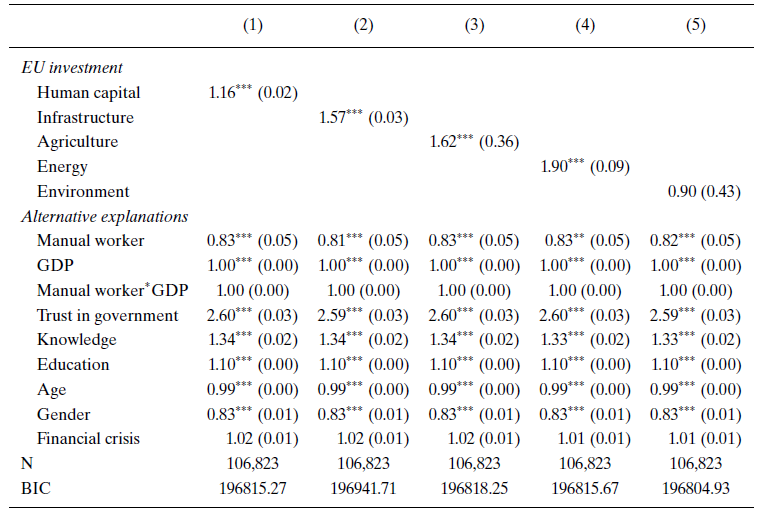
Table 1 Random intercept mixed‐effects three‐level models of support

Notes: Odds ratios with robust standard errors in parentheses. Significance levels: *p < 0.05; **p < 0.01; ***p < 0.001.
Table 2 Random intercept mixed‐effects three‐level models of support: Interaction terms
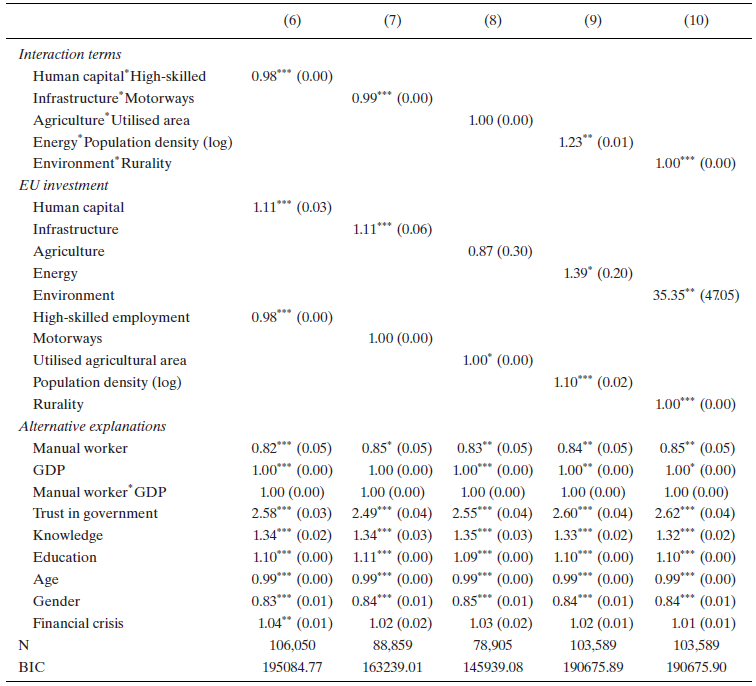
Notes: Odds ratios with robust standard errors in parentheses. Significance levels: *p < 0.05; **p < 0.01; ***p < 0.001.
Table 1 illustrates that four of the five spending areas have a statistically significant positive correlation with Support, whereas the coefficient of environment spending is not statistically significant. More specifically, the evidence suggests that people's support for the EU is greater the more funding their regions receive in the areas of human capital, physical capital, innovation, transport infrastructure, agriculture and energy. That not all forms of spending seem to shape support underpins the need for disaggregated analyses of spending effects, building on a broader literature showing that people do not care equally about all forms of spending (Campbell Reference Campbell2012).
Results in Table 2, by including a series of interaction terms to capture the conditional effect of ESIF on support, lend support to H1 in human capital, infrastructure and environment spending, as well as ample support to H2. The interaction terms capture the fit between spending policy characteristics, regional economic need and Support. To present our main findings, we plot all interaction terms from Table 2 as the coefficient of a product term included in non‐linear models does not allow for inferences about the significance of the marginal effect of one variable on another at the levels of a third variable (cf. Ai & Norton Reference Ai and Norton2003). Hence, we report the interaction terms using marginal effects plots (cf. Berry et al. Reference Berry, Golder and Milton2012).Footnote 14
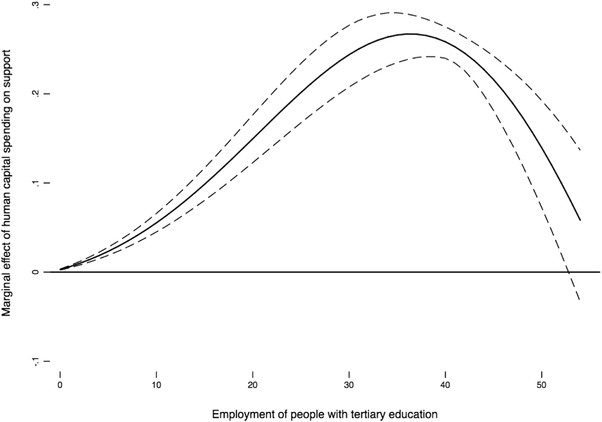
To begin with, Figure 1 depicts the marginal effect of Human capital spending on Support at different levels of the shares of high skilled employment (model 6). The solid line shows the estimated marginal effect on the probability that respondents pass a specific threshold s on the variable Support. The dashed lines indicate the bounds of the 95 per cent confidence interval for this estimate. Higher shares of high‐skilled employment indicate less need for human capital investment in high skilled labour, boosting innovation and research. Among regions in which this need is relatively high (i.e., at low shares of highly skilled people in labour), the effect of human capital spending on support increases in magnitude. By contrast, when need is relatively low, the effect of human capital spending on support decreases in size but remains positive in regions with an employment share of people with tertiary education of about 35 per cent or higher. The results from Figure 1 refine the finding in Table 1, suggesting that the positive effect of Human capital investment on support is stronger when need for human capital investment is relatively high, and weaker when need for human capital investment is relatively low or absent.

Figure 1. Effect of Human capital spending on support at levels of High‐skilled employment. Notes: Estimation based on model 6 in Table 2. Solid line depicts the marginal effect on support. Dashed lines depict the 95 per cent confidence intervals of the marginal effect.
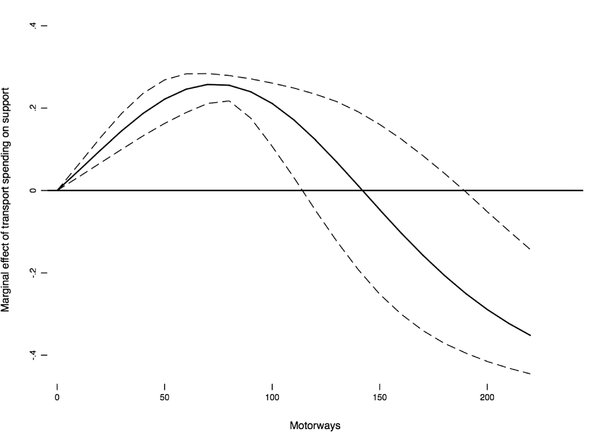
We see further evidence for our hypothesis when we look at fiscal transfers to infrastructure in transport (model 7). Figure 2 shows that the effect of fiscal transfers to infrastructure and transport on support for the EU is positive in regions with relatively few motorways – that is, more rural regions with relatively poor infrastructure. In regions with a relatively tight net of motorways, the link between investment in infrastructure and support is weakened and becomes eventually negative. Again, these findings refine the result about the effect of infrastructure spending on support, demonstrating that increases in Support depend on ESIF spending toward a region's infrastructure in a targeted manner.

Figure 2. Effect of Infrastructure spending on support at levels of Motorways. Notes: Estimation based on model 7 in Table 2. Solid line depicts the marginal effect on support. Dashed lines depict the 95 per cent confidence intervals of the marginal effect.
We do not find that the effect of EU agriculture spending on support shown in Table 1 is moderated by regional economic need (see Online Appendix Figure B3). Both regions with a very small utilised agriculture area like Antwerp, Berlin or London, and regions with a relatively large agricultural sector, such as in Extremadura, Champagne‐Ardenne or Saarland, receive agriculture subsidies through the ESIF. That the effect of agriculture spending on support does not depend on the degree of utilised agriculture area may be due to the fact that the EU invests relatively little money in agriculture in the form of regional development funds outside the CAP (see Online Appendix Figure B2). Finally, with respect to energy spending, the results from model 9 suggest that the effect of energy spending on support revealed in Table 1 is not moderated by economic need (see Online Appendix Figure B4).
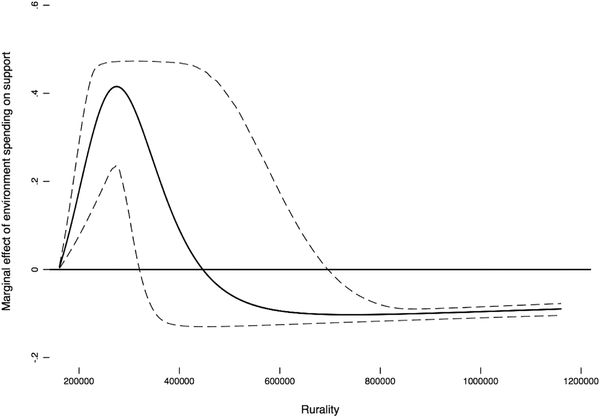
Discussing EU investment in the environment, we plot the interaction term from model 10 in Figure 3. As expected in H1 and H2, environmental spending has a positive effect on public support for the EU in relatively urbanised regions such as Berlin, London, Vienna or Brussels. However, the effect turns negative in regions that are in less need of environmental spending, indicating that environmental subsidies decrease support in relatively rural areas – that is, in areas that are less in need for EU environment subsidies targeting mostly water safety, clean air and pollution.

Figure 3. Effect of Environment spending on support at levels of Rurality. Notes: Estimation based on model 10 in Table 2. Solid line depicts the marginal effect on support. Dashed lines depict the 95 per cent confidence intervals of the marginal effect.
In sum, the evidence supports H1 in the areas of human capital, infrastructure and environmental spending, suggesting that in these areas EU spending increases public support for the EU if it targets regional need. Moreover, there is strong evidence supporting H2 as we find these moderating effects of regional need in the context of redistributive policy areas (human capital, transport and infrastructure) and not in distributive policy areas (energy and agriculture).
With regard to the alternative explanations, our results tie in well with previous research that shows that support for the EU is greater among the better educated (e.g., Chalmers & Dellmuth Reference Chalmers and Dellmuth2015), more knowledgeable (e.g., Harteveld et al. Reference Harteveld, Meer and De Vries2013) and trusting in domestic political institutions (e.g., Armingeon & Cheka Reference Armingeon and Ceka2014). Furthermore, support is greater among younger people, which may be explained by the fact that younger people are more cosmopolitan and are therefore more likely to perceive regional integration as a good thing (e.g., Inglehart & Rabier Reference Inglehart and Rabier1978). Finally, we do not find evidence for an effect of the crisis dummy, which suggests that temporal context factors do not affect support for the EU, all else being equal.
Robustness checks
We provide five robustness checks that assess the sensitivity of our results to alternative model specifications. We start with the results in the category of environment spending. Since the degree of Rurality is moderately highly correlated with Population density (log) (r = −0.57; N = 230,285), we run a robustness check with a cruder proxy for rurality: Waste production in regions, which is moderately highly correlated with Rurality (r = 0.37; N = 71,433), as larger more rural areas produce more waste, but largely uncorrelated with Population density (log) (r = 0.15; N = 71,433). This latter measure, however, is only available for 78 out of 127 regions, and for ten of our 13 countries (Finland, Greece and Sweden are excluded). This change in model specification does not affect the interpretation of our results, as they suggest that the positive effect of EU environment spending on public support is strengthened in areas with more waste production (Online Appendix Table B1 and Figure B5).
Second, as mentioned above, we replicate our analyses by including Identity, which reduces the sample to the years 2003–2006 and 2010 given that questions tapping social identity were not included in all EB surveys. Our results remain robust to this change in model specification (Online Appendix Tables B2 and B3). Moreover, we check for a moderating effect of Identity on the interaction terms that we test in Table 2. For this purpose, we simulate the marginal effects of spending on support at levels of economic need among those with an exclusive national identity and those with a relatively strong European identity.Footnote 15 The results suggest that the interaction effects do not substantially differ across levels of identity (Online Appendix Figures B6–B8). Yet Figure 2 changes slightly in the reduced sample. The marginal effect of infrastructure spending turns negative in regions that are less in need of infrastructure investment, suggesting that spending in the smaller sample has negative effects on EU support among individuals living in such regions. This does not, however, change the main interpretation of our results in light of H1 and H2.
Third, there might be a trend in the degree to which funding shapes support: the more the funding period progresses, the more time the money might have had to have an impact in regions, making it more likely that people develop more favourable opinions toward the EU. We capture this potential effect by adding a variable Count for the years after a funding period started, ranging from 0 to 6. For example, the count variable is 0 in 2000 and 2007, 1 in 2001 and 2008, 2 in 2002 and 2009 and so on. Our results remain robust to including this variable (Online Appendix Tables B4 and B5), and we do not find evidence that the effects in Tables 1 and 2 on support for the EU depend on such a time trend (Online Appendix Table B6 and Figure B9).
Fourth, we introduce three country‐specific indicators into our analyses that might explain variation in support: National unemployment, National fiscal transfers and National GDP (see, e.g., Eichenberg & Dalton Reference Eichenberg and Dalton1993; Hooghe & Marks Reference Hooghe and Marks2005). We do not include these indicators in the main regression tables due to relatively high correlations between some of the country‐level and spending indicators (Online Appendix Table A3). On balance, replicating Tables 1 and 2 by including these country‐level indictors (Online Appendix Tables B7–B12) gives further support for the robustness of our results with regard to Human capital, Infrastructure and Agriculture. By contrast, the coefficients of Energy and Environment are sensitive to the inclusion of country‐level indicators. In the models that include National fiscal transfers and National GDP in Table 1, respectively, we see that the effect of Environment spending on support turns statistically significant and positive (Online Appendix Tables B8 and B9). Furthermore, the coefficient of the interaction term between Energy and Population density in the replications of Table 2 (Online Appendix Tables B10–B12) becomes statistically significant. However, given that these models suffer from multicollinearity, we choose not to interpret these results as further evidence for H1.
Finally, our hypotheses are based on the assumption that people are able to trace spending back to the EU and link this, at least partial, knowledge to their perceptions of regional need. We explore this assumption by simulating the marginal effects for those who have at least partial knowledge and for those who do not. In our data, the most appropriate measure indicates if a person has heard of the Commission or not, as the Commission is responsible for the implementation of the EU budget and present in regional committees as an adviser in the course of a funding period (cf. Bachtler & Mendez Reference Bachtler and Mendez2007). If people have heard of and therefore have at least partial knowledge about the Commission, then they should be more able to rationally evaluate public spending and trace received funds back to the EU. Using the indicator Knowledge, the data show that most people have at least heard of the Commission (85 per cent). For the robustness check, we show how the interaction effects from Table 2 change among those who have not heard of the Commission (Knowledge = 0) and those who have (Knowledge = 1).Footnote 16 We find some evidence that marginal effects of spending on support at levels of economic need are larger among those who hold some knowledge of the Commission (see Online Appendix Figures B10–B12), but not convincing enough to conclude that there might indeed be a moderating effect of political knowledge. Given the lack of data, we leave it to future research to test in depth whether needs‐based spending is most effective in raising EU support among those who hold relevant knowledge, and less effective among those who do not.
Conclusion
The central argument presented in this article is that we can only understand the effects of spending on support for the EU when examining how transfers are spent. Drawing on insights from the policy feedback literature, we developed two hypotheses that explain support as a function of the fit between the policy area targeted by transfers and the regional economic needs in which individuals live. Our results provide further support for the notion that fiscal transfers do not influence levels of individual support for the EU except for investment in energy. Instead, the fit between targeted transfers and economic need is an important determinant of support. Needs‐based transfers lead to more support in the area of EU investment in human capital, infrastructure and environmentally relevant projects – spending areas with the hallmarks of redistributive spending that is highly salient, conflictive, and creates clear winners and losers.
Taken together, our findings call for a refinement of economic theories of support for the EU. The nuanced approach taken here, whereby support is examined as a function of the fit between how transfers are spent and the regional economic circumstances of individuals, marks a first step in this direction.
While findings are specific to the context of EU, future research could well examine the extent to which they are transferable to other regional integration projects and international organisations around the globe. The EU is not unique in the difficulties it faces in shoring up democratic legitimacy in its institutions through policy making (e.g., Zaum Reference Zaum2013). In regional and international organisations other than the EU, organisational legitimation strategies that seek to enhance public support through policy are typically not linked to spending, but to other forms of policy output such as soft law or providing stakeholders with access. Legitimation strategies can be conceived of as deliberative goal‐oriented activities by which organisations create and maintain support for themselves. Our article shows how organisations can enhance their own legitimacy through a specific strategy – namely, spending in different issue areas, depending on the fit between spending and regional economic need. As research has shown, public support for regional and international institutions is a widespread issue relevant for the United Nations (Dellmuth & Tallberg Reference Dellmuth and Tallberg2015), the Bretton Woods institutions (Johnson Reference Johnson2011), as well as other regional institutions (Schlipphak Reference Schlipphak2014) like the Association of South East Asian Nations or the African Union. The Common Market of the South (Mercosur) has established a Fund for the Structural Convergence of Mercosur in 2006, which is similar to the ESIF in terms of allocation process and funding objectives (cf. Medeiros Reference Medeiros, Hoffmann and van der Vleuten2007). Our findings on the effects of spending policies on public support for the EU may serve as a catalyst advancing the comparative research agenda on the sources of public support for regional and international institutions. As such institutions are increasingly becoming the object of contestation and politicisation (Zürn et al. 2012), knowledge about the conditions under which regional and international organisations can enhance their own legitimacy through spending becomes more relevant.
Acknowledgements
An earlier version of this article was presented at a workshop co‐organised by Stockholm University and Södertörn University in Stockholm in December 2015. We thank the participants for helpful comments and suggestions. We also thank the anonymous reviewers at the EJPR for their very helpful comments and advice. Lisa Dellmuth was financially supported by the Early Career Grant of the Regional Studies Association and the Swedish Research Council (Award Number: 2015‐00948).
Supporting Information
Additional Supporting Information may be found in the online version of this article at the publisher’s web-site:
Table A1. Operationalization
Table A2. Summary statistics
Table A3. Correlation matrix
Table A4. Budgetary items in spending categories
Table B1. Robustness check for Environment spending using Waste
Table B2. Replication of Table 1 including Identity
Table B3. Replication of Table 2 including Identity
Table B4. Replication of Table 1 including Count
Table B5. Replication of Table 2 including Count
Table B6. Replication of Table 1 including interactions with Count
Table B7. Replication of Table 1 with National unemployment
Table B8. Replication of Table 1 with National fiscal transfers
Table B9. Replication of Table 1 with National GDP
Table B10: Replication of Table 2 with National unemployment
Table B11: Replication of Table 2 with National fiscal transfers
Table B12: Replication of Table 2 with National GDP
Figure B1. Public support and European spending across EU member states and over time
Figure B2. European spending across issue areas
Figure B3. Marginal effect of Agriculture spending on Support at different levels of Utilized agricultural area
Figure B4. Marginal effect of Energy spending on Support at different levels of Population density (log)
Figure B5. Marginal effect of Environment spending on Support at different levels of Waste
Figure B6. Marginal effect of Human capital spending on Support at different levels of High‐Skilled Labor, by Identity
Figure B7. Marginal effect of Infrastructure spending on Support at different levels of Motorways, by Identity
Figure B8. Marginal effect of Environment spending on Support at different levels of Rurality, by Identity
Figure B9. Marginal effect of Agriculture spending on Support at different levels of Count
Figure B10. Marginal effect of Human capital spending on Support at different levels of High‐skilled labor, by Knowledge
Figure B11. Marginal effect of Infrastructure spending on Support at different levels of Motorways, by Knowledge
Figure B12. Marginal effect of Environment spending on Support at different levels of Rurality, by Knowledge


 Open access