


Introduction
Weed management is critical in smallholder crop-livestock systems due to limited farming inputs and varying management practices. Among the various strategies utilised, organic manure and inorganic fertiliser are key resources for soil fertility and crop productivity. Organic manure, which is generated from cattle for most smallholder crop-livestock farmers, improves soil fertility and provides essential nutrients for many field crops, including maize (Li et al., Reference Li, Liu, Li, Liu, Gu and Shi2022; Maharjan et al., Reference Maharjan, Das, Nielsen and Hergert2021; Materechera, Reference Materechera2010), but its nutrient composition is often insufficient to support optimal crop production (Little et al., Reference Little, Ditommaso, Westbrook, Ketterings and Mohler2021).
Uncured cattle manure, which many smallholder farmers use, can contain large amounts of viable weed seeds, and their passage through the digestive system can stimulate germination and increase weed diversity and biomass when the manure is applied to cropping fields (Mkhabela, Reference Mkhabela2006; Mkhabela and Materechera, Reference Mkhabela and Materechera2003; Materechera and Modiakgotla, Reference Materechera and Modiakgotla2006; Pleasant and Schlather, Reference Pleasant and Schlather1994). The viability of seeds passing through cattle’s digestive systems is highly influenced by hardiness (Harrington et al., Reference Harrington, Beskow and Hodgson2011), dormancy, and time spent in the digestive system (Rahimi et al., Reference Rahimi, Mashhadi, Banadaky and Mesgaran2016). Kasirivu et al. (Reference Kasirivu, Materechera and Dire2011) reported that seed viability of Lamb’s quarters (Chenopodium album L.) and smooth pigweed (Amaranthus hybridus L.) was most dominant with manure application and that barnyardgrass [Echinochloa crus-gali (L.) Beav.] exhibited dormancy, which in turn increased survival of passage through cattle.
Conversely, inorganic fertilisers provide a precise nutrient supply when applied at recommended rates, supporting crop development, while having differing impacts on weed species communities. For example, nitrogen (N) fertiliser influences the density of various weed species, while phosphorus (P) fertiliser affects the occurrence of weed species (Travlos et al., Reference Travlos, Cheimona, Roussis and Bilalis2018). Fertilisers containing N and P promote the growth of nitrophilous and phosphophilous weeds (Lehoczky et al., Reference Lehoczky, Kamuti, Mazsu, Tamás, Sáringer-Kenyeres and Gólya2014; Nadeem et al., Reference Nadeem, Tanveer, Maqbool, Abbas and Farooq2018; Ņečajeva et al., Reference Ņečajeva, Mintāle, Dudele, Isoda-Krasovska, Rancāns, Kaulina, Morozova and Spurina2015; Tang et al., Reference Tang, Cheng, Wan, Li and Wang2014), but there is a paucity of studies on the specific effect of potassium (K). Nonetheless, NPK fertilisers increase the potency of weed propagules and enhance rapid weed growth (Nwagwu et al., Reference Nwagwu, Effa and Osai2015).
Even so, there is limited information on the influence of cattle manure and inorganic fertilisers on weed composition in crop-livestock systems. Moreover, most research on the value of cattle manure as a fertiliser has been conducted in areas with growth conditions that differ significantly from those in Sub-Saharan Africa’s crop-livestock systems (Lithourgidis et al., Reference Lithourgidis, Matsi, Barbayiannis and Dordas2007; Ozlu et al., Reference Ozlu, Sandhu, Kumar and Arriaga2019). Thus, the study aimed to assess the effects of cattle manure and inorganic fertiliser on the floristic and seed bank composition in smallholder crop-livestock systems in Eswatini. Diversity indices, including the Shannon-Wiener, Simpson, and Pielou index, were employed to characterise species composition. The study also utilised the importance value index (IVI) to identify weeds that significantly contributed to the seed bank. The hypothesis tested was that applying cattle manure might increase weed species composition in fields where it is applied, thereby exacerbating challenges in weed control.
Materials and methods
Study site
The study was performed in small-scale farmers’ fields of two agroecological regions of Eswatini, namely, the Highveld (Mankayane; 26° 40′ S, 31° 3′ E, elevation 900–1800 m.a.s.l) and the Middleveld (Luve; 26° 20′ S, 31° 28′ E, elevation 400–800 m.a.s.l) (Figure 1). During the summer, maize is the main crop grown under rainfed conditions; therefore, the weed field survey and weed seed bank studies were conducted between October and May for two cropping seasons (i.e. 2020/2021 and 2021/2022). In the 2020/2021 seasons, the Highveld recorded total rainfall amounts of 904 and 780 mm in 2021/2022, accompanied by mean temperatures of 20.9°C and 18.4°C, respectively. Conversely, the Middleveld experienced 808 mm of rainfall in 2020/2021 and 505 mm in 2021/2022, with mean temperatures of 23.2 and 21.7°C, respectively. Soil at Mankayane was a sandy clay loam with a clay content of 28 %, while at Luve was a sandy loam with 19 % clay. The average soil pH was measured at 4.3 for Mankayane and 4.7 for Luve.

Figure 1. Map showing the two agroecological zones of Eswatini, with triangles indicating the sampled/surveyed fields in the (a) Highveld (Mankayane) and (b) Middleveld (Luve).
Cropping field and farming practices
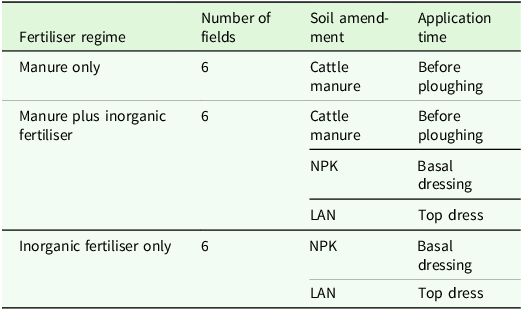
Stratified sampling technique (Müller-Dombois and Ellenberg, Reference Müller-Dombois and Ellenberg1974) was used to select major maize-growing agroecological regions, specifically the Highveld and Middleveld of Eswatini, and a Regional Development Area (RDAs) within each region. Within a 2 km radius of each selected RDA, eighteen farmers with a history of maize production spanning five years or more were identified. These farmers were categorised into three fertiliser regimes: manure only (n = 6), manure plus inorganic fertiliser (n = 6), and inorganic fertiliser only (n = 6), resulting in three fertiliser regimes with six replicates each (Table 1).
Table 1. Fertiliser regime in the studied maize-growing agroecological zones of Eswatini a

a NPK, Nitrogen Phosphorus Potassium; LAN, Limestone Ammonium Nitrate.
For land preparation, farmers utilised a mouldboard plough followed by a disc harrow. In the fertiliser regimes where manure was applied, farmers broadcast the manure before ploughing at an average rate of 9 t/ha (N = 33 kg, P = 55 kg, K = 70 kg) only in the first year, with manure applied every two cropping seasons. The manure was sourced from the kraal, where cattle are confined nightly and accumulate throughout the year. At the start of the cropping season, the manure is collected and transported to the fields for broadcasting as the primary fertiliser. During the winter dry season, cattle feed on maize residues from the previous harvest, which further contributes to nutrient recycling. It is important to note that this method does not ensure complete manure composting, potentially containing viable seeds (Mncube, Reference Mncube2023).
Maize variety SC 719 (Seed-Co®, Zimbabwe) was planted at a seeding rate of 25 kg/ha, at inter- and intra-row spacing of 0.9 and 0.25 m, respectively. Basal fertiliser [N: P: K, 2:3:2 (37%)] was applied at a planting rate of 500 kg/ha at Mankayane and 400 kg/ha at Luve. Four weeks after crop emergence (WACE), Limestone Ammonium Nitrate [LAN (28%)] top dressing fertiliser was applied at 200 kg/ha at Mankayane and 150 kg/ha at Luve. Weed management was through early post-emergence (EPOST) herbicide application at the maize four-leaf stage using cyanazine (Bladex® 900 g/kg, AgNova Technologies Pty Ltd, Hamilton, Australia) at the recommended dosage rate (4 L/ha). A PB-20 or PB-16 Knapsack sprayer (Jun Chong Co., Ltd., Kluang, Johor, Malaysia) was calibrated to reach and maintain 300 kPa pressure, with a spray volume of 200 L/ha. Cyanazine was chosen for application because it is readily available and commonly used for weed management in maize, especially considering the limited variety of herbicides available in the Eswatini market (Dlamini et al., Reference Dlamini, Mloza-Banda and Edje2016).
Soil seed bank sampling
The characterisation of the soil weed seed bank species was conducted before land preparation (before manure broadcasting and planting) over two cropping seasons. Plots measuring 20 m × 20 m were marked in each field. Soil cores were collected from each plot at 2 m intervals in a zigzag pattern using a 5 cm diameter auger in 2020 (October 10th–18th) and 2021 (October 15th–22nd). Sampling was performed at depths of 0–10 cm and 10–20 cm, with ten samples per depth and site. These samples were combined to create composite mixtures per site and stored in paper bags at room temperature until spread in plastic trays. In 2020 (October 25th) and 2021 (October 28th), plastic trays measuring 30 cm × 30 cm x 10 cm were filled with 4 kg of sterilised dry sand to achieve a soil depth of 3 cm in the tray, then samples from each field and depth were thinly and evenly spread to a depth of 2 cm. The base of the trays was perforated to allow drainage. Trays were laid in a randomised complete block design (RCBD) under natural light in a screen house, with six replicates. Throughout the 20-week maize growth period, the soil in the trays was watered daily to stimulate germination. Every two weeks, the soil (excluding sand) in each tray was turned using a hand fork to stimulate seed germination of photoblastic weeds. Germinated weed seedlings were identified, counted, and removed.
Weed sampling survey
Weed surveys were conducted in 2021 (February 26th–April 4th) and 2022 (March 2nd–April 14th). Fields were surveyed at the maize kernel dough stage (i.e., R4 growth stage). Post-emergence herbicide application occurred two months before the R4 stage, influencing weed populations and contributing to the weed seed bank and flora of subsequent cropping seasons. To assess the structure and abundance of weed vegetation in maize fields, three transects were marked in each field: two along the field edges (vertically) and one at the field centre (horizontally). Each transect was 25 m long and comprised five 5 m × 1 m quadrats at 1 m intervals. This sampling design was chosen to accommodate field sizes ranging from 50 m × 50 m to 100 m × 60 m.
Established plants of broadleaved weeds with a minimum of 10 cm in height, grass weeds of 15 cm in height, and stoloniferous weeds with a minimum length of 10 cm were sampled during the study period. Weed species were identified using screening methods from the Royal Botanic Gardens (Kew) and online databases, such as POWO (2022) and CABI (2022). Weed species density and composition were assessed in the weed seed bank and maize field survey studies. Species in ≤5% of the sampling quadrats were considered rare, while those in more than 25% were defined as common.
Data processing
The number of individual weed species that germinated in the weed seed bank experiment was converted to weed density/m2. The absolute and relative values of frequency, density, and abundance for each species were used to analyse the structure of the weed seed banks (Curtis and McIntosh, Reference Curtis and McIntosh1950) for each fertiliser regime, agroecological zone (study area), and season. Absolute weed density was determined as the total number of weed species per sampled area (Equation 1), while relative density was the absolute density of a weed species over the sum of all absolute densities (Equation 2).
 $${\rm{ Absolute \,weed\, density\! = \!{Total\;number\;of\;targeted\;species}}/\\ {{Total\;sampled\;area}}}$$
 $${\rm{{Relative\; density =[Absolute\; density\;of\;weed\;species}}/ \\{{Sum\;of\;all\;absolute\;densities] \times 100}}}$$
Absolute frequency was the total number of sampling units (fertiliser regime replicates) with the targeted species over the total number of sampling units (Equation 3).
 $${ \small{\rm{Absolute\; frequency} = {Number\;of\;sampling\;units\;with\;targeted\;species}/}\\{{\small\rm{Total\;number\;of\;sampling\;units}}}}$$
The relative frequency was the absolute frequency of each species over the sum of all frequencies (Equation 4).
 $$\eqalign{& {\rm{Relative\; frequency = [Species\;absolute\;frequency}}/\cr& {\rm{Sum\;of\;all\;absolute\;frequencies] \times100}}}$$
Absolute dominance was the total number of individuals per species over the total number of sampling units containing that species (Equation 5), while relative dominance was the absolute dominance of a species over the sum of all dominances (Equation 6).
 $${\eqalign{& {\rm {Absolute\; dominance = {Total\;number\;of\;individuals\;of\;a\;species}}}/\cr& {\rm{Total\;number\;of\;sampling\;units\;containing\;that\;species}}}}$$
 $${ {\rm{Relative\; dominance = [Absolute\;dominance\;of\;a\;species}}/\\{\\\rm{Sum\;of\;all\;absolute\;dominance]\times 100}}}$$
The IVI was calculated as the sum of relative frequency, relative density, and relative dominance (Equation 7). The index ranges from 0 to 300 per sample, and the weed species with the highest value is considered the most important.
 $$\small{\rm {Importance\; value\; index = \sum {\matrix{{{\rm{Relative}}\;{\rm{density}}\;{\rm{ + }}} \cr {\;{\rm{Relative}}\;{\rm{frequency}}\;{\rm{ + }}\;{\rm{Relative}}\;{\rm{dominance}}} \cr } }}} $$
The diversity indices were used to determine species composition (Legendre and Legendre, Reference Legendre and Legendre1998) between the fertiliser regimes, agroecological zones, and sampling seasons in the seed bank and maize field survey. Species richness (S) was the total number of species per sample (Equation 8).
 $${\rm{S = }}\sum\limits_{{{i = 1}}}^{{s}} {pi^0} $$
where s equals the number of species, p i equals the ratio of individuals of species i, and superscript 0 is the insensitivity to species frequencies.
Shannon-Weiner (H’) diversity index was the relative abundance of each species and the species richness between the fertiliser regimes, seasons, and agroecological zones (Equation 9).
 $$H' = \sum\nolimits_{{\rm{i = 1}}}^{\rm{s}} {{p_i}\,{\rm{in}}\,{p_i}} $$
Gini-Simpson (D) diversity index was used to measure the degree of dominance of weed species within the fertiliser regimes, seasons, and agroecological zones (Equation 10).
 $${\rm{D = 1}} - \sum\limits_{i = 1}^s {[{{\rm{n}}_i}({\rm{n}} - 1)} /{\rm{N (N}} - {\rm{1)]}}$$
where n is the number of individuals of one species, N = the total number of all individuals.
Pielou (J’) evenness index was used to measure the degree to which the abundances of different weed species in a fertiliser regime, season, or agroecological zone are similar (Equation 11).
 $$J' = H'/Log(S)$$
Data analyses
A Generalised Linear Model (GLM), followed by post hoc pairwise analysis with Least Square Difference (LSD) correction for multiple pairwise comparisons, was used to determine whether there was a difference in the diversity indices of fertiliser regimes, seasons, agroecological zones, and sampling depths for the soil seed bank and their interactions. Analyses were conducted in Statistical Package for Social Science (IBM SPSS Statistics version 28), and statistical significance was accepted at p < 0.05.
Weed survey data were square-root transformed to balance the weight of the contribution of the most abundant and rare species. To calculate the similarity index between fertiliser regimes, the transformed data were subjected to the Bray-Curtis similarity index (Anderson et al., Reference Anderson, Gorley and Clarke2008). Weed species composition (the number and kinds of species) between fertiliser regimes, agroecological zones, and seasons was compared using Permutational Analysis of Variance (PERMANOVA) with 999 random permutations. This analysis was further supported by Principal Coordinate Analysis (PCoA) to visualise the compositional differences across factors. Similarity Percentage (SIMPER; Clarke, Reference Clarke1993) analysis was used to calculate the contribution of each species to the dissimilarities between the species compositions of fertiliser regimes, agroecological zones, and seasons. Explored species were those that contributed a dissimilarity of ≥2.5%. Analyses were conducted in PRIMER + PERMANOVA (Plymouth Marine Laboratory Routines in Multivariate Ecological Research, version 6: Plymouth Marine Laboratory, UK).
Results
Cropping field weed survey
The cropping field weed survey study identified 66 weed species from 18 families (Supplementary Table S1). Six weed species were found exclusively in Mankayane (Highveld), while three were unique to Luve (Middleveld). Southern cutgrass (Leersia hexandra Swartz.), cheese weed (Malva parviflora L.), witch grass (Panicum capillare L.), and yellow foxtail [Setaria pumila (Pior.) Roem. & Schult.] were only observed in the first season. In contrast, dwarf papyrus sedge (Cyperus haspan L.), and dodder (Cuscuta australis R.Br.) were only observed in the second season. Redroot pigweed (Amaranthus retroflexus L.), spiny pigweed (Amaranthus spinosus L.), balloon vine (Cardiospermum halicacabum L.), jimson weed (Datura stramonium L.), common purslane (Portulaca oleracea L.), linden leaf (Salvia tiliifolia Vahl.), and black nightshade (Solanum nigrum L.) were found to be associated with manure application.
Regarding the ecological community, 41 rare (R) and 25 common (C) species were recorded (Supplementary Table S1). The observed species exhibited various life forms, including 41 annual broadleaved weeds (AB), one annual leafless weed (AL), six perennial broadleaved weeds (PB), nine annual grass weeds (AG), five perennial grass weeds (PG), and six perennial sedge weeds (PS). Weed species distribution showed that 26 species were native (N) to the agroecological zones, while 40 were introduced (I).
The composition of weed species from the weed survey differed significantly in the interaction between fertiliser regimes and agroecological zones (Pseudo F-value = 3.024, P <= 0.001), and between fertiliser regimes, agroecological zones, and seasons. The PCoA on the species composition for the interaction between fertiliser regimes and agroecological zones revealed three main components with eigenvalues greater than one, which explained 45.3 % of the variation in weed species composition (Figure 2). In addition, PCO1 and PCO2 explained 33.6 % of the total variation. The samples clustered according to the agroecological zone regardless of the fertiliser regime, with minimal overlap (Figure 2).

Figure 2. Principal Coordinate Analysis (PCoA) comparing weed species composition between fertiliser regimes and study areas based on Bray-Curtis similarity matrix.
Weed species richness (S) was influenced by the interaction between fertiliser regimes and agroecological zones (F (72, 2) 9.273, P < 0.01). In the Middleveld, species richness was significantly higher in the manure only and manure plus inorganic fertiliser regimes and lower in the inorganic fertiliser only regime (Figure 3). In the Highveld, the manure only, manure plus inorganic fertiliser, and inorganic fertiliser only regimes were lower than those of the Middleveld (Figure 3).

Figure 3. Mean (±SD) weed species richness (S) between fertiliser regimes and study areas. The different letters indicate post hoc pairwise differences.
Furthermore, the Shannon-Wiener (H’) diversity index differed significantly between the fertiliser regimes (F (72, 2) 9.608, P < 0.01); weed species diversity in the manure only regime was greater than that of the inorganic fertiliser only regime (Figure 4a). Also, H’ differed significantly between agroecological zones (F (72, 1) 33.7, P < 0.001); weed species diversity in the Middleveld was greater than in the Highveld (Figure 4b).

Figure 4. Mean (±SD) weed species diversity (H’) between fertiliser regimes (a) and study areas (b). The different letters indicate post hoc pairwise differences.
When considering the degree of weed species dominance within fertiliser regimes, seasons, and agroecological zones, the Gini-Simpson (D) index differed significantly between agroecological zones only (F (72, 1) 16.8, P < 0.001). Dominance in the Middleveld was lower compared to the Highveld (Figure 5a). In terms of the degree to which the abundances of different weed species in a fertiliser regime, season, or agroecological zone are similar, Pielou’s (J’) evenness also differed significantly between the agroecological zones (F (72, 1) 11.3, P < 0.001) and was greater in the Middleveld compared to the Highveld (Figure 5b).

Figure 5. Mean (±SD) weed species dominance (D) between study areas (a). Mean (±SD) weed species evenness (J’) between study areas (b). The different letters indicate post hoc pairwise differences.
The Similarity Percentage (SIMPER) analysis showed uniform within average species composition similarities in the Highveld, with values of 47, 48, and 47 % for the manure only, manure plus inorganic fertiliser, and inorganic fertiliser only regimes, respectively (Table 2). In the Middleveld, the SIMPER analysis revealed within average species composition similarity of 67 % in the manure only regime, which was higher than the manure plus inorganic fertiliser (62 %) and inorganic fertiliser only (59 %) regimes. The average species composition dissimilarities in the Highveld were lower between manure only and manure plus inorganic fertiliser (54 %) regimes, compared to manure only and inorganic fertiliser only (60 %), manure plus inorganic fertiliser and inorganic fertiliser only (59 %) regimes (Table 2). Similarly, in the Middleveld, the average species composition dissimilarities were lower between manure only and manure plus inorganic fertiliser (37 %), compared to manure only and inorganic fertiliser only (42 %), manure plus inorganic fertiliser and fertiliser only (44 %).
Table 2. Within fertiliser regime similarity and between fertiliser regimes pairwise dissimilarities of weed species as determined by SIMPER a
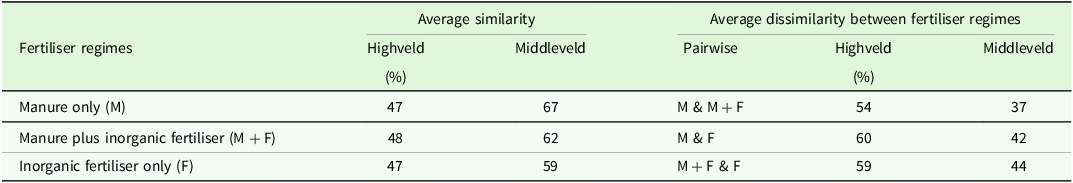
a M, manure only; F, fertiliser only; M + F, manure plus fertiliser.
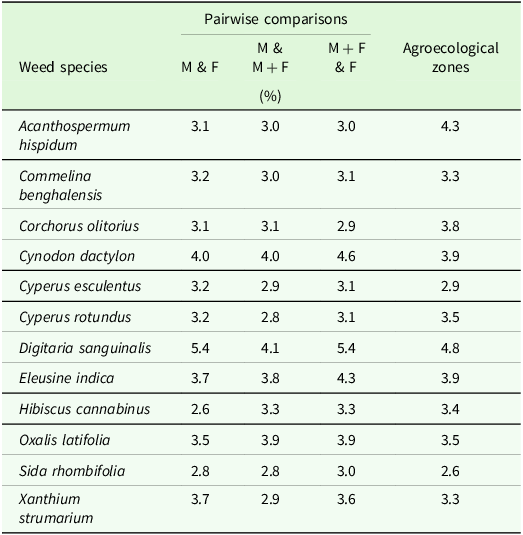
SIMPER identified 12 dominant discriminating weed species contributing an abundance of ≥2.5 % to the weed species composition dissimilarities observed between the fertiliser regimes and agroecological zones (Table 3). These weed species contributed to the significant differences in species composition, richness, diversity, dominance, and evenness and the similarities and dissimilarities observed between the fertiliser regimes and agroecological zones. Also, five weed species were the most important and discriminating in the seed bank of the different fertiliser regimes (Supplementary Table S1). Three (C. dactylon, D. sanguinalis and E. indica) were abundant in the seed bank and field survey.
Table 3. Similarity Percent (SIMPER) analysis on weed species contributing more than 2.5% between fertiliser regimes and agroecological zones a

a M, manure only; F, fertiliser only; M + F, manure plus fertiliser.
Weed seed bank
The weed seed bank study revealed 49 weed species in the first season and 45 in the second. Weed species were from 19 families (Supplementary Table S1). Forty-four weed species were common between the seed bank and the cropping field survey, while five were present in the seed bank only. The dominance of weed species in the seed bank was summarised using the importance value index (IVI) (Supplementary Table S1). During the first season, under the manure only regime, E. indica was dominant (>38) in the Highveld, while C. dactylon was dominant (>31) in the Middleveld. Under the inorganic fertiliser only regime, C. dactylon was dominant (>68) in the Highveld, whereas G. parviflora was dominant in the Middleveld. The manure plus inorganic fertiliser regime showed the dominance of E. indica (>78) in the Highveld, while D. sanguinalis (>39) was dominant in the Middleveld. During the second season, the manure only regime showed dominance of S. tiliifolia (>39) in the Highveld, while C. dactylon was dominant (>26) in the Middleveld. The manure plus inorganic fertiliser regime showed dominance of C. dactylon (>31) in the Highveld, while D. sanguinalis was dominant (>39) in the Middleveld. The inorganic fertiliser only regime showed dominance of D. sanguinalis (>56) in the Highveld, while G. parviflora was dominant (>26) in the Middleveld.
In terms of weed seed density, there were no significant differences between sampling depths of 0–10 cm and 10–20 cm (F (72, 1) 0.792, P > 0.05) and fertiliser regimes (F (72, 2) 4.903, P > 0.05). However, weed seed density was influenced by the agroecological zones (F (72, 1) 20.1, P < 0.001). The density was lower in the Highveld compared to the Middleveld (Figure 6a). Additionally, weed seed density differed across sampling seasons (F (72, 1) 17.1, P < 0.001); a higher density was observed in the second season compared to the first season (Figure 6b).

Figure 6. Mean (±SD) weed seed density between study areas (a) and seasons (b). The different letters indicate post hoc pairwise differences.
Weed seed bank species richness (S) demonstrated a significant interaction between the fertiliser regimes and agroecological zones (F (72, 2) 9.291, P < 0.01). Species richness (S) was lower in the inorganic fertiliser only regime in the Highveld, compared to the Middleveld (Fig. 7a). Seed bank diversity (H’) showed a significant interaction between the fertiliser regimes and agroecological zones (F (72, 2) 19.4, P < 0.001). Species diversity was lower in the inorganic fertiliser only regime in the Highveld compared to the Middleveld. Moreover, species diversity was greater in the manure only regime compared to the manure plus inorganic fertiliser regime in both agroecological zones (Figure 7b).

Figure 7. Mean (±SD) weed species richness (S) (a) and Shannon-Wiener (H’) diversity (b) for the interaction between fertiliser regimes and study areas. The different letters indicate post hoc pairwise differences.
Discussion
The study aimed to distinguish weed communities in both the field and seed bank between maize fields fertilised with cattle manure and inorganic fertiliser in two agroecological regions of Eswatini. The higher weed species richness observed in the manure only and manure plus fertiliser regimes in the Middleveld compared to the Highveld could be due to the region’s warmer temperatures, which can enhance weed seed germination and survival. The warmer temperatures in the Middleveld could have affected soil temperature, influencing seed germination and the rate of non-dormant seeds (Klupczyńska and Pawłowski, Reference Klupczy´nska and Pawłowski2021; Peng et al., Reference Peng, Yang, Yang and Li2021). These results are consistent with previous research (e.g., Haj Sghaier et al., Reference Haj Sghaier, Tarnawa, Khaeim, Kovács, Gyuricza and Kende2022; Koger et al., Reference Koger, Reddy and Poston2004; Steinhaus et al., Reference Steinmaus, Prather and Holt2002), which showed that weed seed germination increases linearly with temperature up to an optimal point.
The reduced species richness in the fertiliser only regime could be attributed to the ability of certain weed species to quickly respond to fertility, allowing them to grow and dominate (Jiang et al., Reference Jiang, Shen, Gao, Shen and Dai2014; Rotchés-Ribalta et al., Reference Rotchés-Ribalta, Armengot, Mäder, Mayer and Sans2017). Continuous fertiliser application often encourages adaptable weed species, enhancing their competitive abilities and contributing to the seed bank (Blackshaw et al., Reference Blackshaw, Brandt, Janzen, Grant and Derksen2003; Little et al., Reference Little, Ditommaso, Westbrook, Ketterings and Mohler2021). The results corroborate those of De Cauwer et al. (Reference De Cauwer, D’Hose, Cougnon, Leroy, Bulcke and Reheul2011) and Jiang et al. (Reference Jiang, Liu, Huang, Shen, Shen and Dai2018), who reported a significant reduction in weed species richness and diversity with inorganic fertiliser applications.
Inorganic fertilisers, unlike uncured manure, effectively reduce weed species’ richness and diversity, supported by herbicide applications such as cyanazine. This herbicide reduced the abundance of susceptible broadleaved weed species, favouring grasses (Hyvönen and Salonen, Reference Hyvönen and Salonen2002). Indeed, nine annual grasses, six perennial grasses, and six sedges, which were unlikely to be affected by cyanazine application, were recorded in the maize cropping fields. Most grasses (e.g., D. sanguinalis, E. indica, and C. dactylon) and sedges [e.g., yellow nutsedge (Cyperus esculentus L.) and purple nutsedge (Cyperus rotundus L.)] exhibited high abundances, indicating insufficient control by cyanazine. Additionally, the fertiliser only regime had the lowest weed biomass and the highest maize yield compared to the manure only and manure plus inorganic fertiliser regimes in both sampling seasons and study areas (Mncube et al., Reference Mncube, Phiri, Mothapo, Rugare, Pieterse and Mloza-Banda2024).
Comparisons of weed species assemblages in the Highveld revealed low similarities within fertiliser regimes and high dissimilarities between fertiliser regimes. Conversely, the Middleveld showed high similarities within fertiliser regimes and low dissimilarities between fertiliser regimes. This was supported by the significant differences in species evenness (J’) across the agroecological zones, indicating heterogeneous weed communities in the Highveld and homogeneous ones in the Middleveld. The variability suggests greater species composition within Highveld cropping fields and higher percentages of rare species, contributing to overall diversity. Weed dispersals from neighbouring habitats, such as forests and grasslands, enhance weed biodiversity (Gabriel et al., Reference Gabriel, Thies and Tscharntke2005, Reference Gabriel, Roschewitz, Tscharntke and Thies2006; Roschewitz et al., Reference Roschewitz, Gabriel, Tscharntke and Thies2005). In the present study, sampling was within a 2 km radius, and as the distance between fields increased, diversity is likely to have increased as well. The findings align with those of Alignier and Petit (Reference Alignier and Petit2012), who observed significant dissimilarities in the weed community in fields separated by ≥450 m.
On the other hand, the observed homogeneous weed species in cropping fields indicate an evenly distributed assemblage, suggesting reduced diversity, influenced by proximity between fields, which encourages propagule movement (Gaba et al., Reference Gaba, Chauvel, Dessaint, Bretagnolle and Petit2010). Additionally, crop competition within fields can reduce weed abundance and richness, leading to a uniform weed assemblage (Berquer et al., Reference Berquer, Martin and Gaba2021). Further, consistent cropping practices result in a more stable weed community structure, limiting diversity.
This study identified 12 weed species in the field weed survey that contributed to significant differences in species composition, richness, diversity, dominance, and evenness, as well as similarities and dissimilarities observed between the fertiliser regimes and study areas. Additionally, five weed species were most important in the seed bank amongst the different fertiliser regimes; three (Cynodon dactylon, Digitaria sanguinalis, and Eleusine indica) were abundant in both the seed bank and field weed survey. This indicated that the presence of these weed species was not influenced by fertiliser regime or agroecological zone, suggesting that they might be generalists capable of thriving in different field conditions, such as a wide range of soils, light availability, and cooler or warmer temperatures (De Cauwer et al., Reference De Cauwer, Biesemans, de Ryck, Delanote, Dewaele, Willekens, Vanden Nest and Reheul2021; Fried et al., Reference Fried, Chauvel, Munoz and Reboud2020; Sivarajan and Pradeep, Reference Sivarajan and Pradeep1994).
According to Romaneckas et al. (Reference Romaneckas, Kimbirauskiene, Sinkeviciene, Jaskulska, Buragienė, Adamavičienė and Šarauskis2021), field cultivation plays a key role in dispersing weed seeds by burying them at different depths. However, this study’s findings show that weed seed density was consistent and did not differ between the sampling depths of 0–10 and 10–20 cm. This consistency could be attributed to the tillage methods used by farmers. Specifically, mouldboard ploughing in this study may have led to the even distribution of weed seeds across soil layers. The results agree with those of Clements et al. (Reference Clements, Benoit, Murphy and Swanton1996) and Feledyn-Szewczyk et al. (Reference Feledyn-Szewczyk, Smagacz, Kwiatkowski, Harasim and Woźniak2020), who found that mouldboard ploughing and conventional tillage produce a uniform distribution of weed seeds throughout the soil profile, unlike minimum tillage practices. This even distribution across soil layers indicates a large weed seed bank capable of supporting high seed survival rates. As a result, managing different weed species may require specific strategies to reduce seed production and prevent continuous addition to the soil seed bank.
The seed bank is influenced by many factors, including soil texture (Benvenuti and Mazzoncini, Reference Benvenuti and Mazzoncini2021). Therefore, the manure and inorganic fertiliser application history of more than five years could have influenced the physical properties. As such, the particle assembly in manured fields could have promoted the soil’s suitability for weed seed survival. Moreover, seed germination in aggregate soils could be accelerated by the availability of moisture, air, warmth, and light, which breaks weed seed dormancy (Benvenuti, Reference Benvenuti2003; Long et al., Reference Long, Gorecki, Renton, Scott, Colville, Goggin, Commander, Westcott, Cherry and Finch-Savage2015). Hence, weed seeds germinating in aggregate soils may not require increased energy reserves to germinate and can divert this energy toward seedling establishment and growth (Benvenuti and Mazzoncini, Reference Benvenuti and Mazzoncini2019). Consequently, manure applied fields would have elevated seed diversity and richness, with early-emerging weed seeds that could be competitive during the early stages of crop growth. Additionally, manure reduces soil compaction, enhances soil aggregate stability, and improves porosity and water infiltration, which may increase seed richness and diversity by stabilising particles that enable weed seeds to survive at various soil depths (Rayne and Aula, Reference Rayne and Aula2020).
Furthermore, observations from both the seed bank and field survey indicated that the relationship between above- and below-ground vegetation can be attributed to the continuous addition of manure, which is rich in weed seeds. This could have increased the weed species richness and diversity in the soil (Materechera and Modiakgotla, Reference Materechera and Modiakgotla2006; Mkhabela, Reference Mkhabela2006; Mkhabela and Materechera, Reference Mkhabela and Materechera2003; Pleasant and Schlather, Reference Pleasant and Schlather1994; Rupende et al., Reference Rupende, Chivinge and Mariga1998), which supports the hypothesis that manure applied fields would have a higher weed species composition than inorganic fertiliser applied fields. Therefore, in addition to the EPOST herbicide used by the farmers in the study, weed management techniques aiming at reducing weed emergence and competitiveness can be considered to minimise weed seed richness and diversity. Also, farmers may need to consider composting cattle manure to kill weed seeds before broadcasting it in the field.
Conclusion
The study demonstrated that fertiliser regimes have limited short-term effects on weed seed distribution in soil but significantly influence weed species richness and diversity. The manure only and manure plus inorganic fertiliser regimes exhibited higher species richness, with native, adaptable species thriving in disturbed areas; therefore, farmers need to understand the behaviour of these weeds to implement cropping and management practices that reduce their success. Successful weed management of both homogeneous and heterogeneous communities will require techniques that reduce weed densities and minimise the invasion of new species, which current weed management strategies cannot control. A long-term, ecologically sustainable weed management programme that is easy for farmers to understand is essential for developing effective strategies.
Supplementary material
The supplementary material for this article can be found at https://doi.org/10.1017/S0021859625100488.
Acknowledgments
Many thanks to the farmers who participated in the study and for granting access to their fields.
Author contributions
TLM, EEP, HRM, and PJP conceptualised, conceived, and designed the experiment. TLM, PNM, and JTR analysed the data and interpreted the results. TLM drafted the manuscript. EEP, PJP, JTR, HRM, and PNM critically revised and edited the manuscript.
Funding statement
This study received financial support from the National Research Foundation of South Africa.
Competing interests
The authors declare there are no competing interest.
Ethical standards
This research was conducted in accordance with Stellenbosch University’s ethical research policy. Permission to conduct the study was granted by the University Research Ethics Committee (REC: FESCAGRI-2020-18829) prior to data collection. Farmers participating in the study were sent a consent form through a link via WhatsApp messaging or by email. The consent form requested their participation in the study and permission to access their fields. Sensitive information, such as personal contact details, was kept separate and accessed only by the authors.


 Open access