


1. Introduction
A key goal of sustainability is meeting people’s needs without exceeding planetary limits (Costanza, Reference Costanza1989). To date, no country has been able to achieve this goal (Fanning et al., Reference Fanning, O’Neill, Hickel and Roux2021; O’Neill et al., Reference O’Neill, Fanning, Lamb and Steinberger2018). Richer countries offer high levels of human need satisfaction at the cost of transgressing planetary boundaries. Poorer countries are characterized by low planetary overshoot, but high social shortfalls – an inability to meet key minimum social standards such as nutrition, sanitation, or access to energy (ibid.).
There is an increasing effort to address this ‘dual challenge’ (Leach et al., Reference Leach, Reyers, Bai, Brondizio, Cook, Díaz, Espindola, Scobie, Stafford-Smith and Subramanian2018) and to suggest policies that support successful pathways towards low-carbon/high well-being development (Roberts et al., Reference Roberts, Steinberger, Dietz, Lamb, York, Jorgenson, Givens, Baer and Schor2020). In this context, the concept of sustainable welfare has gained traction in recent years as a ‘theoretical and normative framework for redesigning existing policies in an “eco-social” direction’ (Koch, Reference Koch2018, p. 42) (see, e.g., Gough, Reference Gough2017; Koch & Mont, Reference Koch and Mont2016). The key instrument to practically implement such a sustainable welfare system is eco-social policies. Eco-social policies seek to make climate and other environmental policies fairer (Babirye, Reference Babirye2022; Bonetti & Villa, Reference Bonetti and Villa2023; Galgóczi, Reference Galgóczi2022; Mandelli, Reference Mandelli2022) and to align social policies with planetary boundaries (Büchs, Koch, et al., Reference Büchs, Koch, Lee, Eastwood and Heron2024; Steffen et al., Reference Steffen, Richardson, Rockström, Cornell, Fetzer, Bennett, Biggs, Carpenter, de Vries, de Wit, Folke, Gerten, Heinke, Mace, Persson, Ramanathan, Reyers and Sörlin2015).
In democratic countries, public opinion has an impact on public policymaking, despite the organized influence of political groups (Anderson et al., Reference Anderson, Böhmelt and Ward2017; Burstein, Reference Burstein2003; Schaffer et al., Reference Schaffer, Oehl and Bernauer2022). In short, politicians are to some degree responsive to public opinion on a given topic. From a political perspective, it is thus important to gauge the practical feasibility of eco-social policies by examining the extent to which they garner public support (Burstein, Reference Burstein2003; Page & Shapiro, Reference Page and Shapiro1983).
Despite a growing number of theoretical and empirical studies on public support for eco-social policies, several important knowledge gaps remain. First, research on public support for eco-social policies across countries and particularly in large, high-emitting countries outside of Europe and North America is lacking. Several empirical studies have started to emerge but remain concentrated on high-income countries in Europe, with a focus on Sweden (Emilsson, Reference Emilsson2022; Fritz et al., Reference Fritz, Koch, Johansson, Emilsson, Hildingsson and Khan2021; Khan et al., Reference Khan, Emilsson, Fritz, Koch, Hildingsson and Johansson2023; Lee & Koch, Reference Lee and Koch2023; Lee et al., Reference Lee, Koch and Alkan-Olsson2023) and Germany (Fritz & Eversberg, Reference Fritz and Eversberg2023). The few existing cross-country studies look at sets of European countries or only examine redistribution of carbon tax revenues without considering other eco-social policies (Mohammadzadeh Valencia et al., Reference Mohammadzadeh Valencia, Mohren, Ramakrishnan, Merchert, Minx and Steckel2024). This is a crucial omission. As Gugushvili and Otto (Reference Gugushvili and Otto2023) propose in their theoretical framework, contextual factors at the country level are likely to influence individual support for eco-social policies.
To address these concerns, this paper seeks to understand public support for three eco-social policies in three diverse high-income countries – Germany, United States, and United Kingdom – and three diverse middle-income countries – Brazil, China, and South Africa. This sample includes the largest CO2 emitting country from each continent. We examine support for redistributing revenues from carbon taxes to low- and middle-income households, caps on income and wealth, and universal basic services (UBS) based on representative survey data (total sample size of 11,964). We analyse the importance of knowledge-based, value-based, and socio-demographic factors for explaining policy support and compare differences in associations between the six countries using ordered logistic regression models for pooled data with country fixed effects and within-country analyses.
The contributions of this article are threefold. First, by exploring support for eco-social policies in a diverse set of countries, we empirically expand on the hitherto euro-centric focus in eco-social policy research and show that support is considerably higher in middle-income compared to high-income countries. The use of representative samples directly relates to calls from Savin and Van Den Bergh (Reference Savin and Van Den Bergh2024) to gather robust empirical data on public support for these types of policies. Second, utilizing ordered logistic regression approaches, our results stress the importance of attitudinal and ideological factors over demographic variables in explaining public support within countries. This supports and expands previous findings by Fritz and Eversberg (Reference Fritz and Eversberg2023) and Khan et al. (Reference Khan, Emilsson, Fritz, Koch, Hildingsson and Johansson2023), suggesting a superiority of value-based over demographic explanations within countries, but following patterns of self-interest – people in poorer countries are more supportive than those in richer countries – at the macro level. Third, accounting for country differences, we are able to identify similarities and context-specific differences that offer robust empirical evidence for recent theoretical models to explain public support for eco-social policies (Gugushvili & Otto, Reference Gugushvili and Otto2023).
2. Sustainable welfare and eco-social policies
Sustainable welfare has emerged as a concept that aims to capture the synergies between social and environmental objectives (Koch & Mont, Reference Koch and Mont2016) and between social justice and ecological sustainability (Fritz & Lee, Reference Fritz and Lee2023). At its core, sustainable welfare is concerned with ‘satisfying human needs within ecological limits, from an intergenerational and global perspective’ (Koch & Mont, Reference Koch and Mont2016, p. 704). Satisfying and meeting human needs represents the lower of two boundaries in line with concepts such as ‘provisioning systems’ (Fanning et al., Reference Fanning, O’Neill and Büchs2020), needs-based approaches (Max-Neef, Reference Max-Neef1991), social foundations (Raworth, Reference Raworth2017), and consumption corridors (Fuchs et al., Reference Fuchs, Sahakian, Gumbert, Di Giulio, Lorek and Graf2021). Ecological limits are based on biophysical or planetary boundaries (Richardson et al., Reference Richardson, Steffen, Lucht, Bendtsen, Cornell, Donges, Drüke, Fetzer, Bala, Von Bloh, Feulner, Fiedler, Gerten, Gleeson, Hofmann, Huiskamp, Kummu, Mohan, Nogués-Bravo and Rockström2023; Rockström et al., Reference Rockström, Gupta, Qin, Lade, Abrams, Andersen, Armstrong Mckay, Bai, Bala, Bunn, Ciobanu, DeClerck, Ebi, Gifford, Gordon, Hasan, Kanie, Lenton, Loriani and Zhang2023; Steffen et al., Reference Steffen, Richardson, Rockström, Cornell, Fetzer, Bennett, Biggs, Carpenter, de Vries, de Wit, Folke, Gerten, Heinke, Mace, Persson, Ramanathan, Reyers and Sörlin2015), bringing to the forefront philosophies of limitarianism (Robeyns, Reference Robeyns2023).
The goal of eco-social policies, then, is to put sustainable welfare into practice by identifying and steering societies and economies towards a safe operating space based on maximum and minimum levels for needs satisfaction. In broad terms, this implies the promotion of new patterns of production, consumption, and investment (Koch, Reference Koch2018) that should be based on (a) providing minimum basic needs, (b) tackling environmentally harmful luxury, (c) promoting social and political inclusion, (d) ensuring a fair distribution of resources and opportunities, and (e) decoupling financial reliance of the welfare state from economic growth (Bohnenberger, Reference Bohnenberger2020; Büchs, Reference Büchs2021; Koch, Reference Koch2022).
Often-discussed examples include redistributing revenues from carbon or energy taxes to the population to reverse regressive distributional impacts (Büchs et al., Reference Büchs, Ivanova and Schnepf2021; European Commission, 2022; Gough, Reference Gough2017, pp. 139–140), policies that promote greater income and wealth equality (Galgóczi, Reference Galgóczi2022; Koch, Reference Koch2022; Khan et al., Reference Khan, Emilsson, Fritz, Koch, Hildingsson and Johansson2023), working time reduction (Benegiamo et al., Reference Benegiamo, Guillibert and Villa2023; Koch, Reference Koch2022; Lee & Koch, Reference Lee and Koch2023; Otto & Gugushvili, Reference Otto and Gugushvili2020), UBS (Bohnenberger, Reference Bohnenberger2020; Büchs, Reference Büchs2021; Coote & Percy, Reference Coote and Percy2020; Gough, Reference Gough2019), and universal basic income or minimum income schemes (Bohnenberger, Reference Bohnenberger2020; Büchs, Reference Büchs2021; Koch, Reference Koch2022; Langridge, Reference Langridge2024; McGann & Murphy, Reference McGann and Murphy2023; Nenning et al., Reference Nenning, Bridgen, Zimmermann, Büchs and Mesiäislehto2023). In this article, we focus on one policy that is aimed at the lower boundary, primarily targeting the satisfaction of human needs and promoting social inclusion: UBS; one policy targeting the upper boundary of biophysical limits and luxury consumption: income and wealth caps; and one policy with a predominant focus on the fair distribution of costs and benefits related to environmental policies: a redistributive carbon tax.
2.1. Universal basic services
The core principle of UBS is that
services that satisfy people’s basic needs, including health and social care, education, and basic level of housing, food, mobility and information, should be provided to everyone through public or collective institutions according to need, regardless of the ability to pay and free at the point of use. (Büchs, Reference Büchs2021, p. 3; see also Coote & Percy, Reference Coote and Percy2020; Gough, Reference Gough2019)
Concretely, UBS covers services which already exist in many countries such as public health services and education, but sustainable welfare debates propose to expand them to include the provision of public transport, sustainable home energy, or ecological social housing (Coote & Percy, Reference Coote and Percy2020). Büchs (Reference Büchs2021) theoretically analysed how UBS may meet criteria of sustainable welfare. In terms of the four principles or goals of sustainable welfare, UBS aims primarily, but not exclusively, at the satisfaction of human needs in a current context of inflated housing prices, increasing prices for public transport, and volatile energy prices, where markets are unable to meeting everyone’s basic needs (Bowman et al., Reference Bowman, Ertürk, Froud, Johal and Law2014).
UBS also has the potential to bolster social and political inclusion. The satisfaction of basic needs creates the material condition for individuals to be more autonomous and frees up capacity to participate in democratic processes and initiatives (Büchs, Reference Büchs2021).
Lastly, whether and how UBS contributes to maintaining planetary boundaries depends on their design and the state’s political willingness to be a sustainable role model in the provision of public services. Whereas reducing energy poverty and homelessness as well improving people’s mobility through free provision of public transport will result in small increases in carbon emissions (Bruckner et al., Reference Bruckner, Hubacek, Shan, Zhong and Feng2022), these services could be designed in an ecologically friendly way – e.g. vouchers for renewable energy for electricity, energy efficient social housing, electric public transport – that would minimize emission increases (Brand-Correa & Steinberger, Reference Brand-Correa and Steinberger2017). In addition, the potential increase in consumption to provide for basic needs, and the resulting emissions, could be counter-acted with measure to reduce ‘consumption at the top end of the distribution’ (Büchs, Reference Büchs2021, p. 5).
2.2. Income and wealth caps
There are several key mechanisms through which people at the top-end of the income and wealth distribution negatively affect planetary boundaries (Green & Healy, Reference Green and Healy2022; Nielsen et al., Reference Nielsen, Nicholas, Creutzig, Dietz and Stern2021). First, there has been ample and robust empirical evidence that wealthy individuals contribute disproportionately to carbon emissions (Büchs, Koch, et al., Reference Büchs, Koch, Lee, Eastwood and Heron2024; Köchling et al., Reference Köchling, Koller, Straßheim, Rehm, Chancel, Diehl, Schupp and Renner2025; Otto et al., Reference Otto, Kim, Dubrovsky and Lucht2019; Schöngart et al., Reference Schöngart, Nicholls, Hoffmann, Pelz and Schleussner2025). At an individual level, high-income, high-status, or high-wealth individuals have personal carbon footprints multiple times higher than their national average, for instance due to more frequent and longer air travel (Wadud et al., Reference Wadud, Adeel and Anable2024), larger or multiple homes, and emissions from private and work-related vehicle use (Oswald et al., Reference Oswald, Owen and Steinberger2020). At the aggregate level, the wealthiest 10% are responsible for around 50% of global emissions (Kartha et al., Reference Kartha, Kemp-Benedict, Ghosh, Nazareth and Gore2020) and for two-thirds of overall temperature increases (Schöngart et al., Reference Schöngart, Nicholls, Hoffmann, Pelz and Schleussner2025).
There is robust evidence for a positive relationship between income inequality and carbon emissions in high-income countries (Grunewald et al., Reference Grunewald, Klasen, Martínez-Zarzoso and Muris2017; Pickett et al., Reference Pickett, Wilkinson, Gauhar and Sahni-Nicholas2024; Rojas-Vallejos & Lastuka, Reference Rojas-Vallejos and Lastuka2020). Although redistribution to the poor will increase their energy use (Jorgenson et al., Reference Jorgenson, Schor and Huang2017), the resulting increases in carbon emissions from higher energy use would be marginal – in the area of 0.9–1.4% (Büchs et al., Reference Büchs, Cass, Mullen, Lucas and Ivanova2023) or 1.6–2.1% (Bruckner et al., Reference Bruckner, Hubacek, Shan, Zhong and Feng2022) – compared to the potential emissions reductions from caps resulting in higher energy savings achieved among high-income household (Büchs et al., Reference Büchs, Cass, Mullen, Lucas and Ivanova2023).
Second, high-wealth individuals contribute indirectly to emissions through investments in stocks and real estate or through ownership of production capacities linked to fossil fuels (Nielsen et al., Reference Nielsen, Nicholas, Creutzig, Dietz and Stern2021) and by using their power to hinder political processes related to the introduction of climate policies (Brulle, Reference Brulle2018; De Bruycker & Colli, Reference De Bruycker and Colli2023; Kenner, Reference Kenner2019; Robeyns, Reference Robeyns2019).
Third, economic inequality, but in particular the increasing shares of income and wealth at the top end of the distribution act as impediment to cooperation and collective action as they are decreasing trust among citizens and in politicians (Barone & Mocetti, Reference Barone and Mocetti2016; Fairbrother & Martin, Reference Fairbrother and Martin2013; Graafland & Lous, Reference Graafland and Lous2019). This is a crucial negative consequence of economic inequalities. Collective action is not only a fundamental condition for climate action but also promotes social and political inclusion. Revenues from a cap on incomes and wealth, which often tends to be operationalized as a marginal tax rate of 100% above a certain monetary value (François et al., Reference François, Mertens De Wilmars and Maréchal2023), could be used to finance UBS, thereby indirectly contributing to a fair distribution of resources and opportunities and decoupling financial reliance of the welfare state from economic growth.
2.3. Redistributive carbon tax
The last eco-social policy – revenue recycling from carbon taxes as a redistribution tool – is more commonly discussed in economic and policy research outside sustainable welfare circles (Carattini et al., Reference Carattini, Kallbekken and Orlov2019; Jagers et al., Reference Jagers, Martinsson and Matti2019; Klenert et al., Reference Klenert, Mattauch, Combet, Edenhofer, Hepburn, Rafaty and Stern2018; Maestre-Andrés et al., Reference Maestre-Andrés, Drews, Savin and van den Bergh2021; Mohammadzadeh Valencia et al., Reference Mohammadzadeh Valencia, Mohren, Ramakrishnan, Merchert, Minx and Steckel2024; Sumner et al., Reference Sumner, Bird and Dobos2011). Whereas there are different ways in which revenues could be used, for example to fund environmental projects (Carattini et al., Reference Carattini, Kallbekken and Orlov2019; Maestre-Andrés et al., Reference Maestre-Andrés, Drews and van den Bergh2019), here we focus on the distribution of carbon tax revenues to low-income households, in line with the social and justice dimension of eco-social policies and sustainable welfare. This type of policy can alleviate the regressive consequences of carbon or energy taxes and improve fair distribution of the sharing of costs and responsibilities.
2.4. Public support for eco-social policies
While the aforementioned policies are prominently discussed from a conceptual and theoretical perspective (Bohnenberger, Reference Bohnenberger2020, Reference Bohnenberger2023; Fitzpatrick et al., Reference Fitzpatrick, Parrique and Cosme2022), empirical studies examining their support remain limited in number and scope (Savin & Van Den Bergh, Reference Savin and Van Den Bergh2024). This is an important omission.
Studies have repeatedly demonstrated a positive association between public opinion on a given policy topic and policy responsiveness. An early systematic review by Burstein (Reference Burstein2003) concluded that the impact of public opinion on public policy is ‘substantial’, and more recent evidence in the domains of environmental (Agnone, Reference Agnone2007; Anderson et al., Reference Anderson, Böhmelt and Ward2017) and climate policy (Schaffer et al., Reference Schaffer, Oehl and Bernauer2022) further substantiates this finding. However, we acknowledge that public opinion is not the sole factor shaping policy outcomes. Its influence tends to be strongest when the issue is highly salient (Agnone, Reference Agnone2007; Anderson et al., Reference Anderson, Böhmelt and Ward2017), while countervailing forces – such as lobbying by organized interests (Böhler et al., Reference Böhler, Hanegraaff and Schulze2022; De Bruycker & Colli, Reference De Bruycker and Colli2023) and compromise-seeking in coalition-based parliamentary democracies (Bellamy, Reference Bellamy2012; Martin, Reference Martin2004) – can dilute or redirect policy proposals. Taken together, this suggests that while favourable public opinion does not guarantee that the policies ultimately implemented will fully reflect public preferences, it is often a necessary condition for an issue to reach and remain on the policy agenda.
Existing research identified varying levels of support for different eco-social policies. Support for UBS has shown to be particularly high. For example, 66% of the Swedish population endorsed free public transport (Lee et al., Reference Lee, Koch and Alkan-Olsson2023), and a survey of the German public reported similarly high support, with 69% in favour (Wehrmann, Reference Wehrmann2019). In Sweden, national policy under the right-leaning government has prioritized reducing fuel taxes to lower petrol and diesel prices, yet public transport policy is largely formulated at the municipal and regional levels. Several municipalities have introduced free public transport, reflecting and reinforcing the broader public support for such measures (Fare-Free Public Transport, n.d.). A comparable development occurred in Germany. In 2022, the coalition government introduced the ‘Deutschlandticket’, which allowed unlimited access to all public transport and regional trains for only €9 per month. Among the 13.5 million people who used it, 89% supported its continuation (Gewerkschaftsbund, Reference Gewerkschaftsbund2025).
A special Eurobarometer survey showed that 71% of the EU population supported taxing high-carbon products and redistributing revenues to vulnerable households (European Commission, 2022, p. 107). Similarly, several studies, including one meta-analysis, have demonstrated that carbon tax revenue recycling to lower income households increases support for carbon taxes (Maestre-Andrés et al., Reference Maestre-Andrés, Drews, Savin and van den Bergh2021, Reference Maestre-Andrés, Drews and van den Bergh2019; Mohammadzadeh Valencia et al., Reference Mohammadzadeh Valencia, Mohren, Ramakrishnan, Merchert, Minx and Steckel2024; Sumner et al., Reference Sumner, Bird and Dobos2011). In line with these public demands, the European Union recently introduced the Social Climate Fund. The Fund is designed ‘to cushion the impact [of the EU Emissions Trading System] on those who may struggle the most’ – vulnerable people and small businesses – and will be financed through revenues generated from the upcoming EU ETS2 (European Commission, 2025). Similarly, the former German coalition government comprised of SPD, Greens, and FDP had agreed to introduce a ‘climate allowance’ to compensate households for rising costs associated with carbon pricing. Although this measure has not yet been implemented, it has recently been the subject of renewed parliamentary debate in Germany (Reference BundestagBundestag, n.d..), again suggesting a link between public opinion and policy responsiveness.
Several studies found medium levels of support for redistributive policies such as income and wealth caps. For instance, Khan et al. (Reference Khan, Emilsson, Fritz, Koch, Hildingsson and Johansson2023) discovered that around 40% of the Swedish population supported a wealth tax and 25% a cap on incomes, while Lee et al. (Reference Lee, Koch and Alkan-Olsson2023) found that 24% of the urban Swedish population endorsed a cap on incomes.
The three main types of explanations for public support for eco-social policies highlight the role of (1) value-based factors, (2) demographic characteristics as measures of self-interest, and (3) knowledge-related factors. People with more ‘left’-leaning attitudes and values, e.g. those that support redistribution, equality, and altruistic and biospheric values, tend to be more supportive of eco-social policies or mutually support climate and social policies (Fritz & Eversberg, Reference Fritz and Eversberg2023; Fritz & Koch, Reference Fritz and Koch2019; Gugushvili & Otto, Reference Gugushvili and Otto2023; Khan et al., Reference Khan, Emilsson, Fritz, Koch, Hildingsson and Johansson2023; Otto & Gugushvili, Reference Otto and Gugushvili2020).
Findings on socio-demographic characteristics such as income, age, and gender have been less coherent. One the one hand, studies find that people on higher incomes tend to be less supportive of eco-social policies, probably because high-income earners are less supportive of redistributive policies (Emilsson, Reference Emilsson2022; Khan et al., Reference Khan, Emilsson, Fritz, Koch, Hildingsson and Johansson2023; Otto & Gugushvili, Reference Otto and Gugushvili2020). On the other hand, however, Fritz and Koch (Reference Fritz and Koch2019) find that high earners express more support for joint climate and social policies, perhaps driven by the fact that high earners are more supportive of climate policies (Arndt et al., Reference Arndt, Halikiopoulou and Vrakopoulos2023; Beiser-McGrath & Busemeyer, Reference Beiser-McGrath and Busemeyer2024; Fairbrother et al., Reference Fairbrother, Johansson Sevä and Kulin2019; Gugushvili & Otto, Reference Gugushvili and Otto2023). Similarly, age has not been consistently associated with different types of eco-social policies (Emilsson, Reference Emilsson2022; Fritz & Koch, Reference Fritz and Koch2019; Khan et al., Reference Khan, Emilsson, Fritz, Koch, Hildingsson and Johansson2023). Lastly, identifying as a woman has been shown to be positively linked to support for eco-social policies (Emilsson, Reference Emilsson2022; Fritz & Koch, Reference Fritz and Koch2019; Khan et al., Reference Khan, Emilsson, Fritz, Koch, Hildingsson and Johansson2023). In terms of education, some research finds that higher levels have a positive association with support for eco-social policies (Emilsson, Reference Emilsson2022; Fritz & Koch, Reference Fritz and Koch2019; Otto & Gugushvili, Reference Otto and Gugushvili2020), while others did not find an association (Khan et al., Reference Khan, Emilsson, Fritz, Koch, Hildingsson and Johansson2023).
In sum, empirical research examining support for eco-social policies and the drivers thereof remains scarce, with a focus on single European countries. The few existing international, cross-country studies did not actually investigate eco-social policies, but rather synergies between separate welfare and climate policy proposals.
This leaves room for several important questions that we intend to address empirically in this article. First, how strong is public support for eco-social policies in countries with diverse socio-economic conditions, cultures, social welfare systems, and degrees of climate vulnerability? Second, what are the most important drivers of this support and do they differ across countries? To answer these questions, we examine public support for the three aforementioned eco-social policies – redistribution of carbon tax revenues, income and wealth caps, and UBS – in three middle-income and three high-income countries, covering the largest CO2 emitting country from each continent.
3. Methods
3.1. Data
Data were collected by the international market research firm Skopos Research using online surveys. We instructed Skopos to draw approximately 2000 individuals from each of the six countries (see below) so that each country sample meets representative quotas for age, gender, and income.
We received ethical approval from the Leeds University Business School’s ethical board (reference: LTLUBS-339) prior to data collection. Participants were informed about the aims of this research prior to participation and gave consent for their anonymized data to be used for publication purposes.
We designed the questionnaire in English and Skopos translated it into the respective languages. We collected data from Brazil (N = 2000), China (N = 2027), South Africa (N = 2011), Germany (N = 2013), UK (N = 1906), and USA (N = 2007) which are three middle-income (Brazil, China, and South Africa) and three high-income countries (Germany, USA, and UK). Our sample includes the country with the largest carbon emissions from each continent, cumulatively responsible for 49% of total global CO2 emissions (Global Carbon Budget, 2024). In terms of social floors and planetary boundaries Germany, the USA and UK are in the high planetary overshoot – low social shortfall corridor, China and Brazil build part of the high overshoot – middle shortfall corridor and South Africa is part of a group of countries characterized by high planetary overshoot and high social shortfall (Fanning et al., Reference Fanning, O’Neill, Hickel and Roux2022).
The survey took around 8 minutes to complete and included questions on the individual’s beliefs, values, support for different climate policy instruments and different eco-social policy proposals, and socio-demographic characteristics. Detailed overviews of each survey question used in the study can be found in Table 1 in the supplementary materials. Sample demographics can be found in the supplementary materials Tables 2–7.
3.2. Measurements
We collected data on attitudes towards three eco-social policies: UBS (‘The government should put healthcare, education, and energy production into public hands and make them freely available to all citizens’), an income and wealth cap (‘The government should implement a cap on excessive income and wealth to reduce emissions from luxury consumption’), and a redistributive carbon tax (‘The government should distribute revenues from a carbon tax to low- and middle-income households to support them with price increases’). Participants indicated their support for each of these policies on a 6-point Likert-type scale ranging from (1) = ‘strongly disagree’ to (6) = ‘strongly agree’.
We included four different well-established ideological variables: biospheric values, individualistic worldviews, political trust, and free-market beliefs.
Biospheric values were measured on a 3-item (e.g. ‘Preventing pollution: protecting natural resources’), 7-point Likert-type scale developed by De Groot and Steg (Reference De Groot and Steg2008) ranging from (1) = ‘not at all important to me’ to (7) = ‘very important to me’.
Political trust was based on a 4-item, 7-point Likert-type scale measure by Harring and Jagers (Reference Harring and Jagers2013) that asks participants to rate how much they trust (a) the government, (b) the parliament, (c) public authorities, and (d) politicians from (1) = ‘not at all’ to (7) = ‘extremely’.
To measure individualistic worldviews, we drew on Kahan et al.’s (Reference Kahan, Jenkins‐Smith and Braman2011) 6-item (e.g. ‘The government should stop telling people how to live their lives’, ‘Sometimes the government needs to make laws that keep people from hurting themselves’), 6-point Likert-type scale that ranged from (1) = ‘strongly disagree’ to (7) = ‘strongly agree’.
Free-market beliefs was a 6-item, 6-point Likert-type scale measure ranging from (1) = ‘strongly disagree’ to (6) = ‘strongly agree’ (e.g. ‘An economic system based on free markets unrestrained by government interference automatically works best to meet human needs’) developed by Heath and Gifford’s (Reference Heath and Gifford2006).
We also included a measure of self-reported climate change knowledge by Vainio and Paloniemi (Reference Vainio and Paloniemi2013). Participants had to rate the degree to which they feel informed about the causes, consequences, and ways to fight climate change, ranging from (1) = ‘not informed at all’ to (4) = ‘well informed’. Last, we included several socio-demographic variables that had previously been linked to policy support (Bergquist et al., Reference Bergquist, Nilsson, Harring and Jagers2022): age, gender, income, and education.
3.3. Statistical methods
To draw conclusions across- and within-country differences in eco-social policy support, we used three different statistical methods: chi-squared tests, mixed multivariate analysis of variance (MANOVA), and ordered logistic regression models. To test for significant differences in the proportion of supporters, non-supporters, and those undecided in their support across countries, we used chi-squared tests. For each eco-social policy, we coded those who selected ‘Strongly disagree’ and ‘Disagree’ as non-supporters, those who selected ‘Strongly agree’ and ‘Agree’ as supporters, and the rest as undecided.
As we were interested in the similarities and differences of associations between our main ideological predictors and support for each eco-social policy, we used ordered logistic regression models. First, we used the pooled data including participants from all countries and regressed support for each eco-social policy on the different independent variables described above, including country binary variables. Second, to draw out within-country effects, we performed the same three regressions – one for each eco-social policy – but separately for each country sample. This allowed us to compare the associations between independent variables and eco-social policy support across countries, identifying commonalities and differences.
We checked for multicollinearity in the full regression models using variance inflation factors (see supplementary materials Table 8). Here, we excluded income because of a high share of missing observations for individuals in Brazil. As can be seen in Tables 2 and 3 in the supplementary materials, coefficient estimates for the main predictors did not change significantly in the pooled sample with and without income.
4. Results
4.1. Support across eco-social policies across countries
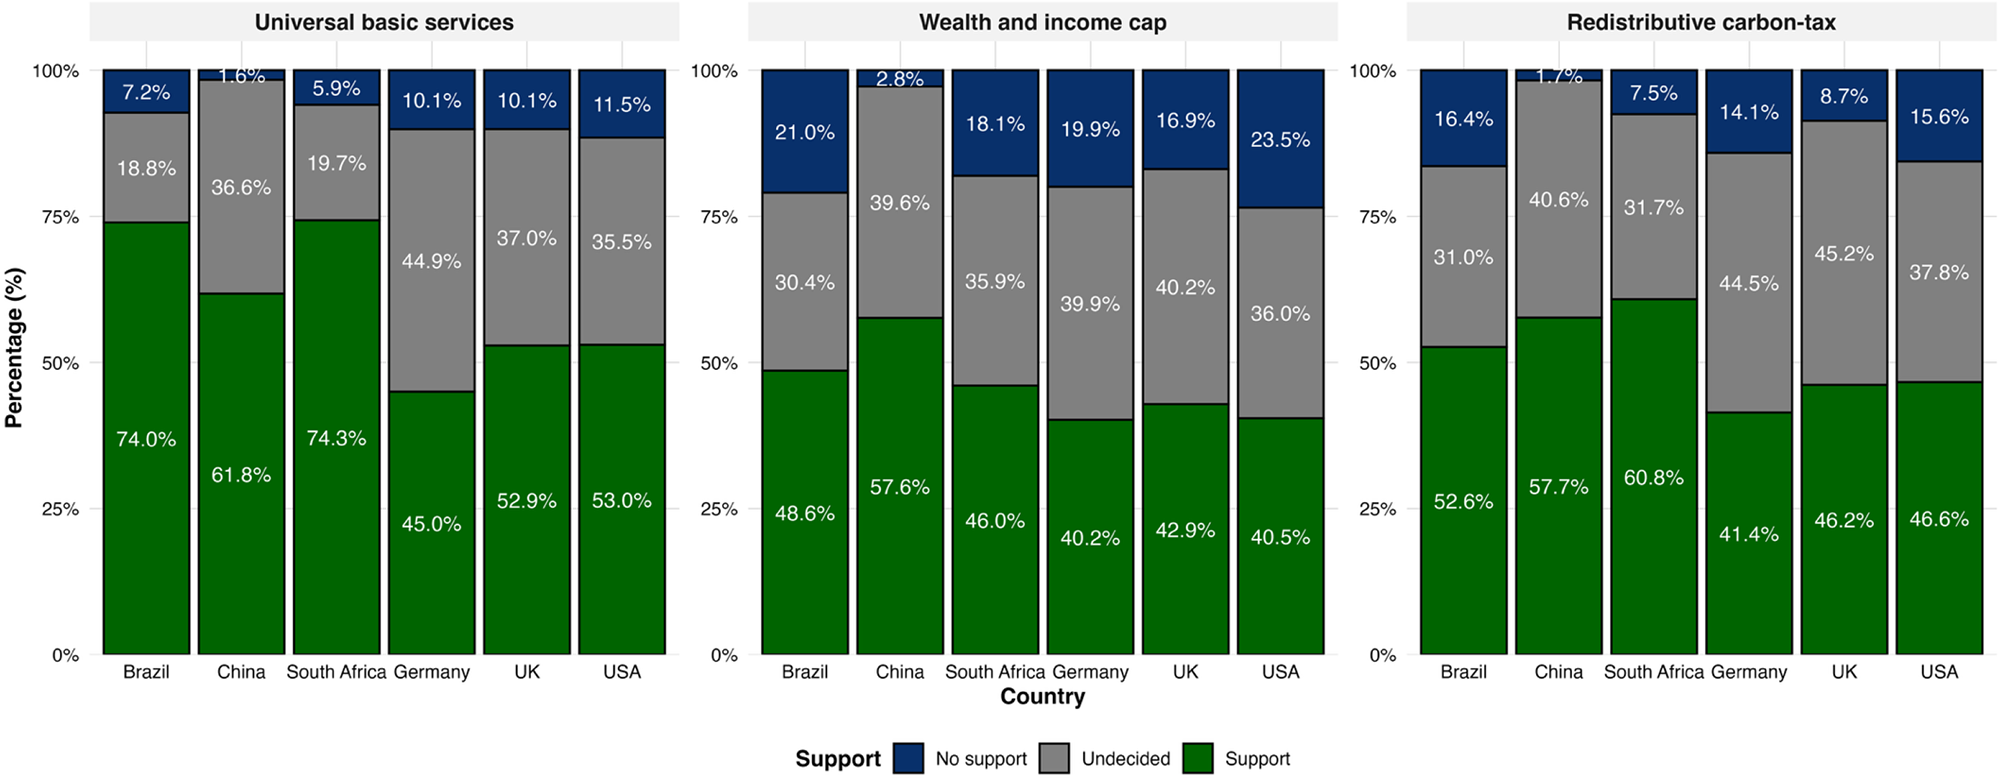
The proportions of supporters, non-supporters, and undecided respondents per eco-social policy and country are presented in Figure 1. Support varied between countries for all three eco-social policies (725.35 < χ 2 < 1234.66, all dfs = 25, all ps < .001). For a redistributive carbon tax, we find majority support in Brazil (53%), China (58%), and South Africa (61%). In the USA (47%) and the UK (46%), slightly less than half of the public support this eco-social policy, whereas only 4 in 10 (41%) people in Germany are supporters. For a cap on income and wealth, there is only majority approval in China, where 58% support this policy, followed by Brazil with just below half (49%) and South Africa (46%). In the UK (43%), the USA (41%) and Germany (40%) around 4 in 10 support a cap on income and wealth. Lastly, UBS enjoyed the highest share of public support in each country. Three quarters of participants in Brazil (74%) and South Africa (74%) support this eco-social policy, 6 in 10 people in China (62%), just above half in the USA (53%) and the UK (53%) and 45% in Germany. Interestingly, opposition to each eco-social policy is comparatively low, while the shares of undecided people are in most cases around a third or higher. A mixed MANOVA test, comparing difference in mean values for each policy across the six countries, provides further evidence for significant differences between countries (F(10,23,914) = 49.93, p < .001, η p = .02).

Figure 1. Proportion of individuals per country and eco-social policy and response. Support includes those that ‘strongly agree’ and ‘agree’, no support includes those that ‘strongly disagree’ and ‘disagree’ and undecided those that stated ‘somewhat agree’ or ‘somewhat disagree’.
4.2. Explanatory factors for eco-social policy support across countries
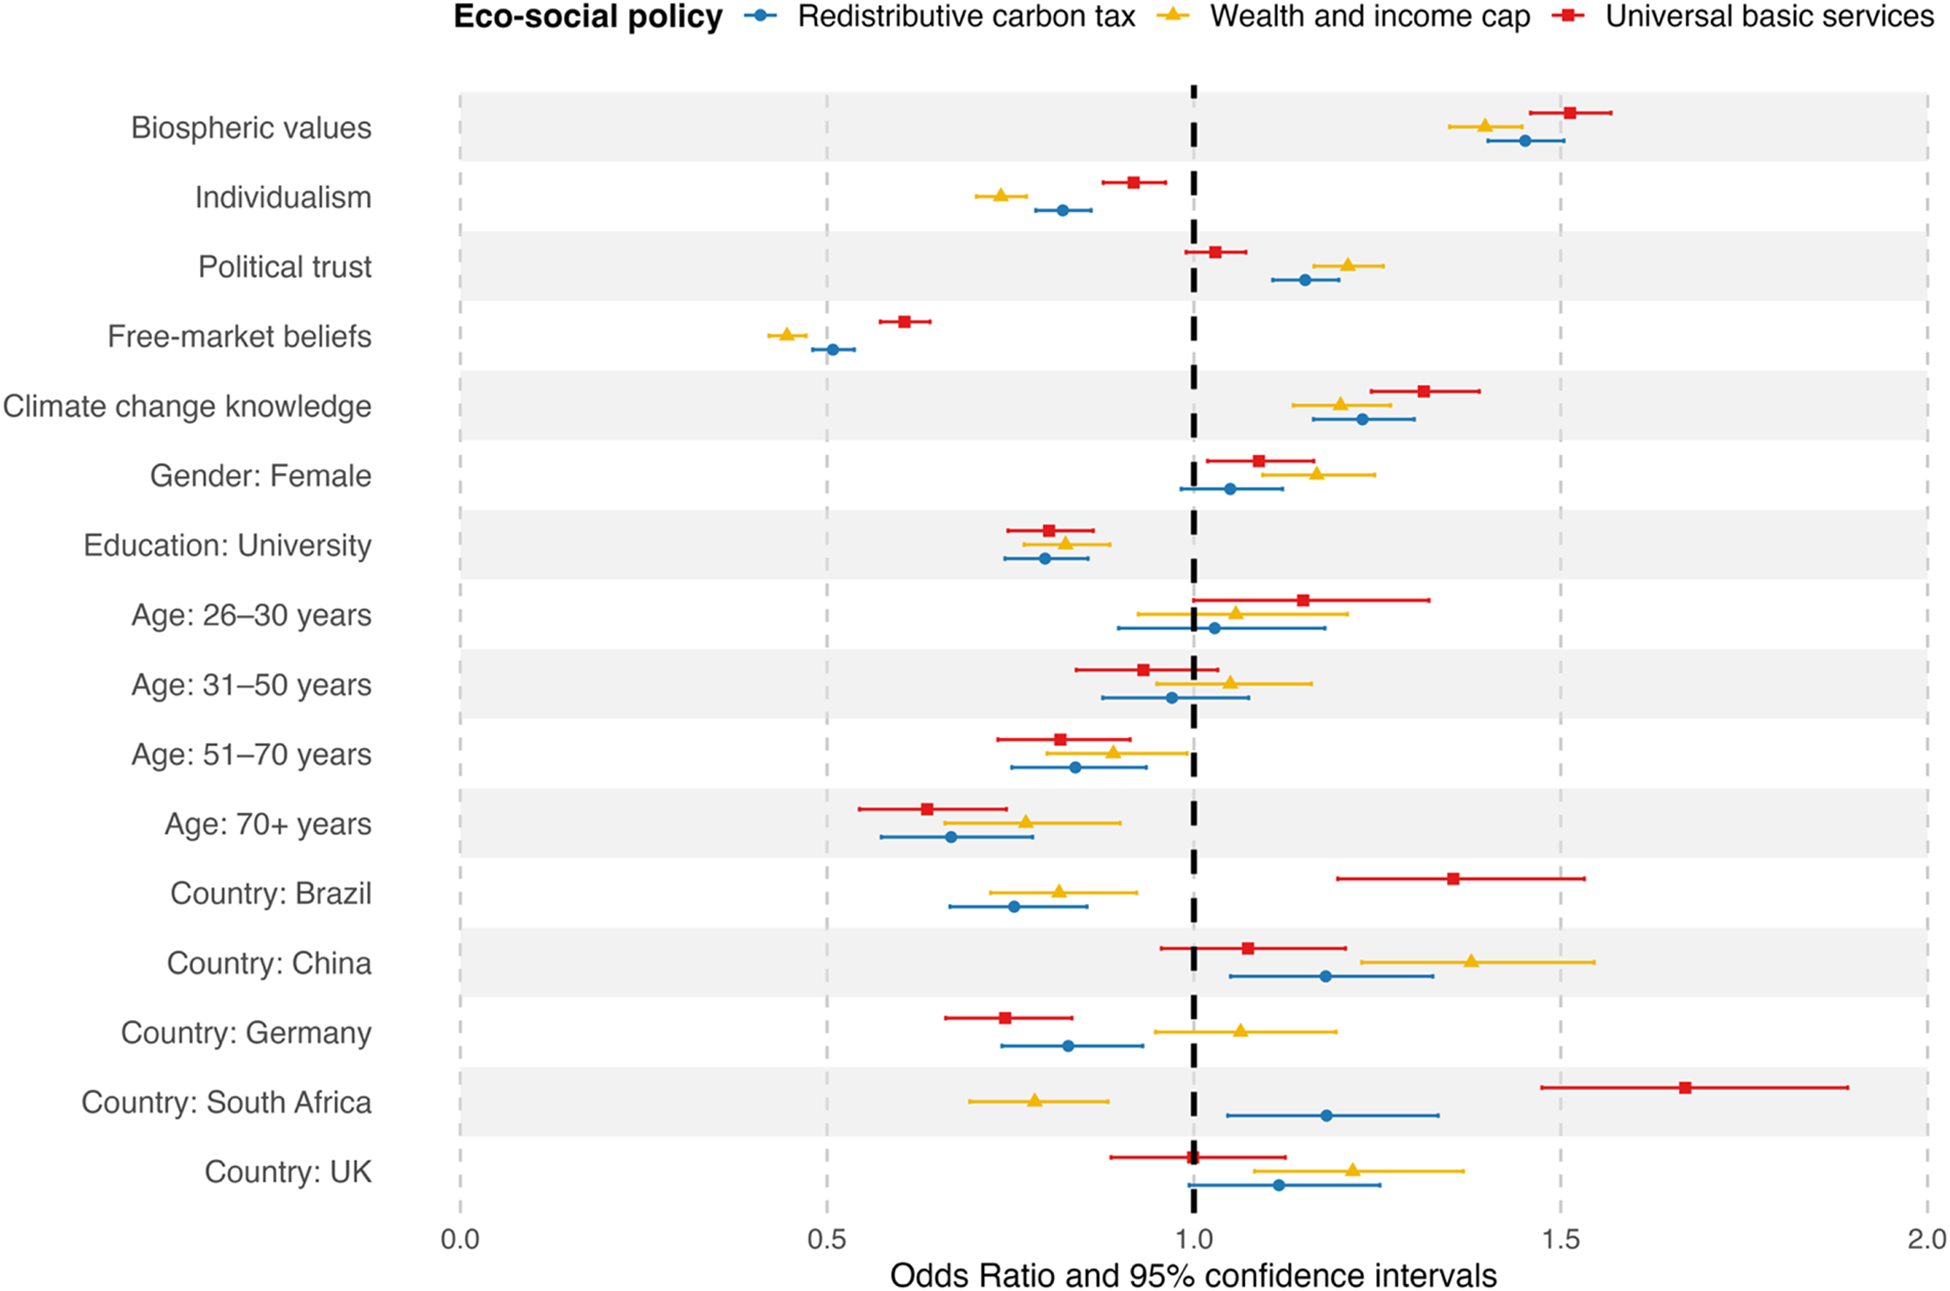
To identify broader patterns in eco-social policy support, we examined explanatory factors across the full sample, pooling data from all six countries. Results from the three ordered logit models – each corresponding to one of the policies – are presented in Figure 2, with full regression tables available in the supplementary materials.

Figure 2. Odds ratios (ORs) with 95% confidence interval from ordered logit regression model based on pooled data from all six countries (N = 11,967). Dots, triangles, and squares depict estimated ORs with bars showing 95% confidence interval. Blue shows association between independent variables and support for redistribution of carbon taxes, yellow for income and wealth caps, and red for universal basic services. Reference group for gender: female is ‘male’, for education: university is ‘no university degree’, reference for the age groups is ‘18–25 years’, and reference group for country is ‘USA’.
Even after controlling for value-based, knowledge-based, and demographic variables, statistically significant cross-country differences persist. Compared to respondents in the USA (the reference category), participants in Brazil (OR = 1.35, p < .001) and South Africa (OR = 1.67, p < .001) show higher support for UBS, while respondents in Germany are significantly less supportive (OR = 0.74, p < .001). Regarding a redistributive carbon tax, participants in China (OR = 1.18, p = .006) and South Africa (OR = 1.18, p = .007) express higher levels of support than those in the USA, whereas respondents in Germany again exhibit lower support (OR = 0.83, p = .001). Differences between the USA and the UK were found to be non-significant in both cases. For income and wealth caps, support is lower than in the USA in Brazil (OR = 0.82, p = .001) and South Africa (OR = 0.78, p < .001) but higher in China (OR = 1.38, p < .001) and the UK (OR = 1.22, p = .001). These findings underscore the role of contextual national factors in shaping public preferences for eco-social policies.
Across the pooled data, value-based variables are strongly and consistently associated with policy support. Biospheric values are positively associated with support for all three policies: a one-point increase on the biospheric value scale increases the odds of supporting income and wealth caps (OR = 1.40, p < .001), a redistributive carbon tax (OR = 1.45, p < .001), and UBS (OR = 1.51, p < .001). Individualism, by contrast, is associated with lower support, particularly for income and wealth caps (OR = 0.74, p < .001), followed by a redistributive carbon tax (OR = 0.82, p < .001) and UBS (OR = 0.92, p < .001). Political trust is positively associated with support for a redistribution of carbon tax revenues (OR = 1.15, p < .001) and income and wealth caps (OR = 1.21, p < .001) but is not significant for UBS (OR = 1.03, p = .154). Free-market beliefs consistently predict lower support across all three policies: a one-point increase on the free-market scale is associated with a 39% decrease in the odds of supporting UBS (OR = 0.61, p < .001), a 49% decrease for a redistributive carbon tax (OR = 0.51, p < .001) and a 55% decrease for income and wealth caps (OR = 0.45, p < .001).
Findings related to knowledge-based variables reveal some counterintuitive patterns. Self-reported climate change knowledge is positively associated with policy support: those reporting higher climate knowledge are more likely to support a redistributive carbon tax (OR = 1.23, p < .001), income and wealth caps (OR = 1.20, p < .001), and UBS (OR = 1.31, p < .001). Conversely, holding a university degree is negatively associated with support: respondents with a degree are less likely to support income and wealth caps (OR = 0.82, p < .001), a redistributive carbon tax (OR = 0.80, p < .001), and UBS (OR = 0.80, p < .001). This apparent contradiction may be partially explained by the weak correlation between education and climate knowledge (r = .175, p < .001), suggesting that formal education does not necessarily translate into perceived climate understanding. Another possibility may be university graduates’ higher incomes and the threat that some of these policies pose to their economic status.
Finally, demographic variables also show significant associations. Women are more likely than men to support income and wealth caps (OR = 1.17, p < .001) and UBS (OR = 1.09, p = .012), although no significant gender difference is found for a redistributive carbon tax (OR = 1.05, p = .150). Age differences are more pronounced: respondents aged 51–70 and those over 70 are significantly less supportive of all three policies compared to respondents aged 18–25. However, no significant differences are observed between the youngest group and those aged 26–50.
To assess differences in the joint explanatory power of values and demographics, we estimated separate logistic regression models for each policy instrument: one including only value-based variables (biospheric values, individualism, free-market beliefs, and political trust), and one including only demographic variables (age, gender, and education). We then compared these models using Akaike information criterion (AIC) and McFadden’s pseudo-R 2. A lower AIC indicates better model performance, as it implies less information loss. The value-based models performed substantially better for all three eco-social policies: for the redistributive carbon tax (AIC_value-based = 35,641.7; AIC_demographics = 37,729.6), for income and wealth caps (AIC_value-based = 37,603.4; AIC_demographics = 40,275.1), and for UBS (AIC_value-based = 34,402.4; AIC_demographics = 36,055.5). The same pattern emerged when comparing McFadden’s pseudo-R 2, where higher values indicate better model fit. For each policy – the redistributive carbon tax (pseudo-R2_value-based = 0.063; pseudo-R2_demographics = 0.005), income and wealth caps (0.074 vs. 0.005), and UBS (0.056 vs. 0.007) – the pseudo-R2 of the value-based model was at least eight times higher than that of the demographics-only model. The results underline the importance of value-based over demographic factors in explaining eco-social policy support.
4.3. Explanatory factors for eco-social policy support within countries
As noted in the previous section, biospheric values and free-market beliefs are the strongest and most consistent predictors of eco-social policy support across the six countries in our sample, with the former positively and the latter negatively associated with support for all three policies. However, qui-squared, MANOVA, and ordered logit regression models reveal visible and statistically significant differences in support across countries. To better understand these national-level variations and the factors shaping policy preferences within each context, we conducted country-specific multivariate ordered logit regressions. A summary of key findings is presented here, with full regression tables available in the supplementary materials (Tables 10–16).
We found robust evidence for the relationship between eco-social policy support and biospheric values, free-market beliefs, and individualism, ceteris paribus. With minor exceptions, public support was positively correlated with biospheric values and negatively correlated with free-market beliefs and individualism in all countries. In contrast to such consistent findings, we found that self-reported climate change knowledge was positively associated with eco-social policy support mostly in the three middle-income countries (Brazil, South Africa, and China). While higher education was negatively associated with eco-social policy support in the USA and Germany, we found a positive association in the UK and no association in Brazil, China, and South Africa. The correlations between policy support and demographic variables such as age, gender, and income were less consistent, varying not only by country but also by eco-social policy. The relationship between income and policy support was negative for a redistributive carbon tax in the USA, UK, Germany, and South Africa and for income and wealth caps in the UK, Germany, South Africa, and China.
5. Discussion
We have examined public attitudes towards eco-social policies and various socio-demographic and ideological predictors of attitudes across six diverse countries – Brazil, China, South Africa, USA, UK, and Germany – including the largest emitter from each continent. We find highest support across all countries for UBS, receiving majority support in all countries except Germany. This echoes results for Sweden where two thirds of the population support one element of UBS: free public transport (Lee et al., Reference Lee, Koch and Alkan-Olsson2023). This finding also suggests that meeting basic needs and reducing the economic burden is for many people more important than taxing the rich or introducing a carbon tax and redistributing after.
A redistributive carbon tax received majority support in the three middle-income countries but less support among the population in the three high-income countries (41–47%). On the one hand, when compared to previous research on support for a carbon tax using the same dataset (Bretter & Schulz, Reference Bretter and Schulz2025), these findings demonstrate that a carbon tax in combination with socially targeted revenue recycling enjoys considerably more support among the public compared to a carbon tax on its own. On the other hand, this suggests that a redistributive carbon tax is not sufficient for generating majority support in high-income countries but may need to be combined with revenue recycling for environmental projects (Maestre-Andrés et al., Reference Maestre-Andrés, Drews, Savin and van den Bergh2021; Mohammadzadeh Valencia et al., Reference Mohammadzadeh Valencia, Mohren, Ramakrishnan, Merchert, Minx and Steckel2024).
A cap on income and wealth only received majority support in China, but with large shares of support in the other five countries (40–49%). This level of support is substantially higher than found in studies by Khan et al. (Reference Khan, Emilsson, Fritz, Koch, Hildingsson and Johansson2023) and Lee et al. (Reference Lee, Koch and Alkan-Olsson2023) in Sweden. One reason for this might be the phrasing of the policy item. Khan et al. (Reference Khan, Emilsson, Fritz, Koch, Hildingsson and Johansson2023) set a numeric, and arguably relatively low target for a cap on yearly incomes of around €150,000 gross and Lee et al. (Reference Lee, Koch and Alkan-Olsson2023) only state ‘a maximum income’ but do not specify a numerical cap. Recent research has shown that moving the baseline of taxing the rich changes public support (Kane & Newman, Reference Kane and Newman2023). Our policy item referred to ‘excessive income and wealth’ and specified the goal to ‘reduce emissions from luxury consumption’. Our phrasing and results are in line with those by Trump (Reference Trump2025) who finds that conspicuous consumption by the rich is positively linked to people supporting taxing the rich.
It is important to point out that large shares of the public in each country were still undecided (19–45%) with relatively little outright opposition to these three eco-social policies (2–24%). This uncertainty may either reflect the unfamiliarity or an actual indifference with regard to these relatively new policies. Either way, this appears to be an opportunity to convince undecided individuals.
In line with Gugushvili and Otto’s (Reference Gugushvili and Otto2023) theoretical framework, we find that country context matters. People in the three middle-income countries showed significantly higher support across all eco-social policies. UBS in particular was popular, supported by three quarters of the public in Brazil and South Africa. In other words, individuals in countries with more social shortfalls (Fanning et al., Reference Fanning, O’Neill, Hickel and Roux2022) are more supportive of policies that simultaneously address social and ecological issues. Similarly, support for a cap on income and wealth only passed the 50% threshold in China, a country that has witnessed incredible improvements in the standard of living but is characterized by astronomical increases in income and wealth at the top and related income and wealth inequalities (World Inequality Database, 2025). Significant country differences remain even after controlling for value-based, knowledge-based, and demographic factors.
We also find that beliefs, either related to the environment or ‘free markets’, matter most for public attitudes towards eco-social policies; more so than socio-demographics such as age, gender, education, or income. This is not to say that socio-demographics do not play a role (Emilsson, Reference Emilsson2022; Fritz & Koch, Reference Fritz and Koch2019; Khan et al., Reference Khan, Emilsson, Fritz, Koch, Hildingsson and Johansson2023; Otto & Gugushvili, Reference Otto and Gugushvili2020). However, as we have demonstrated, engaging with ideological factors seems to provide a considerably bigger lever to increase support for eco-social policies. Our results are thus aligned with previous research that found more altruistic and biospheric values to be related to stronger support for eco-social policy (Fritz & Eversberg, Reference Fritz and Eversberg2023; Fritz & Koch, Reference Fritz and Koch2019; Gugushvili & Otto, Reference Gugushvili and Otto2023; Khan et al., Reference Khan, Emilsson, Fritz, Koch, Hildingsson and Johansson2023; Otto & Gugushvili, Reference Otto and Gugushvili2020). Yet, our study also crucially extends this finding to three middle-income countries. This strengthens the importance that values and worldviews play, suggesting a robust relationship beyond regional and cultural boundaries.
Moreover, the substantial role that ideologies play in affecting attitudes towards eco-social policies across all countries demonstrates that preference for polices is not necessarily determined by an objective evaluation of evidence, nor by the socio-economic position an individual holds in society, but more so by biases grounded in ideologies. Providing factual information is thus unlikely to be sufficient to further increase public support and may in some instances even further increase ideological divides (Kahan et al., Reference Kahan, Braman, Slovic, Gastil and Cohen2009).
Results from the within-country analyses were crucial in identifying explanatory commonalities and differences across countries. Whereas biospheric values, beliefs in the superiority of the ‘free market’ and individualism show consistent relationships with policy support across countries, the relationship between knowledge-based factors and demographic variables with eco-social policy support are mixed and often context-specific. This implies that not only is eco-social policy support itself contingent on country context (Gugushvili & Otto, Reference Gugushvili and Otto2023) but so are the factors influencing support.
In general, however, strengthening collectivist worldviews and values that highlight the benefits of climate action for society seems to be a key action to enhance public support for eco-social policies across the six countries we examined. Over the past 50 years individualist values and practices have increased around the globe (Santos et al., Reference Santos, Varnum and Grossmann2017), and so have neoliberal values related to free-market beliefs (Lawn & Prentince, Reference Lawn and Prentince2015). While these developments run counter to the values we have identified as beneficial for eco-social policy support, they also show that value change is possible. Belief systems build up early in life (Osberg et al., Reference Osberg, Schulz and Bretter2024), so bringing climate change and eco-social policies into school curricula is one crucial step. Identifying factors that influence the initiation and fostering of values towards care for others and nature should thus take more prominence in research on policy support (Osberg et al., Reference Osberg, Schulz and Bretter2024).
5.1. Policy implications
Our findings suggest several actionable insights for national governments aiming to advance eco-social policy agendas in diverse national contexts. One of the clearest implications is the strong and consistent support for UBS, particularly in countries with greater unmet social needs. Policymakers should consider expanding or initiating investments in public services such as healthcare, education, housing, and free public transport. However, without any sustainability conditionality, UBS might increase carbon emissions. But through public or collective provisions, UBS can more easily be provided in climate friendly ways, e.g. by supporting investments in renewable energy and public transport infrastructures. In addition, UBS could be offered as vouchers for renewable energy for electricity, energy efficient social housing and electric public transport (Brand-Correa & Steinberger, Reference Brand-Correa and Steinberger2017). When designed in this way, UBS has the potential to minimize or even avoid potential emission increases from improving living conditions at the bottom-end of the income distribution, and when combined with measures that target ‘luxury’ energy use, aggregate emission savings can be achieved. UBS can serve as a politically viable starting point for integrated approaches that combine social equity and environmental sustainability. In these cases, UBS should be framed not only as social support but also as tools for achieving climate and ecological goals, thus creating a dual rationale that resonates with a wide range of citizens. Here middle-income countries may need more financial support and leeway – debt cuts, lower interest rates, grants instead of loans – to implement UBS.
Carbon pricing is another area where design matters. Our results show that redistributing carbon tax revenues to low- and middle-income households significantly increases public support, especially in middle-income countries. However, in high-income contexts, this redistribution alone may not be enough to secure majority support. Policymakers in these settings might consider combining revenue recycling with visible investments in environmental projects such as renewable energy, green public transport, or public green spaces. Transparent communication about how revenues are used and who benefits is crucial to build trust and legitimacy.
Support for capping income and wealth, although not dominant in all countries, is notably high given the historical sensitivity of such measures. We found that, in comparison to previous survey results, public support is higher when income and wealth caps are framed in terms of reducing emissions from luxury consumption, with a focus on framing particular types of wealth as excessive. This framing highlights the environmental harm caused by excessive wealth and consumption, which can be a compelling rationale for action. In terms of ecological benefit, a cap on income and/or wealth or other measures that target ‘luxury’ energy use may be crucial to counteract potential emissions increases from a UBS (Büchs, Reference Büchs2021). A redistribution of emissions from over-emitting wealthy to low-emitting people in need is key for sustainable welfare. This also demonstrates the importance of eco-social policy packages. Each policy alone may be insufficient for fulfilling all three criteria of sustainable welfare: providing a social floor, creating an upper boundary, and a fair distribution of the costs and benefits. Yet, together they are more likely to be both ‘eco’ and ‘social’.
A particularly important finding is that ideological beliefs consistently play a stronger role in shaping policy support than socio-economic status or demographics. This has major implications for how governments should communicate policies. Rather than relying solely on factual information or appeals to material self-interest, policymakers should engage with the values and worldviews held by different segments of the population. Messaging that connects eco-social policies to ideas of fairness, justice, responsibility, or economical may be more persuasive and less polarizing than messages focused on climate change and the environment.
The presence of a large share of undecided respondents in all countries is another important signal. Many people are not opposed to eco-social policies but remain unfamiliar or uncertain. This offers a strategic opportunity to build support through inclusive dialogue, participatory processes, and clearer policy communication. Public deliberation forums, citizen assemblies, or locally grounded policy experiments could be effective tools to engage these audiences and build legitimacy from the ground up.
Finally, the results point to the need for context-sensitive strategies. While some ideological and value-based trends appear consistent across countries, other influencing factors – such as education, income, or climate knowledge – are highly context-specific. A universal, one-size-fits-all approach is unlikely to work. Instead, governments should tailor their strategies to the political, cultural, and institutional realities of their own societies.
5.2. Limitations and future research
The study has several limitations that should be acknowledged. First, while our analysis suggests a role for both material self-interest and value-based drivers of support for eco-social policies, more control questions would have been necessary to robustly differentiate between these explanations. Although we found only weak to moderate and inconsistent correlations between socio-demographic variables and value orientations across countries (see supplementary materials, Tables 17–23), these patterns explain only a small portion of the variation in support. Similarly, we focused on individual-level ideological and socio-demographic variables. As such, we did not take into account the considerable socio-economic and political differences between the countries. Country-level differences could also be down to the welfare systems in place and the beliefs associated with them. For example, collective levels of support for taxation (Cullen et al., Reference Cullen, Turner and Washington2021; Sachweh & Eicher, Reference Sachweh and Eicher2023) or redistributive policies could affect support for eco-social policies. All these differences could potentially account for different levels of support for eco-social policies across countries.
Second, the survey design introduces limitations, particularly in the middle-income countries. The online format likely led to an overrepresentation of highly educated and predominantly urban respondents, excluding segments of the population without reliable access to the internet or electricity. As such, our findings may not fully capture the views of more marginalized groups, potentially skewing the results towards those with higher access to resources and digital infrastructure.
Third, in the formulation of eco-social policy options – particularly the cap on income and wealth – we deliberately refrained from specifying a numerical threshold or ceiling. Prior research has shown that the level of such a cap can significantly affect public support (François et al., Reference François, Lee, Roman and Maréchal2025). Our intention was instead to focus on the underlying objective of curbing luxury consumption arising from excessive income and wealth. However, this more abstract framing may have influenced how respondents interpreted the policy.
Finally, while we measure general support for three key eco-social policies, our design does not capture important dimensions that influence policy preferences, such as perceived fairness, feasibility, or likely impact. Prior work has shown these factors to be important in shaping public attitudes (Bergquist et al., Reference Bergquist, Nilsson, Harring and Jagers2022; Poortinga, Reference Poortinga2025). Nevertheless, our results are to a large extent robust to omitted variables. Tenfold cross validation has shown that our model predicts the group of supporters accurately in 72–83% of the cases, depending on the eco-social policy under examination (see results in supplementary materials, Table 24).
As such, future research should (1) measure the role of particular institutional, political, and cultural factors at the macro level, (2) account for and experiment with different policy designs for UBS and income/wealth caps, (3) include measures on the understanding and perception of the policies, and (4) combine online surveys with both telephone and in-person surveys to reach poorer households in low- and middle-income countries. Given the urgency of support for climate-mitigating policies and the justice implications for citizens across the globe, more comparative research is much needed.
Supplementary material
The supplementary material for this article can be found at https://doi.org/10.1017/sus.2026.10048.
Acknowledgements
We thank Lina Lefstad for her valuable comments on earlier versions of this article and the two anonymous reviewers for the valuable feedback that substantially improved the quality of the article.
Author contributions
The study was designed by FS and CB. Data analysis was performed by CB and FS. The manuscript was co-authored by FS, CB, MB, and VT.
Financial support
This research study was supported by the Leeds University Business School Climate Change and Environmental Research Grant.
Competing interests
The authors have no competing interests to declare.
Research transparency and reproducibility
The dataset and R syntax used for the analysis are available on OSF using the following link https://osf.io/yeq8x/.


 Open access