


Food insecurity, defined as insufficient or inconsistent access to safe and nutritious food due to limited resources, impacts 37·2 million people (11·1 %) in the United States(Reference Coleman-Jensen, Rabbitt and Gregory1). Rural communities experience higher rates of food insecurity than urban communities (14·7 % and 12·5 %, respectively)(Reference Rabbitt, Hales and Burke2). Food insecurity is linked to chronic disease and poor mental health(Reference Bruening, MacLehose and Loth3–Reference Laraia, Siega-Riz and Gundersen6). These factors worsened during the COVID-19 pandemic among food pantry clients, with increased economic hardships and food needs resulting in greater psychological stressors(Reference Higashi, Sood and Conrado7).
Many food-insecure households utilise food pantries to meet their food needs, but pantries experience challenges with meeting demand and providing nutritious foods(Reference Weinfield, Mills and Borger8). Initially established as emergency food sources for families, food pantries have become primary, routine food sources for many. In 2020, 6·7 % of U.S. households reported using food pantries(Reference Coleman-Jensen and Rabbitt9). High prevalence of food insecurity in communities, increased demand, low access to healthy food and broader economic conditions have exacerbated pressures on food pantries(Reference Bazerghi, McKay and Dunn10,Reference Johnson, McKinley and Hossfeld11) . A qualitative study of operational barriers in rural Mississippi identified growing demand for services, stricter reporting requirements and infrastructure (including limited physical spaces) as key challenges(Reference Johnson, McKinley and Hossfeld11). Additionally, food pantries have limited resources to both provide enough food to meet demand and ensure high nutritional quality(Reference Brady, Kunkel and Baltaci12–Reference Helmick, Yaroch and Parks14). While food pantries address food insecurity, the food they provide does not always meet nutritional recommendations,(Reference Long, Narcisse and Rowland15) and clients’ reported consumption of fruits and vegetables is nutritionally inadequate(Reference An, Wang and Liu16). Given the low-cost and relatively high availability of energy-dense, nutritionally poor food, food pantries struggle to address food insecurity without contributing to diet-related diseases(Reference Popkin, Adair and Ng17). Despite the availability of evidence-based approaches to improve the nutritional quality of foods provided in charitable food settings, pantries are often hesitant to restrict donations and typically rely on volunteers and have modest capacity to implement appropriate nutrition policies(Reference Simmet, Depa and Tinnemann13,Reference Helmick, Yaroch and Parks14,Reference Helmick, Yaroch and Estabrooks18) . The increased use of food pantries during the COVID-19 pandemic further strained pantries through supply disruptions and reduced volunteerism(Reference Leone, Fleischhacker and Anderson-Steeves19).
Despite challenges, nutritional policy interventions and other food pantry-based interventions including nutrition education, providing recipes and increasing fresh food have succeeded in addressing food insecurity, improving overall nutrition intake, educating on healthy food choice, supporting diabetes management and improving access to community resources(Reference An, Wang and Liu16,Reference Morales, Vicente and LaMonaca20–Reference Long, Rowland and McElfish22) . A 2023 qualitative study identified five themes central to food pantries’ ability to implement healthy eating initiatives, including food pantry capacity and logistics, networks and relationships, community nutrition practitioner capacity, pantry user characteristics and stigma and stereotypes, highlighting the need for food pantry nutritional projects to consider both pantry- and community-level factors impacting implementation(Reference Yamoah, Schulte and Osborn23). A 2015 systematic review of nutrition policy and environmental strategies implemented in rural communities noted three common approaches to strategy adaptation, including accommodating long distances to food sources, tailoring strategies to local cultural and food preferences and building strong local partnerships(Reference Calancie, Leeman and Jilcott-Pitts24). While this review is relevant, there is limited documentation specifically on how rural food pantries implement nutritional policy interventions.
Our study’s main objective was to describe the implementation and mixed-method evaluation of nutrition-related policy, system and environmental (PSE) change strategies in a rural food pantry in a predominantly African American Georgia county. Specifically, we describe the implementation of nutrition-focused PSE strategies, factors that facilitated or hindered implementation and clients’ perceived changes in foods distributed.
Method
Programme description and setting
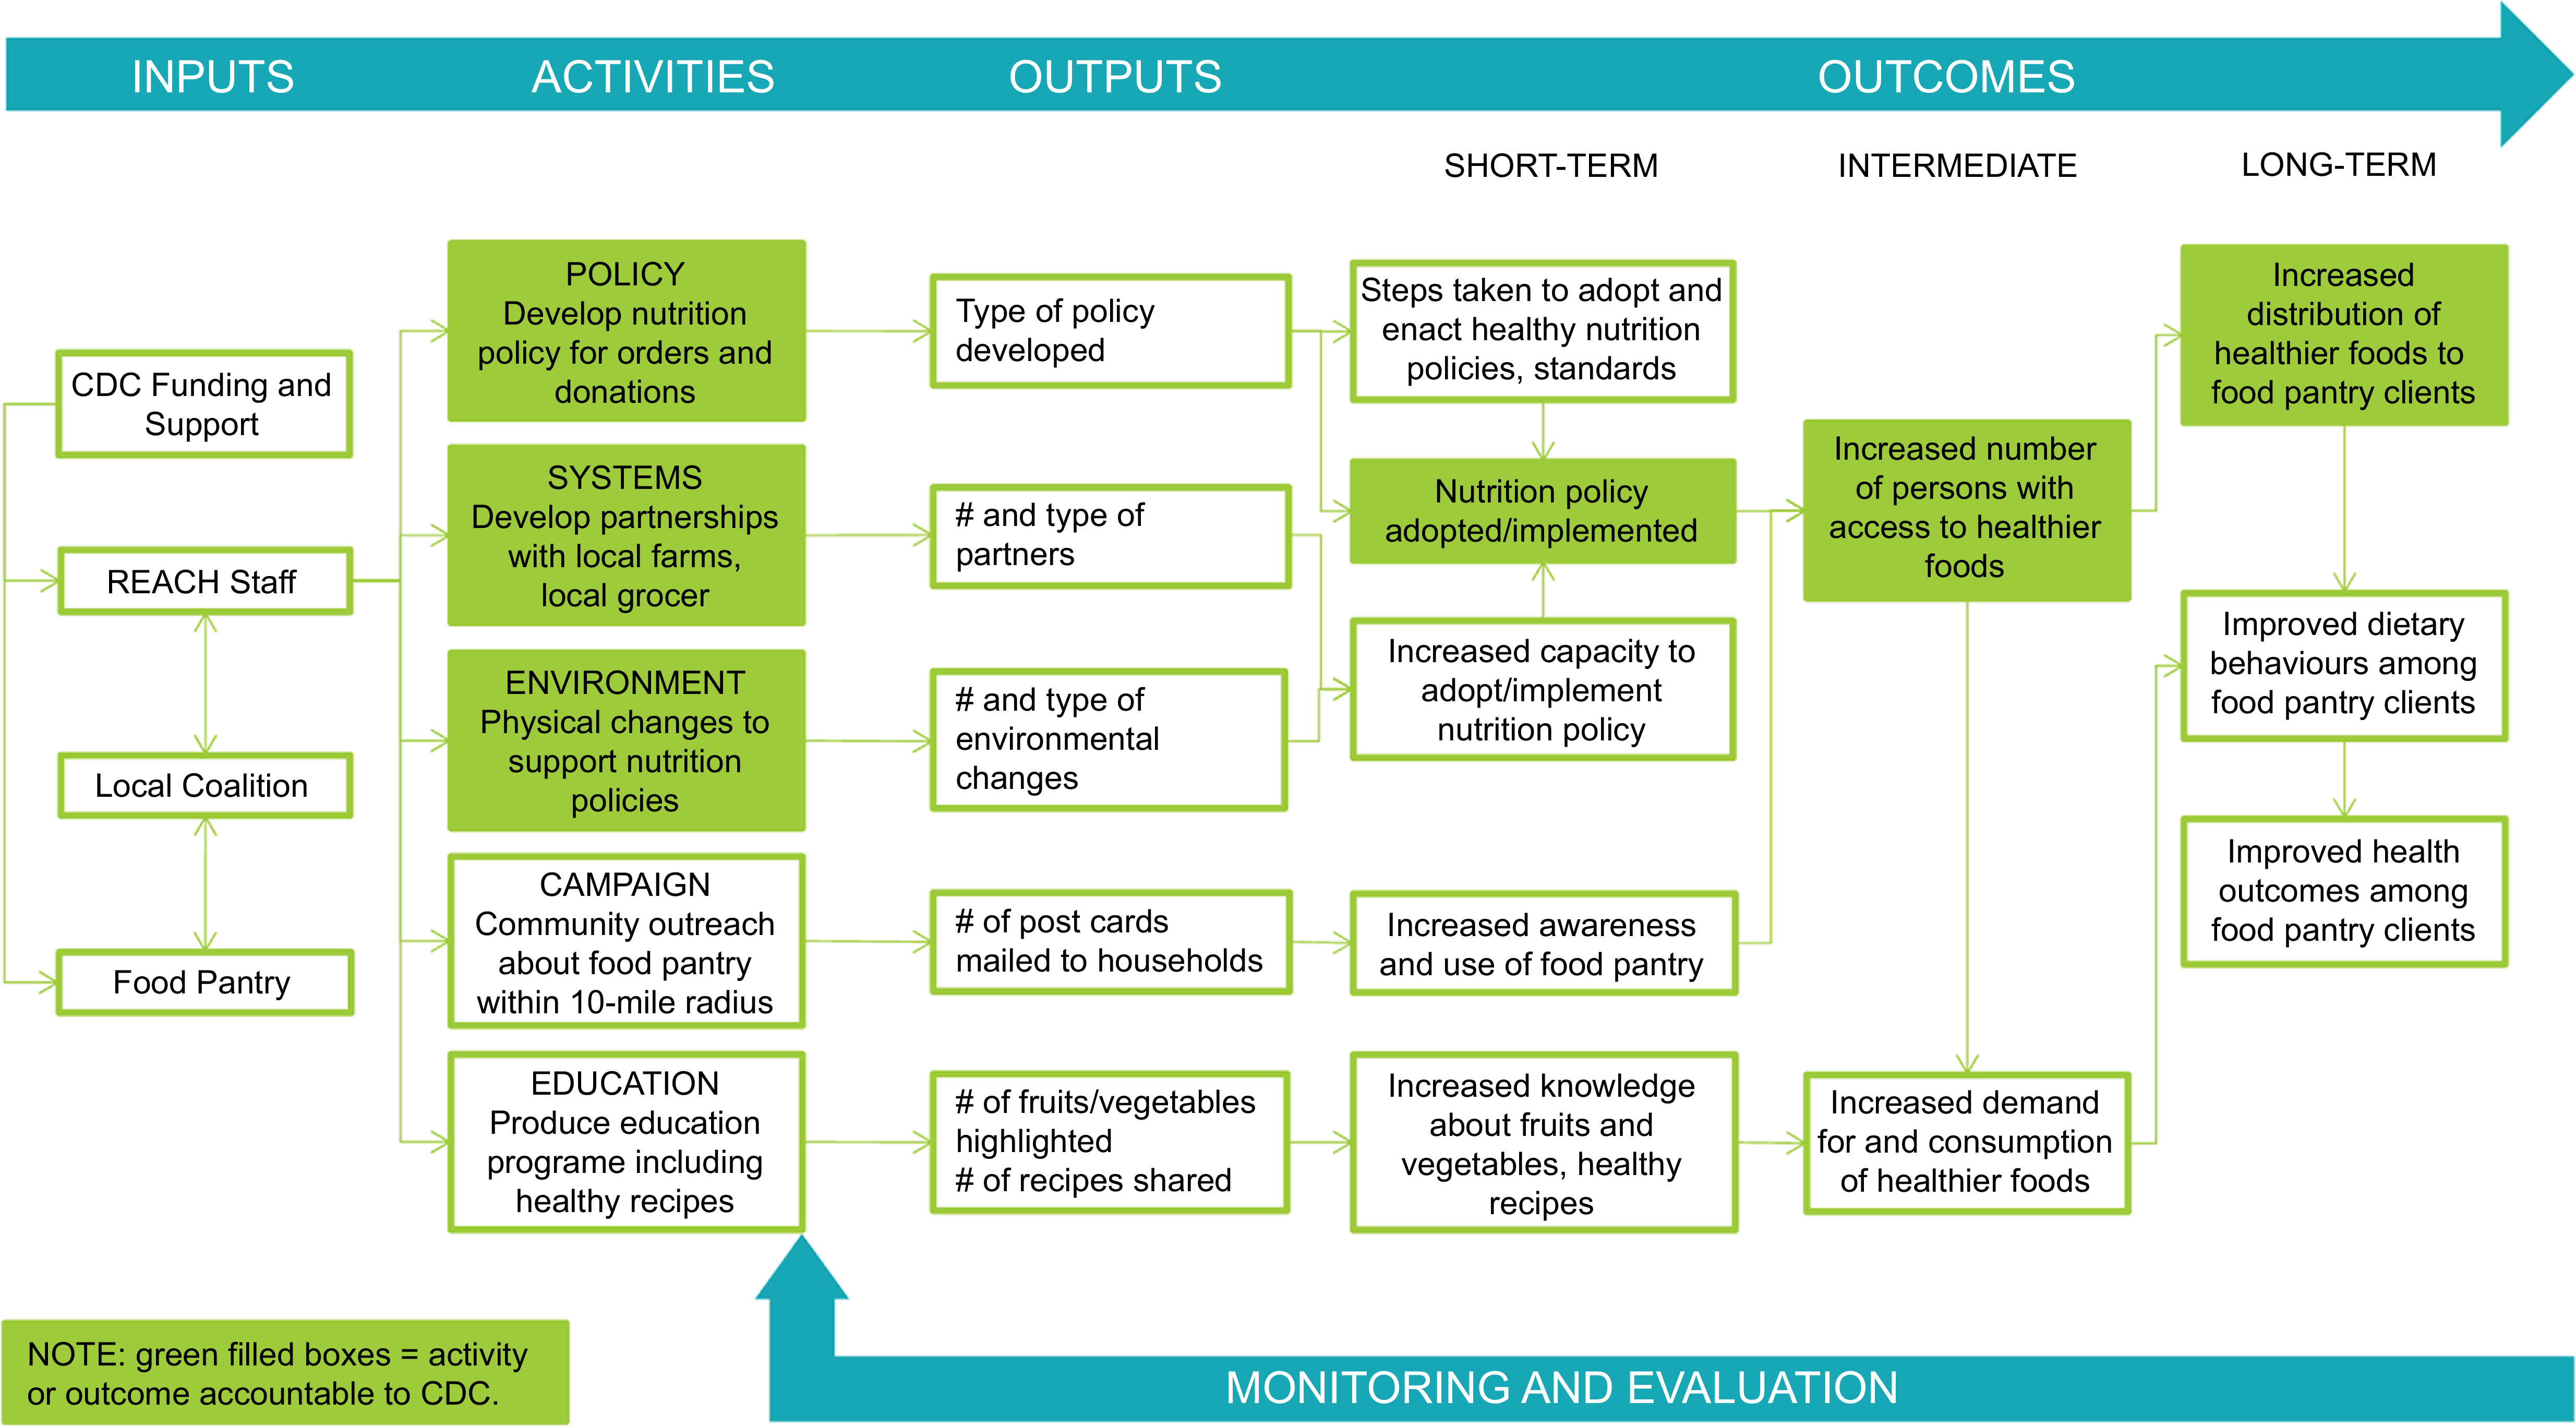
From 2018 to 2023, Georgia’s North Central Health District was funded through the Centers for Disease Control and Prevention (CDC) Racial and Ethnic Approaches to Community Health (REACH) programme(25) to implement culturally appropriate interventions among Black and African American residents of Hancock County, Georgia. Hancock County, located in rural north-central Georgia, has approximately 8500 residents, about 72 % identifying as African American or Black(26). County Health Rankings(27) data from 2018, the same year as the grant started, placed Hancock County 157th of 159 Georgia counties on economic indicators, 150th for health factors and 147th for health outcomes. Approximately one-third of Hancock County residents were living in poverty and 26 % were experiencing food insecurity(27). The Hancock County REACH team, including Georgia’s North Central Health District staff and local health coalition members, implemented evidence-based strategies to address nutrition, increasing access to healthier foods through improving local food systems. A logic model (Figure 1), developed collaboratively with REACH partners and informed by CDC programme guidance, illustrates anticipated outcomes of the nutrition-related strategies. Activities include developing a nutrition policy, establishing systems for expanding healthy food sources (i.e., partnerships for produce procurement), environmental changes (i.e., enhanced refrigeration) to support policy implementation, an awareness campaign and nutrition education. Short-, intermediate- and long-term outcomes included policy adoption and implementation, increased access to healthier foods and increased distribution of healthier foods.

Figure 1. Logic model for implementing nutrition strategies in a rural food pantry.
A key site for the Hancock REACH team’s nutrition work was a food pantry located 1-mile from the centre of the county seat. In June 2020, a formal agreement with REACH to work towards healthier food distribution commenced the collaboration with the food pantry. The food pantry received more than $30 000 in combined funding and related purchases to support their work with REACH over 3 years. The volunteer-managed food pantry is an important food source for county residents. From 2019 to 2023, the food pantry experienced substantial growth in the number of households served, with 408 households served (822 individuals, 9·4 % of county residents) in fiscal year 2020 and 626 households served (1250 individuals, 14·4 % of county residents) in fiscal year 2023, more than a 50 % increase in 3 years. Using a box model, the pantry prepares a set number of identical food boxes monthly, which are intended as a supplemental food source and not meant to provide households with food for the entire month. Clients pick up one box per month per household, on one of three distribution days.
Evaluation design
This mixed-methods evaluation of Hancock REACH efforts focused on a nutrition policy and implementation of supporting PSE changes in a local food pantry. Process and outcome evaluation questions are tied to logic model outcomes (Figure 1), including policy adoption/implementation steps (short-term), priority population reach (intermediate) and extent to which efforts to establish PSE changes led to increased distribution of healthier foods to clients (long-term). This study focuses on PSE change implementation procedures, partners, facilitators, barriers, lessons learned and client perceptions of changes in food distributed.
Data sources and measures
Programme documents
Programme documents included meeting notes, food pantry client records, nutrition policy documentation, memoranda of understanding, and grantee reports. Document review was secondary to key informant interviews and client surveys described below.
Key informant interviews
Semi-structured key informant interviews were conducted in late 2020 (n 5) before implementation of the food pantry’s nutrition policy and again in late 2022 (n 5) to capture details about PSE implementation and impacts. Interviews included five Georgia North Central Health District staff, one coalition member/food pantry volunteer and three food pantry leaders. One participant, a Georgia North Central Health District staff person, was interviewed at both time-points, totalling nine individuals interviewed. Interviews gathered implementer perspectives about planning and decision-making processes for strategy selection and partner development, perspectives on PSE approaches and other strategies, implementation challenges, facilitators, other contextual factors and key outcomes. Examples of questions asked include ‘The policy was officially implemented in March, 2021. What changed as a result of the guidelines? Did you change what went in the food boxes? Were there any negative consequences or downsides to implementing the guidelines?’ and ‘Do you think you will be able to continue this work once the REACH funding ends?’ Interviews were conducted via Zoom or telephone, and audio recordings were used to produce transcripts for analysis.
Food pantry client surveys
A baseline food pantry client survey was administered in January 2021 (n 292, 58·4 % response rate), before nutrition policy implementation in March 2021. A 1-year follow-up survey was conducted in March 2022 (n 287, 62·5 % response rate). The present study includes only respondents who completed client surveys at both time-points (n 155). At both time-points, a packet containing a promotional flyer, survey and pre-addressed/pre-paid return envelope was placed in each food box distributed throughout the month. The survey cover page explained the purpose and procedures, including eligibility (one adult per household), confidentiality and compensation. Clients who returned their completed survey received a $20 gift certificate to the county’s only grocery store. Key survey measures are described below. Whenever possible, the survey was composed of validated and/or widely used measures.
Food received at the food pantry
To assess the frequency of fourteen foods across five categories received in the food boxes at baseline and follow-up, we asked ‘How often did you receive each of the following foods from [food pantry] during the past 6 months?’ Food items were adapted from Long et al.(Reference Long, Narcisse and Rowland15) and Healthy Eating Research Nutrition Guidelines for Charitable Food Systems(Reference Schwartz, Levi and Lott28). The foods, by category, were (1) fruits and vegetables, (2) grains, (3) proteins, (4) dairy and (5) other foods. Response options were always/almost always, sometimes and rarely/never. Table 5 provides a comprehensive list of foods in each category.
Food selection preferences at the food pantry
Using the same set of foods described above, respondents indicated whether they wanted more, less or no change to the selection of foods available at the food pantry (‘If you could change the selection of foods available at the pantry, what would you change?’).
Food insecurity
A two-item screener(Reference Gundersen, Engelhard and Crumbaugh29) measured past-year individual-level food insecurity: ‘I worried whether my food would run out before I got money to buy more’ and ‘The food I bought just didn’t last and I didn’t have money to get more.’ Response options were never, sometimes or often. Those responding sometimes or often to at least one statement were classified as food insecure.
BMI
Self-reported height and weight(30) were used to calculate BMI following CDC’s formula for calculating adult BMI [weight (lb)/[height (in)]2 × 703](31).
Chronic conditions in the household
To assess household chronic disease status, we asked: Has a doctor ever told anyone in your household that they (or you): (a) Have type 2 diabetes or high blood sugar? (b) Have hypertension or high blood pressure? Response options were yes or no(Reference Caspi, Davey and Barsness32).
Health status
Respondents rated their general health status as excellent, very good, good, fair or poor(33).
Demographics
Measures were adapted from the American Community Survey(34) and Behavioral Risk Factor Surveillance System(30) and re-categorised as needed. Demographic characteristics included age in years (18–24, 25–34, 35–44, 45–54, 55–64, 65–74 and 75+), gender (female, male), race/ethnicity (African American/Black not of Hispanic origin, White not of Hispanic origin and other), educational attainment (8th grade or less, some high school, high school or GED certificate, some college or technical school and college graduate/post-graduate/professional degree), employment status (working full-time, working part-time, retired, not employed/homemaker/student/on disability and other), annual household income (<$10 000, $10 000–$25 000, $25 001–$50 000, >$50 000, don’t know and prefer not to answer), household size (open-ended) and children living in the home (yes/no).
Data analysis
Programme documents
We examined numerous programme documents to understand food pantry operations and implementation of PSE changes at the food pantry. Relevant information from programme documents was abstracted to fill in gaps not answered by other data sources.
Key informant interviews
We created a codebook to group interview text by major topics (relationship formation, PSE strategy descriptions, facilitators, barriers, lessons learned, other considerations and factors for sustainability). Transcripts were coded independently by two coders, and discrepancies were resolved through consensus. NVivo 12 was used for data management and analysis. Thematic analysis was performed on coded text to identify themes, and matrix-style tables helped identify patterns by participant role and year.
Food pantry client surveys
We conducted descriptive analyses including frequencies and cross-tabulations on demographic and key outcome variables. We used McNemar’s test to assess whether there were significant changes in key outcomes from pre- to post-implementation of the nutrition policy. A threshold of P < 0.05 was used to determine statistical significance. All analyses were conducted in SPSS 29.0.
Results
The results are organised by key logic model activities (e.g., develop nutrition policy, partnerships for produce procurement and environment changes) described in Figure 1.
Developing and implementing a nutrition policy
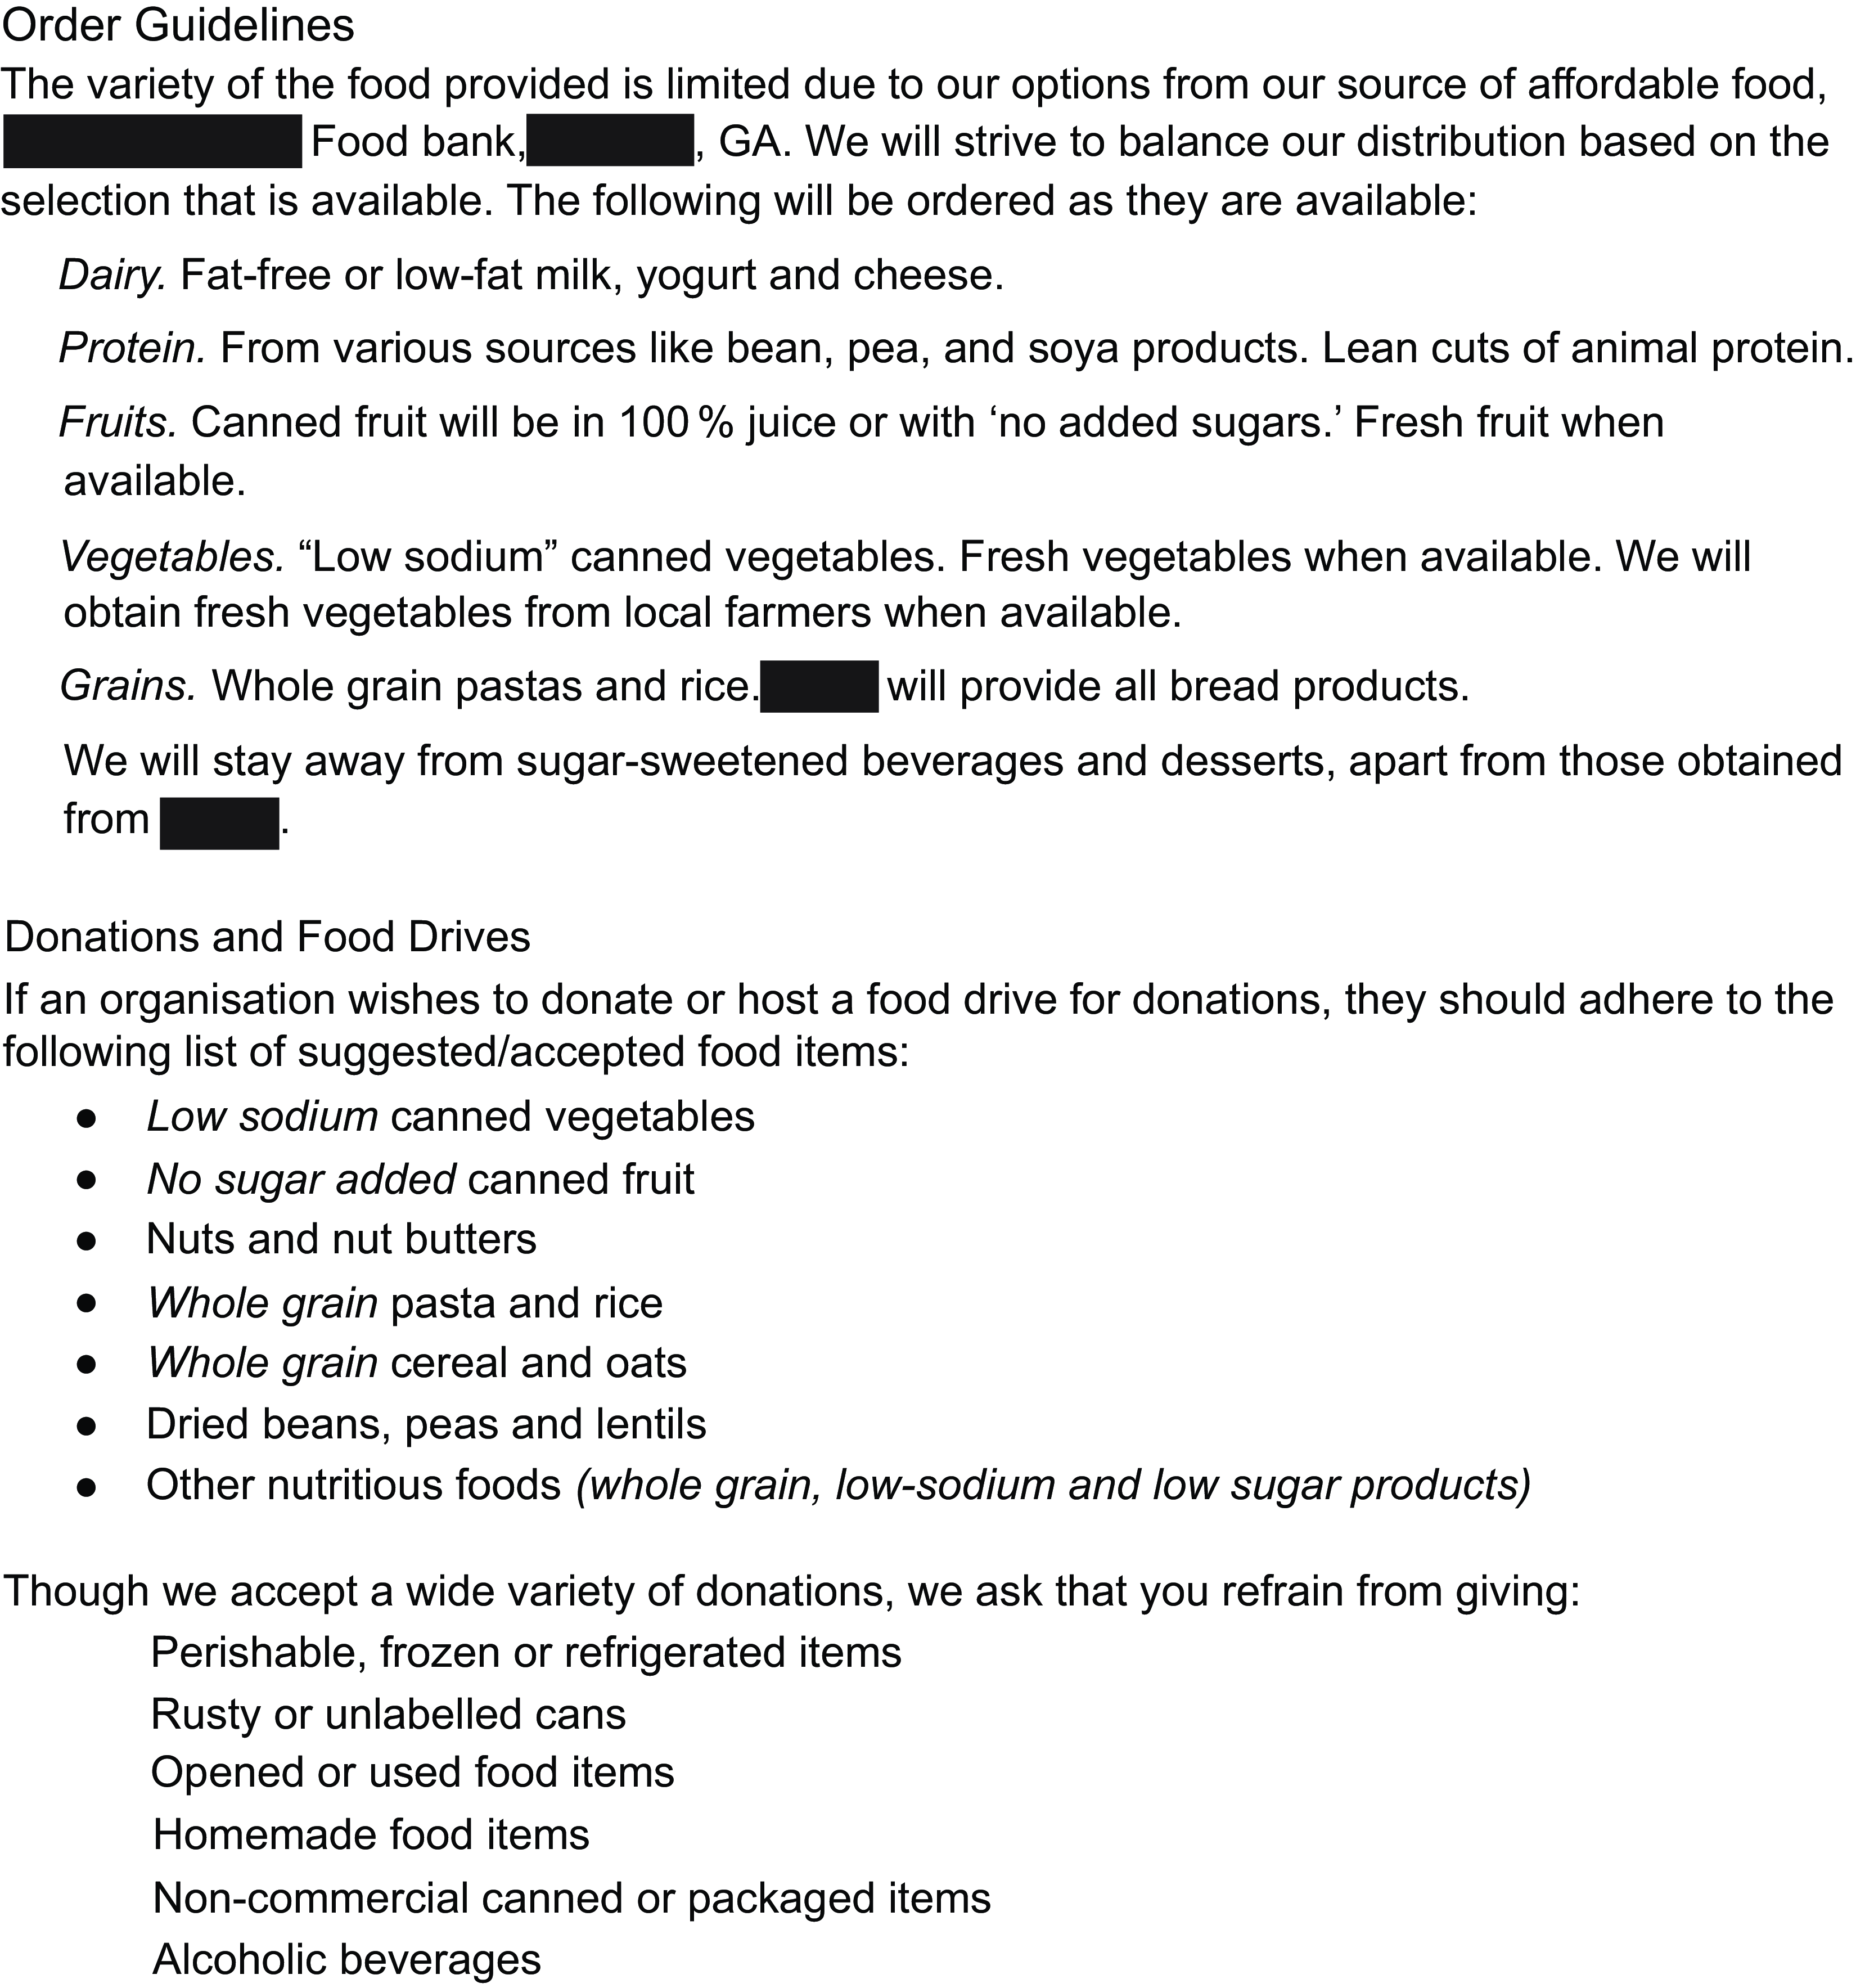
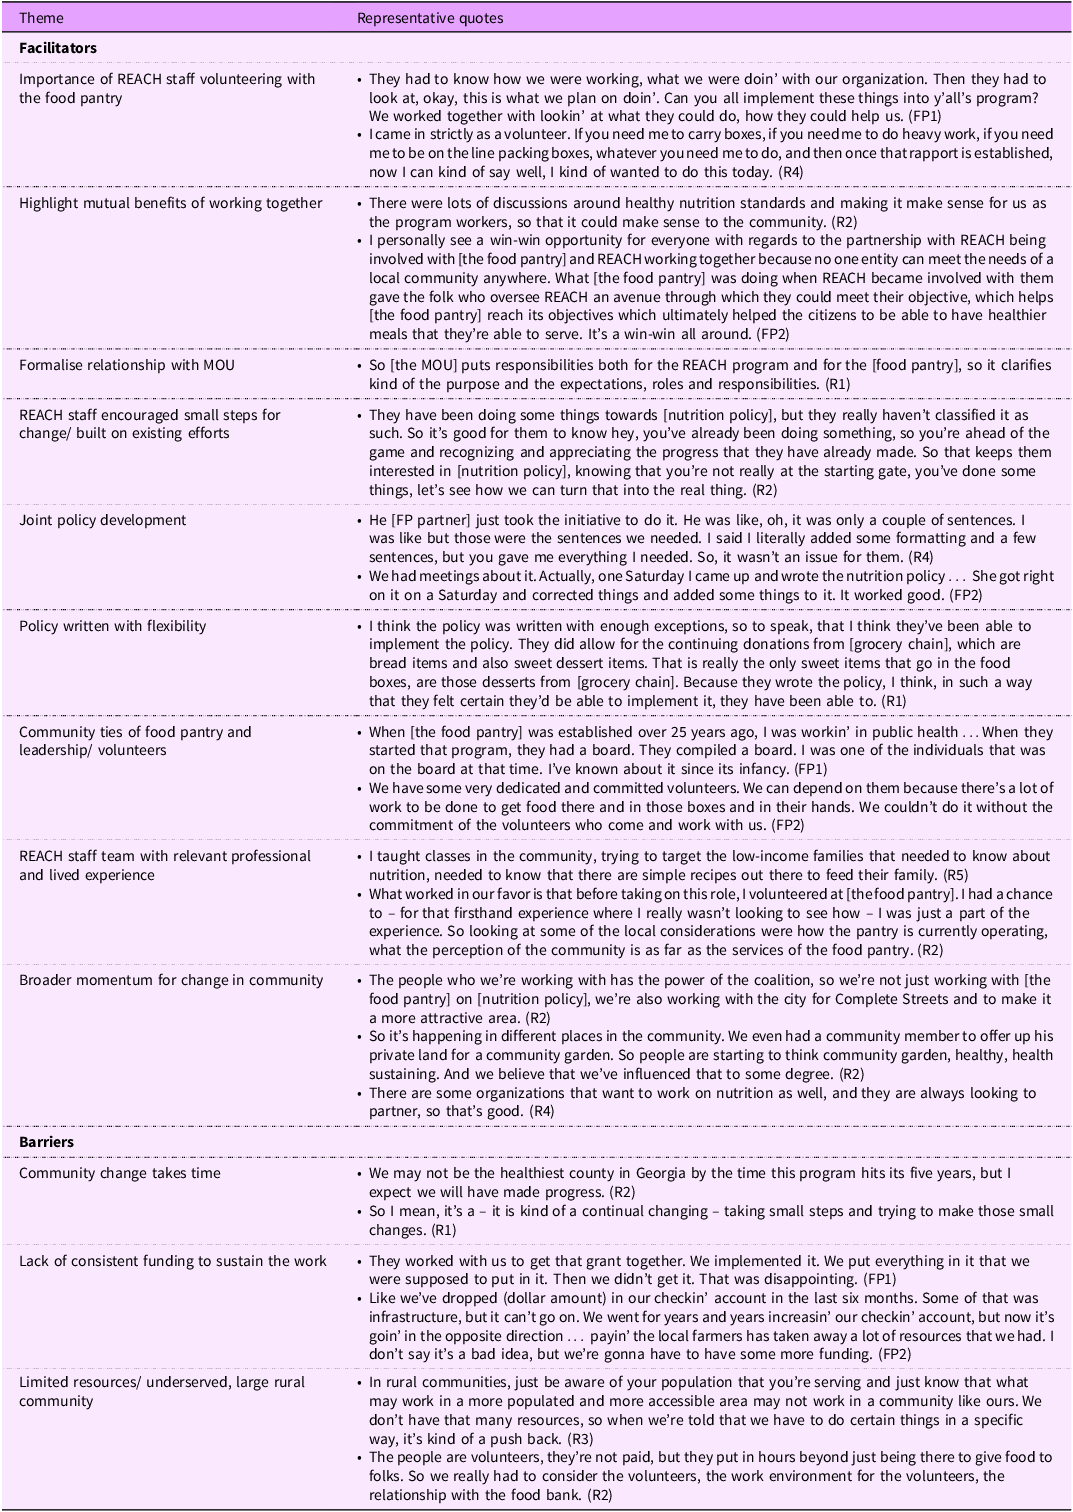
Policy implementation, a short-term outcome, began in March 2021, including order and donation guidance based on USDA’s MyPlate guidelines for dairy products, fruits, vegetables, proteins and grains (Figure 2). Interview participants named several facilitators of policy development and implementation (Table 1). Several interviewees described the importance of relationship formation, beginning with REACH staff members regularly volunteering with the food pantry, preparing and distributing food boxes, observing and asking questions of pantry volunteers and leadership. This enabled them to learn about pantry operations, clientele needs and preferences and build relationships with pantry leaders. The partners were able to build a relationship based on mutual benefits of working together, including shared objectives and responsibility. The relationship was formalised with a signed memorandum of understanding, which concretised each partner’s responsibilities. REACH staff described their implementation approach including efforts to ensure food pantry partners were comfortable with the changes they committed to implement, encouraging small steps for change and building on existing efforts to ensure the work was feasible. After reviewing a range of existing policy examples, partners agreed on a policy that codified what the pantry was already doing and expanded on those efforts. The policy was jointly written and implemented with flexibility to avoid alienating major donors and reflected charitable food system limitations (i.e., availability of healthy foods at the food bank). Finally, strong partnerships facilitated the work. The food pantry, its leadership and volunteers had deep ties to the community they served. REACH staff had relevant professional and lived experiences that supported them in their roles. Finally, the partnerships formed an ever-increasing network of entities throughout the community creating broader momentum for change.

Figure 2. Food pantry nutrition policy.
Table 1. Policy facilitators and barriers

Interview participants shared barriers to policy scope and pace of development (Table 1). They considered the acceptability and appropriateness of the policy for their community, noting that change takes time, particularly to build trust and ensure that the larger community understood the vision. As a food pantry in a rural community, they faced a double barrier of limited resources in terms of funding and human capital/capacity. COVID-19 impacted the pace of policy development as REACH staff members were reassigned during the first year of the pandemic to address emergent public health needs, thus slowing progress.
System changes to support nutrition policy implementation
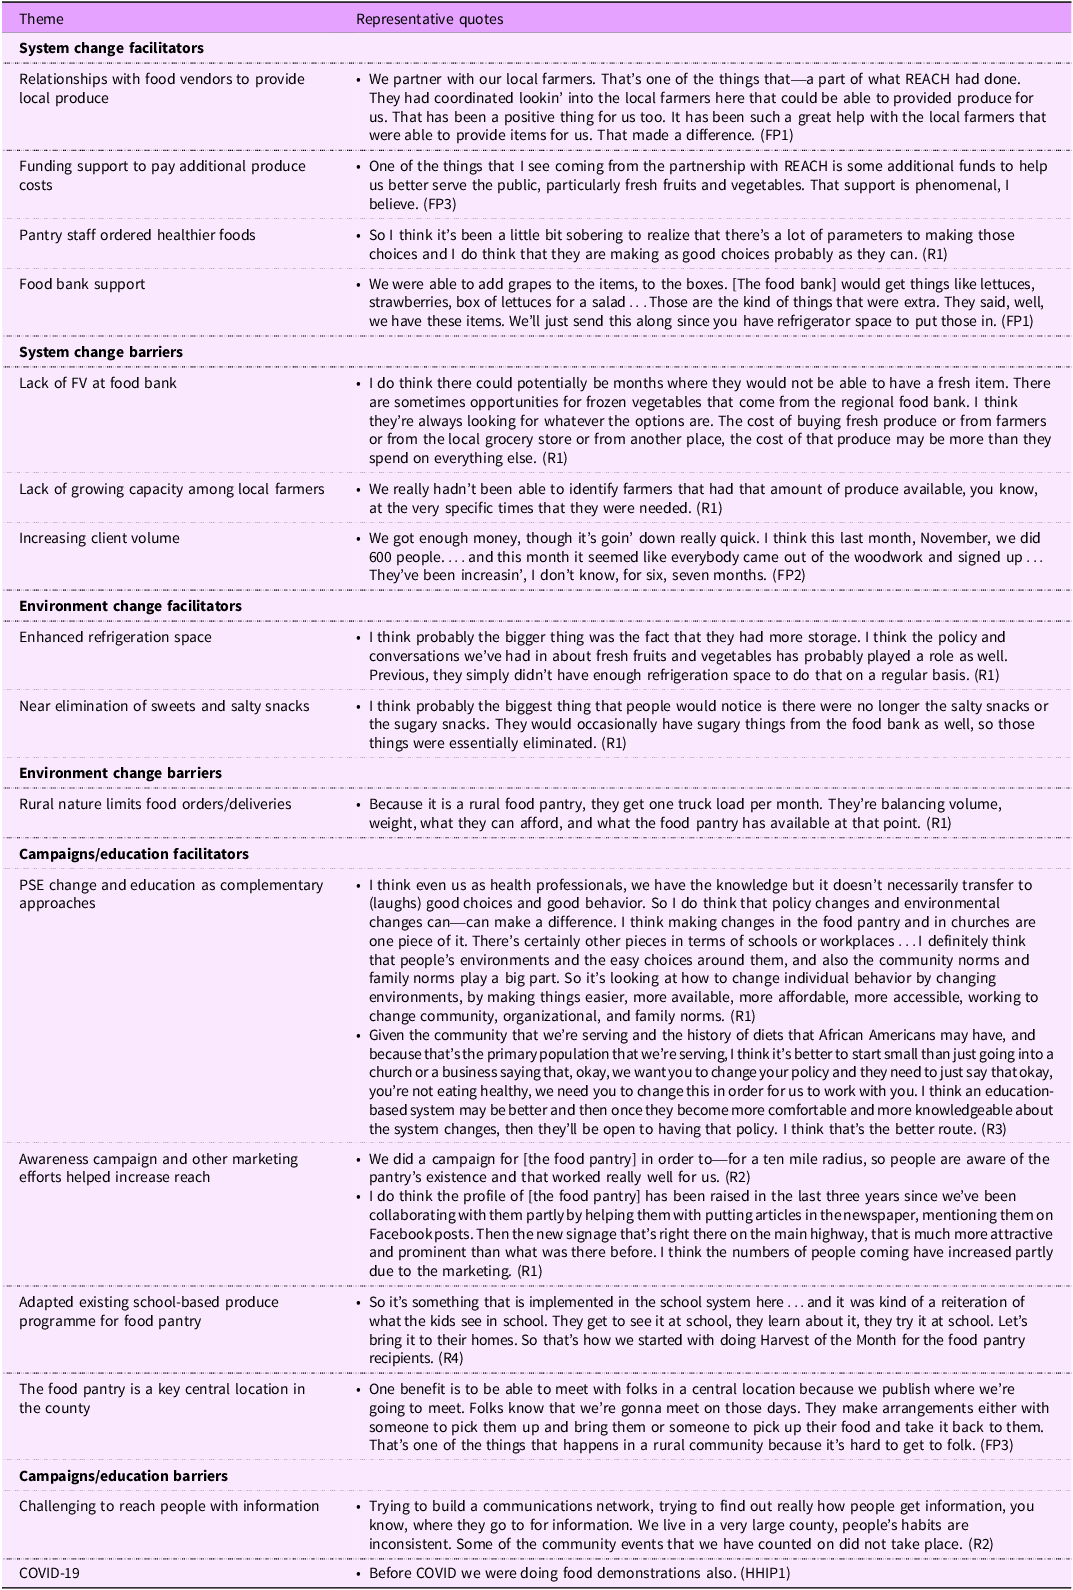
System changes implemented at the food pantry (Table 2) focused on enhancing available produce options. The REACH team monitored nutrition policy implementation by reviewing monthly orders, tracking the nutritional content of regularly ordered items and making suggestions to improve availability of healthy food. The REACH team established relationships (n 4) with a local independent grocer, a regional produce wholesaler and two local farms to donate or sell healthy food options and locally grown produce to the food pantry. The REACH team provided funding support by covering costs of added produce in the food boxes. In the grant’s final year, the REACH team provided grant writing and fundraising support to the food pantry to help sustain the policy and related costs beyond the grant period. To be able to implement the policy, pantry leaders ordered healthier foods from the food bank when available. The partners communicated regularly with the regional food bank to understand food sources and existing nutrition standards. Finally, the food bank that supplied the food pantry with most of its food supported health promotion efforts, enabling the pantry to develop and implement a nutrition policy. The partners worked with the food bank to ensure implementation feasibility. Additionally, the food bank offered support by increasing healthy offerings and sending greater quantities of fresh produce to the pantry. Barriers to implementing these system changes included limited quantities of produce available at the food bank, especially early on, and limited capacity of small local farms to grow produce in the amounts needed to support the food pantry.
Table 2. Facilitators and barriers to system and environmental changes

Environmental changes to support nutrition policy implementation
A few key environmental changes were implemented in the food pantry, supporting policy implementation and system changes (Table 2). A major environmental change was the installation of two industrial-size refrigerators, donated by the food bank. This enhanced storage increased the food pantry’s capacity to store perishables, including fresh produce and dairy. Beyond increasing healthier foods, another environmental change was the near elimination of sweets and salty snacks distributed, further supporting the policy. Interviewees described clients’ appreciation for the increase in fresh produce and other healthy foods, and clients promoted the changes to others through word of mouth. Interviewees hoped the changes would lead to improved client diets. The rural nature of the community presented major limitations for food orders and deliveries. In this case, the food pantry could place one order per month from the regional food bank located 65 miles away, balancing food cost, volume, weight and perishability.
Awareness campaign and produce education
Interviewees discussed the importance of communicating about changes at the food pantry as a form of education. Multiple REACH staff described education as a complement to the structural changes and vice versa. One interviewee believed that structural changes without education is insufficient to obtain community buy-in or change client behaviour, and another espoused the alternate view that education alone is insufficient to change health behaviour without structural change. The REACH team and food pantry leaders implemented individual-level programmes, including an awareness campaign, other ongoing marketing efforts and a produce education programme (Table 2). The campaign, intended to increase awareness of the food pantry among residents (and required by the food bank), entailed a one-time postcard-mailing to all households within a 10-mile radius of the food pantry (n 3277) in Year 2, just before the COVID-19 pandemic. Other marketing efforts continued throughout the grant period including newspaper articles, social media posts and improved highway signage. Interview participants suggested that these efforts were effective in increasing reach to the community and pantry use by eligible households. The produce education programme, Harvest of the Month, was a simple adaptation of an existing school-based programme. It highlighted a different fruit/vegetable each month, which was provided in the food box with healthy recipes. COVID-19 ended the nutrition programme component involving in-person recipe demonstrations and taste samples.
Lessons learned
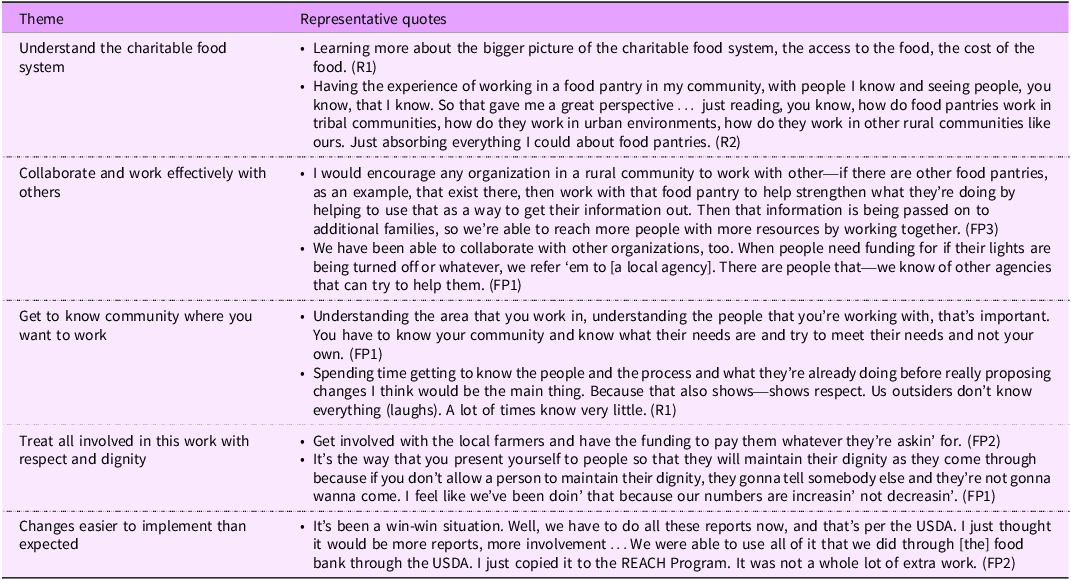
Reflecting on their experience implementing nutrition-related PSE changes, interview participants discussed lessons learned (Table 3). General observations included needing to tailor PSE changes to a setting and community, understanding the charitable food system and working effectively with others to reach shared goals. Some participants discussed the need for outsiders to learn about the prioritised community before proposing solutions. Participants discussed the importance of mindset for external partners working in the food pantry space, including a desire to serve, demonstrating a positive attitude and treating others with respect and dignity. Additionally, some described the importance of supporting local farmers as partners and paying them accordingly. Finally, REACH staff and food pantry leaders expressed that some anticipated barriers did not arise, and the work was easier to implement than expected.
Table 3. Lessons learned

Perceived access to healthier foods
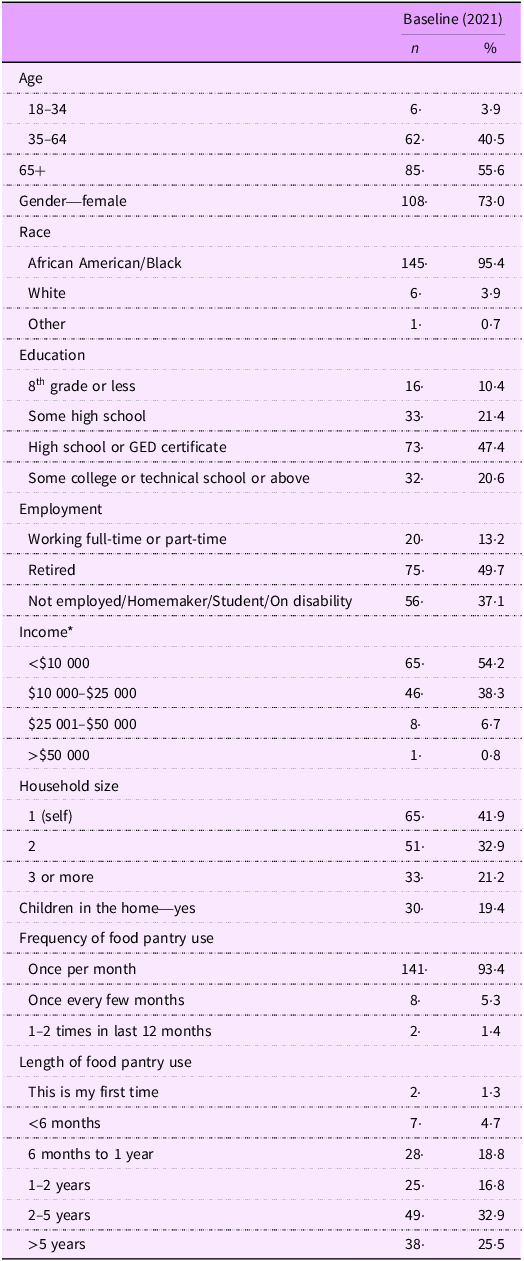
The key intermediate outcome was increasing the number of persons with access to healthier foods. In 2021, most survey respondents were ≥65 years (55·6 %) and nearly three-quarters were female (73·0 %; Table 4). Nearly all respondents identified as African American/Black (95·4 %) with 3·9 % identifying as White. Nearly half of respondents received a high school diploma or equivalent, and while 14·2 % reported some college or technical school, only 6·4 % reported completing college or receiving a post-graduate/professional degree. Most respondents were either retired (49·7 %) or not working, a homemaker, student or on disability (37·1 %). The vast majority of respondents reported incomes of ≤$25 000 (92·5 %). Households typically consisted of one (41·9 %) or two people (32·9 %), and one-fifth had children under age 18 living in the home (19·4 %). A large majority of respondents reported visiting the food pantry monthly (93·4 %) and had been using the food pantry for more than a year (75·2 %), preceding COVID-19. In the 2022 survey, we used more detailed categories for employment status, separating ‘on disability’ from ‘not employed/homemaker/student.’ This resulted in nearly one-third of respondents reporting disability status (32·9 %) and 5·2 % reporting that they were not employed, a homemaker or student. It is likely that proportions were similar in the 2021 sample.
Table 4. Client survey demographics (n 155)

* Percentages do not add to 100 % due to missing data (including responses of ‘don’t know’ and ‘prefer not to answer’).
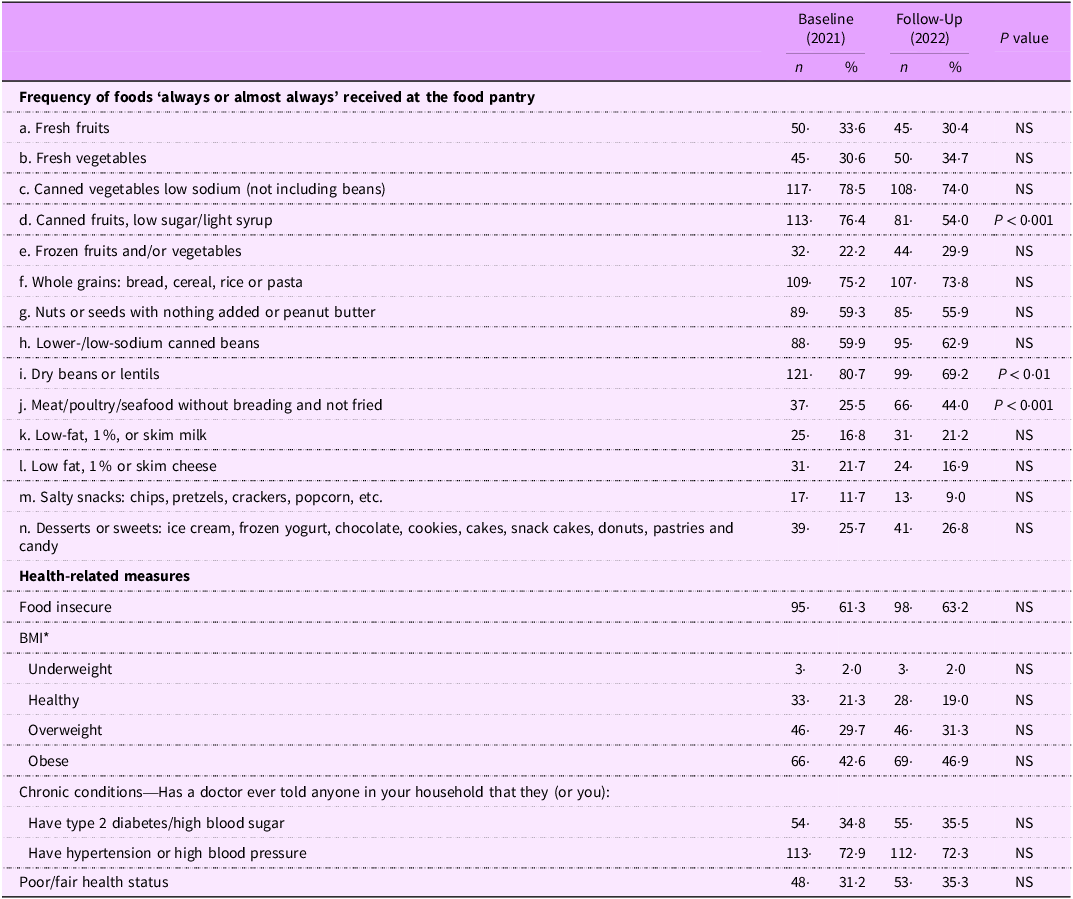
Table 5 shows the percentages of respondents reporting always/almost always receiving fourteen types of foods in their food boxes at baseline and follow-up. In 2022, there were some statistically significant differences in reported frequency of always/almost always receiving certain foods versus 2021. The frequency of always/almost always receiving canned fruits low in sugar or syrup declined from 76·4 % to 54·0 % (P < 0·001). The percentage of respondents reporting always/almost always receiving dry beans or lentils declined from 80·7 % to 69·2 % (P < 0·01). Reports of always/almost always receiving meat, seafood or poultry (without breading and not fried) increased from 25·5 % to 44·0 % (P < 0·001). At both time-points, canned/dried foods were the most frequently reported food always/almost always received.
Table 5. Pre-post policy implementation changes, key survey outcomes, 2021–2022 (n 155)

NS at P < 0·05.
* Percentages do not add to 100 % due to missing data.
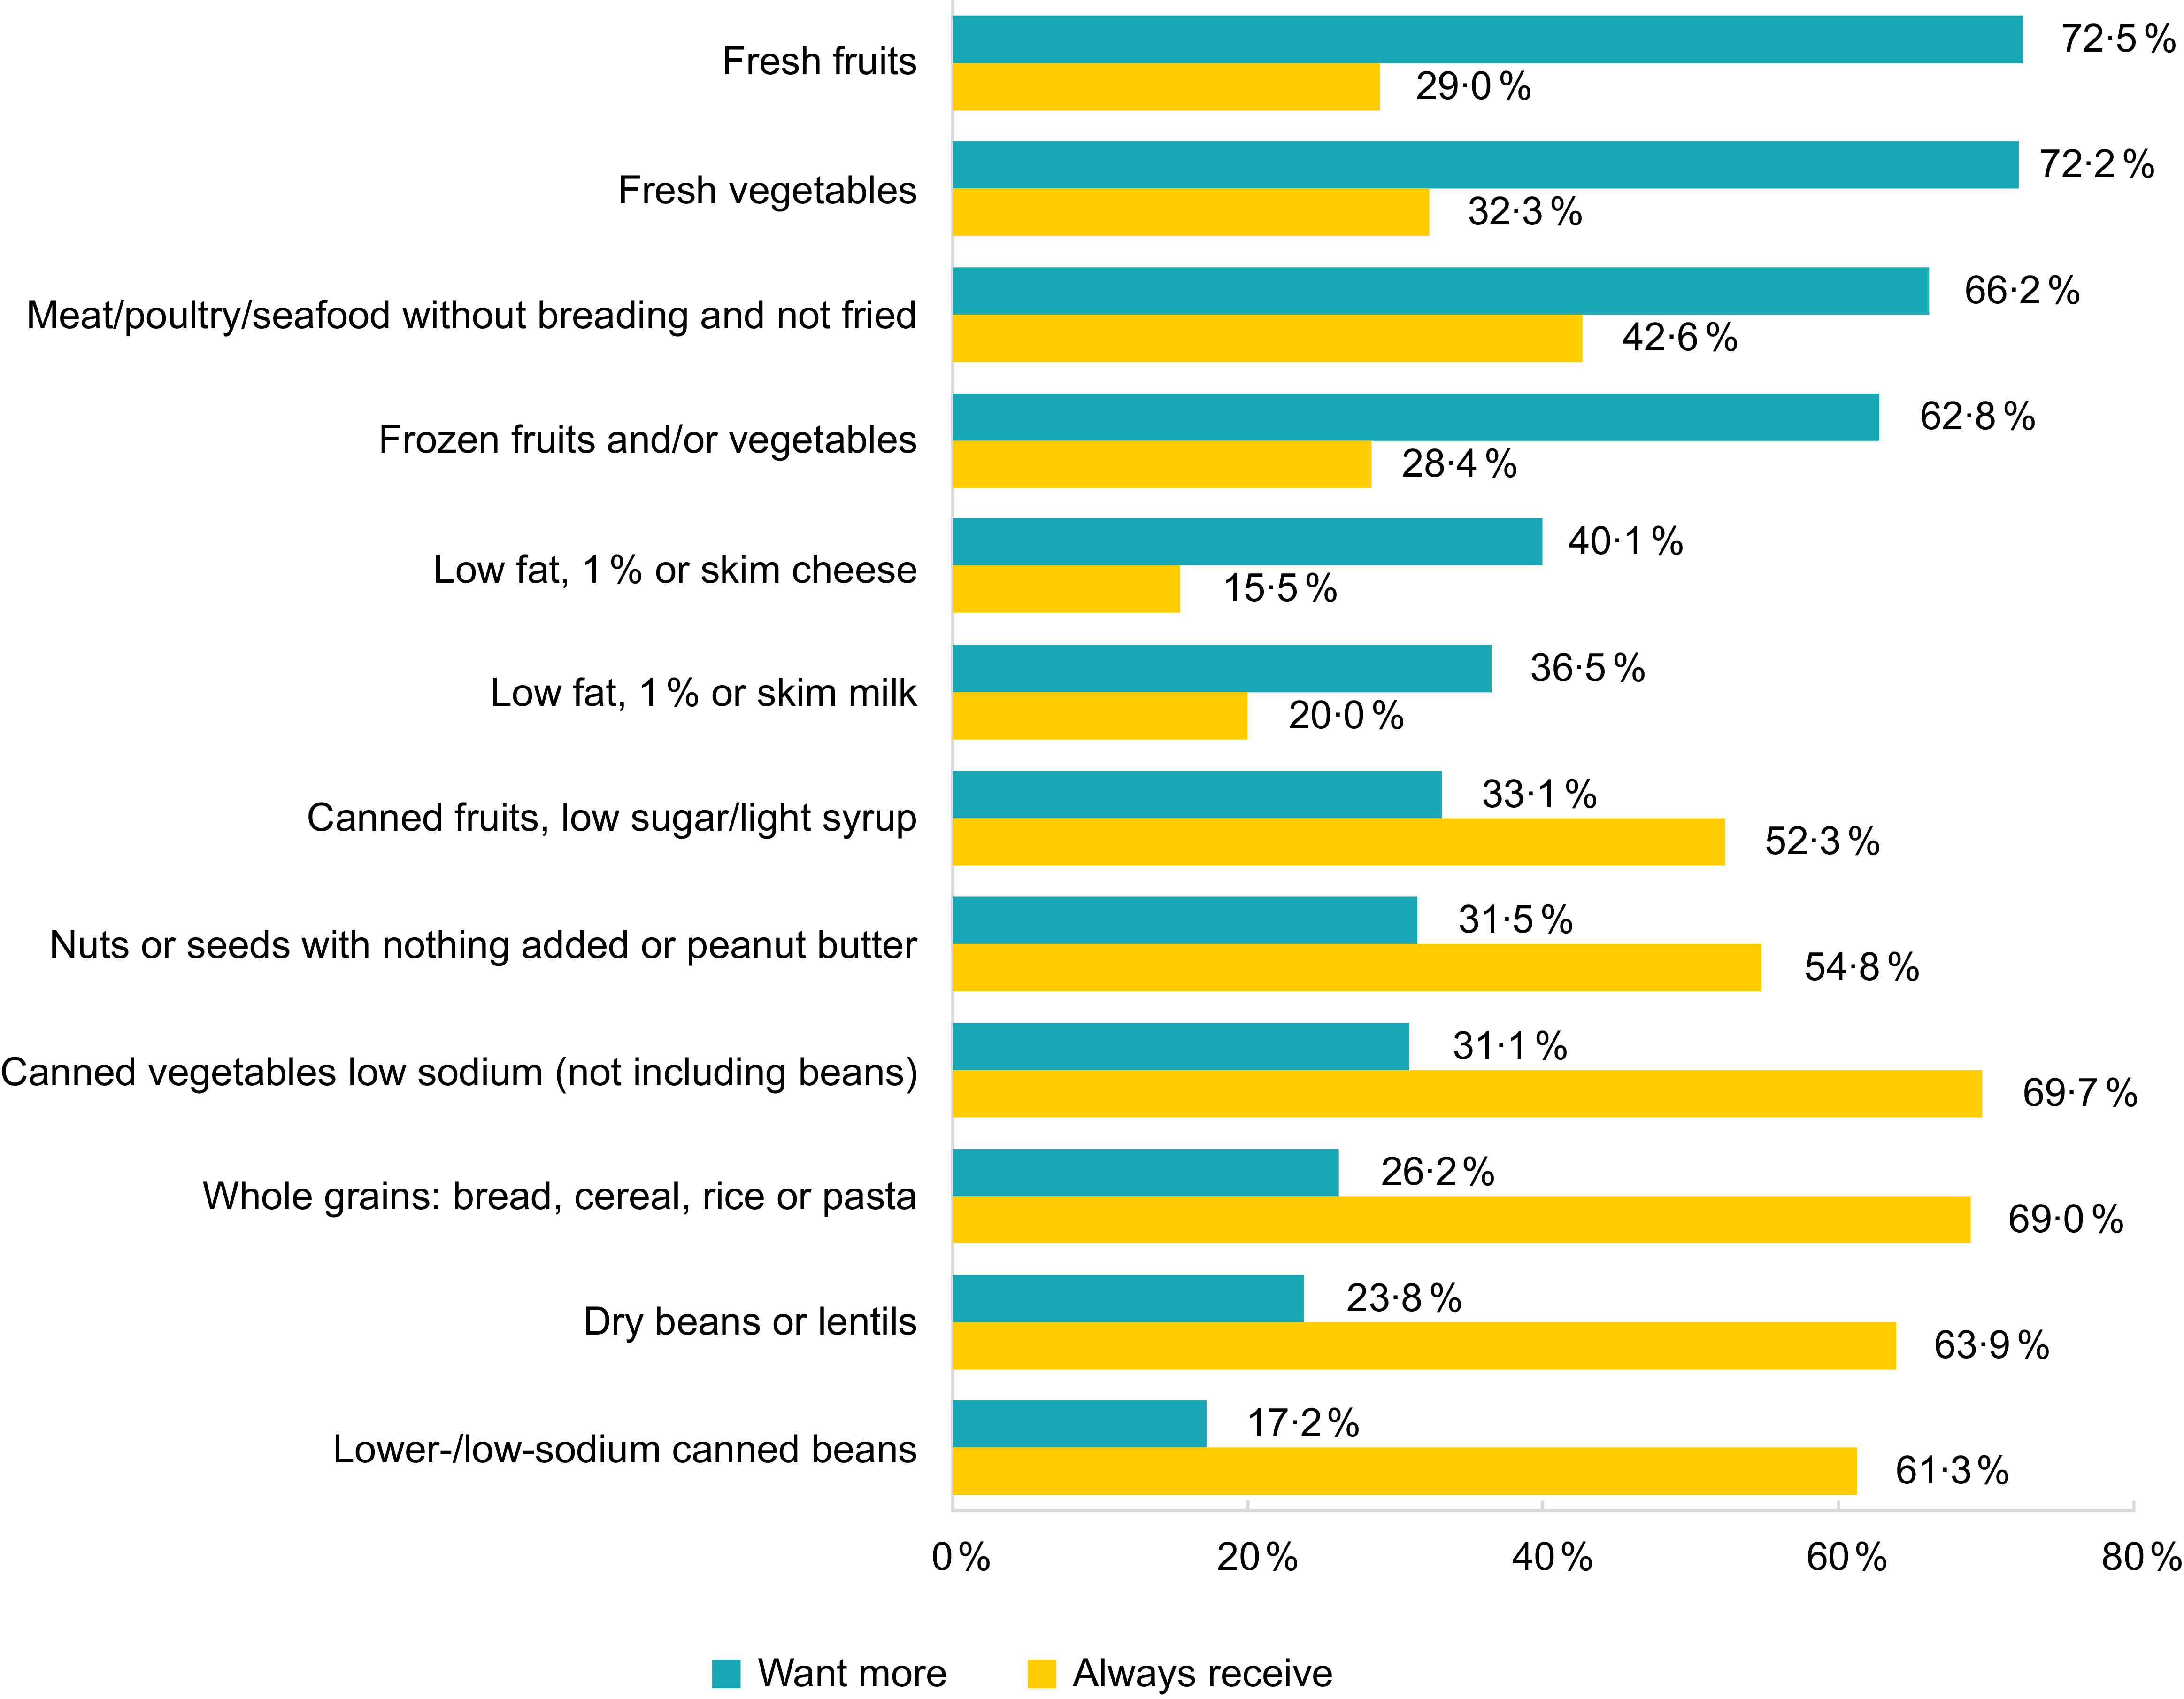
Figure 3 shows 2022 survey responses comparing clients’ food preferences and the percentage of respondents reporting that they always/almost always receive those foods from the food pantry. As depicted in the figure, an inverse pattern exists. Most clients wanted fresh fruits, fresh vegetables, frozen fruits and/or vegetables and meat/poultry/seafood without breading and not fried more often. These same foods were among the least likely to be reported by clients as always/almost always received. In contrast, four foods that most clients reported always/almost always receiving were less desired (primarily shelf-stable items including canned vegetables (low-sodium), whole grains, dry beans or lentils and lower-/low-sodium canned beans).

Figure 3. Client food preferences and reports of foods always/almost always received (%), 2022.
Table 5 shows respondents’ health-related characteristics. In 2021, food insecurity prevalence was 61·3 %. Nearly half of respondents (42·6 %) had a BMI ≥ 30, indicating obesity, and 21·3 % had a BMI the healthy range. In 2021, 34·8 % of households had at least one household member diagnosed with type 2 diabetes and 72·9 % with hypertension. About 31 % of respondents indicated their own health status was poor or fair. There were no significant changes to these data at follow-up.
Discussion
Funded by CDC’s REACH programme, a local health district and a small, rural food pantry partnered to implement PSE strategies including a nutrition policy, local partnerships for procuring fresh produce and expanded refrigeration capacity at the pantry. Additionally, the partners conducted a community awareness campaign promoting the food pantry and a monthly client nutrition education programme. In interviews, partners discussed the importance of relationship building and trust as key to working together towards mutual aims and overcoming barriers including limited resources and capacity. Consistent with evaluations of PSE change interventions in other rural communities(Reference Holston, Stroope and Cater35,Reference Randall, Sanders and Lamm36) , partners noted that change takes time in rural communities and REACH staff encouraged incremental change in working with food pantry leaders.
We found that limited organisational capacity was overcome through robust partnerships at multiple levels, consistent with literature on PSE changes in food pantries and frameworks, such as the Interactive Systems Framework, that address capacity across delivery systems(Reference Yamoah, Schulte and Osborn23,Reference Calancie, Leeman and Jilcott-Pitts24,Reference Livet, Courser and Wandersman37–Reference Wandersman, Duffy and Flaspohler40) . Thus, implementation relied on partners working together and co-determining project pace and scope. Food pantry staff had deep ties to the local community and relevant personal experiences that facilitated their work. Finally, REACH staff volunteering in the pantry built relationships and trust among pantry volunteers and leadership, allowing them to address mutual aims and formalise the relationship with a memorandum of understanding solidifying their commitments.
This evaluation’s logic model was designed to produce the short-term outcome of adoption of a nutrition policy. REACH partners articulated how simultaneously implementing system and environmental change strategies increased organisational capacity to implement the policy, consistent with previous work(Reference Wallace, Franck and Sweet41). For example, Hancock County is relatively remote, far from a major highway; this geographic isolation presents challenges for food delivery systems, thus making procurement of local produce critical. REACH staff partnered with local farmers and provided funding to ensure that fresh, local produce was provided in the monthly food boxes. During the grant period, the regional food bank began sending more produce as well. The food pantry initially had limited cold storage capacity and would have been unable to properly store increased amounts of produce and other perishables without the food bank’s donation of two large refrigerators. Despite resources provided by REACH, the added expense of purchasing additional produce, including paying local farmers a fair price and sometimes paying retail price in stores, constrained project budgets, at the same time client volume was increasing. This may be a limiting factor for small, volunteer-run food pantries in their ability to provide large amounts of fresh produce to clients.
Another key system-level partner, the food bank could be a key factor in the success of food pantry nutrition initiatives. In late 2023, after the REACH grant ended but perhaps a downstream effect of their work, the regional food bank began implementing the Healthy Eating Research nutrition guidelines(Reference Schwartz, Levi and Lott28). These guidelines can support informed decision-making by food bank and food pantry donors, users, staff and volunteers in using common evidence-based metrics to identify nutritious foods. Ultimately, these guidelines can help increase the nutritional quality of foods distributed to clients, increasing nutrition security and reducing income-based gaps in the nutritional status of Americans(Reference Morales, Vicente and LaMonaca20,Reference Schwartz, Levi and Lott28) . Implementation of these guidelines at the food bank further supports REACH partners’ efforts to increase distribution of healthy foods at the pantry. These are just a few ways that implementing PSE change strategies can reinforce one another, enhancing overall implementation and outcomes.
Similarly, co-implementing individual-level nutrition education strategies amplifies PSE strategy effectiveness and vice versa. A review of mixed-methods nutritional intervention studies provides support for multilevel interventions in increasing access to healthy foods, in accordance with the socio-ecological model(Reference Ziso, Chun and Puglisi42). Furthermore, nutrition education can help clients make healthy choices outside of the food pantry context(Reference Byker Shanks43).
Despite persistent efforts of partners to improve the nutritional quality of foods distributed, client-reported changes in foods always/almost always distributed from 2021 to 2022 were mixed, with some significant changes in expected and client-desired directions. Surprising, though, is the lack of perceived increase in frequency of fresh produce received, given partners’ efforts to provide fresh produce every month and to promote client awareness of those changes. There are a few potential explanations for the lack of perceived changes overall. The nutrition policy largely codified existing efforts to provide healthy foods at the food pantry and included needed exceptions. The modest policy scope might have limited potential for client impacts despite partners’ described efforts. A more ambitious policy, if feasible, might have achieved measurable client-related outcomes. Related, the 1-year client survey follow-up period may have been too brief to capture changes in client perceptions or was perhaps too long for recall. Although we lacked access to objective data on food box contents, that information could increase our understanding about the true extent of change following policy implementation. However, a review of twelve food pantry interventions (not policy-specific) found that studies with modest intervention strategies, short follow-up periods and subjective assessment methods determined that interventions were effective in improving diet-related outcomes, suggesting that such interventions and evaluation methods can still demonstrate change(Reference An, Wang and Liu16). Finally, the food pantry experienced substantial growth in client volume during the study period; yet, as demand increased, budgets did not keep pace. Consequently, the food pantry served more households with the same amount of resources. While more clients may have been theoretically reached by the nutritional policy, the amount or frequency of produce and other healthy foods received might have stayed the same or decreased due to resource constraints.
At both time-points, clients reported high interest in receiving fresh, healthy foods (e.g., fresh/frozen produce and animal proteins). REACH staff and pantry partners shared anecdotal reports that clients appreciated the changes. This finding is consistent with prior research that has demonstrated client demand for healthy foods(Reference Caspi, Davey and Barsness32,Reference Schwartz and Caspi44) . Combined with high desire for healthy foods, this suggests that their efforts were welcome and should continue. Simultaneously, large majorities reported always/almost always receiving shelf-stable goods (e.g., canned vegetables and canned/dried beans), and relatively small proportions reported wanting more of those foods. Understandably, clients might not want more of the types of foods that they already receive monthly, especially those that can be stored for longer periods of time than perishable foods. REACH staff aimed to increase the acceptability of beans and lentils by providing recipes, but these foods might still have been less preferable to meat as a protein source.
This study has several limitations. Although this evaluation was intentionally designed to focus on understanding factors affecting PSE change implementation in a small rural food pantry in a racially minoritised area, these findings may have limited generalisability as a result. However, findings may be especially meaningful to practitioners working in similar communities. The passive survey recruitment methods may have introduced unknown response bias. Lack of objective food box data limits our ability to interpret change in foods clients reported always/almost always receiving. Self-report survey data are subject to several forms of bias, including social desirability bias. In addition, our brief survey limited our ability to ask more detailed questions. This evaluation was designed primarily to assess the nutrition policy. Although we learned of system and environmental changes through our evaluation work, some findings related to system and environmental changes are consequently limited compared to the nutrition policy. This survey did not find any significant changes in health outcomes resulting from changes at the food pantry during the study period. This is likely due to the relatively short study period, limited contribution of food box contents to clients’ overall diets and extent of perceived changes to food box contents during the study period. Finally, this study began in the first year of the COVID-19 pandemic. The 2021 survey in particular may have captured above normal food insecurity and need created by the pandemic. Although we were unable to collect objective food box data, the mixed-methods proved invaluable. The information obtained through implementer interviews helped contextualise the survey findings, particularly the lack of client perceived changes.
Food pantries are an important source of food for individuals and families experiencing food insecurity and should be acknowledged as a key delivery system setting for improving nutritional security among rural communities. Increasing the nutritional quality of foods provided to food pantry clients can contribute to improved health outcomes in the long-term and improved client satisfaction in the short term. As part of the charitable food system, food pantries are chronically under-resourced and have modest capacity. Despite these challenges, partners were able to work together and make changes that if expanded and sustained could support improved client access and diets. To achieve such changes, considerable dedication of resources to strengthen and sustain this important work will be needed.
Acknowledgements
The authors would like to thank Cerra Antonacci, Elizabeth Eidson, Ashley Woods and Emily Leung for their assistance with this project. In addition, we thank the food pantry clients who completed the survey and the REACH staff and food pantry leaders who participated in key informant interviews.
Author contributions
K.E.T. and G.S. led programme implementation. A.H. and M.C.K. led the evaluation and study design. A.H. collected data. A.H. and L.B. analysed data. A.H., L.B., K.E.T. and M.C.K. interpreted results. A.H. and L.B. led the writing and editing process. K.E.T., G.S. and M.C.K. contributed to the writing and editing of the manuscript.
Financial support
This work was supported by a grant from the Centers for Disease Control and Prevention (CDC) (NU58DP006580). The CDC had no role in the design, analysis or writing of this article.
Competing interests
None.
Ethical standards
This study was conducted according to the guidelines laid down in the Declaration of Helsinki. Emory University’s Institutional Review Board determined that this study was a non-research programme evaluation that did not require institutional review board approval. Survey participants indicated consent by returning completed questionnaires. Verbal informed consent was obtained from all interview participants.

 Open access