


Introduction
The alteration of volcanics is a complex geological process influenced by interactions with hydrothermal fluids, meteoric waters, mineral assemblages, and diagenetic conditions. These interactions can transform primary minerals into secondary phases. As such, secondary mineral associations can provide valuable information about the physicochemical conditions governing the genesis of economically significant mineral deposits (Boles and Coombs, Reference Boles and Coombs1975; Christidis, Reference Christidis1998; Stamatakis et al., Reference Stamatakis, Hall, Lutat and Walsh1998; Hay and Sheppard, Reference Hay and Sheppard2001; Marantos et al., Reference Marantos, Markopoulos, Christidis and Perdikatsis2008; Marantos et al., Reference Marantos, Christidis and Ulmanu2012). One geochemical pathway that is used as an indicator for locating enconomically viable mineralization zone is smectite formation in bentonitic deposits, which is in part determined by the composition of the parent rocks and the nature of the altering fluids (Christidis et al., Reference Christidis, Scott and Marcopoulos1995; Christidis, Reference Christidis2001). Similarly, zeolites formed under alkaline conditions in altered volcanic and volcaniclastic rocks may also serve as indicators. Evidence of this has been found in geological settings around the world, with examples in Greece, Italy, and Argentina (Pe-Piper and Tsolis-Katagas, Reference Pe-Piper and Tsolis-Katagas1991; Christidis, Reference Christidis1998; Ghiara et al., Reference Ghiara, Petti, Franco, Lonis, Luxoro and Gnazzo1999; Locati et al., Reference Locati, Cravero, Marfil, Lescano, Madsen and Maiza2020; among others). In many volcanic environments, hydrothermal alteration is characterized by the presence of alkali chloride fluids with a neutral to alkaline pH, leading to the precipitation of silica phases such as opal-A and other silica polymorphs (Kyle et al., Reference Kyle, Schroeder and Wiegel2007; Kyle and Schroeder, 2007). Additionally, at low temperatures (≤100°C), this process favors the formation of smectite minerals (e.g. montmorillonite) and zeolite-group minerals (e.g. clinoptilolite, heulandite) (White et al., Reference White, Hem and Waring1963; White, Reference White1974). Conversely, at temperatures above 200°C, quartz crystallization becomes predominant, while zeolite formation is observed to decrease (Browne, Reference Browne1978; Henneberger and Browne, Reference Henneberger and Browne1988; Reyes, Reference Reyes1990). The alteration sequence of fresh volcanic glass to poorly crystalline precursors and ultimately to well-crystallized smectite, often accompanied by zeolites such as mordenite and clinoptilolite, is well documented (Christidis et al., Reference Christidis, Scott and Marcopoulos1995; Christidis, Reference Christidis2001; Çiflikli et al., Reference Çiflikli, Çiftçi and Bayhan2013).
The rocks in the Ankara region, which are predominantly Paleocene to Early Miocene volcanic rocks, have attracted attention due to their active magmatic history and associated alteration processes (Tankut et al., Reference Tankut, Dilek and Önen1998a, Reference Tankut, Güleç, Wılson, Toprak, Savaşçın and Akıman1998b; Rojay, Reference Rojay2013; Dönmez and Akçay, Reference Dönmez and Akçay2010). The Çubuk district is distinguished by its abundance of Ankara agate, a variety of chalcedony or microcrystalline quartz, which is a secondary mineral resulting from hydrothermal alteration (Hatipoğlu et al., Reference Hatipoğlu, Babalik and Chamberlain2010; Hatipoğlu et al., Reference Hatipoğlu, Ajo and Kırıkoğlu2011). However, research on alkaline chlorite hydrothermal alteration and zeolite formation in this region remains limited. Hatipoğlu (Reference Hatipoğlu2016) made a brief mention of silicified zeolites, while a detailed study on the geology and formation conditions of zeolite-bearing deposits in the southeast of Ankara was conducted by Karakaya et al. (Reference Karakaya, Karakaya and Yavuz2015). Their work highlighted the occurrence of clinoptilolite and other zeolites in volcanic deposits, thereby contributing to the understanding of zeolitic mineralization in the region. Furthermore, Esenli and Şans (Reference Esenli and Sans2013) conducted a detailed study on the structural properties of opal in Turkish bentonites. Utilizing X-ray diffraction (XRD) data from Çubuk agate samples, those authors demonstrated a correlation between opal crystal structure and the presence of bentonites, with smaller d-spacing reflections being associated with bentonitic terrains compared with larger ones in non-bentonitic areas.
Despite these contributions, studies characterizing hydrothermal alteration linked to regional magmatism in areas around Çubuk remain scarce (Temel and Gündoğdu, Reference Temel and Gündoğdu1996; Dogan, Reference Dogan2003; Çiflikli et al., Reference Çiflikli, Çiftçi and Bayhan2013; Akın and Çubukçu, Reference Akın and Çubukçu2023). Research from western Anatolia has shed light on alteration-related mineralization, documenting the transformation of volcanic glass into Na- and Ca-smectites, the occurrence of zeolites in Miocene tuffs (Alaçatı region), and bentonite deposits in the Balıkesir and Ankara-Çankırı basins (Çiflikli et al., Reference Çiflikli, Çiftçi and Bayhan2013; Kaçmaz and Köktürk, Reference Kaçmaz and Köktürk2006; Kadir et al., Reference Kadir, Külah, Önalgil, Erkoyun and Elliott2017; Kadir et al., Reference Kadir, Külah, Erkoyun, Christidis and Arslanyan2019). Additionally, zeolitization processes in Miocene pyroclastic rocks from the Gördes, Demirci, and Şaphane regions have been investigated in detail, highlighting the widespread development of clinoptilolite and heulandite due to alkaline alteration (Esenli et al., Reference Esenli, Kadir and Şans2019). These findings underscore the role of regional volcanism and water–rock interaction in shaping zeolite mineral assemblages across western Anatolia.
The mineralogical and geochemical characteristics of alteration products can provide essential insights into paleoenvironmental conditions and the physicochemical factors controlling their formation. This study aimed to enhance understanding of hydrothermal alteration, focusing on the geochemistry and mineralogy of smectite- and zeolite-bearing altered volcanic rocks, which are relatively rare in Türkiye. Improved knowledge of volcanic alteration in Çubuk is vital for reconstructing past geological environments and assessing the economic potential of mineral deposits. A further objective of this research was to provide a framework for comparison with hydrothermal systems worldwide, contributing to global studies in alteration mineralogy and geochemistry.
To achieve these objectives, the lithology of the region was examined through mineralogical and petrographic studies, complemented by chemical and isotopic analyses. These findings allowed for the interpretation of regional mineral evolution and the development of models related to alkaline chlorite alteration.
Geologic background
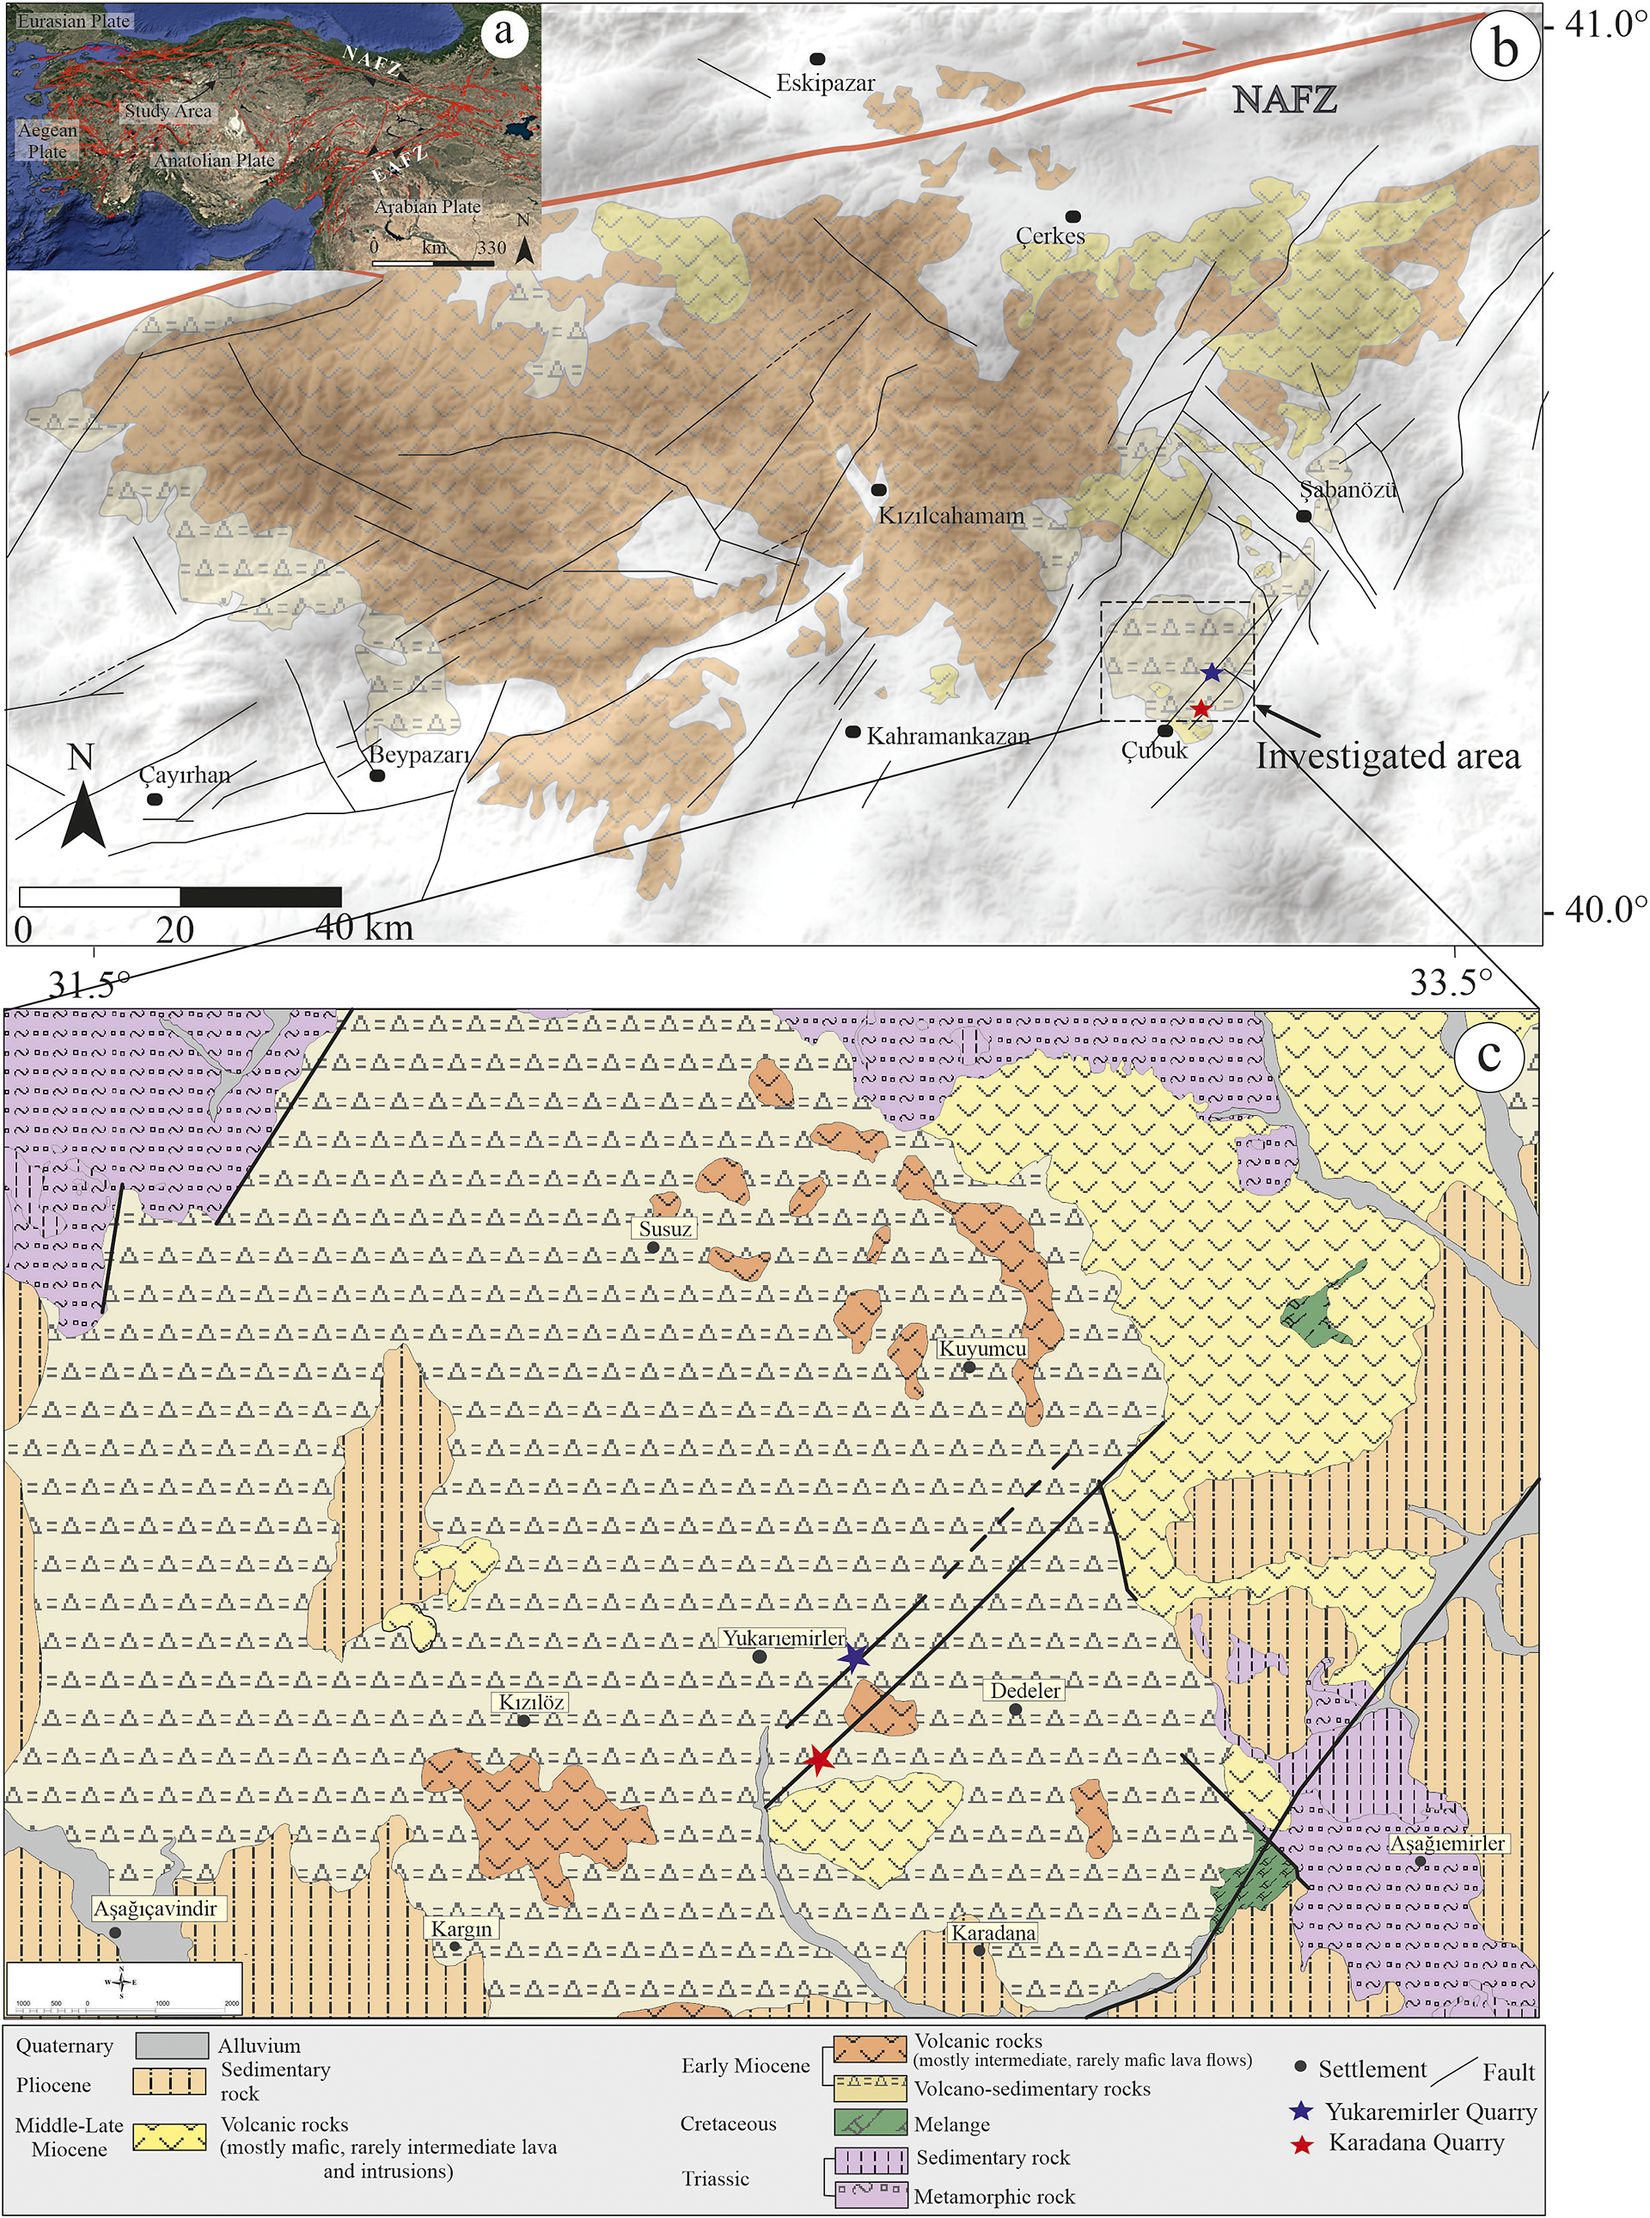
The Neogene–Quaternary volcanism in Türkiye is tied closely to the neotectonic evolution of the Alpine–Mediterranean belt (Şengör et al., 1979). The complex interplay between the Afro-Arabian and Eurasian plates is reflected in the petrogenetic and spatial-temporal characteristics of the region’s volcanic products. One of Anatolia’s largest volcanic provinces, the Miocene Galatean Volcanic Province (GVP), is in northwest-central Anatolia, spanning approximately 8900 km2 and bordered to the north by the North Anatolian Fault Zone (NAFZ) (Fig. 1a) (Karaoğlu et al., Reference Karaoğlu, Varol, Lustrino, Chiaradia, Toygar Sağın, Hemming and Uysal2024).

Figure 1. (a) Topographic map illustrating the major tectonic lineaments in Türkiye (Armijo et al., Reference Armijo, Meyer, Navarro, King and Barka2002); (b) geological map of the Galatian Volcanic Province in northwestern Anatolia, superimposed on a digital elevation model (Karaoğlu et al., Reference Karaoğlu, Varol, Lustrino, Chiaradia, Toygar Sağın, Hemming and Uysal2024); (c) 1:1,250,000-scale geological map of the study area, obtained from the General Directorate of Mineral Research and Exploration of Turkey (MTA).
Volcanic activity began as early as the Late Cretaceous, producing intermediate to acidic lava flows and associated pyroclastics (Gencalioglu Kuscu and Geneli, Reference Gencalioglu Kuscu and Geneli2010). The transtensional tectonics related to the NAFZ resulted in the youngest products small-volume alkali basalts of Late Miocene age (Tankut et al., Reference Tankut, Dilek and Önen1998a, Reference Tankut, Güleç, Wılson, Toprak, Savaşçın and Akıman1998b). The GVP exhibits a compositional range from mafic to felsic, with sodic affinities, and volcanic activity occurred between 22.5 and 7.5 Ma (Di Giuseppe et al., Reference Di Giuseppe, Agostini, Manetti, Savaşçın and Conticelli2018; Agostini et al., Reference Agostini, Yilmaz Savaşçin, Di Giuseppe, Di Stefano, Karaoğlu, Lustrino and Öztufekçi Önal2019).
Since at least the Early Jurassic, the region has experienced subduction and collisional events, including the opening of a back-arc basin involving the Palaeo-Tethys and Neo-Tethys oceanic branches (Göncüoğlu et al., Reference Göncüoğlu, Sayit and Tekin2010; Robertson et al., Reference Robertson, Parlak, Ustaömer, Taslı, İnan, Dumitrica and Karaoğlan2013; Jolivet et al., Reference Jolivet, Faccenna, Huet, Labrousse, Le Pourhiet, Lacombe and Driussi2013; Şengör et al., Reference Şengör, Lom, Sunal, Zabcı and Sancar2019; van Hinsbergen et al., Reference van Hinsbergen, Torsvik, Schmid, Maţenco, Maffione, Vissers and Spakman2020). The northward subduction of the northern branch of the Neo-Tethys is believed to have caused mantle metasomatism, leading to GVP magmatism. Slab rollback of the Cyprus slab enabled regional extension and magma ascent, while slab break-off following the Arabia–Eurasia collision triggered widespread alkaline magmatism in the eastern GVP around 15–16 Ma (Karaoğlu et al., Reference Karaoğlu, Varol, Lustrino, Chiaradia, Toygar Sağın, Hemming and Uysal2024) (Fig. 1b).
The study area is located in the southeastern part of the GVP, within the Çubuk district of Ankara Province, Türkiye (Fig. 1). The basement lithology consists of structurally complex tectonic assemblages from the Triassic–Paleocene evolution of the Sakarya Zone, collectively called the Ankara Accretionary Complex. These units are unconformably overlain by lava flows, pyroclastic deposits, and volcano-sedimentary units (Tankut, Reference Tankut1990; Tankut et al., Reference Tankut, Dilek and Önen1998a, Reference Tankut, Güleç, Wılson, Toprak, Savaşçın and Akıman1998b; Rojay, Reference Rojay2013; Gülmez et al., Reference Gülmez, Genç, Prelević, Tüysüz, Karacik, Roden and Billor2016).
The volcanic succession progresses stratigraphically from the Paleocene-aged Sarıkoz Volcanics to the Middle Eocene Kurtsivri, Sele, Ömercik, Susuz, and Yukarıemirler Volcanics, culminating in the Lower–Middle Miocene Aydos Basalt. The Sarıkoz Volcanics consist of altered dacitic and granitic porphyritic lavas (Dönmez et al., Reference Dönmez, Akçay, Türkecan, Evcimen, Atakay and Görmüş2009). Middle Eocene volcanic rocks (~44.5±1.7 Ma) include highly altered andesites, trachyandesites, dacites, and pyroclastics that unconformably overlie the Paleocene unit (~56.4±2.4 Ma) (Akyürek et al., Reference Akyürek, Bilginer, Çatal, Dağer, Soysal and Sunu1980; Dönmez and Akçay, Reference Dönmez and Akçay2010).
The Sele Volcanics (~44.3–44.8 Ma) overlie the Kurtsivri Volcanics and are composed of andesitic lavas and abundant pyroclastics (Akyürek et al., Reference Akyürek, Bilginer, Çatal, Dağer, Soysal and Sunu1980; Dönmez and Akçay, Reference Dönmez and Akçay2010). The Ömercik Volcanics, consisting of basaltic lava flows and scoria, unconformably overlie the Sele Volcanics and are intruded by the Susuz Volcanics (~43.1±1.7 Ma). The Susuz Volcanics are widespread and consist of rhyolite, dacite, tuff, ignimbrite, and perlite (Fig. 1c). Vesicles and fractures in these rocks are filled with secondary silica known as Çubuk agates, which have gemological significance and economic value.
The Yukarıemirler Volcanics (~43.1±1.7 Ma), composed of pyroclastics and basaltic lava flows, unconformably overlie and locally intrude the Susuz Volcanics. The youngest unit, the Early Miocene Aydos Basalt (~18.4±0.7 Ma), overlies the older sequences. All these volcanic formations are unconformably overlain by Pliocene and Quaternary sedimentary units (Akyürek et al., Reference Akyürek, Bilginer, Çatal, Dağer, Soysal and Sunu1980; Dönmez and Akçay, Reference Dönmez and Akçay2010).
Materials and methods
In the present study, previously unexamined altered zones in the Çubuk district of Ankara Province were identified, geological maps were produced, and samples were collected from these zones. To interpret the development of the alteration processes and classify the mineral assemblages, five representative thin sections were prepared from altered and slightly altered samples collected from the study area. These sections were examined using a Nikon LV100 Pol microscope at the Department of Geological Engineering, Faculty of Mining, Istanbul Technical University, Türkiye.
X-ray powder diffraction (XRPD) analyses were performed using a Europe GNR model diffractometer at the Central Laboratory Application and Research Center (MERLAB), Konya Technical University, Türkiye, to determine the mineralogical paragenesis of the samples and characterize the clay minerals. The XRPD analyses were conducted with CuKα radiation at 40 mA and 40 kV, using a step size of 0.005°2θ, with a divergence slit width of 0.250 mm. Whole-rock analyses were performed over the range of 2–72°2θ, while detailed clay mineral analyses were conducted in the range of 2–45°2θ. To characterize the clay minerals, bulk rock samples were first crushed gently and dispersed in distilled water. The <2 μm clay fraction was separated by sedimentation using Stokes’ law. The separated clay fraction was then mounted on glass slides as oriented aggregates. These mounts were subjected to XRPD analysis after air-drying, ethylene glycol treatment, and heating at 450–550°C to facilitate the identification of expandable and non-expandable clay phases.
Fourier-transform infrared (FT-IR) spectroscopy was conducted using a Thermo Scientific Nicolet iS20 FT-IR spectrometer equipped with a platinum-diamond sample module, within the same laboratory facility.
Microstructural features, surface morphologies, and elemental compositions of the alteration minerals were examined using field emission scanning electron microscopy (FE-SEM) combined with energy-dispersive X-ray spectroscopy (EDS). Analyses were performed at the Science and Technology Research and Application Center (BİTAM) of Necmettin Erbakan University (Konya, Türkiye) using a ZEISS GeminiSEM 500 microscope. The FE-SEM operated with an acceleration voltage of 15 kV, a current range of 5–15 mA, and a counting time of 10–20 s per element. Palladium coating was applied at 23°C using a Leica EM ACE600 coater at a deposition rate of 0.06 nm s–1, with a total coating thickness of 0.4 nm.
Microthermometric measurements were carried out at the Fluid Inclusion Laboratory of ITU/JAL using Leica DM2500 microscopes integrated with a Linkam THMG-600 heating–cooling stage. During the measurements, eutectic temperature (T e), final ice melting temperature (T m-ice), and homogenization temperature (T h) were determined.
To determine the geochemical characteristics of the altered rocks and clay minerals, major, minor, and trace element analyses were performed at the ALS Laboratory. Major oxides and base metals were analyzed using inductively coupled plasma atomic emission spectrometry (ICP-AES) after acid digestion. Trace element concentrations were measured by ICP-mass spectrometry (ICP-MS) using lithium borate fusion. Total carbon and sulfur contents were analyzed using an infrared spectrometer and a Leco analyzer via infrared absorption.
Isotopic analyses of hydrogen and oxygen were carried out on 10 altered samples to interpret their formation environments. δ18O and δD values for zeolite and clay minerals were determined using a thermal conversion/elemental analyzer (TC/EA) pyrolysis system equipped with a Costech zero-blank autosampler. These measurements were conducted at the Stable Isotope Laboratory of the University of Oregon. The analytical precision was ±0.2‰ (1σ) for δ18O relative to SMOW and ±0.3‰ (1σ) for δD relative to SMOW.
Results
Lithological properties of the quarries
Alteration zones in the region were observed predominantly within two lithological units: referred to here as the pyroclastic deposits and the perlite deposits. To provide comprehensive representation, the Karadana (KD) quarry located within the pyroclastic unit was selected, while the Yukarıemirler (YE) quarry was chosen to represent alteration development within the perlite unit. Quartz and opal samples from within and around both quarries were collected to investigate the origin of the intense silicification observed in the region.
The KD site is a north–south trending (~300 m×150 m) clay (smectite)-zeolite quarry located west of KD village. It is currently operated for the production of cat litter. A prominent N15E-oriented dip-slip fault cuts through the center of the quarry (Figs 1 and 2a). The eastern part of the quarry consists of pink and white intercalated pyroclastic material affected by alteration. Based on textural and compositional characteristics, the pyroclastic sequence was classified into: (1) pyroclastic breccia, (2) lapilli layers, and (3) volcanic ash.
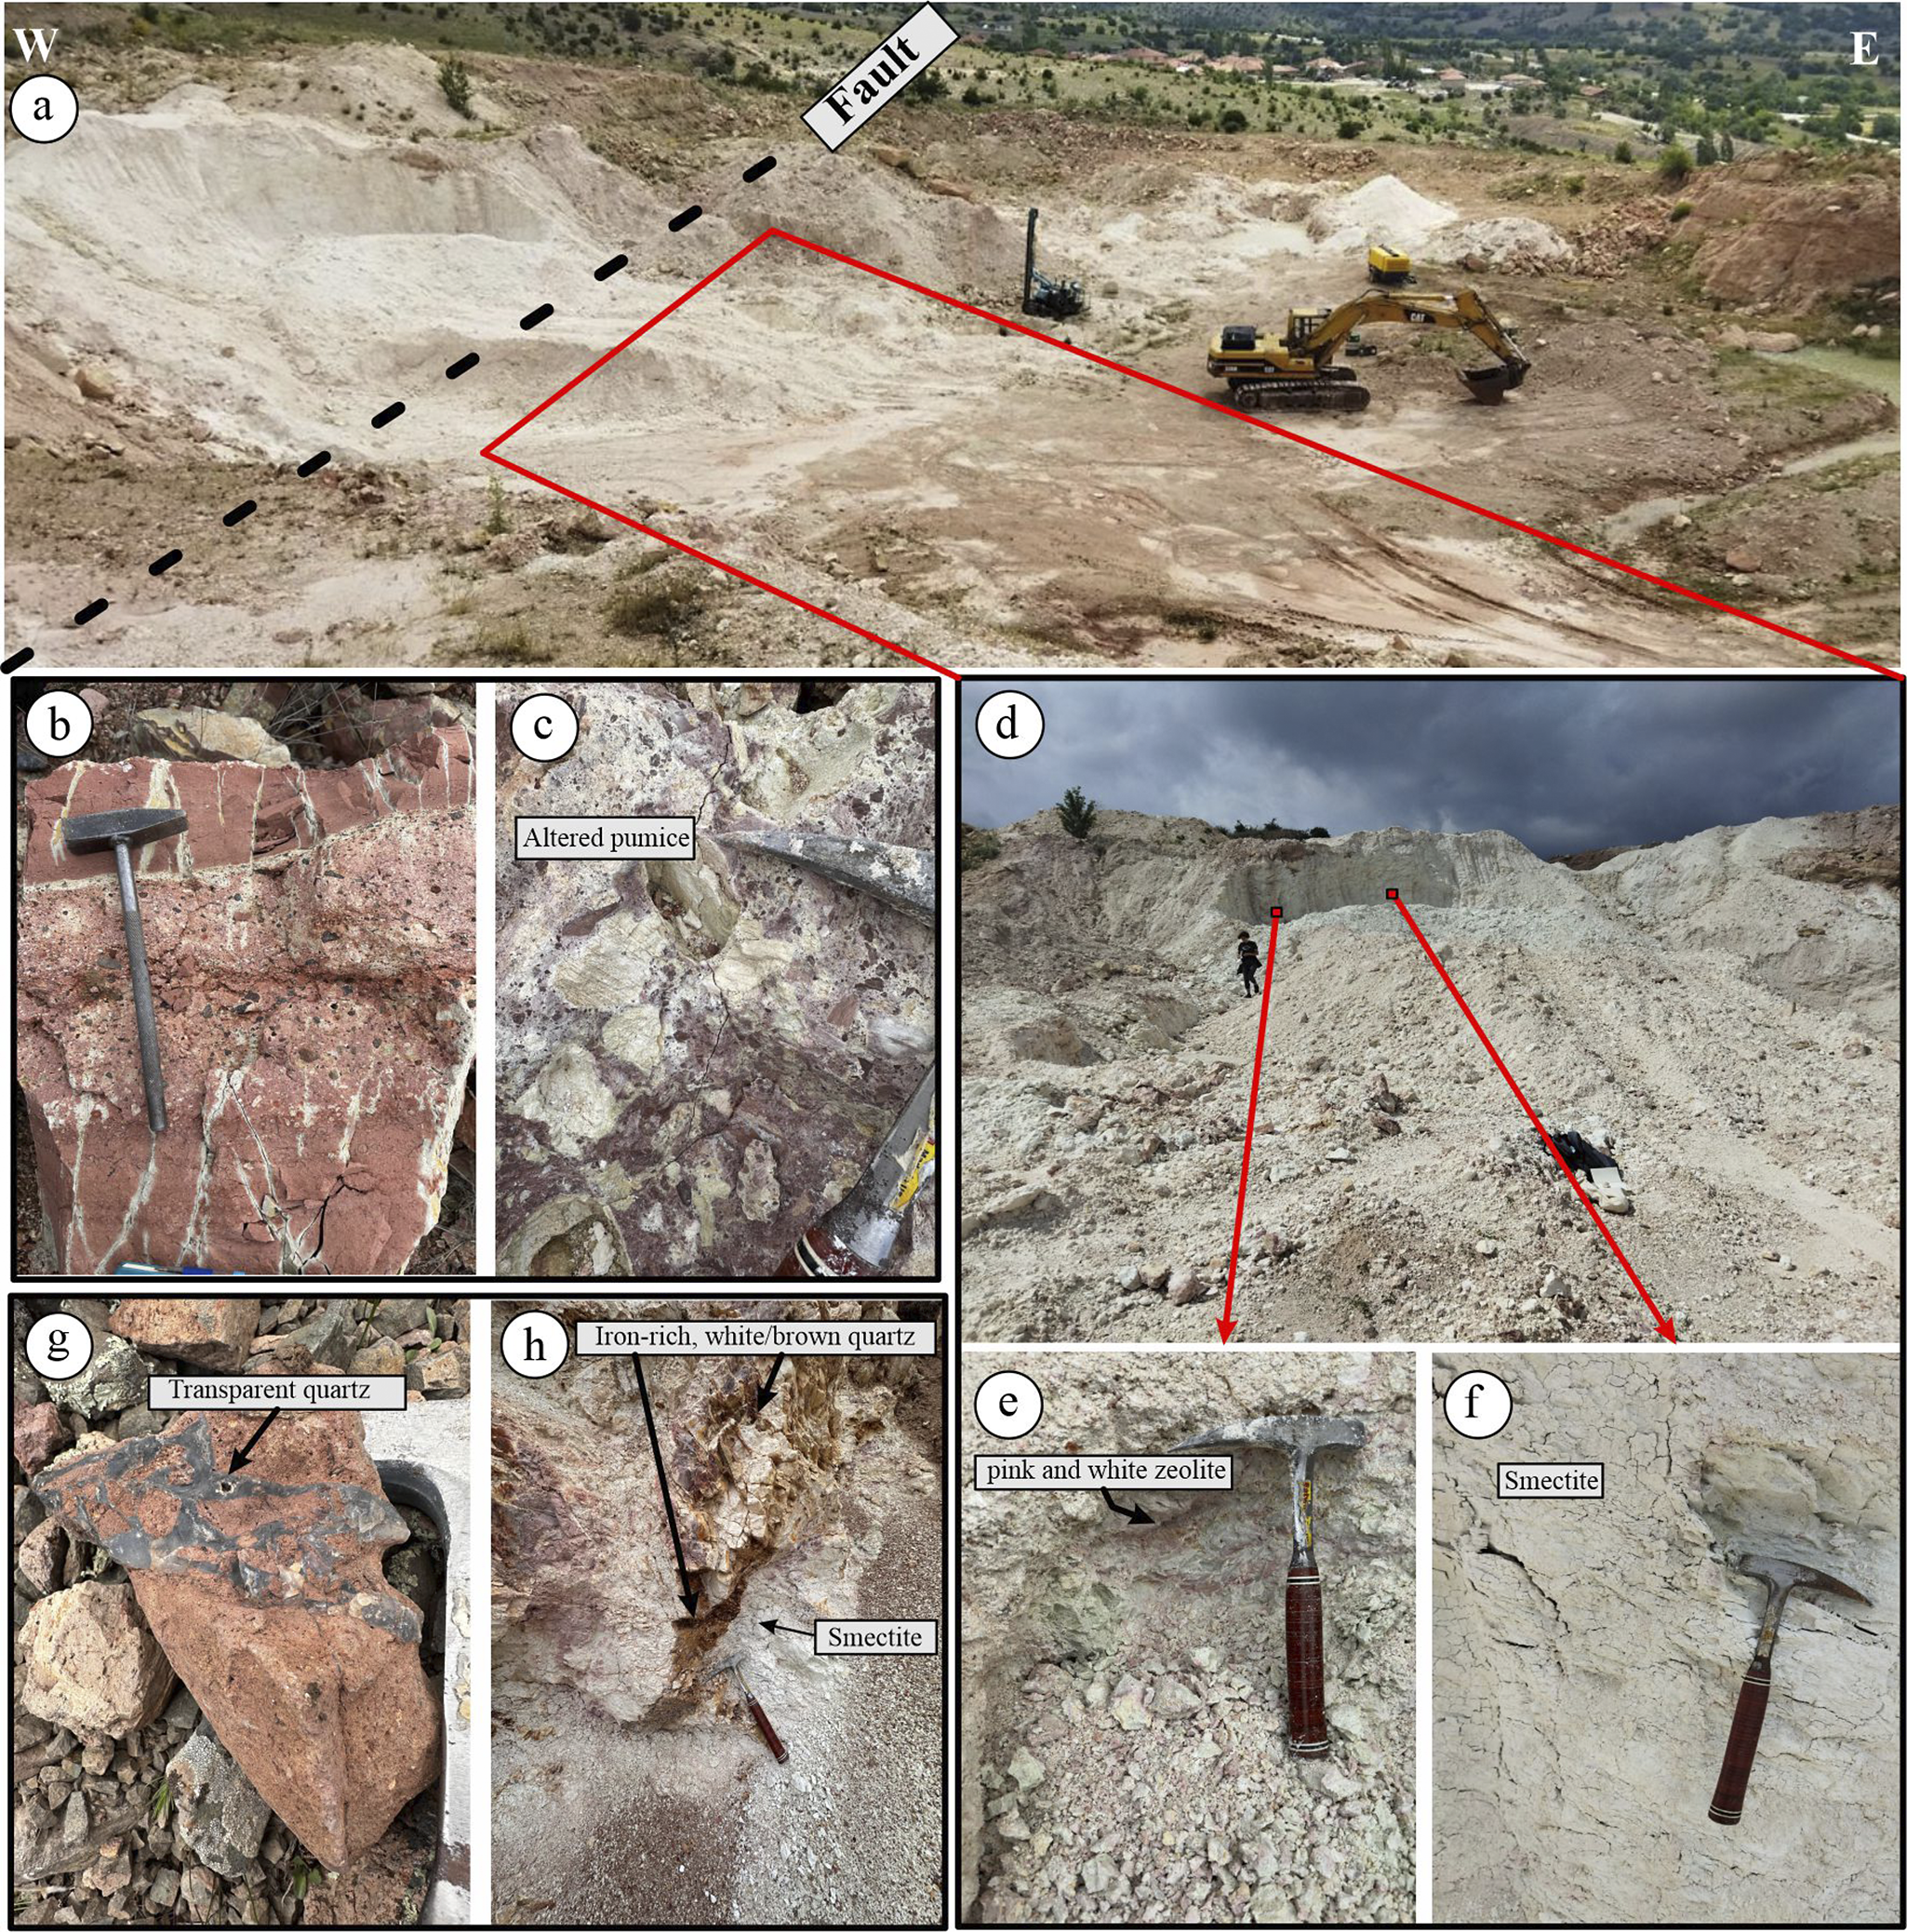
Figure 2. (a) General view of the altered zone and fault in the Karadana quarry; (b) pink-colored lapilli tuff and ash tuff layers; (c) blocky tuff, where the pumice fragments within the matrix are intensely altered; (d) view of the quarry from the opposite side; (e) zeolite with mottled pink and white colors; (f) white-colored smectite occurrences; (g) transparent quartz acting as a cementing material in brecciated tuff; and (h) brown quartz and iron oxide precipitates along a fracture zone cutting through the quarry.
Graded bedding between lapilli tuff and volcanic ash is observed at the base of the unit (Fig. 2b,c). At the top, volcanic ash is sharply overlain by pyroclastic breccia containing large volcanic rock fragments. Alteration is commonly observed in the volcanic ash and includes mineralogical components such as vitric fragments, feldspar, iron-oxidized biotite, and hornblende. In coarse-grained tuffs, fragment shape and texture vary considerably. The fragments are generally angular and composed of tuff, pumice, and rhyolitic material, many of which are altered extensively (Fig. 2c).
The western portion of the quarry is almost completely altered and appears white in color (Fig. 2d–f), with occasional light pink and green patches (Fig. 2e). Quartz-rich zones, often transparent, brown, or white, are commonly observed filling fractures and cavities within the altered zone (Fig. 2g).
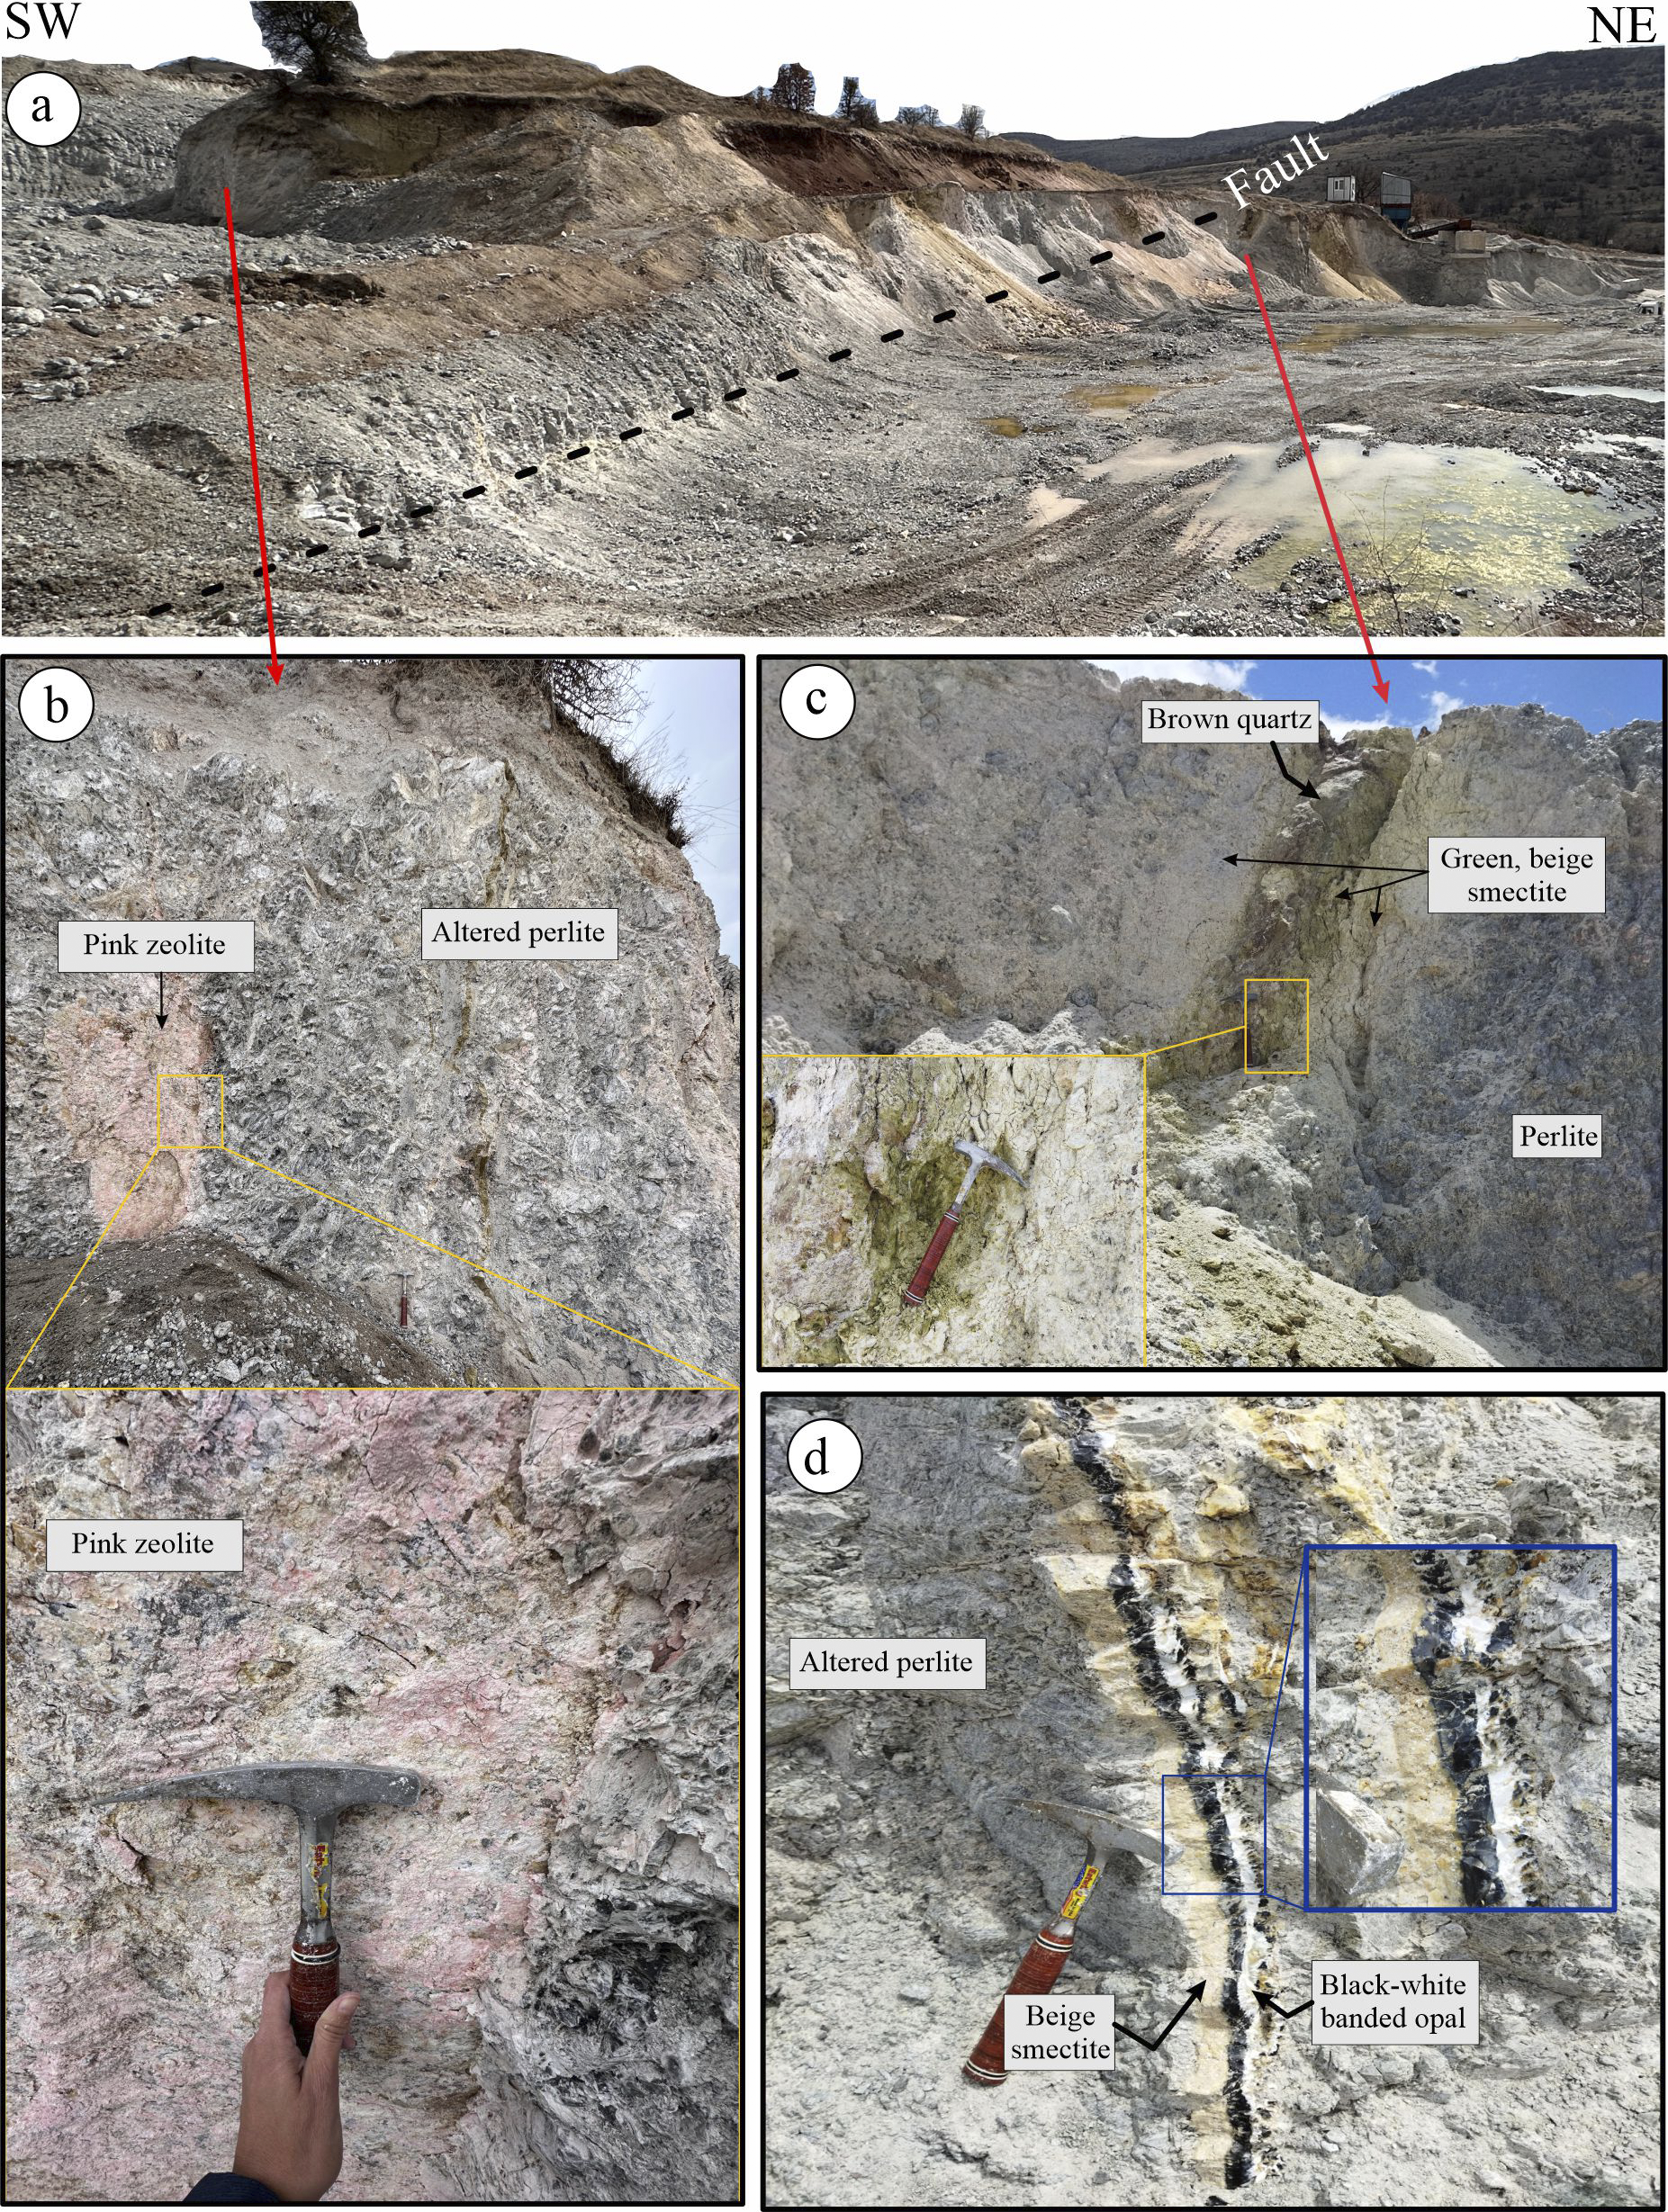
The YE site is located between the villages of Kuyumcu and Yukarıemirler, within a NE–SW oriented perlite quarry measuring ~325 m×125 m (Fig. 3). The parent rock, perlite, is gray in color and displays a characteristic onion skin (conchoidal) structure. The central and western parts of the quarry are marked by a dense network of stockwork fractures. These fractures are surrounded by altered minerals, predominantly green, pink, and white in color (Fig. 3a,c), and are commonly filled with white-to-black banded opal (Fig. 3d).

Figure 3. (a) View of YE perlite quarry; (b) pink-colored zeolite mineral developed along the fractured surfaces; (c) green-beige clay mineral around the brown quartz vein; (d) black-white banded opal filling the fractured zones and beige smectite around it.
The alteration zone extends ~30 m across the quarry and continues laterally for several meters beneath the surface, at a depth of only ~30 cm below the soil, both at the rear and front of the quarry. A NE–SW trending fracture has been identified, with a distinct alteration zone marked by greenish clay minerals along the fracture zone (Fig. 3b). This alteration zone is ~2 m wide and features a central quartz vein with a brown-to-black coloration (Fig. 3c).
Petrography and mineralogical analyses
Petrography
Petrographic examinations, including thin section analysis, XRPD (including clay characterization), FT-IR analyses, and FE-SEM observations, were conducted to investigate the mineralogical characteristics of slightly altered and altered rock samples from the quarries and their surroundings.
Thin sections were prepared primarily to characterize volcanic ash and pyroclastic materials collected from the study area. The volcanic ash samples display a porphyritic texture, with mineral fragments largely altered. Observed phases include alkali feldspar, plagioclase, quartz, and iron-oxidized biotite and hornblende, with vitric fragments occurring frequently (Fig. S1a–c). Alteration and microcrystalline quartz are common within the matrix, and evidence of silicification was noted in both the matrix and the phenocrysts (Fig. S1d).
In thin sections of block and lapilli tuffs, rock fragments composed of alkali feldspar, plagioclase, quartz, and biotite characteristic of rhyolitic and dacitic compositions were observed. Additionally, anhedral crystalline tuffs and rock fragments embedded within a vitric tuff matrix were identified.
Thin section analyses from the YE perlite quarry reveal a typical perlitic texture. The most abundant minerals in the samples are agate (classified as trigonal alpha-quartz) and opal. Opal-CT, another silica polymorph, is widespread in both quarries, as confirmed by XRPD analyses showing a broad diffraction band at ~4 Å, consistent with previous findings on the characteristic diffraction features of opal-CT (Graetsch, Reference Graetsch, Heaney, Prewitt and Gibbs2018).
Microscopic examination revealed that opals predominantly exhibited fibrous textures, with fiber lengths ranging from a few micrometers to several centimeters. These opalized zones can be classified into two main silica-agate types: (1) wall-lining agates, and (2) horizontally layered agates.
Wall-lining agates exhibited a characteristic textural succession consisting of three main components: (1) spherical or anhedral microcrystalline quartz, (2) fibrous crystals, and (3) partially coarse-grained anhedral quartz.
These textural features were observed in nearly all parts of Fig. S2, except in the panel that shows only fibrous crystals developed from the edges and tips of euhedral quartz. In Fig. S2a, Fe-oxide minerals are visible at the transition between microcrystalline quartz and fibrous textures.
In contrast, horizontally layered opal formations appear to overlie discordantly the fibrous quartz layers. These contrasting crystal structures suggest that agate formation occurred under varying physicochemical conditions.
XRPD
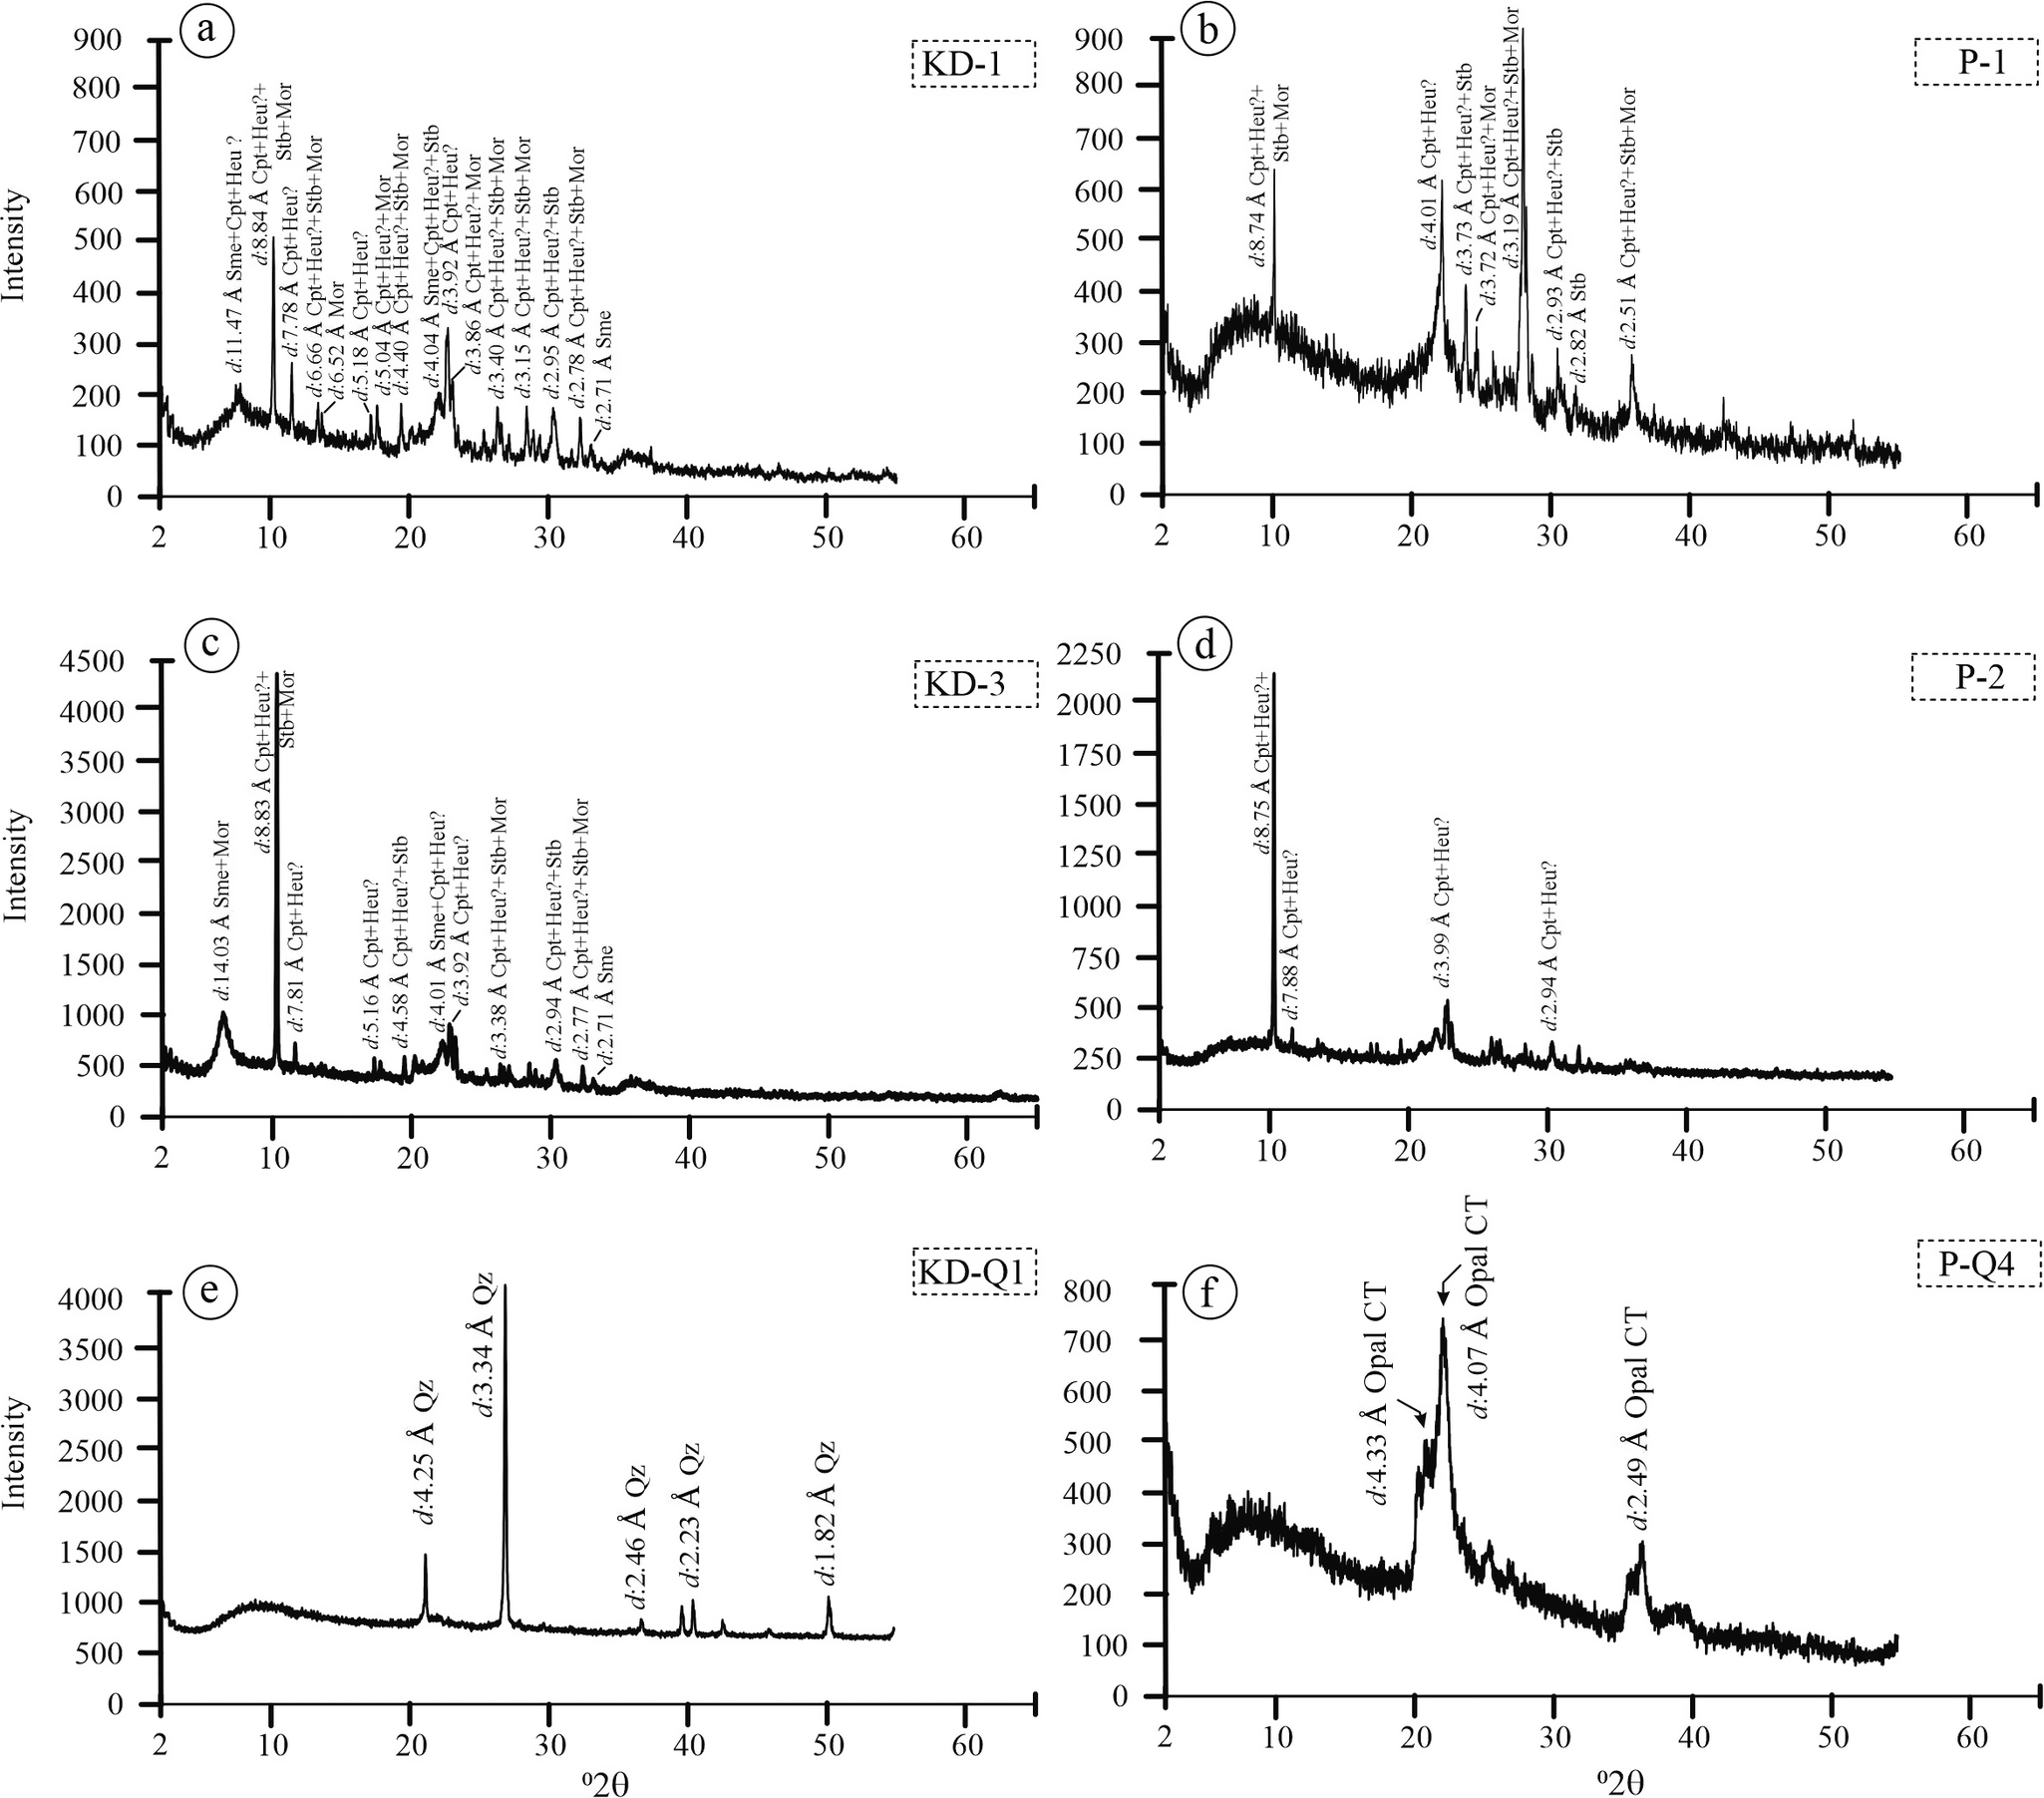
The XRPD analysis of samples from the KD and YE quarries revealed the presence of clay and zeolite minerals (Fig. 4). In the pink altered zones of both quarries, the zeolite phases identified included clinoptilolite/heulandite (uncertain distinction), mordenite, and stilbite (Fig. 4a–d). In addition to these zeolite minerals, feldspar and quartz were also detected; however, their abundances were significantly lower compared with those of zeolite and clay minerals.

Figure 4. Random XRPD patterns for quartz and altered samples from the KD and YE quarries. Sme = smectite, Heu = heulandite, Qz = quartz, Cpt = clinoptilolite, Stb = stilbite, Mor = mordenite, Opal CT = opal-cristobalite/tridymite. Samples labeled as ‘KD-’ refer to altered tuff samples from the Karadana quarry, whereas ‘P-’ denotes altered perlitic volcanic units from the Yukarıemirler quarry (mineral name abbreviations according to Whitney and Evans, Reference Whitney and Evans2010).
The XRPD analyses from both quarries also confirmed the presence of α-quartz and opal-CT. Samples collected from areas interpreted as fault zones were dominated by α-quartz, while the white-black banded samples from randomly distributed fractures and transparent void-filling materials were identified as opal-CT (Fig. 4e,f).
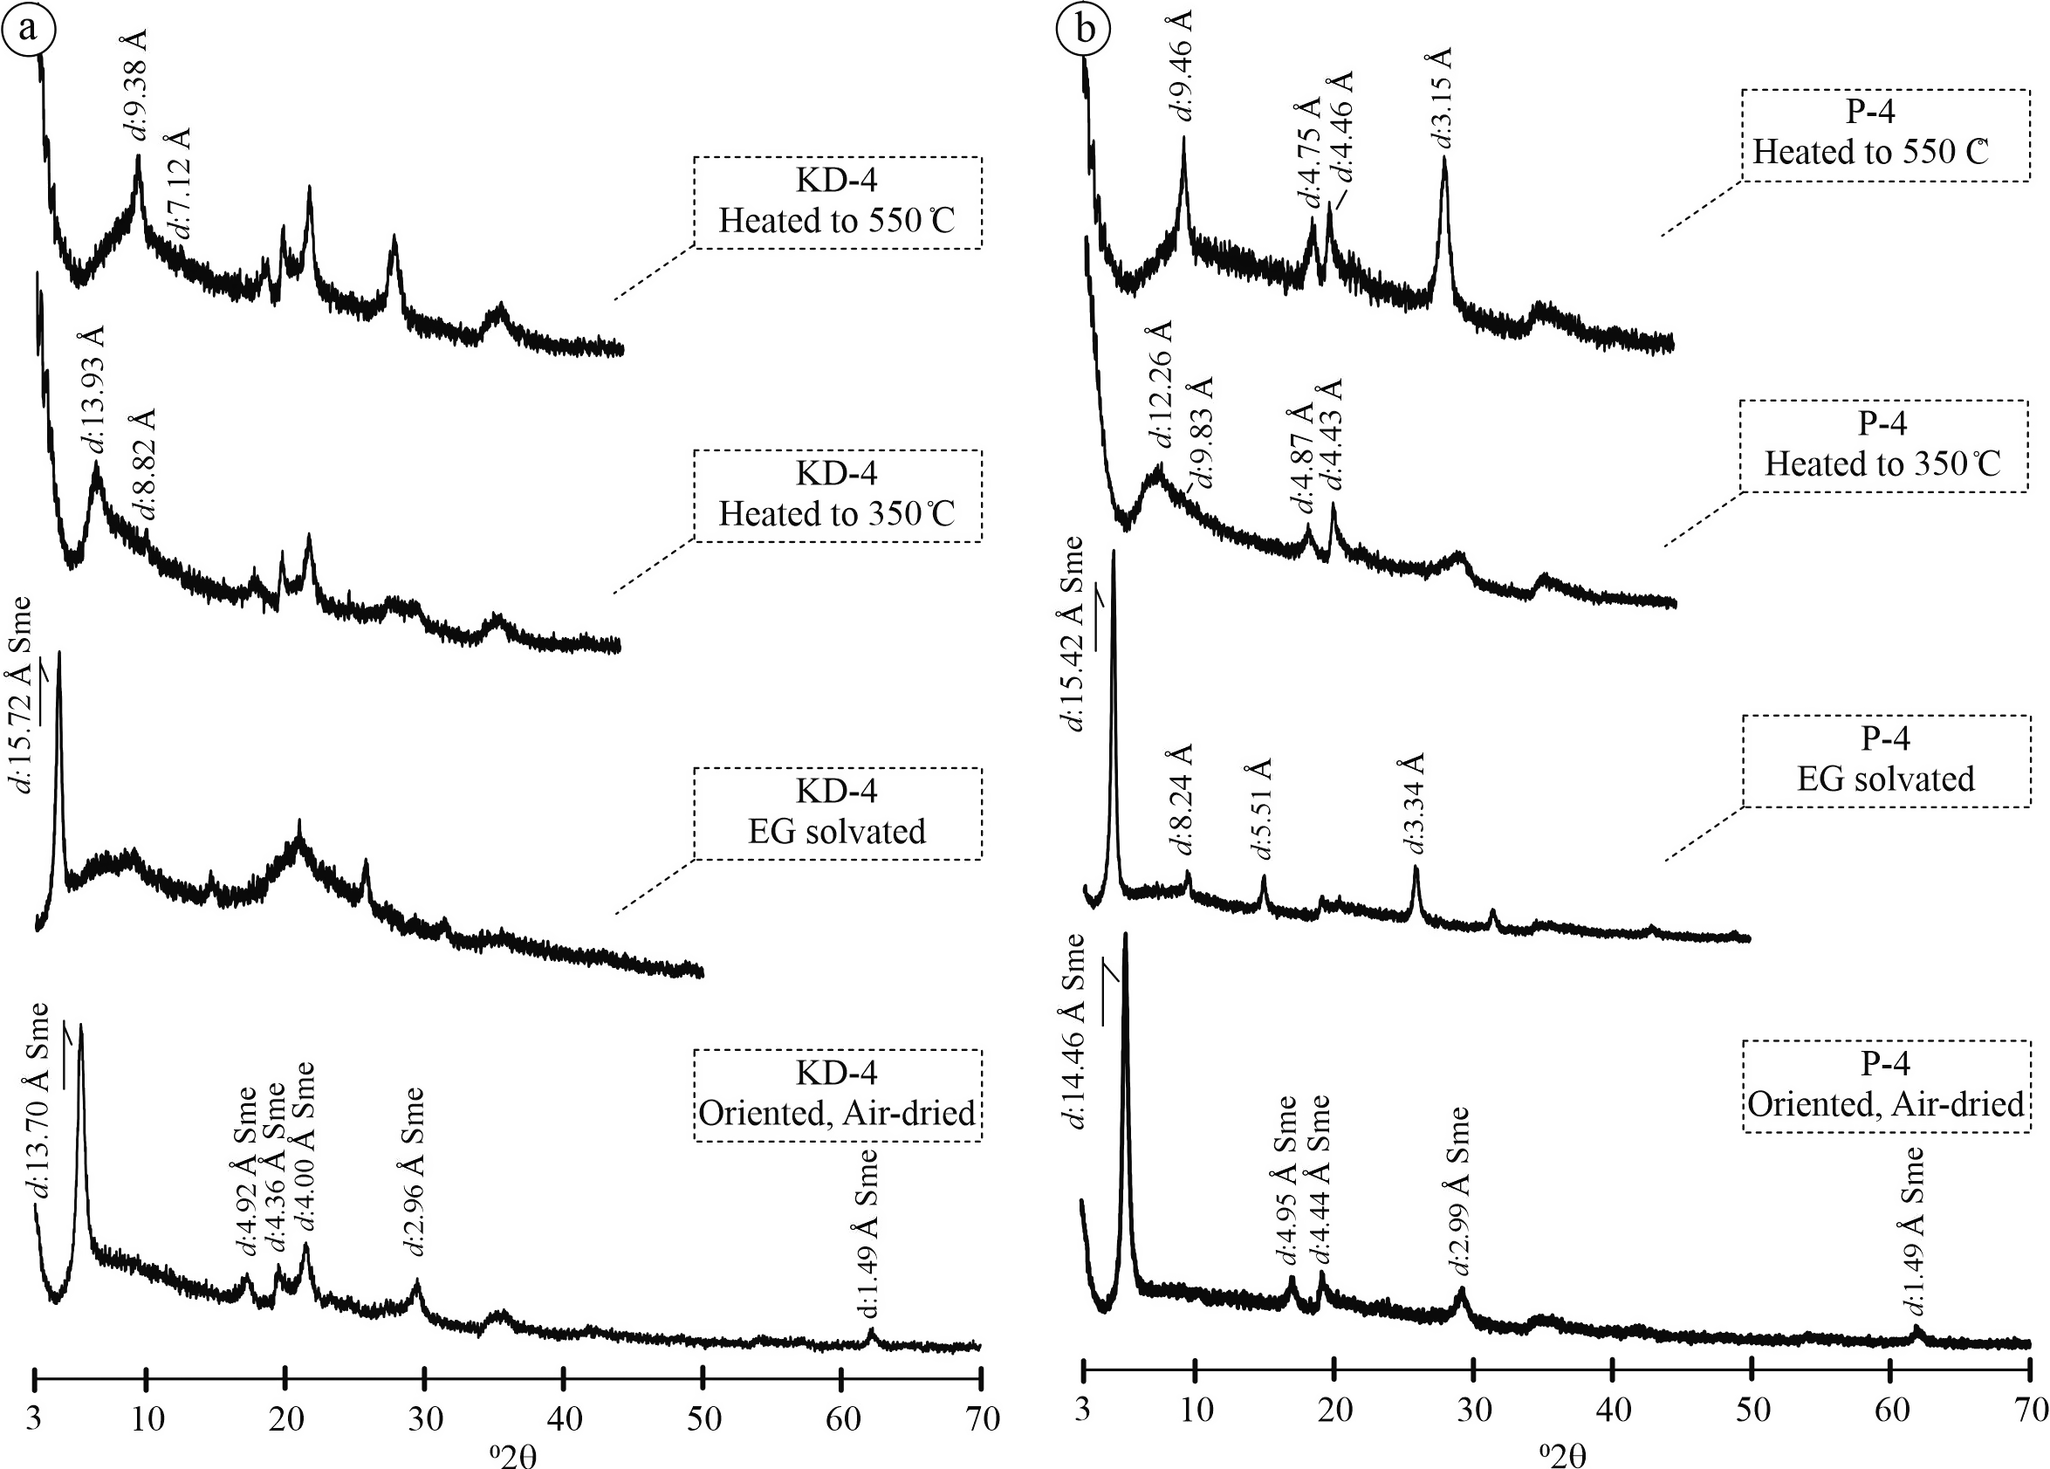
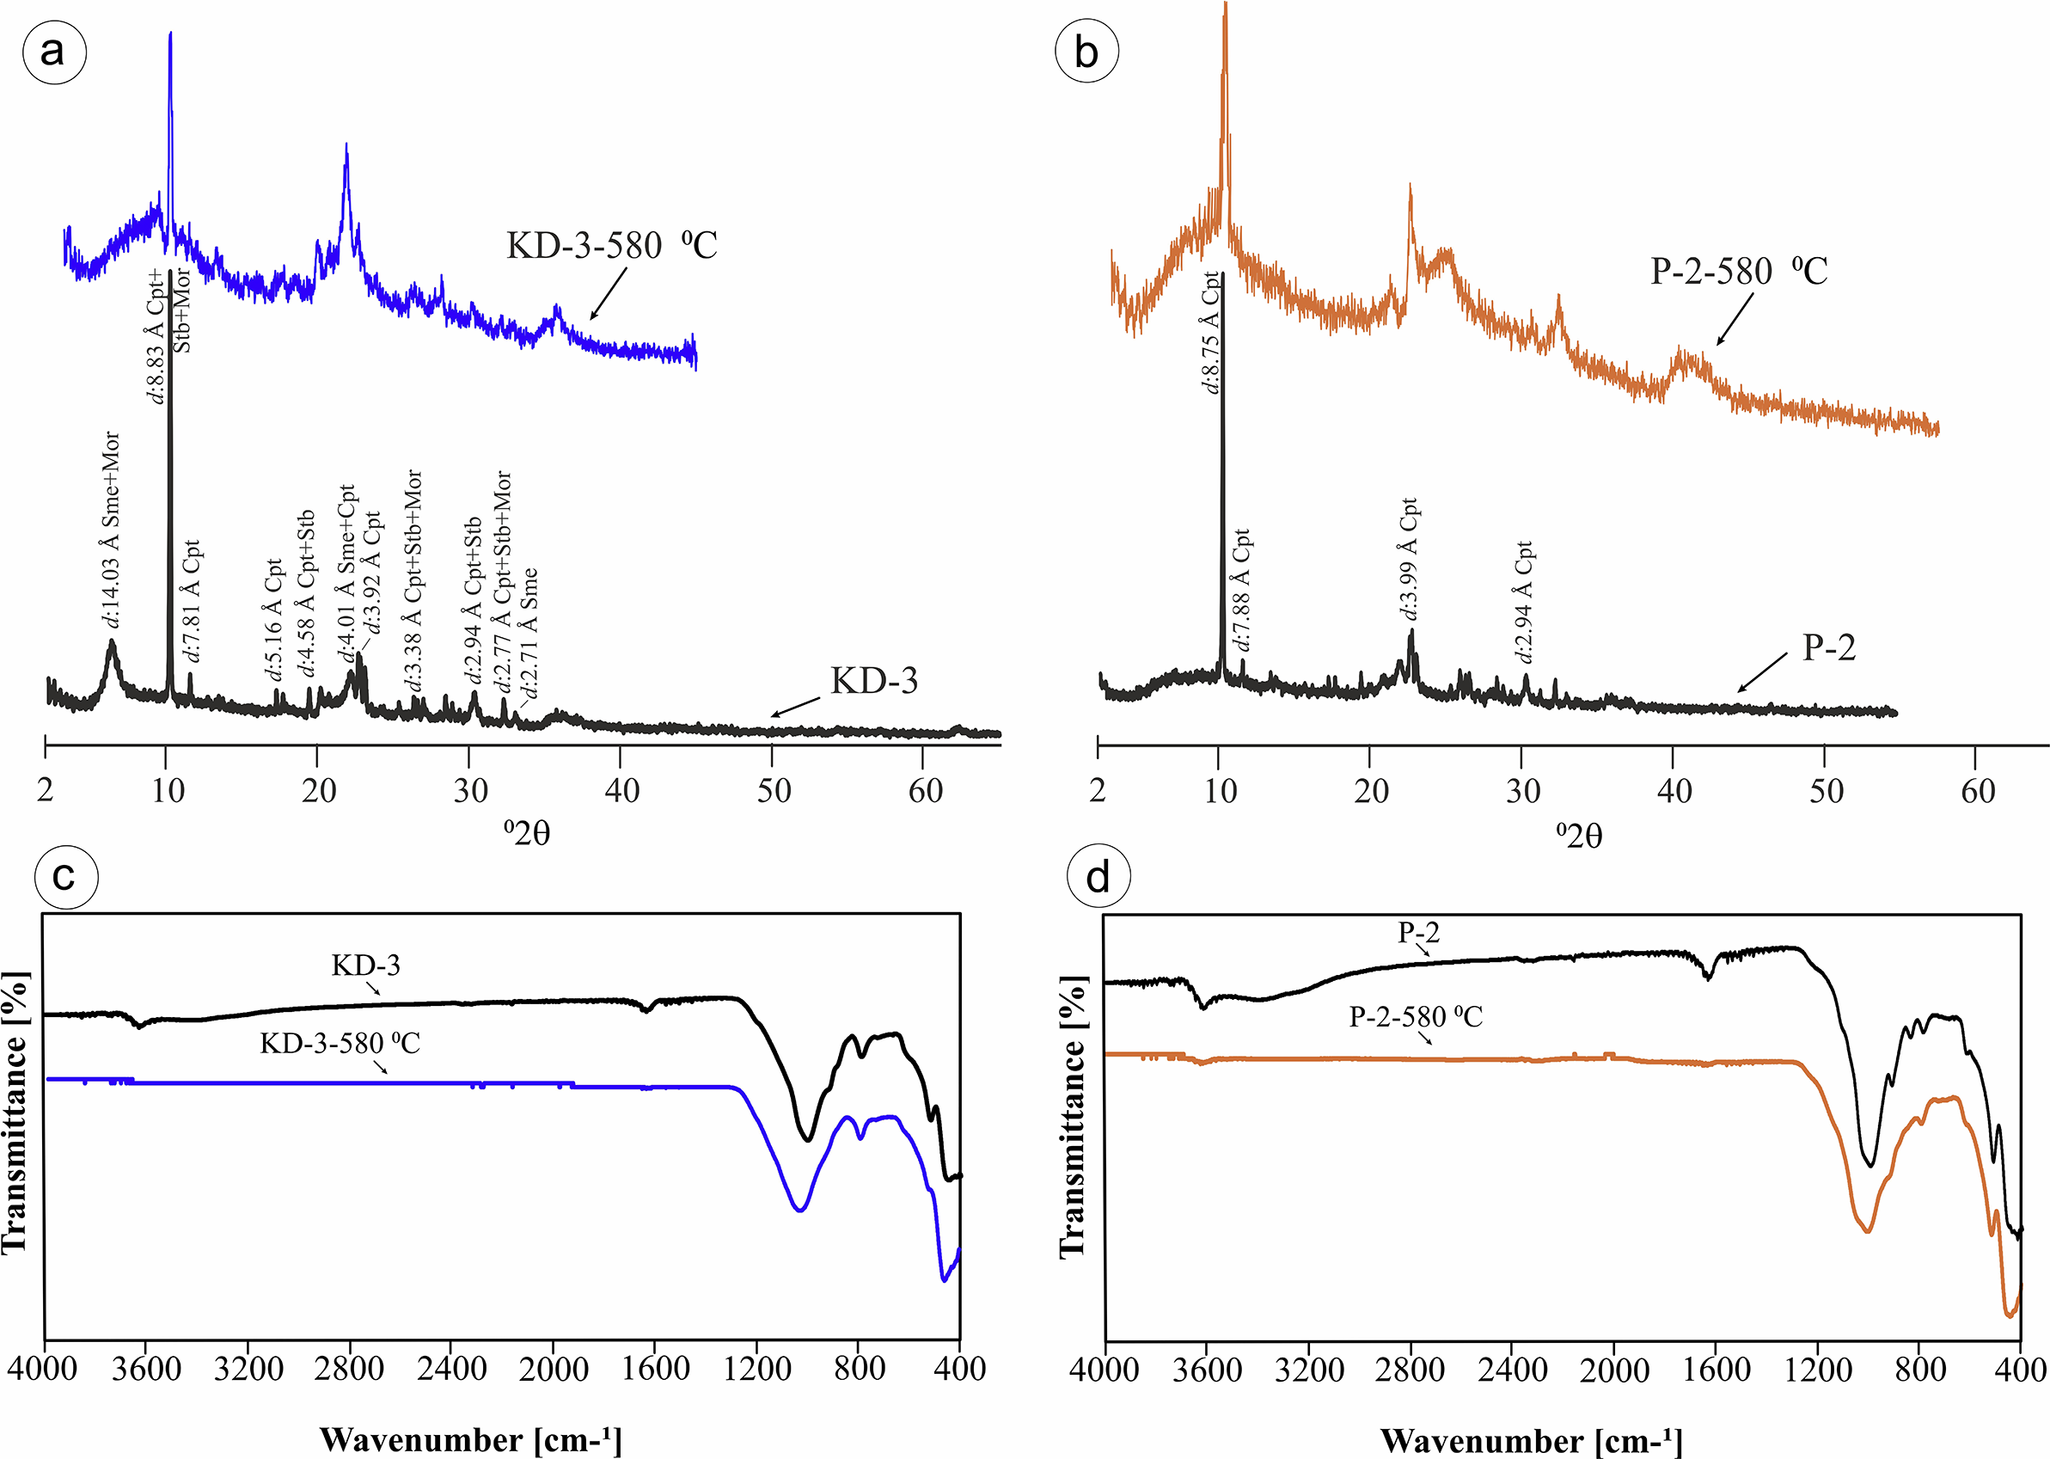
For clay mineral identification, a clay separation procedure was applied to the smectite-rich KD-4 and P-4 samples. The KD-4 samples displayed a sharp basal reflection at d=13.70 Å, corresponding to the (001) basal plane of smectite, which shifted to d=15.72 Å after ethylene glycol (EG) solvation, indicative of expandable smectite layers. Upon heating to 350°C, the (001) reflection contracted to d=13.93 Å, and further heating to 550°C resulted in a collapsed basal spacing at d=9.38 Å, consistent with dehydration of smectite layers (Fig. 5a). In the P-4 sample, the (001) reflection at d=14.46 Å shifted to d=15.42 Å after EG treatment, then decreased to d=12.26 Å after heating to 350°C and finally collapsed to d=9.46 Å at 550°C (Fig. 5b), similarly reflecting progressive collapse of smectite interlayers. The XRPD patterns of the KD-3 and P-2 samples following heating to 580°C (Fig. 6a,b) showed persistent reflections at ~d=8.9 Å and d=3.97 Å, which correspond to the (020) and (040) planes of clinoptilolite, respectively, confirming the presence of thermally stable zeolite phases. Despite undergoing thermal exposure, these peaks retained their definition, suggesting that the crystal framework remained largely undegraded. Such thermal resilience is consistent with clinoptilolite, which retained its crystallinity at temperatures up to ~580°C. In contrast, heulandite typically undergoes structural collapse and peak disappearance at lower temperatures due to its less stable framework. Consequently, the maintenance of these discrete zeolitic peaks provides compelling mineralogical evidence that the prevalent zeolite phase is clinoptilolite as opposed to heulandite.

Figure 5. Oriented XRPD patterns after clay air-drying, EG solvation, and heating processes for the characterization of clays from KD and YE quarries. Sme = smectite.

Figure 6. XRPD (a,b) and FT-IR (c,d) spectra of clinoptilolite minerals before and after heat treatment up to 580°C. Loss of absorbtion at ~3610 and 1617 cm–1 inidcates removal of molecular water from the structure. Sme = smectite, Heu = heulandite, Qz = quartz, Cpt = clinoptilolite, Stb = stilbite, Mor = mordenite.
FT-IR
To distinguish between heulandite and clinoptilolite, heat treatment was applied to selected samples, heating them to 580°C. The crystal structure of the minerals remained intact after heating, which is consistent with the thermal stability of clinoptilolite rather than heulandite (Fig. 6c,d). The FT-IR spectra of the KD-3 and P-2 samples before and after heating to 580°C are shown in Fig. 6c,d, respectively. The unheated KD-3 sample exhibited absorption bands at ~3625 cm-1 (O–H stretching), 1630 cm-1 (H–O–H bending), and a prominent band at 1024 cm-1 related to Si–O asymmetric stretching, along with additional bands at 796, 600, 521, and 457 cm-1 indicative of the zeolitic framework. After heating, although the intensity of the O–H and H–O–H bands decreased, most framework vibrations remained visible, suggesting partial dehydration without full structural collapse. In contrast, the P-2 sample displays bands at ~3600, 1617, 1000, 798, and 518 cm-1 before heating, but these bands become notably weaker or disappear following thermal treatment, indicating significant structural degradation. These observations confirm that clinoptilolite (KD-3) retained its structural features better than heulandite (P-2) under thermal stress, consistent with previous studies (Breck, Reference Breck1974; Mumpton, Reference Mumpton1978; Sheppard and Gude, Reference Sheppard and Gude1980; Flanigen, Reference Flanigen1981; Singer and Berkgaut, Reference Singer and Berkgaut1995; Passaglia and Sheppard, Reference Passaglia and Sheppard2001).
FE-SEM
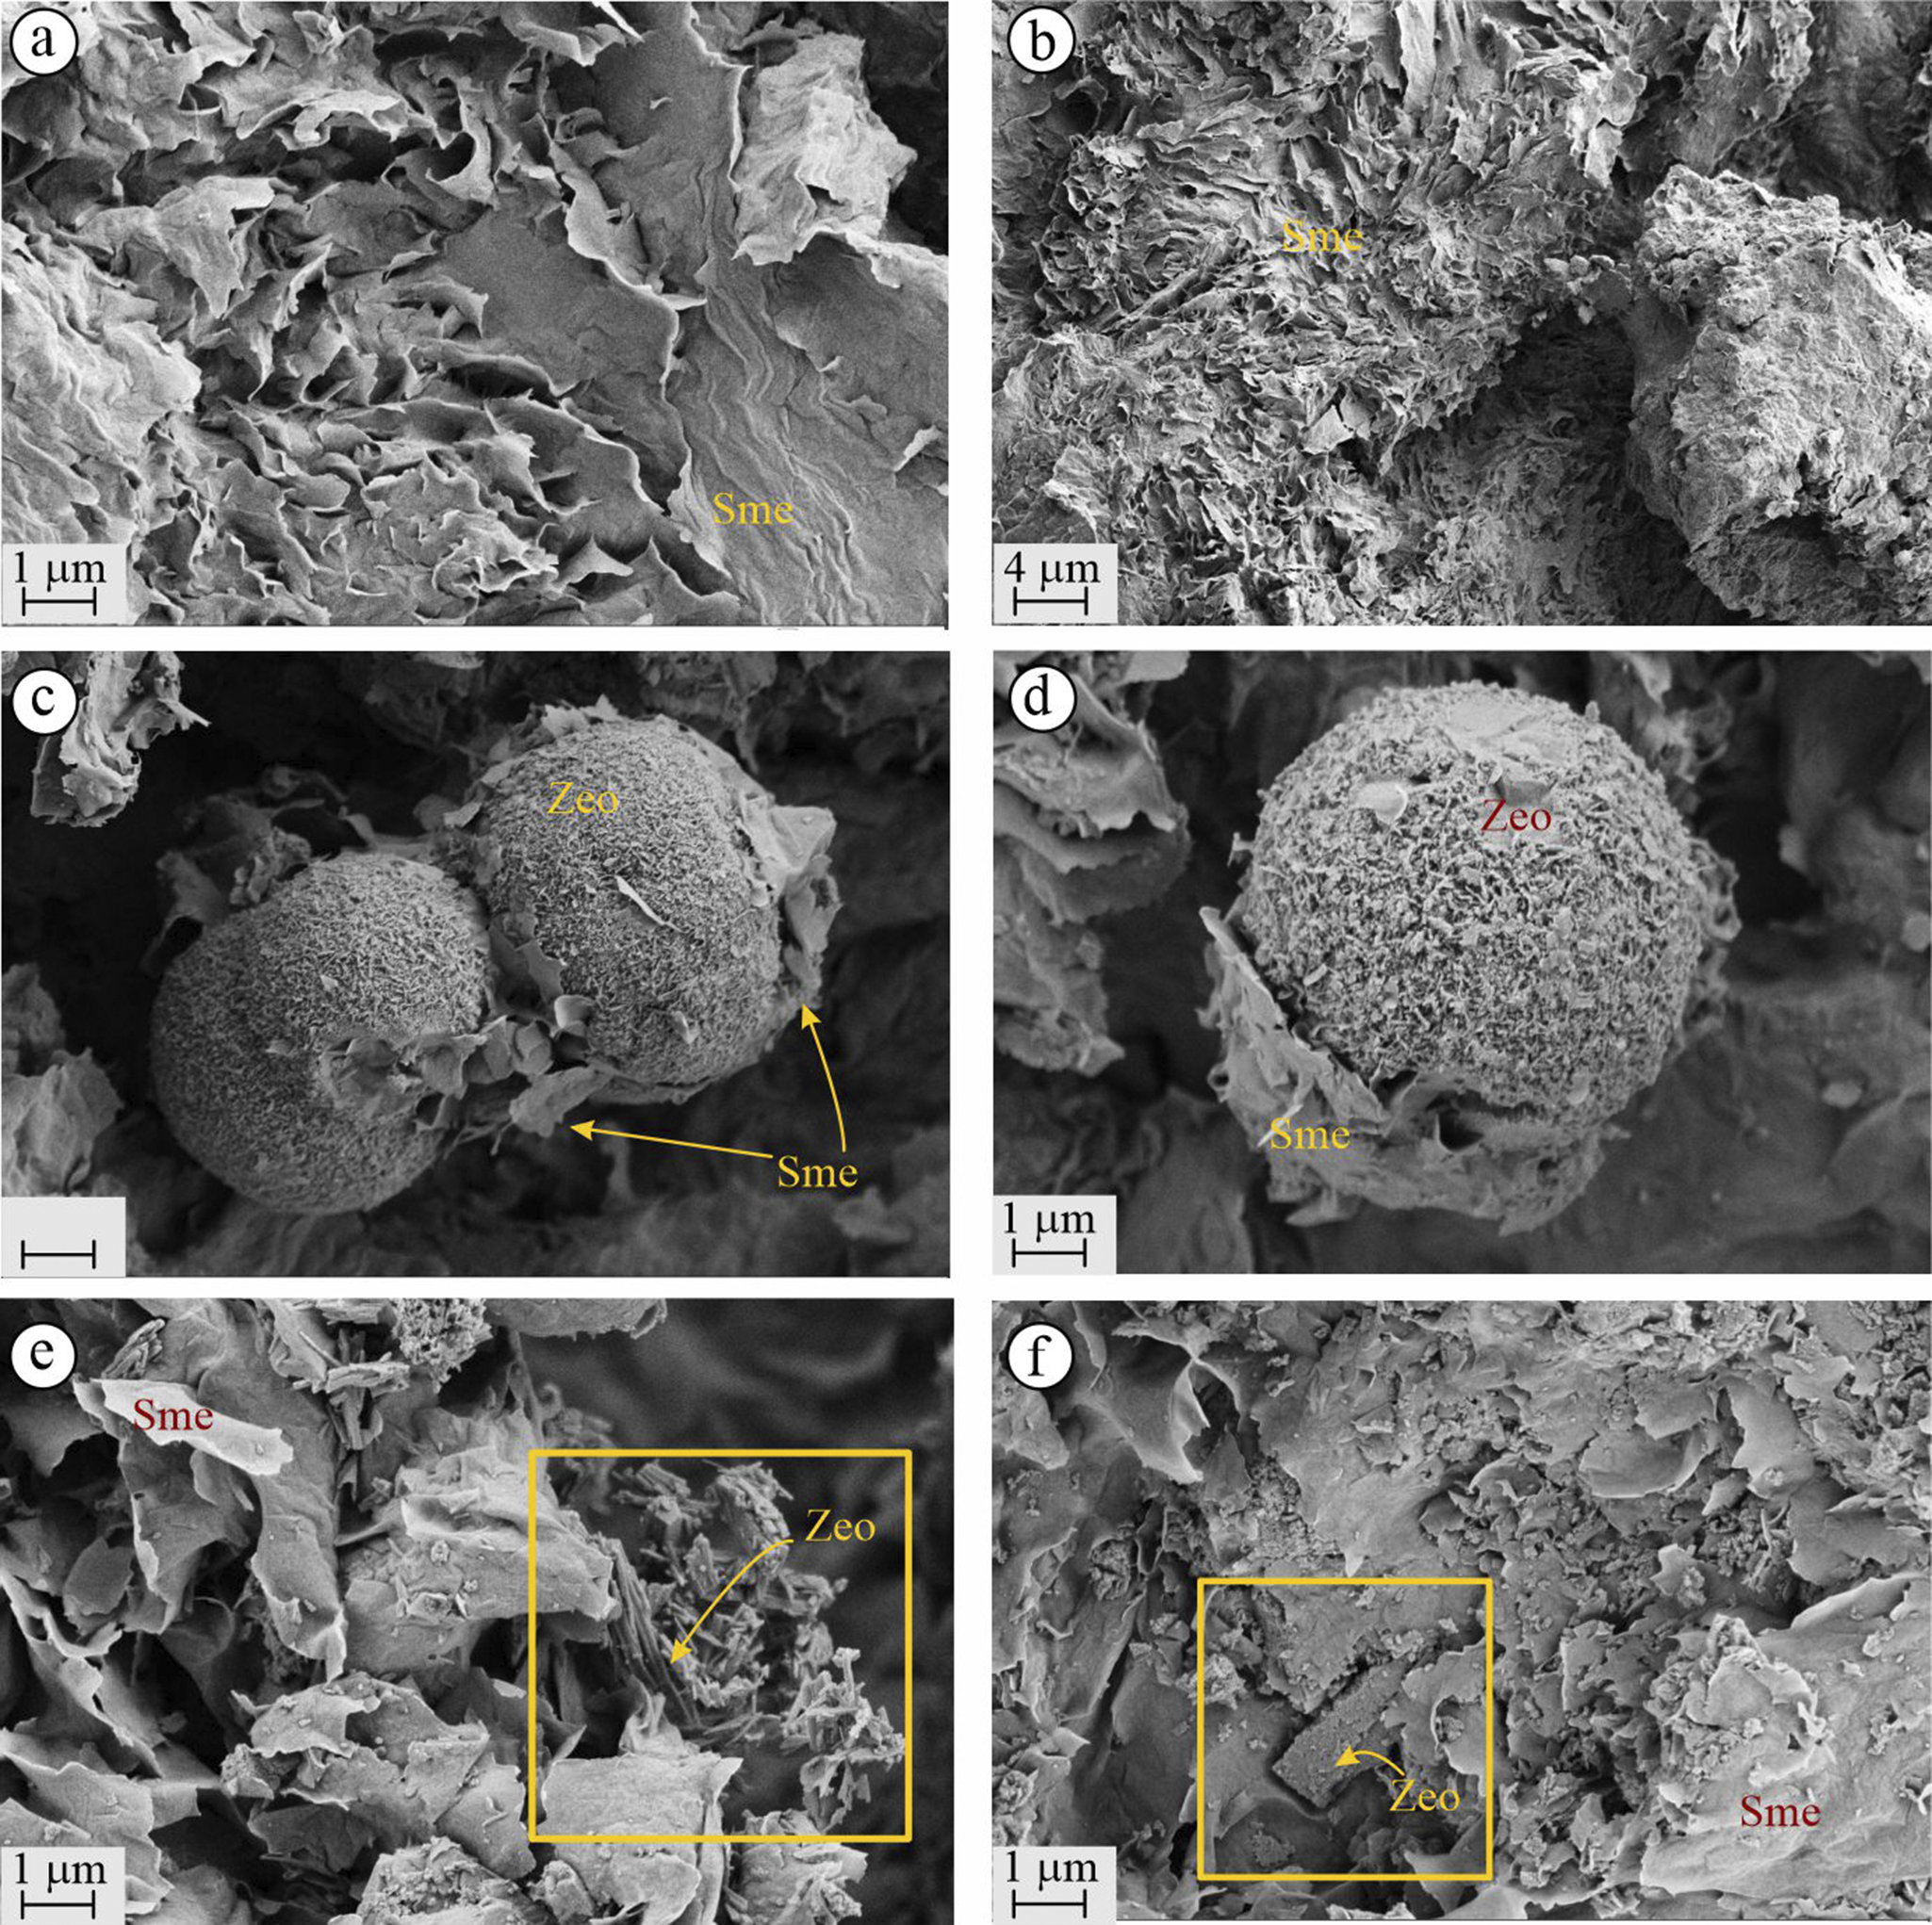
The FE-SEM analyses of altered minerals from the KD quarry revealed the presence of both clay and zeolite minerals (Fig. 7). Smectite minerals were identified by their broad, leaf-like structures resembling a ‘cornflake’ morphology (Fig. 7a,b). These smectites were often interwoven with zeolites, another dominant mineral group in the quarry. In some instances, smectite was observed enveloping spherical zeolite aggregates like an outer layer (Fig. 7c,d). Two distinct morphologies of zeolite minerals were identified: spherical forms (Fig. 7c,d) and rod-like crystals (Fig. 7e,f). The diameters of the spherical zeolites ranged from ~2 to 10 μm, while the rod-like zeolite crystals appeared as microcrystalline aggregates, distributed as scattered clusters among the smectite flakes.

Figure 7. FE-SEM images of the KD quarry illustrate the following: (a,b) cornflake-structured smectites; (c,d) spherical zeolite enveloping the smectites; (e) scattered rod-like zeolite among smectite layers (the yellow frame indicates the areas where zeolite is present); (f) orthorhombic mordenite among randomly distributed smectites and micro zeolite crystals. Zeo = zeolite, Sme = smectite.
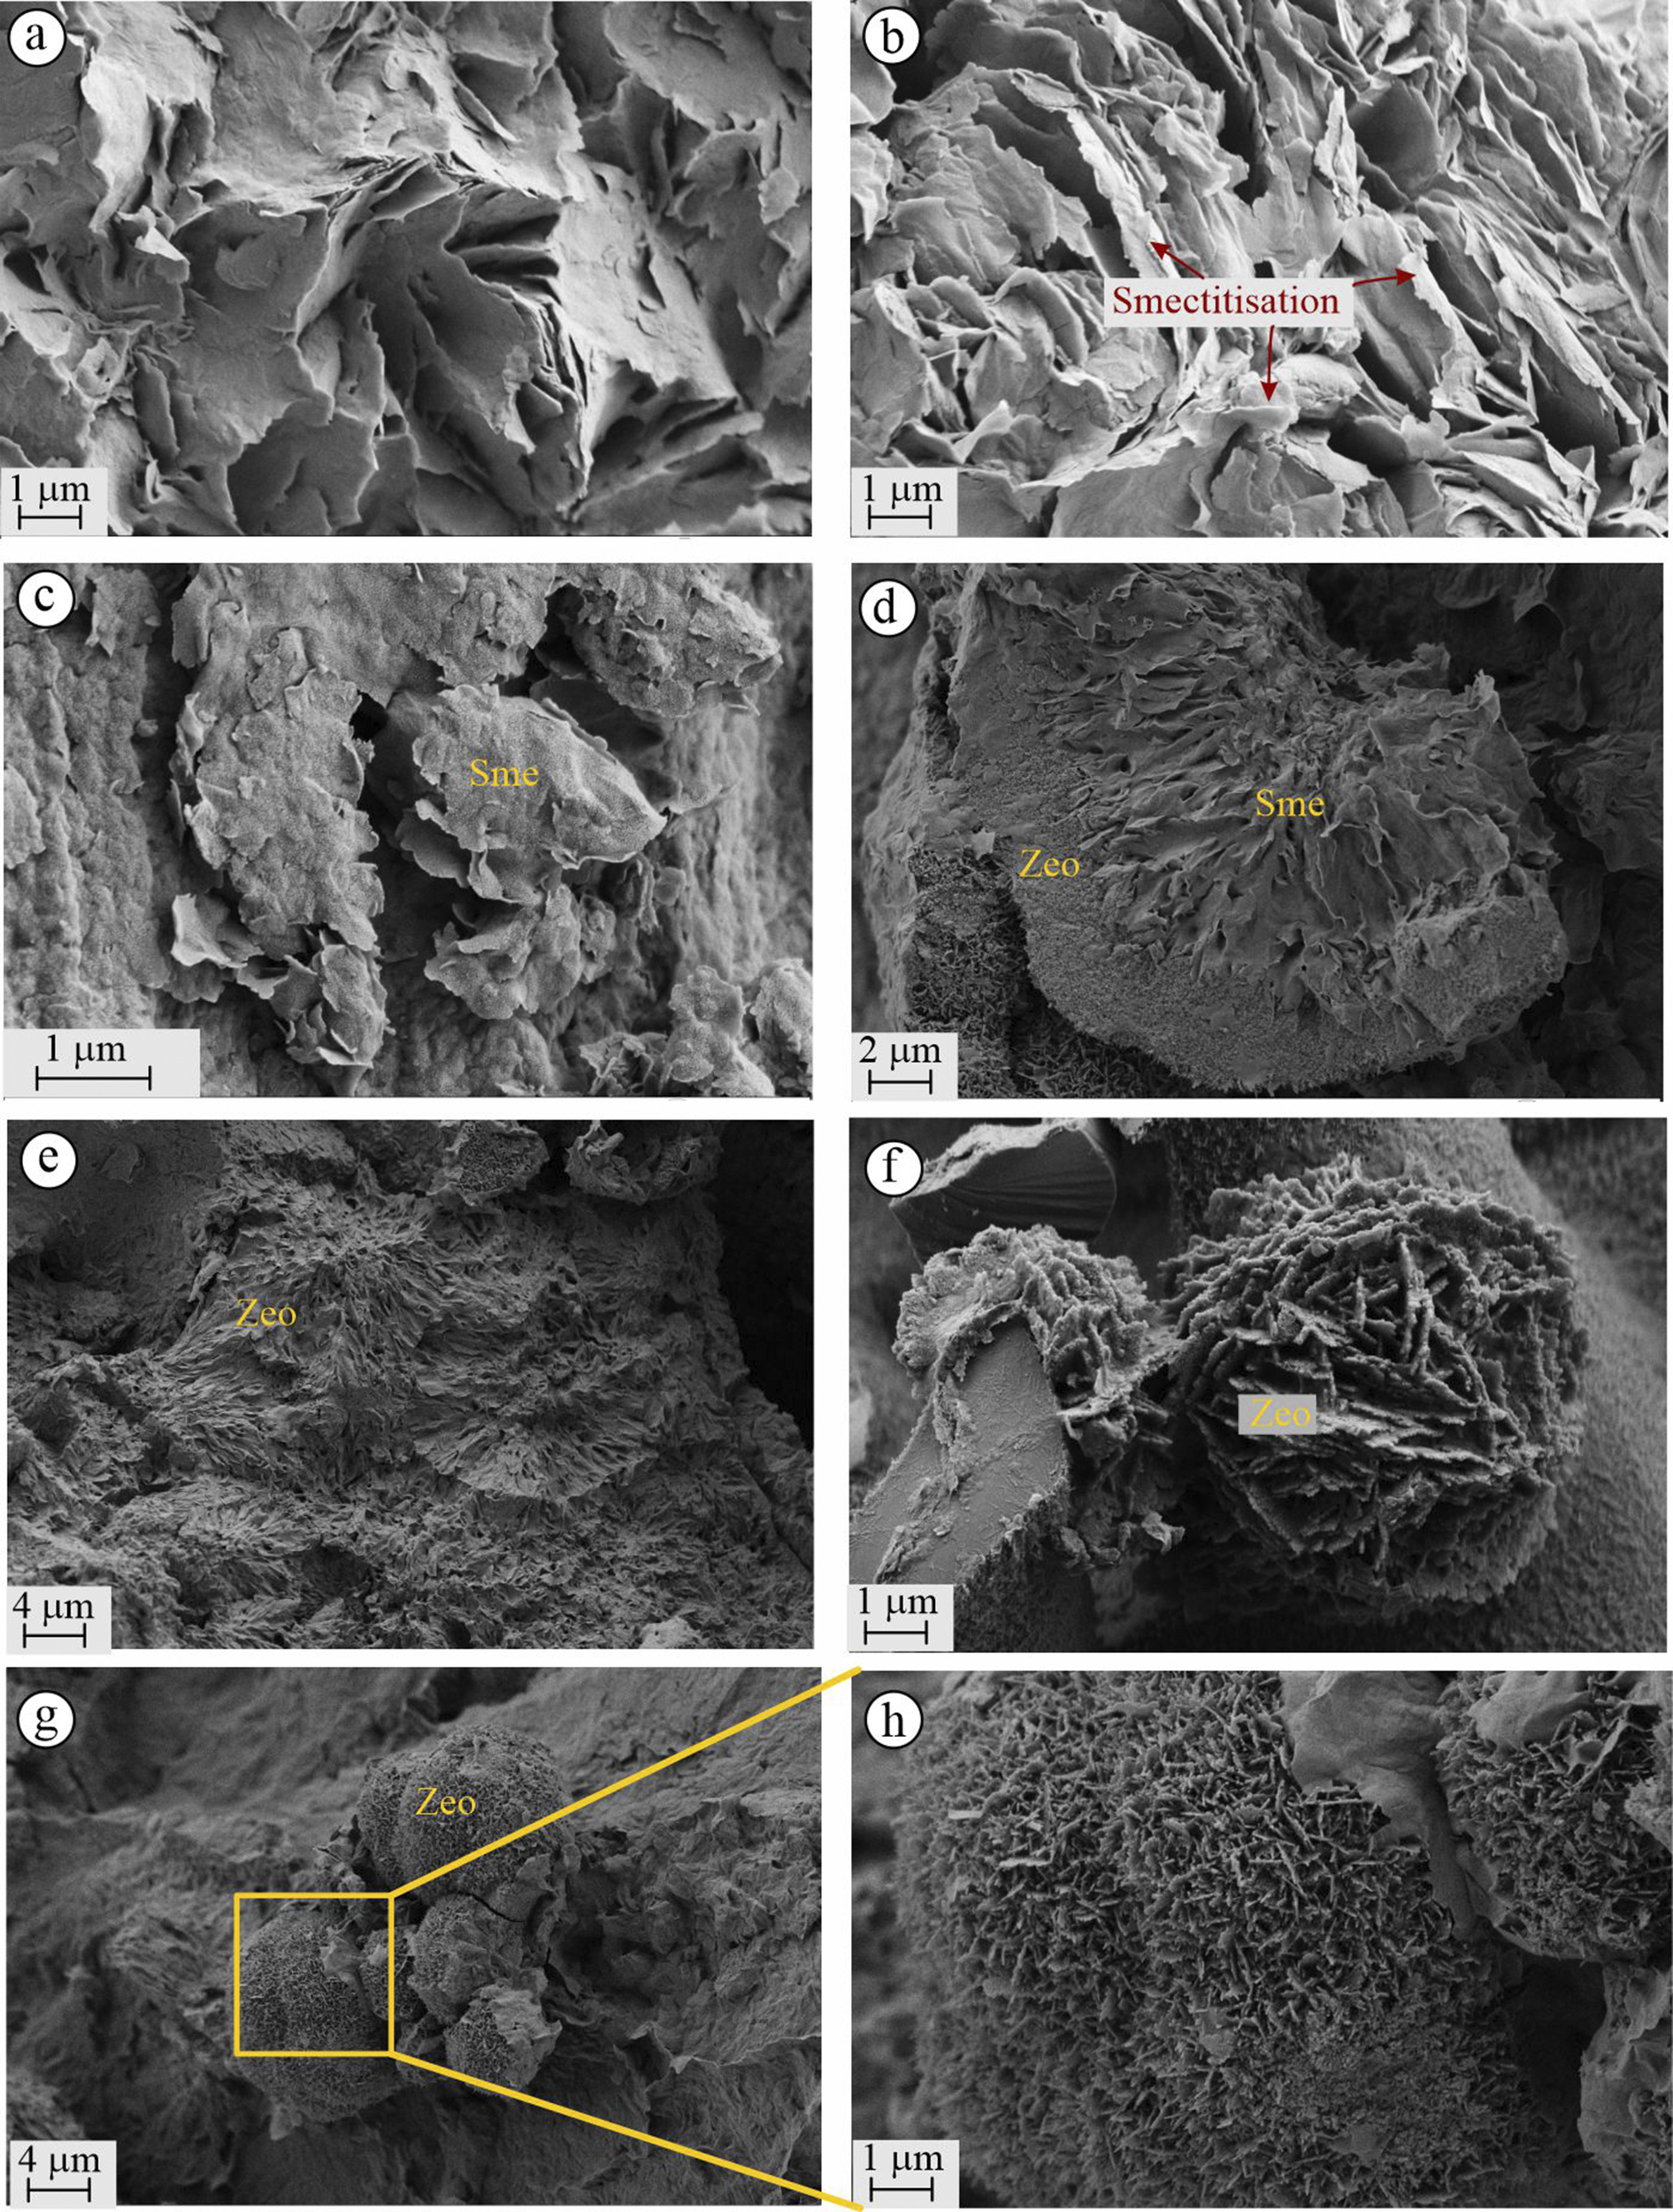
FE-SEM micro-topographic backscatter electron images from altered samples of the YE quarry also revealed the presence of altered perlite, smectite, and zeolite minerals. Perlite exhibited a honeycomb-like texture (Fig. 8a), resembling that of smectite, indicating evidence of the smectite formation (Fig. 8b). Green-colored smectites from the eastern fracture zone of the quarry displayed a characteristic cornflake-like structure (Fig. 8c). As in the KD quarry, zeolite minerals with distinct morphologies were also observed at YE. In Fig. 8d, microcrystalline zeolite crystals are shown forming envelopes around smectite spheres. Some zeolite minerals exhibited radially structured, interwoven spherical morphologies (Fig. 8e). Unlike those in the KD quarry, the zeolite microspheres in the YE quarry appeared as thicker plates with diameters up to 10 μm (Fig. 8f). These samples were collected from outcrop surfaces that displayed pinkish coatings in the YE quarry. Samples from the western end of the YE quarry also revealed flake-structured smectite minerals and spherical zeolite microspheres (4–10 μm), closely resembling the micromorphological features of zeolites observed in the KD quarry (Fig. 8g,h).

Figure 8. FE-SEM images of the YE quarry: (a,b) partially smectitized perlitic crusts; (c) flake-structured smectite; (d) hemisphere containing zeolite crystals around the smectite mineral; (e) spherical, radial-structured mordenite; (f) spherical zeolite; (g,h) miscrosphere of zeolite. Sme = smectite, Zeo = zeolite.
EDX
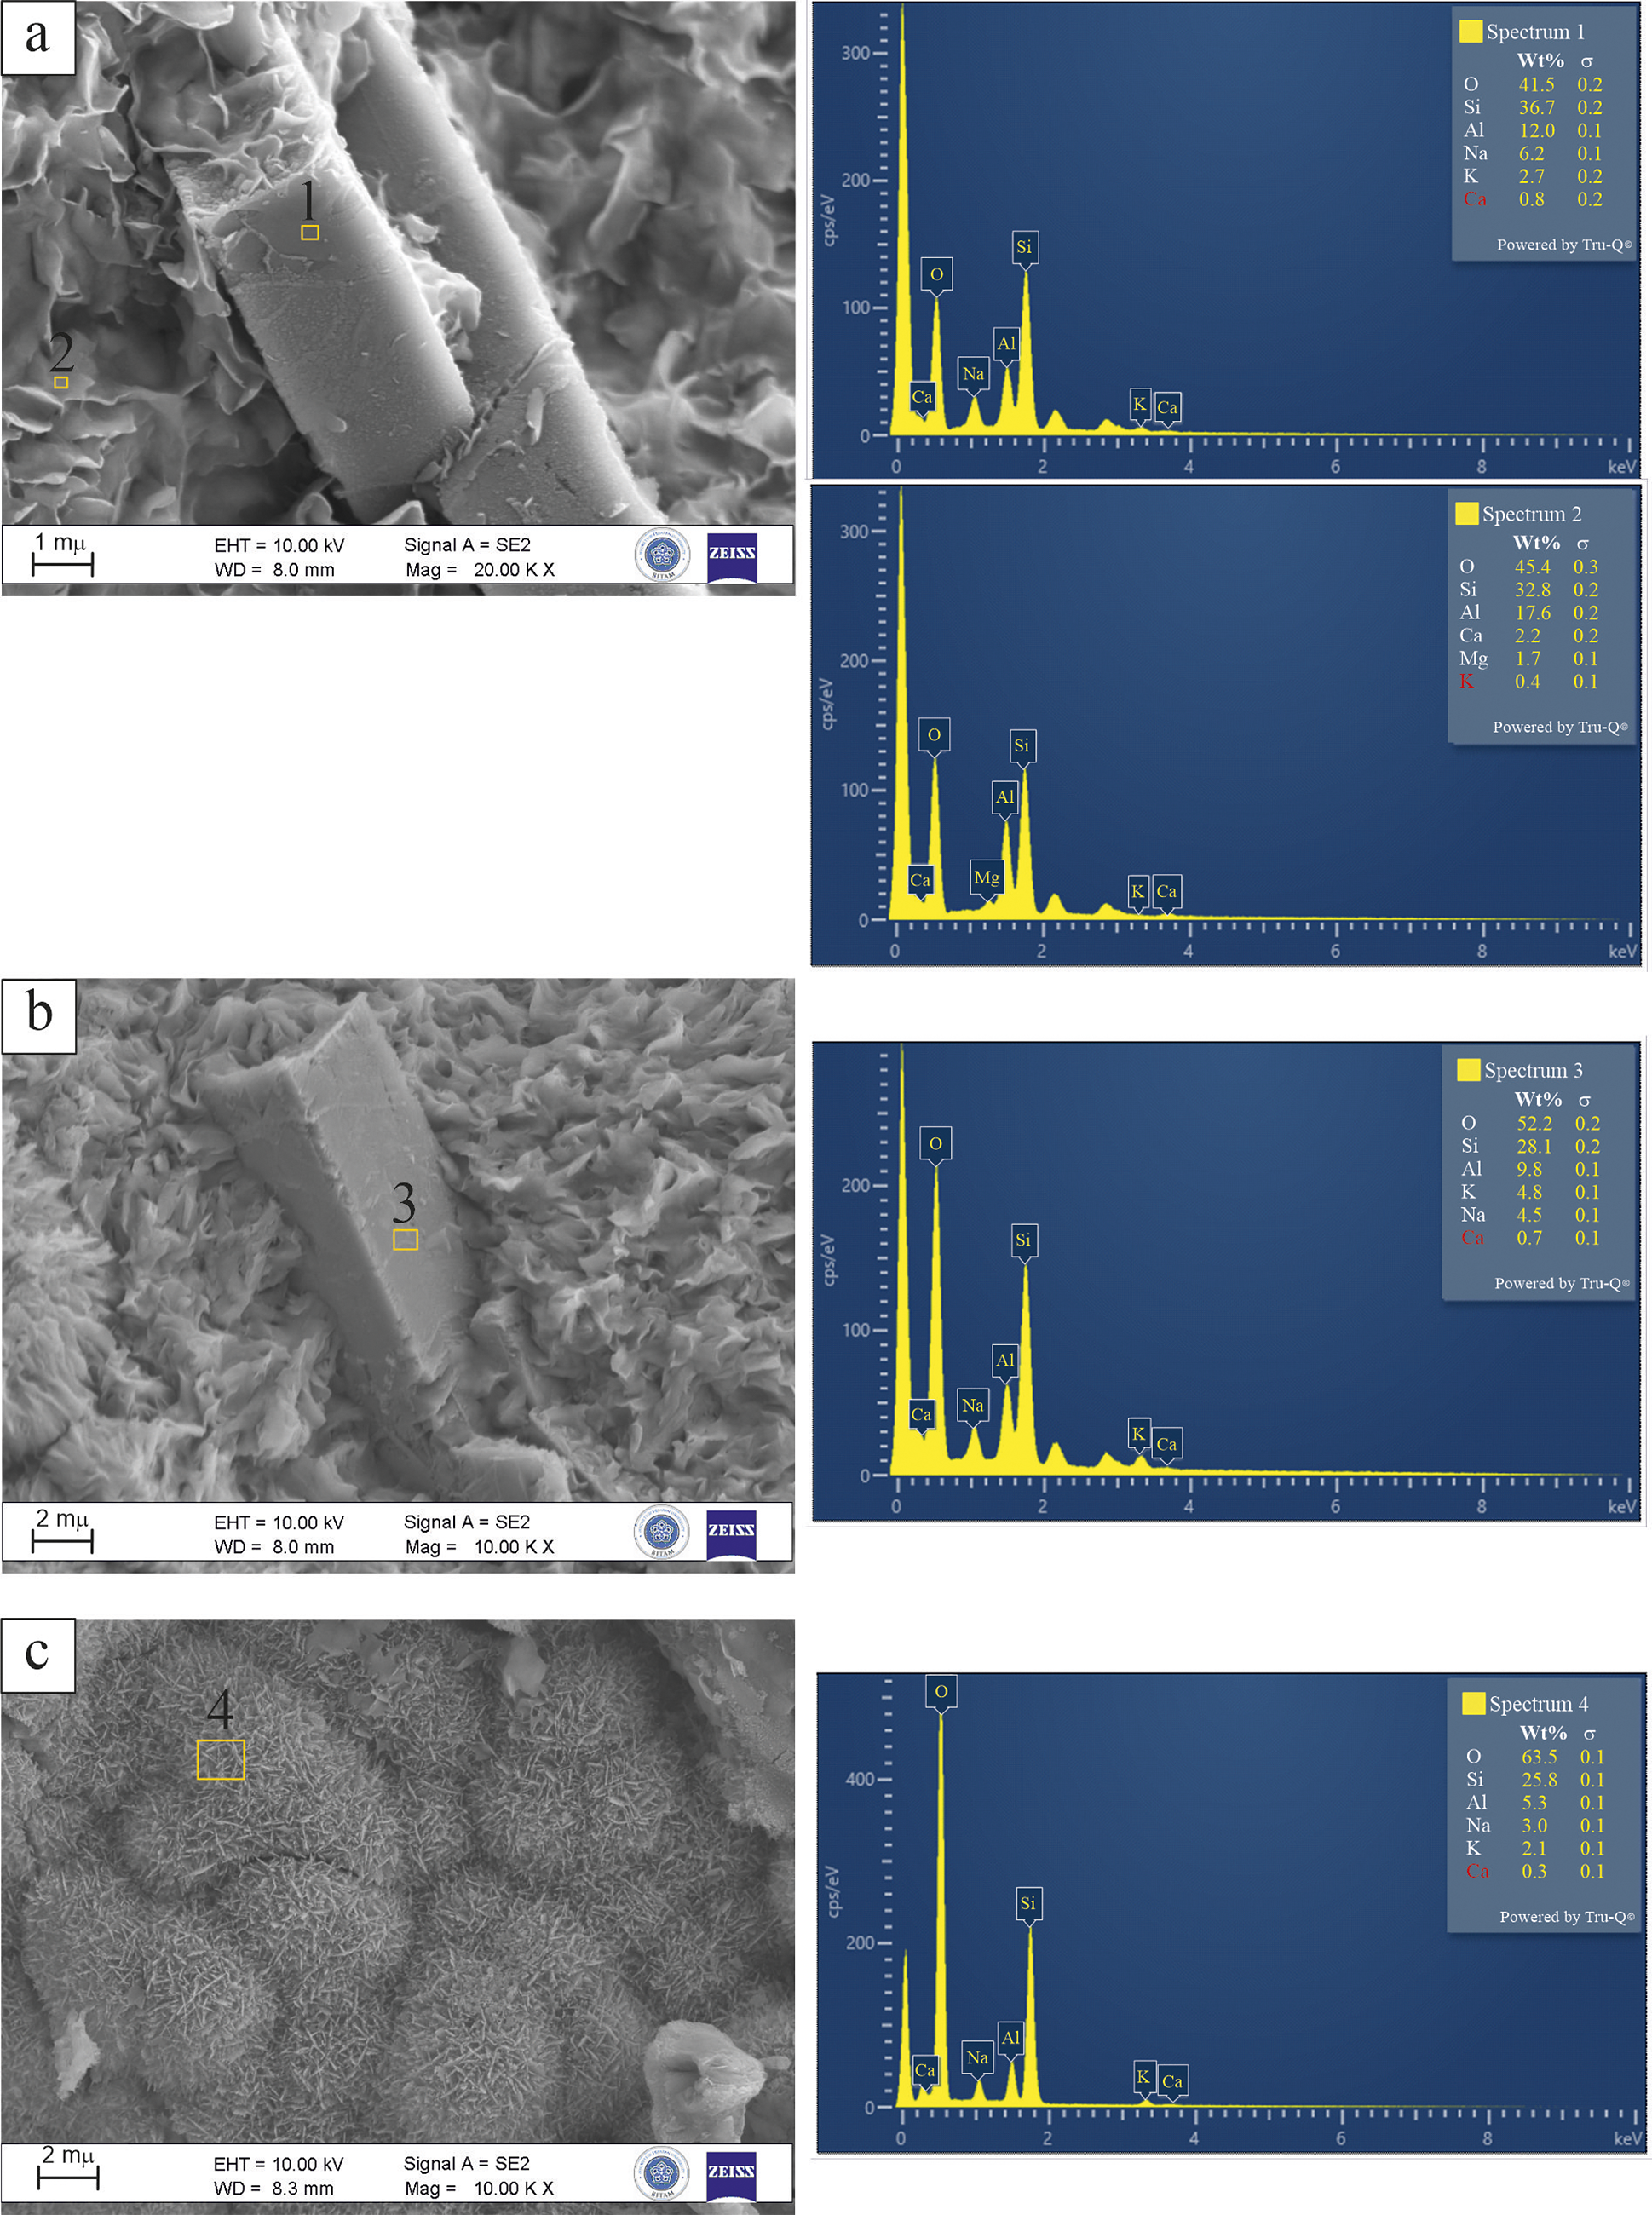
Figure 9a presents a FE-SEM image of altered phases from the Karadana quarry, accompanied by two EDX spectra obtained from morphologically distinct zones. In Fig. 9a, Spectrum 1, collected from a prismatic crystal, displays Si (36.7 wt.%), Al (12.0 wt.%), and Na (6.2 wt.%), with minor K (2.7 wt.%) and Ca (0.8 wt.%). The elemental proportions of the sample are indicative of Na-dominant clinoptilolite-type zeolites, as evidenced by the elevated Na and moderate Si/Al ratio (~3.1), as reported in the literature (Passaglia and Sheppard, Reference Passaglia and Sheppard2001; Coombs et al., Reference Coombs, Alberti, Armbruster, Artioli, Colella, Galli, Grice, Liebau, Mandarino, Minato, Nickel, Passaglia, Peacor, Quartieri, Rinaldi, Ross, Sheppard, Tillmanns and Vezzalini1997). Spectrum 2, acquired from the surrounding clays, reveals a different composition with lower Si (32.8 wt.%), higher Al (17.6 wt.%), and detectable amounts of Mg (1.7 wt.%), Ca (2.2 wt.%), and K (0.4 wt.%). This chemical pattern, particularly the lower Si/Al ratio (~1.9) and the presence of Mg, supports the presence of a smectite-group clay mineral, probably montmorillonite (Bailey et al., Reference Bailey, Brindley and Brown1980; Środoń et al., Reference Środoń, Drits, McCarty, Hsieh and Eberl2001). Figure 9b (Spectrum 3) corresponds to a zeolite phase, with high Si (52.2 wt.%) and Al (9.8 wt.%), and significant alkali contents (K 4.8 wt.%, Na 4.5 wt.%). The K+Na enrichment, in conjunction with a Si/Al ratio exceeding 4, substantiates its categorization as clinoptilolite. Figure 9c and Spectrum 4, with Si (25.8 wt.%) and Al (5.3 wt.%), yields a Si/Al ratio of ~4.9. Despite falling within the upper range of clinoptilolite, several features favor mordenite. The low Ca (0.3 wt.%), low Al, and high Si/Al ratio are more consistent with mordenite chemistry. Furthermore, the botryoidal-like aggregates composed of fine, needle-like crystals observed in Fig. 9c are indicative of mordenite and not of clinoptilolite. Considering these combined features, the phase is identified as mordenite (Passaglia and Sheppard, Reference Passaglia and Sheppard2001; Deer et al., Reference Deer, Howie, Wise and Zussman2004).

Figure 9. FE-SEM images and corresponding EDX spectra of zeolite and clay phases from the Karadana quarry: (a) prismatic clinoptilolite crystal (Spectrum 1) among montmorillonite flakes (Spectrum 2); (b) clinoptilolite crystal (Spectrum 3) associated with cornflake-like montmorillonite; (c) botryoidal aggregate composed of needle-like mordenite crystals (Spectrum 4).
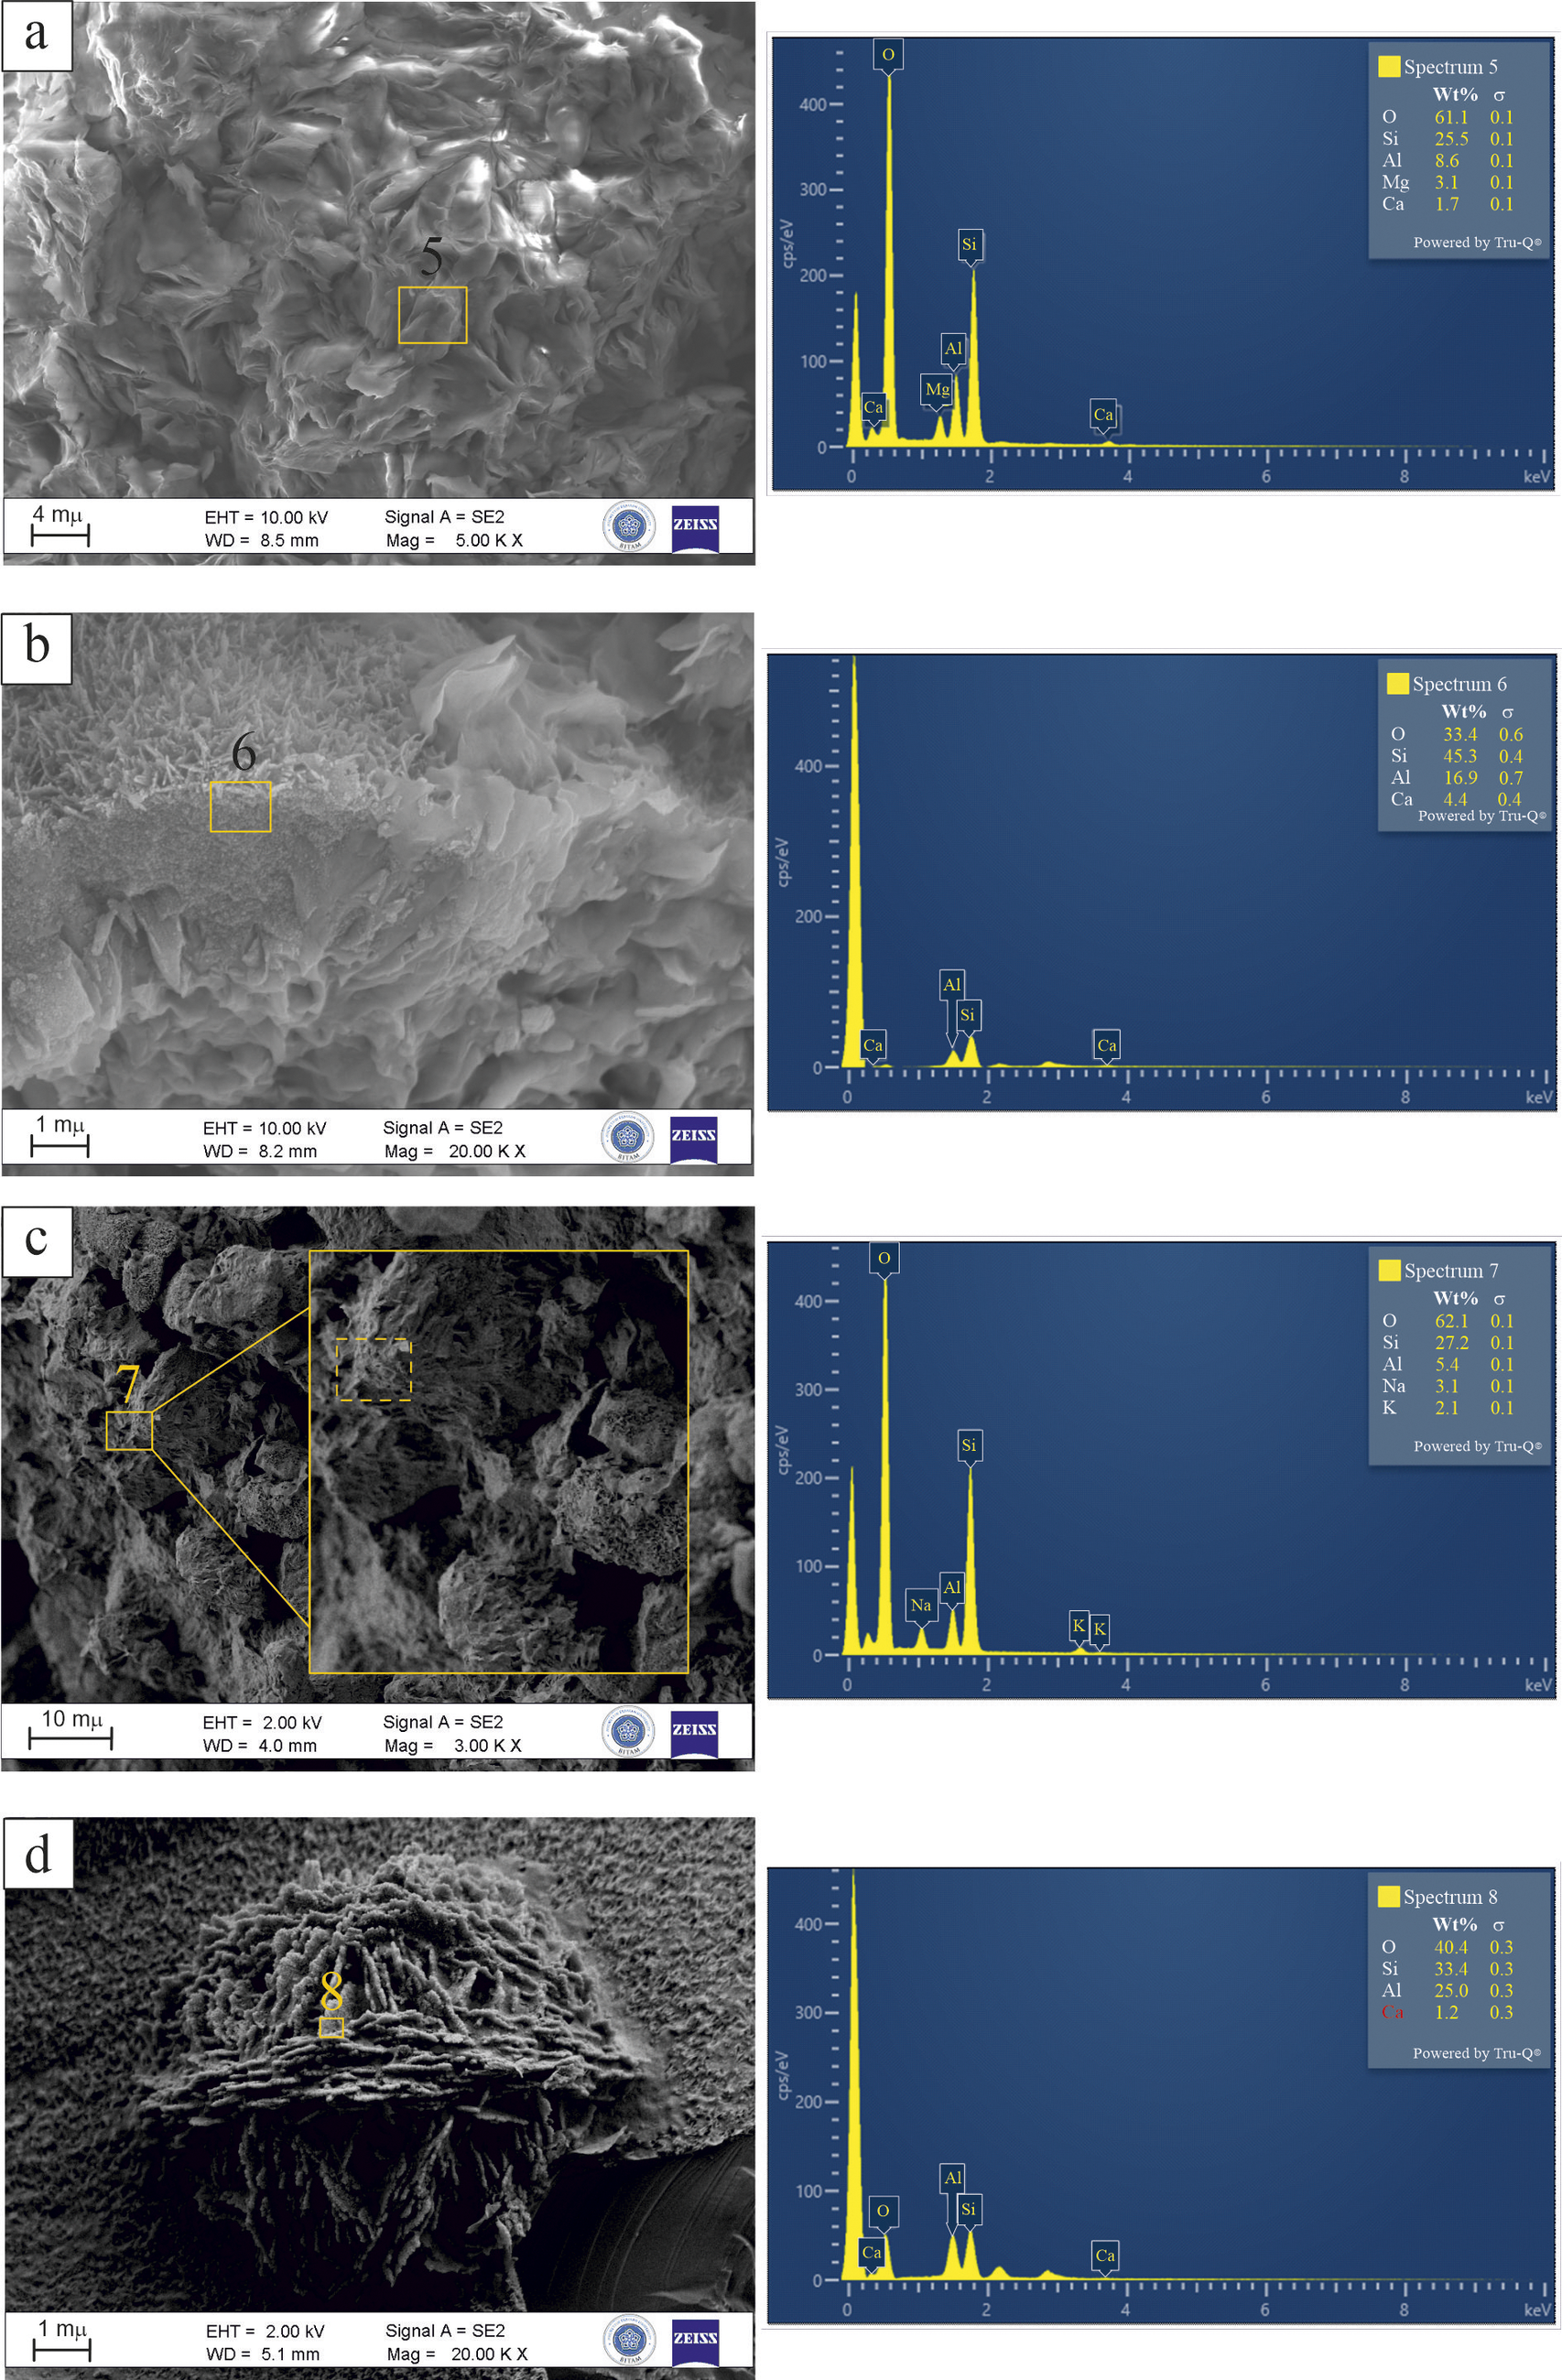
Spectrum 5, as shown in Fig. 10a, was obtained from the altered perlite matrix and reveals a clay-rich composition with Si (25.5 wt.%), Al (8.6 wt.%), Mg (3.1 wt.%), and Ca (1.7 wt.%). The moderate Si/Al ratio (~3.0) and the presence of Mg and Ca suggest advanced smectitization, probably forming Ca–Mg-rich montmorillonite in association with perlite alteration. Spectrum 6, as illustrated in Fig. 10b, exhibits a zeolite composition that is distinguished by elevated levels of Si (45.3 wt.%), Al (16.9 wt.%), and Ca (4.4 wt.%). The elevated Ca content, the absence of alkali elements, and a Si/Al ratio of ~2.7 suggest that the phase corresponds to a Ca-dominant heulandite, consistent with previously reported compositions for this zeolite type (Passaglia and Sheppard, Reference Passaglia and Sheppard2001; Deer et al., Reference Deer, Howie, Wise and Zussman2004). Spectrum 7 (Fig. 10c) corresponds to a radiating zeolite aggregate with Si (27.2 wt.%), Al (5.4 wt.%), Na (3.1 wt.%), and K (2.1 wt.%). The high Si/Al ratio (~5.0), low Al and Ca contents, and the radiating morphology support the identification of this phase as mordenite (Passaglia and Sheppard, Reference Passaglia and Sheppard2001). Spectrum 8, presented in Fig. 10d, reveals a zeolitic composition with Si (33.4 wt.%), Al (25.0 wt.%), and Ca (1.2 wt.%), corresponding to a low Si/Al ratio of ~1.3. This chemical signature, combined with the rose-like crystal habit observed in the image, supports the identification of this phase as Ca-rich chabazite (Passaglia and Sheppard, Reference Passaglia and Sheppard2001; Deer et al., Reference Deer, Howie, Wise and Zussman2004).

Figure 10. FE-SEM images and corresponding EDX spectra of altered phases from the Yukarıemirler quarry: (a) smectitized perlite with associated clay textures (Spectrum 5); (b) clinoptilolite crystal associated with cornflake-like montmorillonite (Spectrum 6); (c) radiating aggregate of mordenite crystals (Spectrum 7); (d) rose-like aggregate of tabular chabazite crystals (Spectrum 8).
Geochemical analyses
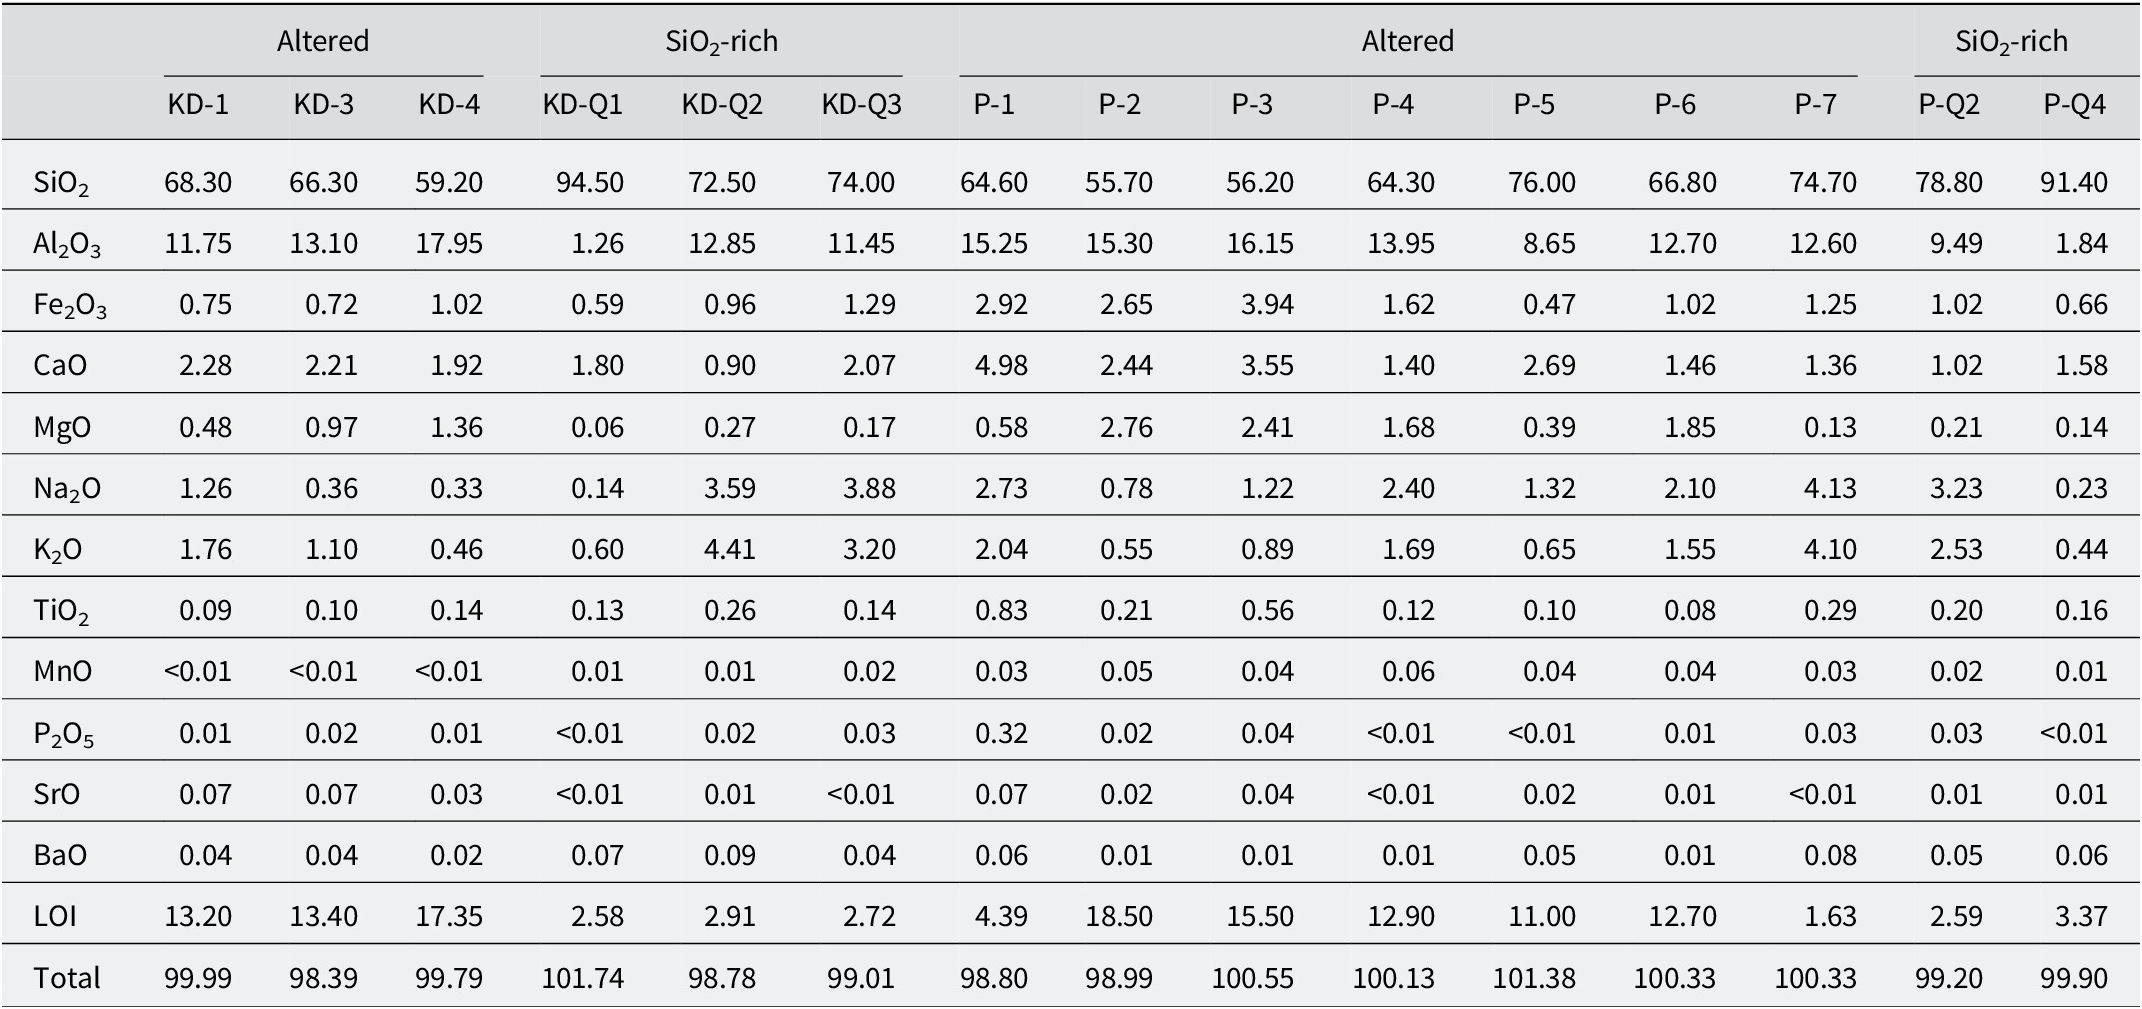
The major and trace element compositions of the samples collected from both quarries were compared (Tables 1, 2, S1, and S2). The SiO₂ content of the altered samples from the KD quarry ranged between 59.2 and 68.3 wt.%, whereas that of the YE quarry samples varied between 55.7 and 76.0 wt.%. The Fe₂O₃ content of the YE quarry samples was greater than that of the KD quarry samples, with respective ranges of 0.47–3.94 wt.% and 0.72–1.02 wt.%. The Al₂O₃ content of the KD quarry samples was slightly higher than that of the YE quarry samples, ranging from 11.75 to 17.95 wt.% and from 8.65 to 16.15 wt.%, respectively (Table 1). The CaO and MgO contents of the YE quarry samples (1.40–4.98 wt.% and 0.39–2.76 wt.%, respectively) were greater than those of the KD quarry samples (1.92–2.28 wt.% and 0.48–1.36 wt.%, respectively). Similarly, the Na₂O and K₂O contents of the YE quarry samples (0.78–2.73 wt.% and 0.55–2.04 wt.%, respectively) were greater than those of the KD quarry samples (0.33–1.26 wt.% and 0.46–1.76 wt.%, respectively). In contrast, the LOI (loss on ignition) values of the KD quarry samples (13.2–17.35 wt.%) were greater than those of the YE quarry samples (4.39–18.5 wt.%). Comparison of the Ba2+, Sr2+, and Zr4+ contents of the samples revealed that, except for the P-1 sample from the YE quarry, the KD quarry samples were richer in these elements than those from the YE quarry. Additionally, the Ce3+, Y3+, and La3+ concentrations were quite similar to each other (see Tables S1 and S2).
Table 1. Major oxide contents (wt.%) of altered rocks from the KD and YE quarries

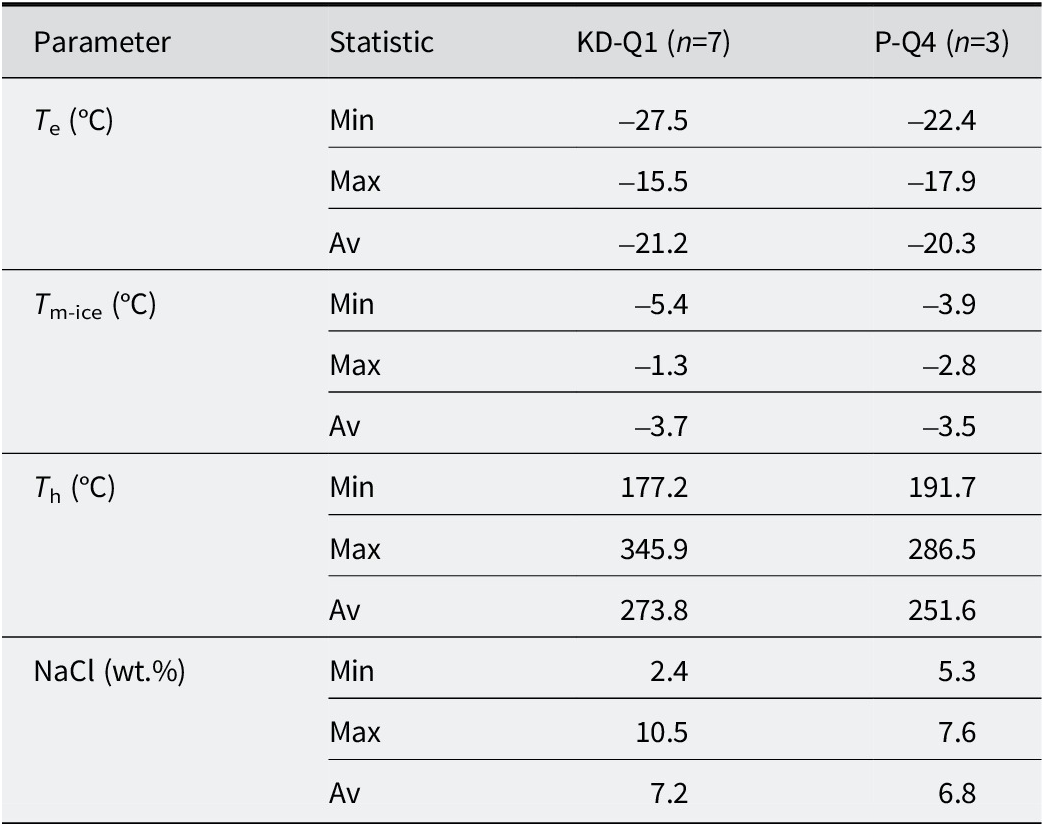
Table 2. Summary of the microthermometric data of quartz-hosted fluid inclusions from KD and YE

‘Q’ refers to samples that are rich in quartz; ‘SiO₂-rich’ indicates samples with high silica content, often associated with abundant secondary quartz identified in petrographic observations. Values reported as ‘<x’ indicate concentrations below the instrumental detection limit. LOI includes volatile components such as structurally bound water, CO₂, and organic matter; carbon was not measured separately. Trace and minor elements are reported in Figs S3 and S4.
The diagrams in Fig. S3 present trace-element variations associated with the alteration of pyroclastic units. In Fig. S3a,b, Zr4+ and Nb5+ concentrations show a decreasing trend with increasing SiO₂, particularly in samples displaying more advanced alteration. This trend may indicate the depletion of high field strength elements, potentially mobilized from volcanic glass or accessory phases during alteration (Reyes, Reference Reyes1990; Arslan et al., Reference Arslan, Abdioglu and Kadir2010). Figure S3 shows a decrease in the combined content of Al₂O₃+Fe₂O₃+TiO₂ with increasing SiO₂, suggesting the removal of mafic and oxide-bearing components in more altered samples. Similar trends have been reported in other bentonitized pyroclastic settings (Stoffregen, Reference Stoffregen1987; Arslan et al., Reference Arslan, Abdioglu and Kadir2010). In Fig. S3d, a positive correlation between Zr4+/Co2+ and Zr4+/Ni2+ ratios is observed. Although typical host phases such as olivine and pyroxene are absent, the distribution pattern of Ni2+ and Co2+ may reflect their presence in volcanic glass or fine-grained oxide phases. These elements may have been partially mobilized under hydrothermal conditions and retained in secondary products such as smectite, Fe-oxides, or poorly crystalline clays (Simpson et al., Reference Simpson, Osinski, Longstaffe, Schmieder and Kring2020; Özdamar et al., Reference Özdamar, Ece, Uz, Boylu, Ercan and Yanik2014). Overall, the trends in Fig. 9 indicate systematic elemental changes associated with progressive alteration of the pyroclastic units.
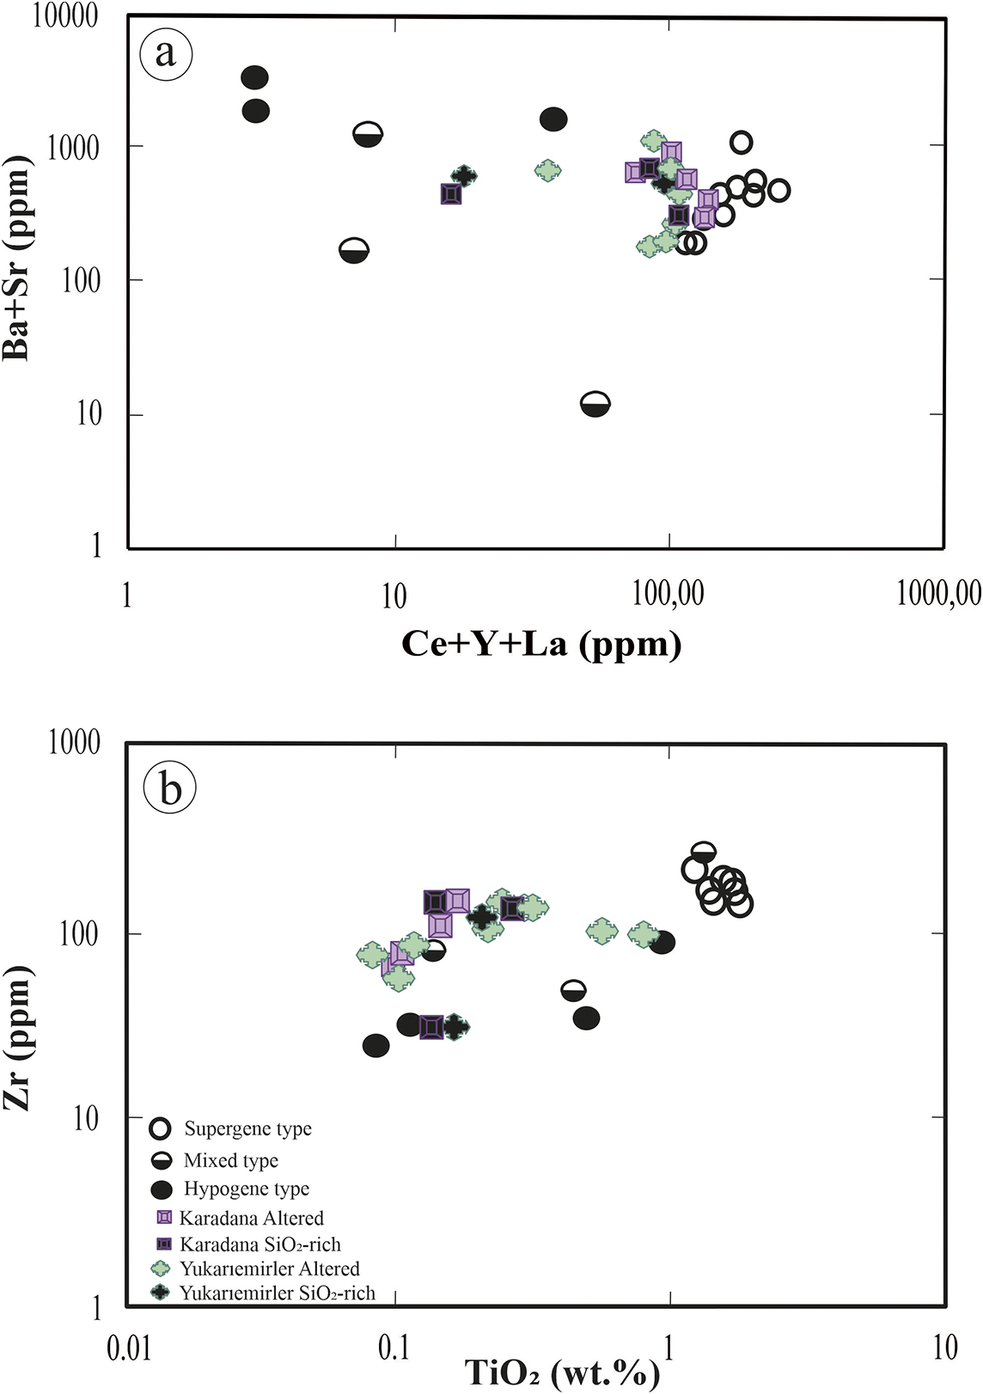
The KD quarry samples exhibited intermediate Ba2++Sr2+ concentrations that exceeded 1000 ppm, accompanied by low Ce3++Y3++La3+ concentrations (~100 ppm), which were depleted relative to average upper continental crust (UCC) values (Taylor and McLennan, Reference Taylor and McLennan1985) (Fig. 11a). The geochemical characteristics exhibited by the Karadana samples from the graphic indicated a supergene formation environment. To understand the supergene influence better, a Zr4+ vs TiO₂ binary diagram was utilized (MacLean and Barrett, Reference MacLean and Barrett1993). The KD quarry samples were characterized by intermediate Zr4+ and low TiO₂ content, which supports the interpretation of a mixed-type formation environment by integrating both alteration-related and lithological signals. In contrast, except for one sample, the YE quarry samples had lower Ba2++Sr2+ concentrations compared with those from the KD quarry, while their Ce3++Y3++La3+ concentrations remained nearly identical and similarly depleted compared with UCC values (Taylor and McLennan, Reference Taylor and McLennan1985) (Fig. 11a). These chemical composition values indicated a supergene formation environment for the YE samples as well. Yukarıemiler samples were positioned in the Zr4+ vs TiO2 binary diagram (Fig. 11b) that suggested the presence of both supergene and mixed-type formation environments, reflecting the combined influence of overprinting alteration and partially preserved primary geochemical features, which is based on the wider range of TiO2 concentrations. Silica-rich (>90 wt.%) quarry samples indicated a mixed-type formation environment in both graphs (Fig. 11a,b), as they displayed element mobility patterns characteristic of supergene enrichment, along with immobile element trends suggestive of preserved hypogene input.

Figure 11. (a) Ce3++Y3++La3+ vs Ba2++Sr2+ plot showing the altered samples from the KD and YE quarries; (b) Zr4+ vs TiO₂ plot of the altered samples from the Karadana and Yukarıemirler quarries. Hollow, filled, and half-filled circles represent samples from the Peruvian kaolin deposit (Dill et al., Reference Dill, Bosse, Henning, Fricke and Ahrendt1997) and are shown for comparison.
Microthermometric measurements
Fluid inclusion studies were conducted on quartz minerals collected from fractures representing faults in both quarries (from P-Q4 and KD-Q1 samples; >90 wt.% SiO₂). The whole-rock chemical compositions of both samples are presented in Tables 1 and 2 and Figs S3 and S4. The classification of fluid inclusions followed the criteria established by Roedder (Reference Roedder1984) and Van den Kerkhof and Hein (Reference Van den Kerkhof and Hein2001), based on the petrographic analysis of fluid inclusions in quartz. A series of microthermometric measurements were performed on primary inclusions containing liquid (L) and vapor (V) at ambient temperature, known as a LV-type inclusions (see Fig. S4). In quartz samples from the KD and YE quarries, LV-type inclusions exhibited eutectic temperatures (T e, °C) ranging from –15.5 to –27.5°C and –17.9 to –22.4°C, respectively (Table 3) (Fig. S4). The final ice melting temperature (T m-ice, °C) values for LV-type inclusions in quartz samples from P-Q4 and KD-Q1 were determined to range between –5.4°C and –1.3°C and between –3.9°C and –2.8°C, respectively. The salinity of LV-type inclusions was expressed in wt.% NaCl equivalents, which were determined based on T m-ice data using the equation proposed by Bodnar (Reference Bodnar1993) and Yalçın and Canlı (Reference Yalçın and Canlı2023). As demonstrated in Table 2, the mineralization yielded a range of 2.4–10.55 wt.% NaCl for KD quarry and 5.34–7.64 wt.% NaCl for the YE quarry. The homogenization temperatures (T h, °C) varied from 177 to 346°C for the KD sample and from 192 to 287°C for the YE sample (Table 2).
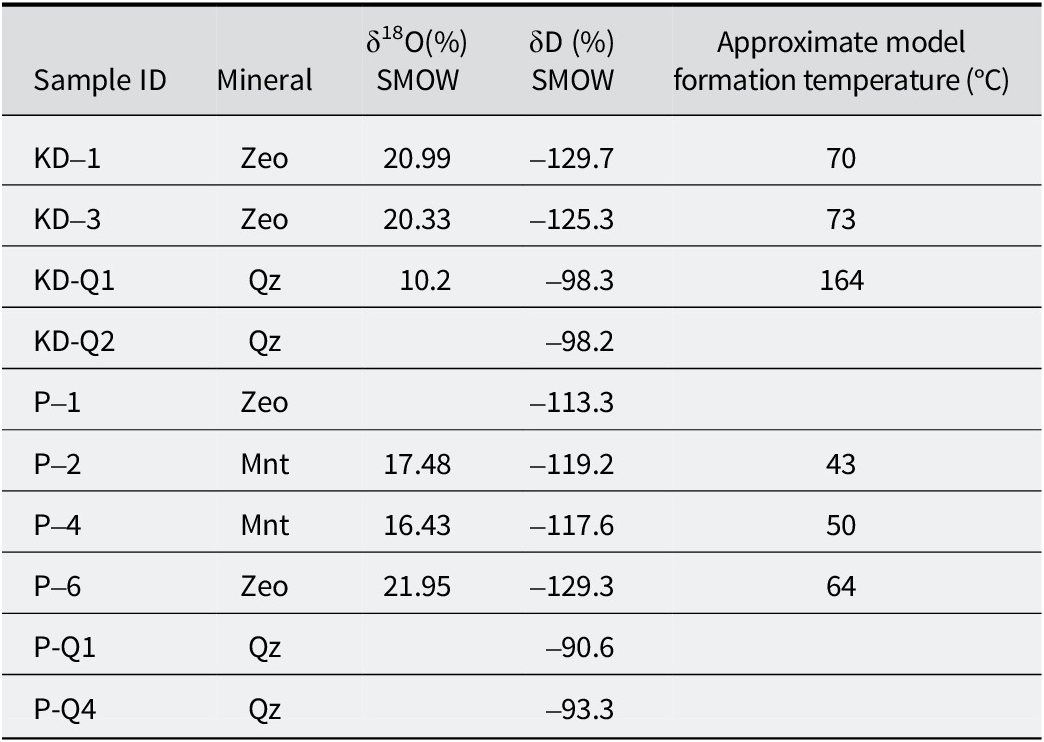
Table 3. δ18O and δD isotopic composition of smectite, zeolite, and quartz samples and calculated formation temperature, assuming that the δ18O value of meteoric water is –4.5% (value taken from Ercan et al., Reference Ercan, Ece, Schroeder and Karacik2016)

T e = final ice melting temperature (°C); T m-ice = first ice melting temperature (°C); T h = homogenization temperature (°C); wt.% NaCl = salinity (in equivalent NaCl weight per cent), calculated based on final ice melting temperature using the equation of Bodnar (Reference Bodnar1993).
Isotope geochemistry
Table 3 shows that the δ18O values ranged from +20.95 to +21.95‰ (SMOW) for zeolite, +16.42 to +17.48‰ (SMOW) for montmorillonite (from the YE quarry only), and +10.42‰ (SMOW) for the quartz sample (from the KD quarry only). The δD values ranged from –113.3 to –129.7‰ (SMOW) for zeolite, –117.6 to –119.2‰ (SMOW) for montmorillonite (from the YE quarry only), and –90.6 to –98.3‰ (SMOW) for the quartz sample.
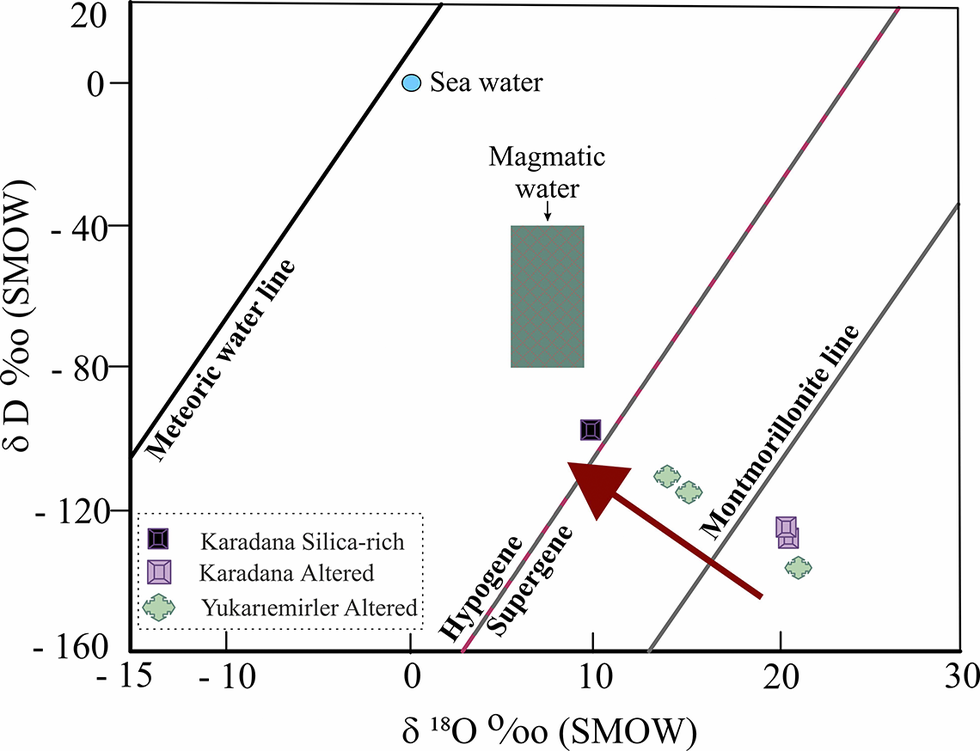
The δ18O and δD values of the YE and KD zeolite samples exhibited very similar isotopic compositions. However, the YE montmorillonite sample had depleted δ18O values and enriched δD values compared with the zeolite samples. In the present study, the equilibrium lines of altered minerals were compared at varying temperatures (ranging from 20°C to 100°C) with the supergene/hypogene line of Sheppard and Gilg (Reference Sheppard and Gilg1996) as depicted in Fig. 12. Analysis of the isotopic values indicated that the KD and YE clinoptilolite and montmorillonite were formed at lower temperatures, possibly under the influence of supergene water. The δ18O isotopic composition of the KD quarry quartz was more depleted compared with the other samples, and the δD isotopic values of quartz from the KD and YE quarries were more enriched relative to the altered samples. The quartz sample is located within the hypogene field along the supergene/hypogene line, and its presence may be indicative of the influence of magmatic water.

Figure 12. The plot of δD vs δ18O values of mineral and mineral-water equilibria for altered minerals. Compositions of smectite, zeolite, and silica rich in equilibrium with temperature (°C) are also given for comparison. The arrow indicates an isotopic fractionation trend for altered minerals. The δ18O and δD isotopic value ranges of the clay minerals are presented in conjunction with the meteoric water line (Craig, Reference Craig1961), the lines for supergene-hypogene origin (Sheppard et al., Reference Sheppard, Nielsen and Taylor1969), and for montmorillonite (Savin and Epstein, Reference Savin and Epstein1970).
However, if both deposits are assumed to have formed from waters with the same meteoric δ18O and δD isotopic compositions, as well as similar rock compositions and rock/water ratios in both quarries, then the formation temperature of altered minerals can be estimated using the isotopic fractionation factor equations of Sheppard and Gilg (Reference Sheppard and Gilg1996) for the montmorillonite, Zheng (Reference Zheng1993) for the quartz, and Karlsson and Clayton (Reference Karlsson and Clayton1990) for the clinoptilolite. These calculations assumed a meteoric water δ18O value of 4.5‰, as reported by Ercan et al. (Reference Ercan, Ece, Schroeder and Karacik2016) (Table 4) (Fig. 12).
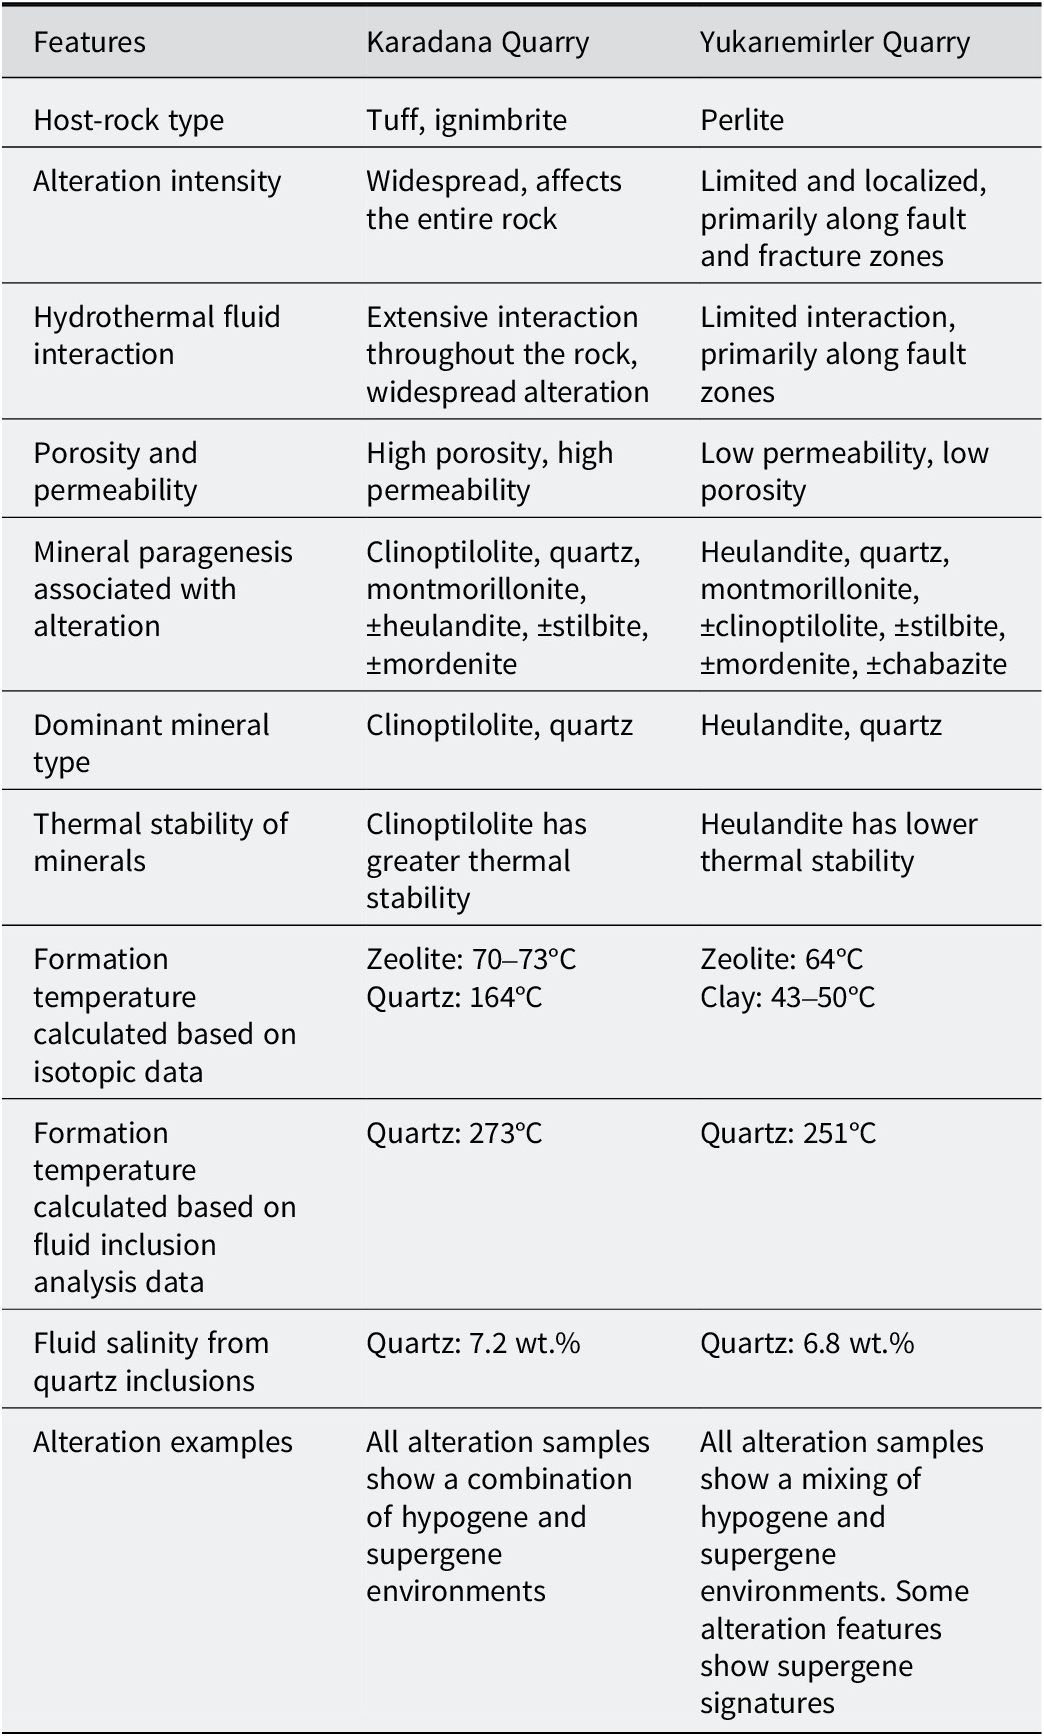
Table 4. Comparative petrographic, mineralogical, and hydrothermal characteristics of the YE and KD deposits

Discussion
The hydrothermal alteration of volcanic rocks in Ankara/Çubuk suggests that alkaline solutions played a crucial role in the alteration process, leading to the formation of quartz, montmorillonite, clinoptilolite, heulandite, stilbite, and mordenite. Volcanic rocks were widely observed in the study area, starting with the Sarıkoz Volcanic (Paleocene) and continuing with the Middle Eocene units of Kurtsivri, Sele, Ömercik, Susuz, and Yukarıemiler. These units consist of andesite, trachyandesite, basalt, dacite, rhyolite, and various pyroclastics, including slag, ignimbrite, and perlite (Fig. 1). The volcanic activity in the region is known to have ended with Middle Miocene olivine basalt and pyroclastics (Tankut et al., Reference Tankut, Dilek and Önen1998a, Reference Tankut, Güleç, Wılson, Toprak, Savaşçın and Akıman1998b; Dönmez et al., Reference Dönmez, Akçay, Türkecan, Evcimen, Atakay and Görmüş2009). The KD and YE quarries are located within the Susuz volcanic rocks. While the KD quarry is located within rocks defined as tuff and ignimbrite, the YE quarry is in perlite within the same volcanics (Figs 2 and 3) (Table 4). Samples in the previously studied area were identified as trachy-dacite and rhyolite (Bostancı, Reference Bostancı2014). Porous and fragmented rocks are highly susceptible to alteration due to factors such as glass composition, fine grain size, age, vigorous eruptive types, high permeability and high porosity (Pereira et al., Reference Pereira, Zanon, Fernandes, Pappalardo and Viveiros2024). These characteristics make them favorable for secondary mineral formation. Additionally, the extent of hydrothermal alteration varies significantly due to the inherent heterogeneity of these rocks and external conditions such as temperature and pressure (Lavallée and Kendrick, Reference Lavallée and Kendrick2021; Pereira et al., Reference Pereira, Zanon, Fernandes, Pappalardo and Viveiros2024). However, water–rock interactions are influenced by multiple parameters, including the composition of the penetrating solution, and pH, which plays a critical role in the alteration process (Cathelineau and Nieva, Reference Cathelineau and Nieva1985; de’Gennaro et al., Reference de’Gennaro, Incoronato, Mastrolorenzo, Adabbo and Spina1999; Ladygin et al., Reference Ladygin, Frolova and Rychagov2000; Ece et al., Reference Ece, Ekinci, Schroeder, Crowe and Esenli2013; Ercan et al., Reference Ercan, Ece, Schroeder and Karacik2016). Perlite is a glassy volcanic rock with a rhyolitic composition and has a greater water content than other pyroclastics. As a result of hydrothermal and diagenetic processes, perlite and pyroclastics release silica and aluminum by dissolving the glassy materials forming their composition under alkaline-chlorite solutions. In alkaline and medium-temperature conditions (50–200°C), dissolved components Si4+, Al3+, and alkali/alkaline earth metals cause both the formation of smectite and zeolite. The formation of smectites occurs at lower temperatures and neutral-alkaline pH conditions compared with zeolites (Singer and Stoffers, Reference Singer and Stoffers1980; Christidis, Reference Christidis1998; Chipera and Apps, Reference Chipera and Apps2001; Hay and Sheppard, Reference Hay and Sheppard2001; Sheppard and Hay, Reference Sheppard and Hay2001; Esenli et al., Reference Esenli, Şans, Erdoğan and Sirkecioğlu2023). Montmorillonite, clinoptilolite, mordenite, heulandite, ±stilbite, and ±chabazite occur in both quarries, along with α-quartz and opal-CT. In the KD quarry, alteration was homogeneously developed, with zeolites, clays, and quartz intergrown, forming a patchy texture in tones of pink/green (zeolite), white (montmorillonite), and light gray (opal-CT/Quartz) (Fig. 2). In the YE quarry, alteration was predominantly localized along NW–SE trending fault zones, where the formation of montmorillonite is particularly evident. In contrast, zeolite and clay minerals, often associated with opal-CT precipitation, are more intensely developed along the network of vein-like fractures. These fractures are typically lined with pink zeolite minerals, with montmorillonite occurring in intergrowth with zeolites (Fig. 3). This variation is attributed to differences in volcanic parent material, as the KD quarry is hosted within more highly porous and permeable tuff and ignimbrite, whereas the YE quarry has less permeable perlite. In the KD quarry, ascending hydrothermal fluids infiltrated the surrounding rocks deeply, resulting in widespread and homogeneous alteration. In contrast, fluid–rock interactions in the YE quarry were restricted to limited areas along fracture zones, leading to zeolite formation predominantly along fracture surfaces.
The alteration of glassy pyroclastics in the studied samples is interpreted as a low-temperature hydrothermal process, as evidenced by the coexistence of montmorillonite and zeolite phases identified through XRPD and SEM-EDS analyses (Figs 5–8). The primary source of Al3+ and Si4+ was the dissolution of volcanic glass and plagioclase feldspar, consistent with textural degradation and the release of network-forming elements. This breakdown can be described by the following generalized reaction, reflecting the release of Al3+ and Si4+ into the fluid phase through feldspar dissolution:
 $$ {\displaystyle \begin{array}{c}{\mathrm{Na}}_{0.5}{\mathrm{K}}_{0.5}{\mathrm{AlSi}}_3{\mathrm{O}}_8+8{\mathrm{H}}_2\mathrm{O}+{\mathrm{O}\mathrm{H}}^{-}\to \mathrm{Al}{{\left(\mathrm{OH}\right)}_4}^{-}\\ {}+3{\mathrm{H}}_4{{\mathrm{SiO}}_4}^0+0.5{\mathrm{Na}\mathrm{OH}}^0+0.5{\mathrm{K}\mathrm{OH}}^0.\end{array}} $$
However, under the inferred mildly alkaline conditions (pH <9), Al3+ solubility is expected to remain limited due to its amphoteric behavior and low complexation efficiency at these pH levels (Steefel and Van Cappellen, Reference Steefel and Van Cappellen1990; Sposito, Reference Sposito2008). Indeed, experimental studies show that Al3+ becomes significantly mobile only at pH >9, primarily as Al(OH)₄- (Möller et al., Reference Möller, Christov and Weare2006). Therefore, the formation of montmorillonite and zeolite probably resulted from solid-state transformation and short-range dissolution–reincorporation processes, where breakdown of volcanic glass and feldspar was followed by localized structural reorganization into secondary phases, rather than through long-range element transport and precipitation. The formation of montmorillonite, for instance, can proceed through reaction of released Si4+ and Al3+ with Mg2+ and alkali cations in solution, in association with the partial dissolution of mafic phases:
 $$ {\displaystyle \begin{array}{l}4{\mathrm{H}}_4{{\mathrm{Si}\mathrm{O}}_4}^0+\mathrm{Al}{{\left(\mathrm{OH}\right)}_4}^{-}+1.33{\mathrm{Mg}}^{2+}+0.33{\mathrm{Na}}^{+}\\ {}+2{\mathrm{O}\mathrm{H}}^{-}\to {\mathrm{Na}}_{0.33}\left({\mathrm{Mg}}_{1.33}\mathrm{Al}\right){\mathrm{Si}}_4{\mathrm{O}}_{10}{\left(\mathrm{OH}\right)}_2\times n{\mathrm{H}}_2\mathrm{O}\\ {}+\left(10\hbox{--} n\right){\mathrm{H}}_2\mathrm{O}.\end{array}} $$
Similarly, zeolitization, particularly clinoptilolite or heulandite formation, can be explained through gradual Al and Si incorporation into a tectosilicate framework, rather than direct precipitation. The generalized framework of clinoptilolite or heulandite-type zeolites can be represented by the following reaction, describing the reorganization of dissolved Al and Si species into tectosilicate structures stabilized by alkali and alkaline earth cations (modified after Chipera and Apps, Reference Chipera and Apps2001):
 $$ {\displaystyle \begin{array}{l}13{\mathrm{H}}_4{{\mathrm{Si}\mathrm{O}}_4}^0+\left(3+n\right)\mathrm{Al}{{\left(\mathrm{OH}\right)}_4}^{-}+\left(3-n\right)\left({\mathrm{Na}}^{+},{\mathrm{K}}^{+}\right)\\ {}+n{\mathrm{Ca}}^{2+}\to {\left(\mathrm{Na},\mathrm{K}\right)}_{3-n}{\mathrm{Ca}}_n\;{\mathrm{Al}}_3\left({\mathrm{Al}}_n{\mathrm{Si}}_{13-n}\right){\mathrm{O}}_{36}\\ {}\times 12{\mathrm{H}}_2\mathrm{O}+x{\mathrm{H}}_2\mathrm{O}.\end{array}} $$
These reactions do not represent simple precipitation from solution, but rather, multi-step transformations governed by the chemical evolution of hydrothermal fluids, precursor mineralogy, and local physicochemical conditions. The coexistence of smectite and zeolite underlines a sequential, possibly overlapping alteration regime, as also observed in previous studies of altered pyroclastic sequences (Utada, Reference Utada2001; Marantos et al., Reference Marantos, Christidis and Ulmanu2012).
The XRPD and FT-IR analyses were conducted on KD-3 and P-2 samples before and after heating to 580°C in order to identify zeolite phases and evaluate their thermal stability. The XRPD pattern of the KD-3 sample revealed distinct diffraction peaks at ~9.8, 22.4, 30.3, and 32.1°2θ, which are characteristic of clinoptilolite. These peaks remained partially preserved after heating, indicating that clinoptilolite in the KD-3 sample is relatively thermally stable. In contrast, the XRPD pattern of the P-2 sample displayed dominant peaks at ~9.9, 11.2, and 22.9°2θ, which are more representative of heulandite. Following thermal treatment, most of the diffraction peaks in the P-2 sample disappeared, suggesting a significant structural breakdown of heulandite upon heating (Fig. 5). Complementary FT-IR spectra supported these findings; both samples showed typical zeolitic bands at ~1020–1000 cm-1 (Si–O stretching), but the P-2 sample exhibited a marked loss of spectral features after heating, whereas KD-3 retained several absorption bands. These results confirm the presence of clinoptilolite in KD-3 and heulandite in P-2, and demonstrate the greater thermal resistance of clinoptilolite relative to heulandite (Breck, Reference Breck1974; Mumpton, Reference Mumpton1978; Sheppard and Gude, Reference Sheppard and Gude1980; Flanigen, Reference Flanigen1981; Singer and Berkgaut, Reference Singer and Berkgaut1995; Passaglia and Sheppard, Reference Passaglia and Sheppard2001).
In clinoptilolite, the exchangeable cations are typically dominated by sodium and potassium, which are more abundant than calcium (Fig. 9). This aligns with the mineralogical profile of clinoptilolite as outlined by Mason and Sand (Reference Mason and Sand1960). This is significant because it not only confirms the dominance of sodium and potassium in these samples but also provides a robust method for distinguishing clinoptilolite from other zeolite types with greater calcium content, such as heulandite. When considered in conjunction with the Si4+/Al3+ ratios and the Na++K+/Ca2+ comparisons, these observations serve to reinforce the classification of these samples as clinoptilolite or clinoptilolite-dominant zeolites. However, it is also important to consider the pervasive silicification observed in the study area, as this process may artificially elevate the Si4+/Al3+ ratios and influence the geochemical signatures of the zeolites.
In the KD quarry, clinoptilolite was predominantly observed as slender prismatic or rod-like crystals, while mordenite appeared in more spheroidal aggregates. In contrast, in the YE quarry, heulandite typically exhibited spheroidal to botryoidal morphologies, frequently coating smectite surfaces, whereas mordenite occurred mostly as spherical aggregates with distinct radial growth patterns. These morphological differences are attributed to the crystallization process, which is highly sensitive to environmental conditions and fluid chemistry (Passaglia and Sheppard, Reference Passaglia and Sheppard2001). For instance, in conditions of alkaline solution, rapid precipitation typically yields spherical or fibrous forms. Conversely, well-developed prismatic or orthorhombic crystals are commonly observed in slower precipitation and low supersaturation conditions. Furthermore, high alkalinity has been observed to be more conducive to the formation of amorphous or spherical structures, while in neutral or slightly alkaline conditions, well-formed crystals are typically evident. The role of temperature is also of significance in the development of crystal structures, and in the low-temperature range (50–100°C), spherical and fibrous structures are more commonly observed due to limited ion diffusion. By contrast, in the medium temperature range (100–200°C), crystal growth is more balanced, resulting in well-developed prismatic or orthorhombic forms. When clinoptilolite and heulandite grow on a mineral grain surface, the crystal shape changes according to the smoothness of the surface; spherical growth develops on irregular surfaces, while well-formed crystals develop on smooth surfaces (Mumpton, Reference Mumpton1978; Gottardi and Galli, Reference Gottardi and Galli1985; Colella, Reference Colella1996; Passaglia and Sheppard, Reference Passaglia and Sheppard2001). The model formation temperature range calculated from the isotopic values obtained from zeolites belonging to the study area varies between 64 and 73°C, and this low-temperature range appears to be suitable for the formation of spherical structures. Zeolite crystals are generally intertwined with randomly distributed clay minerals, and this irregular surface area supports the formation of spherical zeolites. Evaluation of all data collectively revealed that spherical zeolite, especially, formed rapidly from highly alkaline solution at low temperature.
In consideration of the XRPD, FE-SEM, and EDX data obtained from the smectites in the study area, the presence of dioctahedral montmorillonite has been confirmed. In parallel with the formation conditions of zeolites, the crystallization of montmorillonite is determined primarily by the dissolution of volcanic glass and feldspar-rich parent material. This process initiates the localized release of Si4+ and Al3+ species, which are incorporated into secondary mineral phases through in situ hydrothermal transformation, without involving long-range solute transport or direct chemical precipitation. Under such pH conditions, the mobility of Al is limited and occurs mainly in the form of Al(OH)₄-, the solubility of which is constrained unless the pH exceeds 9. Therefore, the formation of montmorillonite and zeolite group minerals is more plausibly explained by hydrothermal alteration involving coupled dissolution–recrystallization mechanisms within the rock matrix. Montmorillonite typically forms in alkaline to slightly alkaline environments with high water activity, thereby resulting in the development of its characteristic platy, flaky, and lamellar microstructure (Brindley and Brown, Reference Brindley and Brown1980; Moore and Reynolds, Reference Moore and Reynolds1997). Furthermore, the crystallization of montmorillonite is strongly influenced by environmental parameters such as alkalinity, temperature, and the availability of precursor chemical materials. The temperature range for model formation calculated for montmorillonite in the study area is between 43 and 50°C, indicating lower-temperature conditions compared with zeolite crystallization. At these temperatures, montmorillonite typically forms as fine-grained, flake aggregates rather than well-defined crystals, reflecting the slow kinetics of layer growth and limited ion diffusion (Velde, Reference Velde1995). Additionally, the presence of high alkalinity promotes the stabilization of smectite minerals by facilitating Si4+-Al3+ polymerization preferentially, thereby preventing the direct precipitation of kaolinite or other low-silica phyllosilicates (Garrels and Mackenzie, Reference Garrels and Mackenzie1967; Velde, Reference Velde1995). Micromorphological observations in the samples revealed that montmorillonite is intergrown with randomly distributed zeolite crystals (Figs 4 an 5), indicating that both mineral groups formed through localized dissolution–recrystallization processes within the same hydrothermal system. The irregular surfaces created by clay mineral deposition provided ideal nucleation sites for the spherical zeolite formations observed in the samples. This textural relationship suggests that montmorillonite formation occurred at the same time as zeolite crystallization, both of which were controlled by the alkaline geochemical conditions and the low-temperature hydrothermal environment. However, the presence of zeolite microcrystals on ball-shaped smectite aggregates in Fig. 6d suggests a sequential crystallization process. The slightly lower formation temperature of montmorillonite compared with that of zeolites indicates that montmorillonite probably formed first under relatively low-temperature conditions. As temperature and saturation levels increased, zeolite crystallization followed. The co-occurrence of montmorillonite and zeolites thus supports the hypothesis that both mineral phases formed through a common mineralization process, controlled by solution chemistry, thermal conditions, and surface morphology.
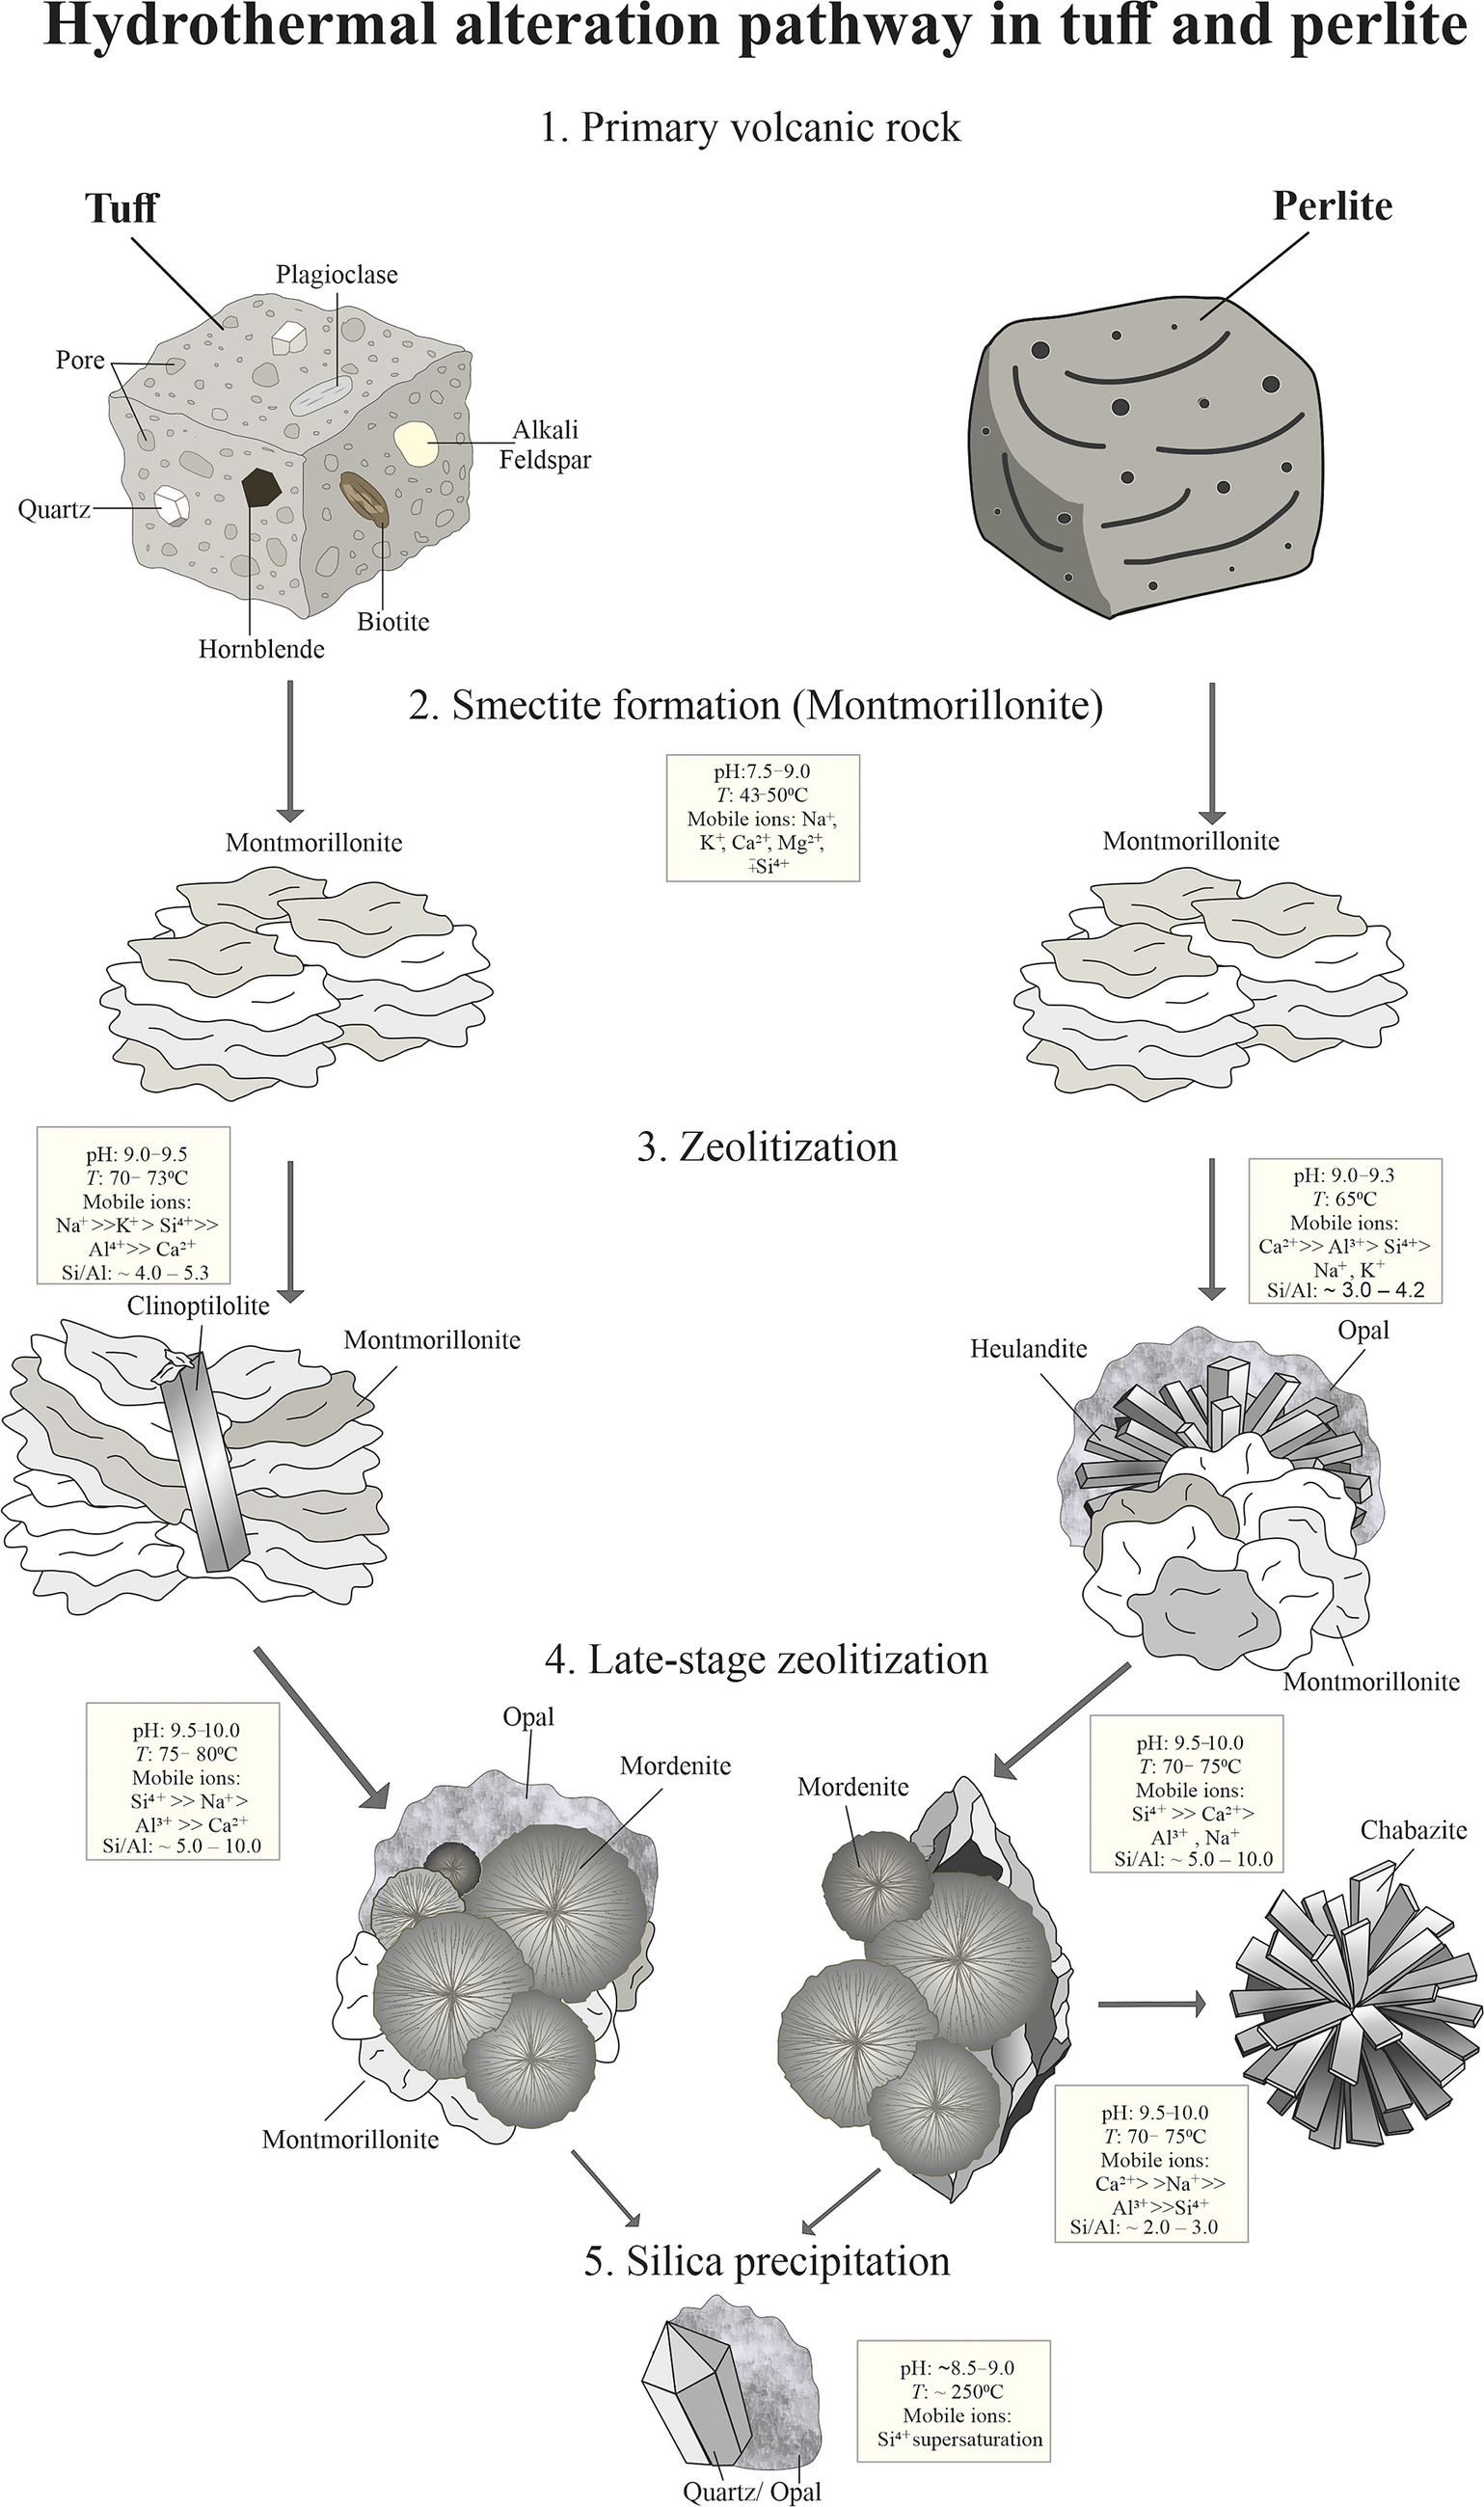
The hydrothermal evolution observed in the study area suggests a progressive alteration sequence from early-stage smectite formation to sequential zeolite crystallization under increasing pH and temperature conditions (Fig. 13). As illustrated in Fig. 13, the first stage of zeolitization is marked by the formation of clinoptilolite in the KD quarry and heulandite in the YE quarry, each displaying distinct elemental characteristics and morphologies. Clinoptilolite, detected in KD samples, occurs as rod-like or prismatic crystals and is characterized by greater Na++K+ content and elevated Si/Al ratios ranging from 4.0 to 5.3, indicating a more silica-rich and alkali-dominant crystallization environment (Chipera and Apps, Reference Chipera and Apps2001; Passaglia and Sheppard, Reference Passaglia and Sheppard2001). Conversely, the heulandite crystals in YE samples are Ca-rich and exhibit lower Si/Al ratios (~3.0–4.2), typically forming spheroidal to reniform aggregates that commonly coat earlier-formed smectite surfaces. These contrasting mineralogical signatures between KD and YE zeolites can be attributed to variations in hydrothermal fluid composition, pH, and fluid–rock interaction pathways. Specifically, the clinoptilolite-bearing system in KD probably reflects a more Na–K-rich, possibly supergene-influenced fluid regime, whereas the Ca-dominant heulandite in YE is consistent with deeper-sourced, hypogene fluids with limited alkali availability (Bish and Ming, Reference Bish and Ming2001; Utada, Reference Utada2001). The pH (9.0–9.5) and temperature conditions (~65–73°C) during this early zeolitization stage are notably higher than those inferred for smectite formation (43–50°C), supporting the idea of a thermally and chemically evolving hydrothermal system. Subsequent late-stage zeolitization is marked by the crystallization of mordenite and, locally, chabazite (Fig. 13). Mordenite occurs as radial or fan-shaped spherical aggregates with relatively high Si/Al ratios (5.0–10.0), forming in slightly more alkaline (pH 9.5–10.0) and hotter conditions (70–80°C). In addition, chabazite identified in certain samples exhibits a lower Si/Al ratio (2.0–3.0) and high Ca content, forming spheroidal to radial aggregates that typically fill pore spaces, reflecting a strongly Ca-enriched and high-pH environment. The compositional differences among these late-stage zeolites, particularly their alkali versus alkaline earth metal content, underscore the evolving fluid geochemistry and the increasing influence of temperature and saturation state on zeolite phase stability (Bish and Ming, Reference Bish and Ming2001; Chipera and Apps, Reference Chipera and Apps2001). Taken together, the mineral assemblages, ranging from montmorillonite to clinoptilolite, heulandite, mordenite, and chabazite, document a continuous pH and temperature gradient within the hydrothermal system. The sequential occurrence of these phases, each with distinct Si/Al ratios and cation compositions, highlights the importance of localized dissolution–recrystallization reactions in controlling zeolite paragenesis (Fig. 13). This transformation pathway, supported by micromorphological observations, confirms that zeolite diversity in the study area results not from a single event, but from a temporally and chemically evolving hydrothermal regime driven by increasing alkalinity, temperature, and the progressive breakdown of volcanic glass and feldspar.

Figure 13. Schematic model depicting the progressive hydrothermal alteration of Çubuk volcanics. Initial low-temperature, mildly alkaline conditions favor montmorillonite formation, followed by zeolitization marked by clinoptilolite and heulandite crystallization. Subsequent fluid evolution leads to higher-temperature, alkaline conditions that stabilize mordenite and chabazite. The sequence culminates in silica precipitation (opal, quartz) from Si4+-rich fluids during the final alteration stage.
In addition to smectite and zeolite formation, the Çubuk region is also rich in quartz, opal, and agate mineralization, reflecting a distinct pathway for silica (SiO₂) behavior within the alteration system. Unlike smectite and zeolites, which form through localized hydrothermal reactions involving alkali and alkaline earth elements, silica displays a dual-stage precipitation process controlled primarily by pH and temperature evolution. The initial stage involves the dissolution of glassy volcanic components by alkali-chloride-rich hydrothermal fluids (Kastner et al., Reference Kastner, Keene and Gieskes1977; Keith and Muffler, Reference Keith and Muffler1978; Williams et al., 1985), which generates silica-supersaturated solutions. Upon cooling or pH shift, these solutions precipitate amorphous opaline silica (opal-A), which progressively transforms into opal-CT and, eventually, microcrystalline quartz as diagenetic temperatures exceed ~100°C (Iler, Reference Iler1979). Opal typically forms under slightly acidic to alkaline conditions (pH 4–9), whereas quartz becomes stable at higher temperatures and near-neutral to mildly alkaline pH (Fournier and Rowe, Reference Fournier and Rowe1977; Rimstidt, Reference Rimstidt1997; Gunnarsson and Arnórsson, Reference Gunnarsson and Arnórsson2000). In samples from the present study, opal-CT is the dominant silica phase, particularly in reticulated morphologies lacking fluid inclusions. These probably represent low-pressure, near-surface precipitation from colloidal silica, consistent with earlier interpretations by Hatipoğlu et al. (Reference Hatipoğlu, Ajo and Kırıkoğlu2011). However, the present study indicated that some samples experienced significantly higher temperatures than previously proposed. Specifically, the temperature range calculated from fluid inclusions in quartz samples from fault zones reaches 251–273°C, with an oxygen isotope-based estimate yielding ~164°C (Table 4). These data suggest a second stage of quartz precipitation under deeper, hotter conditions, most likely along fractures where focused fluid flow promoted crystallization. The silica phase observed, including both opal and microcrystalline quartz, is thus interpreted as a late-stage hydrothermal product, marking the final step of the alteration sequence (Fig. 13). This phase follows the depletion of major cations during earlier smectite and zeolite formation, resulting in the accumulation and eventual precipitation of Si4+ from supersaturated fluids. The final crystallization occurred under increasing temperature (>75°C) but declining pH, in contrast to the mildly alkaline conditions that favored earlier secondary phases (Gislason and Eugster, Reference Gislason and Eugster1987; Heaney, Reference Heaney1993; Bish and Ming, Reference Bish and Ming2001; Chipera and Apps, Reference Chipera and Apps2001). Altogether, these findings support a biphasic silica mineralization model: early opaline precipitation from colloidal solutions under shallow, alkaline conditions, and later quartz formation in structurally focused, hotter regimes. This paragenetic pattern reinforces the notion of a dynamic, multi-stage hydrothermal system evolving over time with changing fluid composition and thermodynamic conditions.
In addition to bulk geochemical indicators pointing to advanced alteration processes, microscale mineral chemistry provides further insight into the nature and origin of the alteration fluids. Notably, EDX data obtained from zeolite phases support and refine the distinction between alteration regimes observed at the KD and YE quarries. Elemental compositions reveal that clinoptilolite crystals in KD samples are enriched in Na+ and K+, while heulandite crystals in YE samples show high Ca content and lower alkali levels. These micro-scale compositional differences align with the inferred Na-K-rich compositions of supergene fluids in Karadana and Ca-rich hypogene fluids in Yukarıemirler, providing mineral-scale confirmation of the bulk geochemical trends. Furthermore, several YE samples plotted near the hypogene–supergene boundary on the (Ba2++Sr2+)–(Ce3++Y3++La3+) diagram, consistent with a mixed-type field. This is further corroborated by the presence of quartz with fluid inclusions and elevated formation temperatures in YE samples, implying minor but significant hypogene fluid contributions. Altogether, these integrated mineralogical and geochemical data provide robust evidence for distinct alteration regimes between the KD and YE sites, shaped by differing fluid sources, fluid–rock interaction depths, and thermal histories. These distinctions in fluid chemistry and mineral paragenesis between the KD and YE sites, as revealed by both bulk geochemical and EDX data, are further corroborated by stable isotope signatures.
Zeolites exhibit significant δ18O enrichment (up to +20.99‰), consistent with a supergene origin (Sheppard et al., Reference Sheppard, Nielsen and Taylor1969). However, although the δ18O enrichment in montmorillonite is slightly less than in zeolite, it indicates a supergene environment in the clays (average +16‰ to +17‰) (Savin and Epstein, Reference Savin and Epstein1970). Although clays and zeolites often form under similar environmental conditions, the slightly lower δ18O enrichment observed in clays (average +16‰ to +17‰) relative to zeolites (up to +20.99‰) suggests that clays probably formed earlier, under lower-temperature conditions. The model formation temperature data derived from isotopic measurements are also quite compatible with the results mentioned above. Moreover, The δD depletion observed in zeolites and clays aligns with this conclusion, as it reflects a supergene alteration environment that favors lighter isotopes (Sheppard et al., Reference Sheppard, Nielsen and Taylor1969). On the other hand, quartz samples, with a δ18O isotopic value of +10.2‰, are much closer to the hypogene area, as reflected by their more moderate deuterium depletion. δ18O isotopic values of quartz support that quartz is affected by hypogene formation conditions as well as supergene formation conditions compared with clay and zeolites.
Summary and conclusions
The present study examined the hydrothermal alteration processes affecting volcanic rocks in the Çubuk region (Ankara), focusing on two quarries, Karadana (KD) and Yukarıemirler (YE), that are spatially close and hosted within the same volcanic sequence. The comparative analysis of these two adjacent sites revealed that variations in host-rock lithology (tuff–ignimbrite vs perlite) and permeability influenced the style, intensity, and spatial distribution of hydrothermal alteration. Moreover, these volcanic units represent the final stages of regional volcanic activity, making them particularly valuable for reconstructing the late-stage evolution of hydrothermal systems.
The alteration history reconstructed from mineralogical, geochemical, and isotopic data revealed a stepwise evolution of the hydrothermal system, marked by distinct mineral assemblages and shifting fluid conditions over time:
-
• In the early phase of alteration, dioctahedral montmorillonite crystallized under low-temperature, mildly alkaline conditions. This stage reflects the initial interaction between volcanic glass and hydrothermal fluids enriched in alkali and alkaline earth elements (Fig. 13).
-
• As alteration advanced, increasing pH and temperature promoted zeolite crystallization. In KD, Na+- and K+-rich clinoptilolite formed, whereas in YE, Ca-rich heulandite developed closely intergrown with pre-existing montmorillonite (Fig. 13). These mineralogical differences reflect distinct fluid sources: Na-K-rich supergene fluids in KD and Ca-rich hypogene fluids in YE, as also supported by isotopic and geochemical signatures.
-
• Following zeolite formation, continued alteration under slightly higher temperatures and more alkaline conditions (pH 9.5–10.0) led to the development of late-stage zeolites. Mordenite crystallized as fibrous to radial aggregates with high Si/Al ratios, while localized occurrences of Ca-rich chabazite reflect episodic fluid input with distinct geochemical signatures. These phases commonly overprint earlier zeolites and clays, marking the final zeolitization stage prior to silica saturation.
-
• In the final stage, silica-rich fluids, generated through prolonged water–rock interaction and cation depletion, precipitated opal-CT and microcrystalline quartz.
This stepwise evolution model offers critical insight into the late-stage hydrothermal history of Central Anatolia’s volcanic systems and underscores the importance of integrating mineralogical, geochemical, and structural data to unravel complex alteration processes in felsic volcanic environments.
Supplementary material
The supplementary material for this article can be found at: http://doi.org/10.1017/cmn.2025.10015.
Author contributions
Dr. Hatice Unal Ercan was responsible for the field investigations, preparation of the geological map, and mineralogical and geochemical characterization of the samples. Prof. Paul A. Schroeder supervised and contributed to the isotopic analyses and their interpretation. Dr. Gulin Gencoğlu Korkmaz contributed to the compilation of the regional geological framework. Prof. Omer Işık Ece provided expertise in the characterization of clay minerals. Prof. Emin Ciftci contributed to the inclusion analysis and interpretation.
Acknowledgements
The authors acknowledge the invaluable fieldwork contributions of Geological Engineer İlkay Şah, whose support was instrumental in the successful completion of the field studies for this research. The authors are also grateful to Gamze Şenyıl for her patient and dedicated assistance during the FE-SEM analyses. The authors thank the editor and reviewers for their constructive comments and suggestions, which greatly improved the quality of this manuscript.
Financial support
This research received no specific grant from any funding agency, commercial, or not-for-profit sectors.
Competing interests
The authors declare none.
Data availability statement
All data supporting the findings of this study are included within the article and its supplementary materials.


 Open access