


Introduction
The digital age is transforming political science through advancements in data practices and our data ecosystem. By “data ecosystem,” I refer to the collection of tools, procedures, institutions, and services we use to handle empirical observations, including conventional datasets, text-as-data, and social media feeds. These changes can be disorienting, given the rapid pace of development and the challenges of staying technologically current.
Some changes arise with little friction. For instance, it is now common for country-level datasets to follow an ISO standard (2020) to identify countries. Similarly, platforms like ORCID, DOI, and Google Scholar have streamlined our professional environments, often with little need for us to understand their underlying frameworks. However, we also encounter complex, jargon-heavy discussions about new data requirements, which can be challenging as they involve unfamiliar technical knowledge.
As individuals and a community, it will be beneficial to build some awareness and capabilities needed to navigate upcoming data opportunities and challenges. In this paper, I argue that we are experiencing the early stages of a new “data revolution” in our data practices. As early as the 1990s, scientists and engineers foresaw that the sheer volume and variety of data would exceed human processing capacity, necessitating machine assistance (Kahn and Wilensky 1995). One 2016 survey of data scientists found that they spend on average nearly 80% of their time on data preparation, leaving only one day per week for science (CrowdFlower 2016). A major step toward addressing these issues was the 2016 publication of the FAIR data principles (Wilkinson et al. Reference Wilkinson and Dumontier2016), which promote practices to make data that is Findable, Accessible, Interoperable, and Reusable by both humans and machines. A 2018 report by the European Commission found that the annual cost of not having FAIR research data in the Europe Union was €11.4 billion (European Commission 2018).
Currently, data in the social sciences generally fall short of FAIR data principles. Although human actors can often find, link, archive, and manage multiple data resources by using their own subtle judgements about the data, the process is slow and tedious. Our computers are not reliable assistants for these tasks because our data usually lack standardization and harmonization across the ecosystem. One exception is the use of standardized country identifiers, which facilitates data linking across sources. For computers to assist effectively, data must be standardized and organized within defined knowledge schemas that enable machine navigation across our vast data ecosystem.
Gavin Mendel-Gleason, CEO of VectorLink,Footnote 1 underscores the importance of data integration: “distributed, interoperable, well-defined data is literally the most central problem for the current and near future human economy. Knowledge is power, and distributed, actional knowledge, creates opportunities and efficiencies impossible without it” (2022). These emerging data ecosystems call for human oversight and design, but will be structured for computer processing.
What is an ecosystem of FAIR, linked, and open data? As Mendel-Gleason suggests, it is an aspirational world where our data resources and practices are transparent, replicable, accessible, and productive. This objective aligns with the broader “open science” movement, which spans multiple fields and includes elements such as open access.
To understand the coming transformation, it can be useful to apply a model to our present circumstances and explore how our discipline can adapt. This paper addresses political science’s efforts to develop a FAIR, linked, and open data ecosystem, including integration with other social science domains, and with communities of policy and practice outside the academy. It frames this transformation as an “innovation cascade,” with advancements arising from new connections to faraway knowledge domains, as through new scientific infrastructures like the one proposed by Monitoring Electoral Democracy (MEDem) (Boomgaarden et al. 2025), the involvement of experts such as those in the FAIR data communities (Meyers 2025), and the evolution of ethical and legal standards (Döring forthcoming).Footnote 2
I organize this paper around a network theory of innovation within a complex technology space, using a computational model of innovation cascades to illustrate and clarify the unique dynamics of the current moment in political science. Silverberg and Verspagen conceptualize innovation as “a concatenation of many sub-innovations spread out over time,” using the evolution of the bicycle as an example (Reference Silverberg and Verspagen2005, 1 emphasis added). Consider the propulsion sub-system of a bicycle: the modern bicycle evolved through a series of sub-innovations, from the original foot-powered design in 1818, to the concatenation of chain, gear, and pedal technology in 1885, and eventually to the incorporation of the electric battery. Each represented a performance advancement; however, notice that innovation does not always follow a linear path: The modern “balance bike” adopts an old technology for the distinctive purpose of teaching young children how to ride. In a similar fashion, this paper will theorize about the transformation of political science data technologies and practices as a series of “concatenations” of new capabilities that make our research and translational work more efficient, impactful, and productive.
The remainder of this paper unfolds in three stages. First, I motivate the paper by describing the current state of data ecosystems and practices in political science. Next, I develop a theoretical model of innovation, highlighting two insights relevant to data practices: Innovation often arises from combining existing practice with novelty from distant fields, and this can lead to sudden change. Finally, I apply these insights to political science data ecosystems, examining how political, information, and computer sciences are converging to shape the early twenty-first century as a transformative era for data and research production.
Properties of innovation
Political science is experiencing significant changes and challenges related to data, reflecting the emergence of new data ecosystems and practices within the field. This discussion explores these shifts through four general properties of innovation, with a particular focus on the third and fourth properties. The framework represents a synthesis and interpretation of previous research on innovation diffusion (e.g., Silverberg and Verspagen Reference Silverberg and Verspagen2005; Frenken Reference Frenken2006), applied here to political science data and practices as the primary “domain.” The four properties are:
Property1: Innovation can arise from within the field.
Property 2: Innovation can arise from external contributions.
Property 3 Innovation can arise through intentional cross-disciplinary collaboration.
Property 4: Innovation can be disruptive to norms, practices, and technologies.
Property 1: Innovation can arise from within the field
A natural source of innovation in political science is internal investment, where scholars and institutions cast their gaze around their nearby knowledge neighborhood to create new data systems and practices that address specific disciplinary needs. These innovations often serve as targeted “research and development” projects and align with advances in theory, measurement, research design, and modeling.
For example, the need to accumulate comparative district-level electoral data dates back to at least the publication of Duverger’s law (Duverger Reference Duverger1954). In one response to this need, Singer compiled resources to support research using these data (Singer 2004; Reference Singer2013). Later, a different group of scholars established the more comprehensive Constituency-level Elections Archive (Kollman et al. 2014). Similarly, initiatives like Party Facts (Döring and Regel Reference Döring and Regel2019), Varieties of Democracy (Coppedge et al. Reference Coppedge, Gerring, Altman, Bernhard, Fish, Hicken and Kroenig2011), and the Comparative Study of Electoral Systems (2024) represent data innovations by political scientists. These and dozens of other initiatives are the hard-won results of efforts by members of our disciplinary community to assemble and disseminate political data for scholarly and public use.
These internal efforts underscore the field’s agency and expertise in advancing data ecosystems. Nevertheless, challenges remain. The process of innovation in data and data practices is often complex and contested, with disagreement about concept definitions and operationalizations, with varying ontologies and epistomologies about the political world, and with different kinds of data. As a community, we have difficult work ahead, though there is good reason to believe that we will have many more valuable advances.
Property 2: innovation can arise from external contributions
Political science has also benefited significantly from data innovations originating outside the discipline. Traditional fields like library science have long addressed data challenges for scholars, while digital age advancements have further enriched our data practices. For instance, the Open Researcher and Contributor ID (ORCID) organization created a system to resolve author name ambiguities through unique identifiers (“About ORCID,” n.d.). The organization includes thousands of members worldwide, including The Academy of Fine Arts in Vienna, The American Psychological Association, and El Sevier; political scientists enjoy the benefits even though political science organizations have not been involved.
The DOI Foundation is another non-profit organization which has assumed the role of uniquely and persistently identifying “things,” including academic publications and datasets. Their digital object identifiers enhance data tracking and citation practices. Other capabilities come from the ISO, Google (such as Scholar and Dataset Search), and the Wikimedia Foundation. These external contributions exemplify how innovations from other fields can create coherence and efficiency in our data and data practices, even when political scientists are not directly involved in their development.
Property 3: Innovation can arise through intentional cross-disciplinary collaboration
Innovation also arises when political science engages in intentional cross-disciplinary collaboration, combining technologies or practices from unrelated fields with those in our own. The U.S. National Science Foundation’s “Convergence Accelerator” program acknowledges this mechanism of innovation by supporting work that merges ideas and technologies across disciplinary boundaries (“Convergence Accelerator,” n.d.). It differs from property #2 in that we are co-creators of the innovation, cooperating with colleagues from “far away.”
Political science has sometimes operated in this way, as, for example, by helping establish data resources like the Qualitative Data Repository, ICPSR, the Dataverse Project, GESIS, and FORS. These initiatives span the social sciences and integrate expertise from computer and information sciences. Collaboration enables the development of robust archives and data services, which would be impossible to develop alone. Also, many political and social scientists have integrated digital age advances in computing, statistics, and research design (King Reference King and Michael Alvarez2016; Salganik Reference Salganik2018; Hofman et al. Reference Hofman, Watts, Athey, Garip, Griffiths, Kleinberg and Margetts2021; Nelson Reference Nelson2020).
Nevertheless, we seem to have neglected many data-centric advances. Over a decade ago, Schedler called for collective responses to data coordination failures. “…The provision of cross-national political data has been suffering from far-reaching market failures as well as regulatory failures. These failures of private coordination are systemic failures, not private ones. They call out for public solutions…”(Reference Schedler2012, 258). He envisioned a role for professional associations and international organizations. Some new investments that address these challenges are currently underway (for example, MEDem), though they are in their infancy when compared to other scholarly communities.
I will highlight two examples of data capabilities which we have been slow to adopt. Technologically, relational data models and databases are a mature and widely available capability that could enhance data linking and integration (Van der Eijk and Sapir Reference Van der Eijk and Sapir2010; Mustillo and Springer Reference Mustillo and Springer2015). Yet, they are rarely used in political science. Van der Eijk and Sapir note “In principle, many separate datasets can be linked in ways that would allow important research questions to be addressed in more powerful ways than analyzing each of these resources separately. If these separate datasets relate to the same real-world objects, such as countries, political parties, media outlets, and the like, they can be seen as component parts of relational databases (RDBs). The methodology of RDBs is well developed… Moreover, RDB software is widely available. Why, then, do we see so very few efforts of integrating or linking different datasets?” (Reference Van der Eijk and Sapir2010, 20). Notable exceptions include ParlGov (Döring and Manow 2012) and a recent book by Weidmann (Reference Weidmann2023). Through collaboration with experts who work with this capability, we would be able to integrate the innovation into our field and enjoy the benefits of its use.
The FAIR data principles represent another cross-disciplinary innovation (Wilkinson et al. Reference Wilkinson and Dumontier2016). Developed by 53 authors across the fields of life and information sciences, the FAIR principles pose challenges for political science (Eder and Jedinger Reference Eder and Jedinger2019; Dyrstad and Moses Reference Dyrstad and Moses2023). Unlike technologies like ORCID or DOI, which are ready-made capabilities that integrate smoothly, the FAIR principles rely upon the user communities to translate the principles into practice, making it an innovation domain that calls for collaboration bridging political science and experts that are relatively far from our field.
Additionally, ethical and legal considerations around data are increasingly relevant to political science and will call for interdisciplinary collaboration to navigate these complex issues.
Property 4: innovation can be disruptive to norms, practices, and technologies
The scholarship on innovation and science shows that progress often proceeds incrementally, punctuated by dramatic shifts, or “tipping points.” Tips are known to arise in complex innovation domains—like bicycle technology and data systems—where accumulating and linking (or “concatenating”) advancements from different knowledge domains can lead to sudden, transformative change. In political science, the “behavioral revolution” is an example of such a tipping point because it integrated ideas and capabilities that quickly gave rise to an entirely new way of studying politics.
At around the moment of a tip, an innovation can seem inevitable. Indeed, historians of science have shown that new discoveries frequently arise simultaneously and independently. In one well-known case, non-Euclidean geometry was discovered by at least three people in the early nineteenth century (Gray Reference Gray2004). The father of one of the innovators urged his son to publish his work promptly, saying “…It seems to be true that many things have, as it were, an epoch in which they are discovered in several places simultaneously, just as the violets appear on all sides in springtime” (Wolfe 2012, 45).Footnote 3
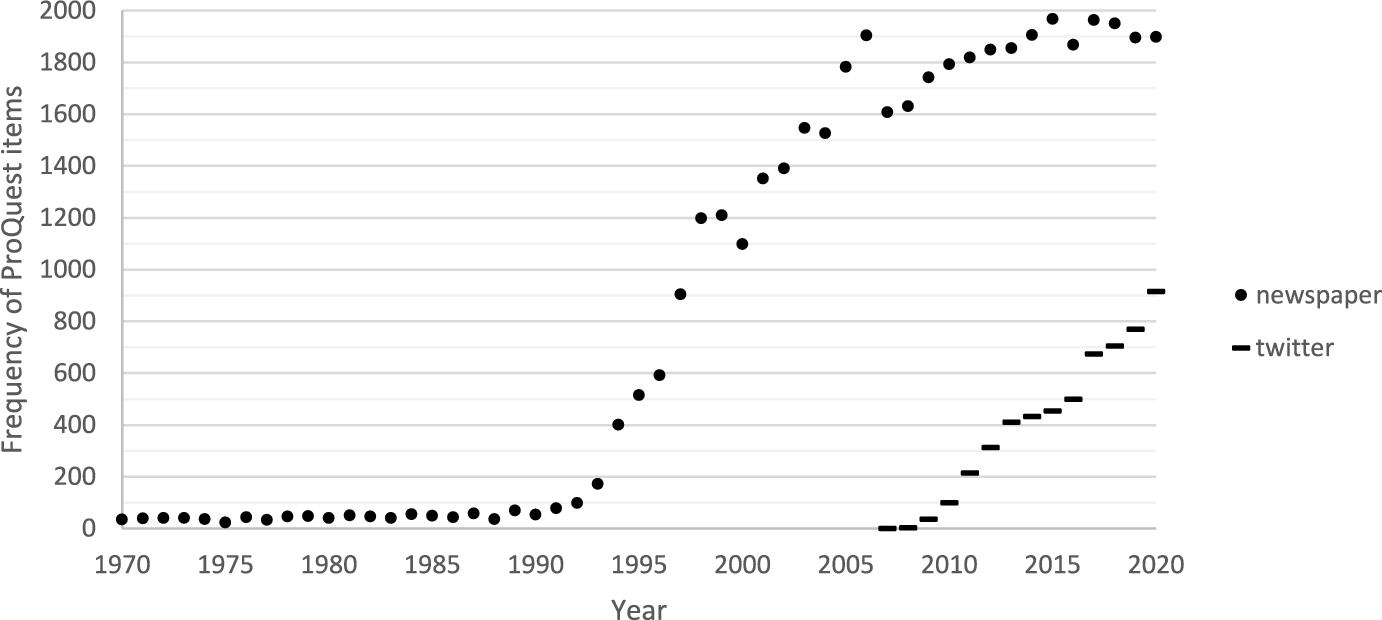
Digital age transformations have created paradigmatic changes to the practice of science. Today, new forms of data, such as social media feeds and digital archives, provide unprecedented data volume. Figure 1 illustrates this change with a plot of annual “Twitter” mentions in ProQuest’s collection of political science scholarship, showing a surge in mentions from 2006, alongside “newspaper” mentions, which spiked in the 1990s. These tips represent the quick integration of digital resources by political scientists; Twitter was founded in March 2006, and digital news archives first arose in the early 1990s.

Fig. 1 Frequency of Items with “Newspaper” and “Twitter” in scholarly political science
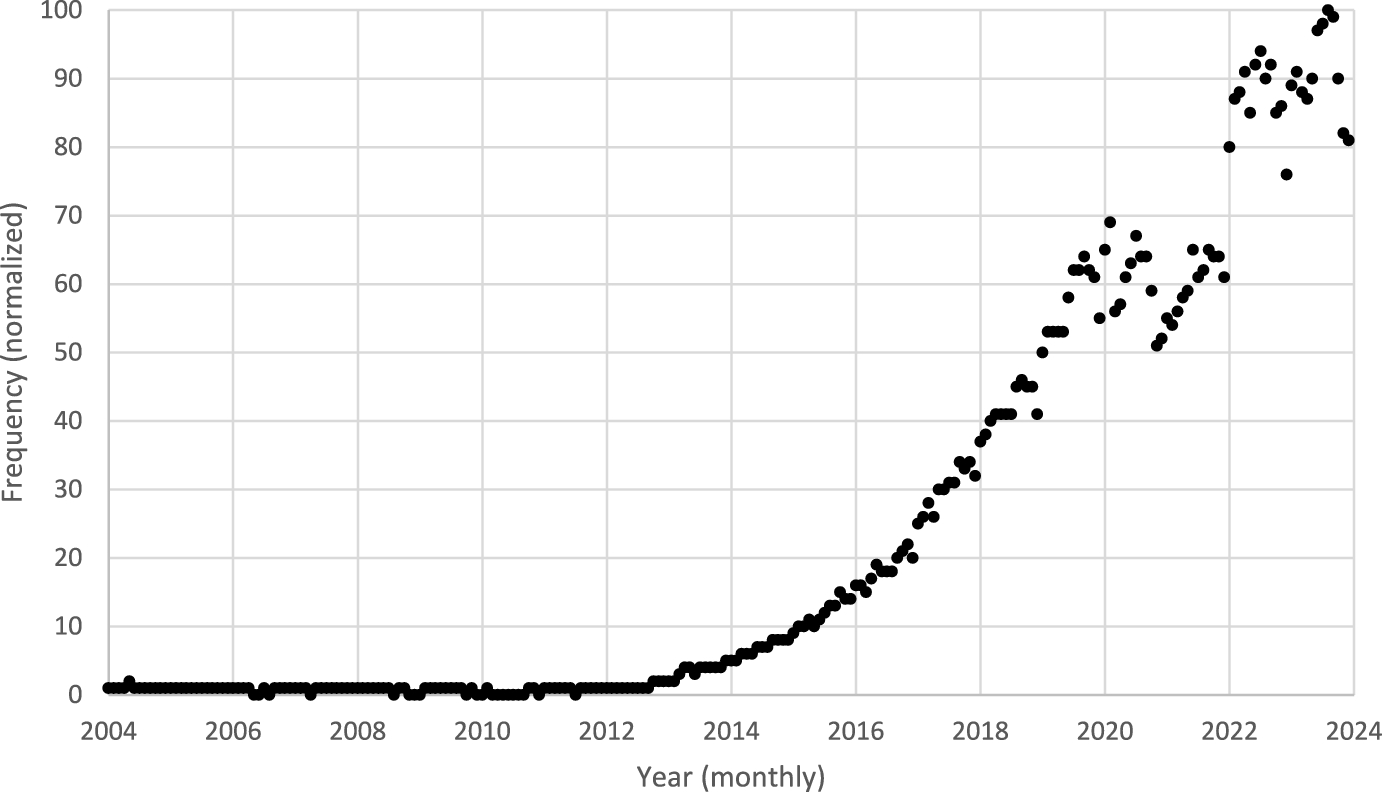
Figure 2 shows the frequency of the search term “data science” according to Google Trends. It mirrors the rise of a new field borne of the convergence of computational, statistical, and disciplinary applications. Of course, prior to the 2010s, many political scientists were practitioners of what we now call data science; the behavioral revolution was a data science revolution that took advantage of early advances in computing and the statistical sciences. However, beginning about 10 years ago, this convergence had reached such a scope and intensity that the field acquired a name, and its practices and tools began penetrating farther into the discipline.

Fig. 2 Normalized frequency of worldwide google search for “Data Science” as a field of study
These simple examples illustrate how digital age transformations create nonlinear innovation cascades, and how sharply they might transform our data and data practices. While established technologies like relational databases await widespread adoption, emerging tools like generative AI and AI agents will become increasingly available.
I close this section by highlighting the role of computer science ontologies and knowledge graphs, which are currently relatively underappreciated, but likely to generate radical changes to our practice. Ontologies and graphs are structured knowledge frameworks using a formally defined language. They organize domain concepts and observations for machine readability. Wikidata is an example of a knowledge graph. Political scientists have not been active at Wikidata, and so its representation of political knowledge does not generally conform to disciplinary practice.Footnote 4 By contrast, other scientific communities, including the life sciences, are active there and use the resource to accelerate discovery (Waagmeester et al. Reference Waagmeester, Stupp, Burgstaller-Muehlbacher, Good, Griffith, Griffith and Hanspers2020). Beyond public resources like this, disciplinary communities often build their own custom-made ontologies and knowledge graphs to represent their domains. Biology was a pioneer in this respect when it began developing the Gene Ontology in 1998—available at https://geneontology.org/docs/ontology-documentation/. As an indication of the impact of the Gene Ontology on innovation in related fields, note that it is an input into the AI-enabled work of Demis Hassabis and John Jumper, for which they were awarded the 2024 Nobel Prize in Chemistry (Tunyasuvunakool et al. Reference Tunyasuvunakool, Adler, Zachary, Green, Zielinski, Žídek and Bridgland2021). In Appendix A, I illustrate Wikidata formalisms using the case of “Giovanni Sartori.” Ontology and knowledge graph development almost certainly lies ahead for our discipline, and the MEDem initiative includes it as a goal.
A percolation model of innovation
Building on the four properties outlined above, I develop a computational model of innovation designed to examine the role of cross-disciplinary collaboration for fostering innovation within political science data ecosystems. Focusing on the third and fourth properties of innovation, the model demonstrates how deliberate collaboration between political science and fields like computer and information science, as well as communities of policy and practice, can accelerate advances in our data practices.
Inspired by Silverberg and Verspagen’s (Reference Silverberg and Verspagen2005) percolation model of innovation—a network-based framework showing how innovation reaches a tipping point once sufficient discovery accumulates—I introduce an extension that shows the impact of increased collaboration. “Innovation” is broader than a single discovery; it encompasses interconnected discoveries or sub-innovations. This model leads to two primary insights about innovation: Tipping points can be reached either (a) when a critical threshold of discoverer density is met or (b) when collaboration increases.
The percolation metaphor
The concept of percolation offers an intuitive foundation for understanding the spread of innovation. In physical terms, percolation refers to the process by which a liquid filters through a porous mass (e.g., rainwater passing through the ground). Within the porous structure, sites are either filled (e.g., with dirt) or empty (voids through which water can flow). If connected voids form a continuous path from the surface to the bottom, water will percolate through. A percolation model is a special type of network model developed to represent this process of the diffusion of water.
In this model, imagine a 2D grid or “lattice” (similar to Fig. 3) where each square represents a site in the mass. Horizontally, the grid represents layers of the mass, with ground surface on top. Vertically, water moves through the mass. Sites in this grid may contain either material or be empty voids. Water can only flow through connected voids. For the moment, assume that connectivity is defined by adjacency—rainwater can move left, right, up, or down, but not diagonally. In mathematics, this configuration with four neighbors is known as the “von Neumann neighborhood” and defines the “topology” of the network. Foreshadowing, we will later vary this connectivity assumption by allowing a site to be connected with all eight neighbors—the so-called Moore neighborhood.
To explore percolation behavior, we experiment with the probability that the sites are voids, varying the value from a low of 0% to a high of 100%. Overall, after setting a probability of void density, percolation can be observed in one of two ways: We can use a binary measure by asking: Does water pass through the mass?, or we can use a continuous measure by asking: What percentage of the voids will fill with water?
Experimental treatment of this model reveals a tipping point phenomenon: Beyond about 59% void density, water will usually percolate through the lattice, whereas below this threshold, percolation rarely occurs. Formally, Kolmogorov’s zero–one law shows that in an infinite lattice, 59.3% represents a critical threshold above which the likelihood of percolation is one and below which it is zero. Readers can explore this behavior using NetLogo’s oil spill model.Footnote 5
Extending the percolation concept to innovation
We now transfer the insights to the case of innovation, where the 2D lattice represents an “innovation space” or “knowledge domain.” In the model here, each dimension ranges from 0 to 100. The horizontal axis represents domains or specializations such that neighboring sites are more closely related, and the size of the horizontal separation represents the degree of proximity. It is an abstraction. For example, in the context of bicycles, a horizontal site for “tire” is near “rim” but relatively far from “seat” and “steering.” Similarly, in academic settings, knowledge can be ordered, as is the case with some library cataloguing systems where books are ordered by disciplinary proximity. For example, we might assume that the distance from political science increases as we move through the following list: {political science, political sociology, sociology, social psychology, psychology, neurology, biology, genetics}.
The vertical dimension represents a performance metric increasing from zero. For instance, assume that there is a bicycle propulsion domain on the x-axis. The first bike using foot-propulsion is low in the vertical dimension because it performs poorly. As capabilities evolve, from pedals, to gears, to batteries, the innovation grows vertically up the performance dimension.
Each square site in the 2D innovation space represents a discrete discovery, which we assume can be either known or unknown. We will distribute known discoveries randomly throughout the space at a given density.
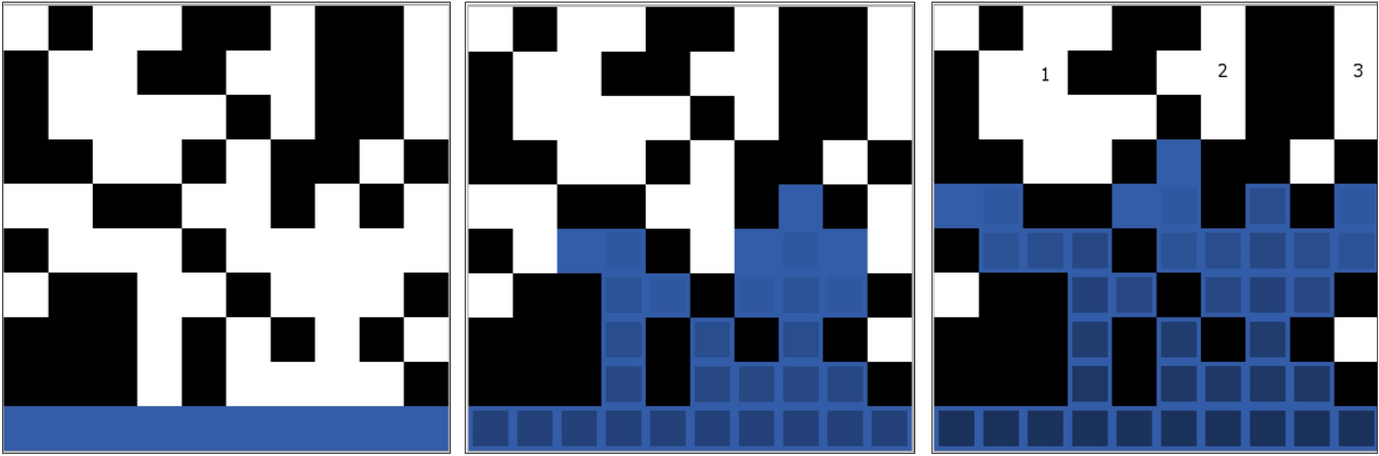
What is innovation? Innovation is conceptualized as a network of connected, known discovery sites that originate at the base—a concatenation of discovery sites. An innovation grows dynamically, starting at the base and expanding. Each site of the space can be in one of three states: Black sites represent sites of potential but unrealized discoveries; white sites represent realized discoveries; and blue sites represent realized discoveries that have become part of the larger network of connected blue sites (i.e., collectively, the innovation).The “size” of an innovation is the percentage of connected (blue) discovery sites relative to all discovered sites (white and blue).
For example, imagine a 2D innovation space in which a set of connected blue sites represents a bicycle. Assume that there is a site somewhere in the space that represents a battery. The world has evolved through three different states: The battery site was once black to represent a world in which a battery has not yet been discovered; it was later white to represent a world in which it had been discovered, but was not yet part of a bicycle; today, it is blue to represent a world in which the battery exists and has been connected, forming what we now call an E-bike.
Figure 3 presents three snapshots of a time series of the growth of the blue innovation. It is a 10×10 grid with a 55% discovery density and the initial innovation along the base.Footnote 6 Over time, the blue innovation cluster expands, gradually pulling in connected discoveries. The initial 10 blue sites in the left panel grow to 29 after five time steps in the middle panel, and finally 38 after eight time steps, yielding a final innovation size of 64%. It cannot grow beyond this because there are no additional white discovery sites connected to the innovation. The final blue innovation does not recognize the existence of the other isolated sub-innovations that remain unconnected; the three numbered clusters represent relatively large sub-innovations. Since 55% density is near the 59.3% critical value, a small increase in connectivity from a von Neumann to a Moore neighborhood would have a large impact on the size of the final innovation: It would draw in all of the remaining white sites and increase the size of the blue innovation to 100%.

Fig. 3 The Emergence of an Innovation in a 10×10 Knowledge Space. In the left panel t=0; in the center panel t=5; in the right panel t=8; and the innovation has stopped growing. Three numbered white clusters represent sub-innovations that remain unconnected to the main blue innovation
Experimental design and findings
I use the model to test the effect of two primary variables on innovation: the density of known discoveries and the level of connectivity. We already know from Kolmogorov’s law that when connectivity is low (i.e., using a von Neumann neighborhood), the innovation tipping point in a square lattice occurs at a discovery density of 59.3%.
Thus, the key variable of interest in this project is the level of connectivity. I increase the level of connectivity by randomly assigning a percentage of sites to have a high connectivity (i.e., a Moore neighborhood) rather than the low connectivity.Footnote 7 Any increase in the size of the innovation that results from this change will represent the “innovation bonus” of increased connectivity. Innovation size is the outcome variable, quantified as the proportion of connected sites in the innovation. The model is developed in NetLogo 6.3, and available at the CoMSES Network via: https://www.comses.net/codebase-release/c4bbbd3b-f694-4fc7-a965-658960936d29/.
In the experiments, I vary both input parameters—discovery density and high connectivity—from 0 to 100% using increments of 5%. I run the model for each combination of values. With 21 possible settings for each variable, there are a total of 441 combinations. Since these models include random components, I repeat each combination 100 times and allow each repetition to run until innovation stops expanding. I then measure innovation. Overall, across 441 scenarios and 100 repetitions, there are 44,100 observations.
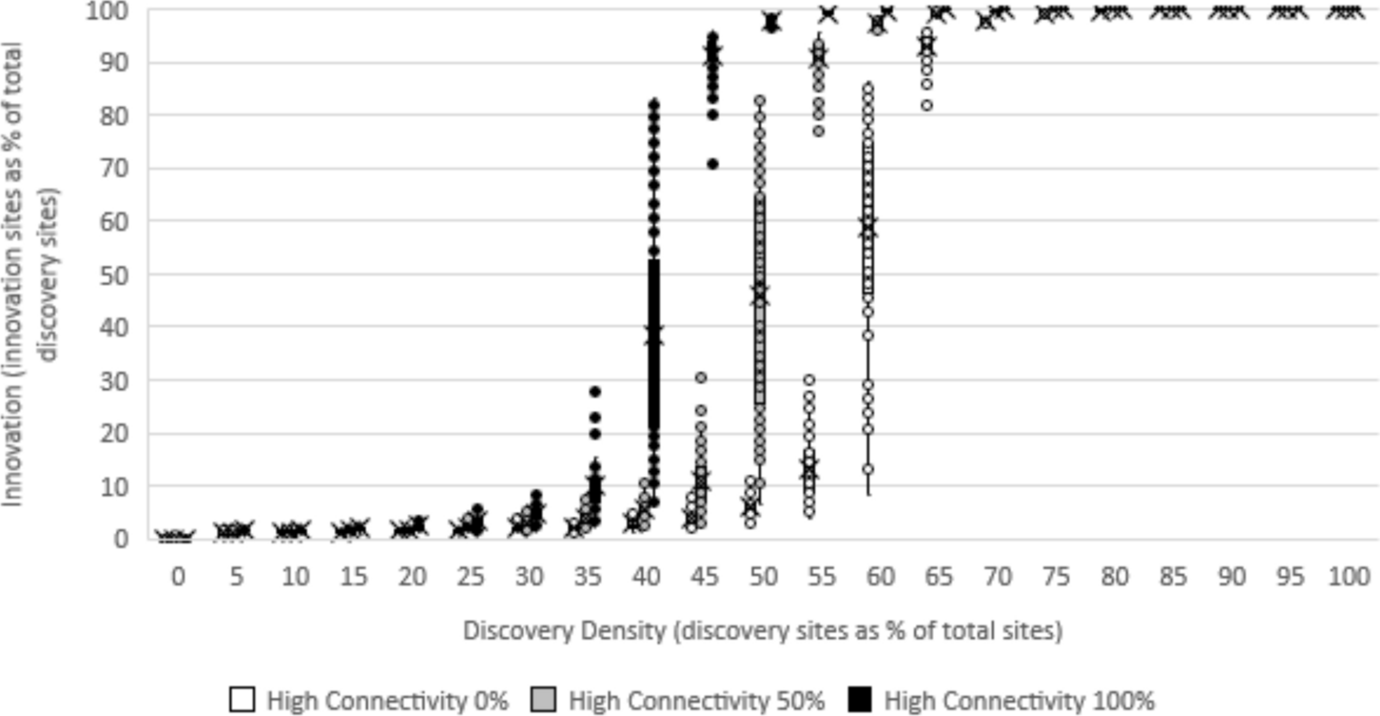
Figure 4 reports the results. For visual clarity, I only report results for high connectivity set at 0%, 50%, and 100%. For each combination of discovery density and connectivity, I plot the set of 100 observations with dots overlayed on a box and whisker plot, with an “x” at the mean. For example, at 60% density and 0% high connectivity, the white dots range from a minimum of about 12% innovation to a maximum of about 85% innovation, with a mean innovation just below 60%. Holding density constant, the size of the innovation bonus is the vertical distance between the mean innovation as high connectivity varies across the three values.

Fig. 4 Innovation as a function of discovery density and connectivity
The results reveal that in the middle range of discovery density, high connectivity is impactful. For example, at 55% density, and no highly connected sites, the system is below the tipping point and innovation is only 12.9% (on average). However, holding density at 55%, after increasing “highly connected” to 50% (in gray), innovation increases to 90.9% (a innovation bonus of 78%). Finally, again holding density at 55%, by the time all sites are highly connected (in black), innovation is 99.3% (a bonus of more than 86% relative to baseline 0%). By contrast, at very low and very high discovery densities, connectivity has minimal impact on innovation: At low discovery density, no amount of connectivity (as defined here) enables the evolution of a large network of connected sites; at high density, high connectivity becomes unnecessary for a large innovation.
This percolation model underscores two routes to innovation: increasing discovery density (akin to traditional R&D) and fostering high connectivity (akin to collaborative, cross-disciplinary work). They interact: When the body of knowledge is in a moderate range of discovery density, investments in higher levels of collaboration can tip a system into dramatic expansions in innovation.
Discussion and conclusion
This innovation model underscores the significant impact of broadening collaborative efforts between political science and fields like computer and information science. By highlighting the effects of enhanced connectivity, the model illustrates how collaboration can accelerate and transform innovation in political science data practices, foretelling a future of data-driven knowledge generation.
This model suggests two main drives of disciplinary innovation: generating new nearby discoveries and linking with existing faraway ones. Naturally, disciplinary advancement often depends on increasing the density of “discoveries” close to the knowledge frontier. Early-career researchers are often encouraged to focus on incremental advancements—intensive, domain-specific research to extend the current boundary of knowledge, one site at a time. Innovation arises as these efforts resolve questions in a specialized area near the current state-of-the-art boundary.
At the same time, this model highlights the value of more adventurous, cross-disciplinary collaboration. The second pathway does not produce new discoveries per say; rather, it generates innovation by linking insights from disparate fields. Relational databases, ontologies, and the FAIR data principles are three examples of data-centric sub-clusters of innovation that already exist and can be pulled into the practice of political science.
Each pathway carries different types of costs. The costs of “incremental” advancement are familiar and arise from the need to apply an intensity of effort on a single site near the frontier of knowledge. Interdisciplinary collaboration generates costs that arise from the need to span distant knowledge domains. Different disciplines know different things, have different cultures, and use different languages. For example, proposals to advance computational social science by “integrating” explanatory research designs from the social sciences with predictive research goals from computer science are difficult precisely because each tradition evolved separately over decades. “Different values have led social and computer scientists to prefer different methods from one another, and to invoke different standards of evidence” (Hofman et al. Reference Hofman, Watts, Athey, Garip, Griffiths, Kleinberg and Margetts2021, 181). Innovation in this case is in the effort to bridge—to concatenate—sub-innovations across distinctive cultures.
The challenges we face in the development of our data resources and practices pertain to the second pathway to innovation. Many advanced data technologies and practices are already known and used in other fields. They are available to us through intentional collaboration with experts from the relevant fields. Fortunately, many experts in FAIR, linked, and open data are service-oriented and have established institutions and initiatives to support communities like ours. GO FAIR is an initiative that supports the implementation of the FAIR data principles. It includes an international office in Leiden, and several national offices distributed across Europe, North America, and South America (Meyers 2025). Also, the Center for Open Science offers frameworks and tools to aid communities like ours which seek to enhance our open data norms and practices. Our collaborative spirit must also extend to include communities with expertise in ethical and legal data practices (Döring forthcoming).
The model developed here is intended to serve as a heuristic for understanding innovation. Like all models, it includes several simplifying assumptions and limitations. First, it uses a conservative definition of “high connectivity” which only expands collaboration from four to eight nearby discovery sites; real-world collaboration patterns can span much greater distances. Second, the innovation space is represented as static and bounded, whereas actual practice involves an expanding space that incorporates new knowledge domains and performance gains. Third, the two-dimensional representation of the innovation space could be rendered in a three- or higher-dimensional space to capture different configurations of knowledge domains; for example, data science capabilities (ranging from data engineering to data visualization) can be represented on a separate z-axis. Finally, the model treats discovery density and high collaboration as exogenous variables, when in reality, researchers actively shape these features when they determine research programs and collaborative partnerships.
In closing, this paper uses a percolation model of innovation to demonstrate the type and pace of change we face if, as I argue here, we are at the early phases of a tipping point in our data ecosystems and practices. It makes sense to be proactive by investing in institutions, standards, knowledge, and practices that can facilitate adaptation to emerging data opportunities, especially through collaborative relationships with data expertise in academia, the media, and policy sectors. Moreover, it shows that innovation tips arise in decentralized and distributed ways, whereby many small sub-innovations join to form larger networks of knowledge. For both of these reasons, the MEDem initiative is well conceived: It simultaneously develops the institutional coordinating mechanisms to incorporate and reconcile new technologies and practices, while also adopting a broadly inclusive and decentralized organizational design so that different parts of our community can focus on different parts of the expanding innovation space (Boomgaarden et al. 2025).
Acknowledgements
I thank Natalie Meyers and Holger Döring for feedback and Scott E. Page, Erik Schultes, and Charles Vardeman for public remarks on percolation, FAIR data, and ontology (respectively) that enriched and refined the arguments I present here.
Declarations
Conflict of interest On behalf of all authors, the corresponding author states that there is no conflict of interest.


 Open access