


Introduction
Depression influenced approximately 3.8% of the global population (280 million people) (Institute of Health Metrics and Evaluation, 2023), making it the second leading contributor to global years lived with disability (GBD 2021 Diseases and Injuries Collaborators, 2024). Traditionally, studies on violence in patients with depression mainly focused on suicides or nonsuicidal self-injury. However, a growing body of literature has reported an increased risk of outward violence in patients with depression. According to a survey of 3,929 college students in the United States, 9.6% of students were diagnosed with severe depression, and they had double the odds of committing violent crimes compared with students without depression (odds ratio = 1.99, 95% confidence interval = 1.42–2.79) (Schwartz, Beaver, & Barnes, Reference Schwartz, Beaver and Barnes2015). Another longitudinal study based on cohorts in the Netherlands, the United Kingdom, and Finland also revealed that depression was significantly associated with the later violent outcomes in young people (Yu et al., Reference Yu, Aaltonen, Branje, Ristikari, Meeus, Salmela-Aro and Fazel2017). According to a national database in China, violent criminal cases committed by patients with depression increased by 46.5% from 2016 to 2019 (Lu et al., Reference Lu, Yao, Wang, Gu, Li, Hu and Li2025). The MacArthur study on mental disorders and violence assessed 1,136 patients and reported that patients with mood disorders had higher rates of violence than patients with schizophrenia (28.5% in depression and 14.8% in schizophrenia) (Maden, Reference Maden2003).
Despite the accumulating evidence underscoring the increased risk of violence among patients with depression, there have been very few studies that have focused on the underlying neurobiological mechanisms. Are there some distinct neurobiological bases for violent behavior in patients with depression, or are there neurobiological markers that can indicate the risk of violence? These questions warrant further research. Investigating the neurobiological underpins of violence in patients with depression will not only be beneficial to the prediction of violence risk but also to the prevention and correction of violence in patients with depression.
Electroencephalogram (EEG), with the advantages of high-time resolution, cost-effectiveness, and easy to use (van Diessen et al., Reference van Diessen, Numan, van Dellen, van der Kooi, Boersma, Hofman and Stam2015), is much favorable for investigating brain functions. Over the last decades, EEG has been extensively adopted to evaluate the resting-state brain function of major depressive disorder (MDD) and yield variable results. For example, in MDD patients, asymmetric activity in the frontal regions due to relative hyperactivity over the right has been frequently observed (Pizzagalli et al., Reference Pizzagalli, Nitschke, Oakes, Hendrick, Horras, Larson and Davidson2002). EEG microstate analysis can identify millisecond-level global brain states indexing cognitive processing, which has been widely used to study brain function (Khanna, Pascual-Leone, Michel, & Farzan, Reference Khanna, Pascual-Leone, Michel and Farzan2015). It has been reported that the individual differences in resting-state EEG microstate parameters could reflect altered large-scale brain network dynamics relevant to depressive symptoms (Damborská et al., Reference Damborská, Tomescu, Honzírková, Barteček, Hořínková, Fedorová and Michel2019). Similarly, it has been reported that the proportion and occurrence of microstate D were decreased in MDD compared to the healthy control (HC) group, and the proportion and duration of microstate D were negatively correlated with symptom severity in the MDD group (Murphy et al., Reference Murphy, Whitton, Deccy, Ironside, Rutherford, Beltzer and Pizzagalli2020).
EEG functional connectivity (FC) analysis is another useful method for understanding the mechanisms of psychiatric disorders since it can detect the real-time global and regional brain functions. Researchers have documented that MDDs are related to the dysfunction of neuronal network activity across cortical and limbic circuits (Greicius et al., Reference Greicius, Flores, Menon, Glover, Solvason, Kenna and Schatzberg2007; Zeng et al., Reference Zeng, Shen, Liu, Wang, Li, Fang and Hu2012). Depressive disorder has been linked with disruptions in the topological structure of brain networks, and this disruption may contribute to disturbances in mood and cognition in MDD patients (Zhang et al., Reference Zhang, Wang, Wu, Kuang, Huang, He and Gong2011). Graph theory analysis is a promising mathematical approach to study topological characteristics of both local and long-distance brain FC (Bordier, Nicolini, & Bifone, Reference Bordier, Nicolini and Bifone2017). Both structural and functional connections between different neural networks in MDD have been documented by graph theory analysis (Xu et al., Reference Xu, Li, Teng, Huang, Liu, Long and Sui2024). A study reported a decrease in small-world properties in MDD, indicating that brain networks exhibit greater randomness in patients with depression (Zhang et al., Reference Zhang, Wang, Wu, Kuang, Huang, He and Gong2011). Shim, Im, Kim, and Lee (Reference Shim, Im, Kim and Lee2018) observed an increase in path length (Lp) of the brain network in patients with depression compared to HC groups. Jacob et al. (Reference Jacob, Morris, Verma, Rutter, Balchandani and Murrough2022) found that the altered nodal metrics of limbic subregions (right hippocampus and right dentate gyrus) in the whole-brain connectome are related to diagnosis and depression severity, contributing to our understanding of the limbic system involvement in MDD, and may elucidate the underlying mechanisms of depression.
In addition to EEG abnormities observed in patients with depression, a high prevalence (25–50%) of EEG abnormalities in violent criminals has also been extensively reported, especially in recidivists, suggesting that resting-state EEG may be associated with violence or the risk of violence (Reyes & Amador, Reference Reyes and Amador2009). For example, Patrick reported in a review study that persistent aggressive behaviors were associated with enhanced EEG slow wave activity (Patrick, Reference Patrick2008). Calzada-Reyes, Alvarez-Amador, Galán-García, & Valdés-Sosa (Reference Calzada-Reyes, Alvarez-Amador, Galán-García and Valdés-Sosa2013) found increased β activity and a decrease in the alpha band in violent offenders with psychopath compared to those with non-psychopath, and this difference was more significant in the frontal-temporo-limbic network. Keune et al. (Reference Keune, van der Heiden, Várkuti, Konicar, Veit and Birbaumer2012) reported that imprisoned violent offenders were characterized by stronger right than left-hemispheric alpha activity, and the trait aggression was associated with stronger right-frontal alpha activity in violent individuals.
In view of these aforementioned findings, it is plausible to assume that there may be some EEG abnormalities in patients with depression who committed violent offenses that can serve as biomarkers for violence risk. However, little is known about this issue because very few studies have investigated the resting-state EEG characteristics of patients with MDD who committed violent offenses. Despite this context, the present study aimed to investigate the resting-state EEG characteristics of patients with depression who committed violent offenses, to provide a neurobiological basis for understanding the mechanisms underlying the violent behavior in patients with depression, and to further explore the EEG markers of violence risk in patients with depression. The results of the study will not only be beneficial to the prediction of violence risk, but also for the prevention and correction of violence in patients with depression.
Methods and materials
Participants
A total of 81 participants aged 18–60 years were recruited during January 2022 to June 2023 in the present study, consisting of three groups: (1) the violent depression (VD) group: participants in this group included 29 patients with MDD who committed violent offenses. The inclusion criteria were: diagnosed with MDD according to the International Statistical Classification of Diseases and Related Health Problems version 10 (ICD-10) criteria, and had no other comorbid mental disorders, such as anxiety or substance abuse; committed violent crimes (including intentional murder, intentional assault, and intentional destruction of property), and a Modified Overt Aggression Scale (MOAS) score > 4 within the past month. (2) The nonviolent depression (NVD) group: this group included 27 patients with a diagnosis of MDD who had no violent behaviors within the past 6 months. The inclusion criteria were: diagnosed with MDD according to ICD-10 criteria, and had no other comorbid mental disorders, such as anxiety or substance abuse; had no report or record of any violent behaviors, and had a MOAS score < 4 within the past 6 months. (3) The HC group: this group included 25 healthy volunteers recruited through advertisements. The inclusion criteria were: no history of any mental disorder; MOAS score < 4 within the past 6 month; and never reported or recorded any violent behaviors. The exclusion criteria for all participants were: had self-directed violence (e.g., nonsuicidal self-injury and suicides) or extended suicides in the past 6 months; had received modified electroconvulsive therapy within the past month; unable to complete the experiment due to various reasons, such as physical or emotional discomfort. This study was approved by the Medical Ethics Committee of Sichuan University (K2022004), and informed consent was obtained from all participants.
Psychiatric and psychological assessment
The depression severity, negative automatic thoughts, impulsivity, and aggression of the participants within the past month before the study were evaluated using Chinese version of the following scales: The Beck Depression Inventory-II (BDI-II) (Beck, Steer, & Brown, Reference Beck, Steer and Brown1996; Wang et al., Reference Wang, Yuan, Huang, Li, Chen, Zhang and Xiao2011), the 30-item Automatic Thoughts Questionnaire (ATQ) (Harrell & Ryon, Reference Harrell and Ryon1983; Wang, Wang, & Ma, Reference Wang, Wang and Ma1999), the Dickman’s Impulsivity Inventory–Dysfunctional Impulsivity (DII-DI) (Dickman, Reference Dickman1990; Zheng & Zhang, Reference Zheng and Zhang2016), the Buss and Perry Aggression Questionnaire (AQ-CV) (Li et al., Reference Li, Fei, Zhang, Niu, Tong and Yang2011), and the MOAS. All scales are widely used in China and have demonstrated good validity and reliability in Chinese populations (Cao, Cheng, Tang, & Song, Reference Cao, Cheng, Tang and Song2001; Li et al., Reference Li, Fei, Zhang, Niu, Tong and Yang2011; Wang et al., Reference Wang, Yuan, Huang, Li, Chen, Zhang and Xiao2011; Zheng & Zhang, Reference Zheng and Zhang2016).
Electrophysiological recording and preprocessing
EEGs were recorded continuously using a BrainVision ActiChamp 64-channel active EEG system (ActiCap system, Brain Products GmbH, Germany), and the electrodes were arranged according to the International 10–20 System. TP9 and TP10 were used as references when recording. EEG data were recorded while the participants sat comfortably with their eyes fixating on a crosshair placed on a white wall in front of them. The sampling rate was set at 500 Hz, and all electrode impedances were reduced to below 5 kΩ before data collection. The recording lasted for at least 5 min.
The EEGLAB toolbox (Delorme & Makeig, Reference Delorme and Makeig2004) based on MATLAB (MathWorks, version R2013b) was used for EEG data preprocessing. Epochs containing eye movements, blinks, muscle activities, or other artifacts were excluded. EEG data were re-referenced to the common average reference from all the electrodes (without the reference electrodes TP9 and TP10). Then, EEG data were subjected to band-pass filtering within the range of 2–30 Hz. Independent component analysis (ICA) was conducted to remove the artifacts generated by eye movements and muscle activities. Subsequently, the trials with amplitudes exceeding 100 μV were deleted. Finally, the frequency bands of EEG in this study were categorized into total band (2–30 Hz), delta (2–4 Hz), theta (4–8 Hz), alpha1(8–10.5 Hz), alpha2 (10.5–13 Hz), beta1 (13–20 Hz), and beta2 (20–30 Hz) for subsequent analysis.
Spectral analysis
First, at each channel, a Fourier transform was performed, and the amplitude in μV for frequency bands was calculated. Second, amplitudes at the six frequency bands (alpha1, alpha2, beta1, beta2, delta, and theta) of the whole brain were compared between the three groups. At last, the amplitudes of EEG channels within the left and right hemispheres were calculated to provide more information about the lateralization differences.
Microstate analysis
Microstate analysis was conducted in MATLAB (version 2013b) utilizing functions from the EEGLAB plugin. The k-means clustering method was used to estimate the optimal set of topographies explaining the EEG signal. The polarity of the maps was ignored in this clustering procedure, and in order to improve the signal-to-noise ratio, only the data at the time points of the local maximum of the global field power (GFP) were clustered. This process yields measures, such as mean duration, time coverage, frequency of occurrence, and global explained variance (GEV). The mean duration is the average amount of time that a microstate class was continuously presented, whereas the total time coverage represents the summed amount of time of one microstate class. The frequency of occurrence indicates how many times a microstate class is recurring per second, and the GEV is the sum of the explained variances of each microstate weighted by GFP.
Functional network and connectivity analysis
Artifact-free EEG epochs for each frequency band were transformed into reference-free current source density (CSD) using a spherical spline surface Laplacian by MATLAB-based CSD toolbox (Kayser & Tenke, Reference Kayser and Tenke2006) for each subject. To construct the FC matrix, each electrode was treated as a node, with connectivity strength between nodes representing the edges in the network. Coherence was used as the measure of connectivity strength between nodes, resulting in seven 62 × 62 connectivity matrices for each participant in each EEG band. Both network-based statistic (NBS) analysis and graph theory analysis were used to investigate the brain functional networks in the present study. The NBS method could identify alterations in functional brain connectivities, while graph theory analysis could assess the strength of connections between brain nodes, reflecting the efficiency of information transfer and overall brain function. By examining different aspects of brain network organization, these two approaches together offer a more comprehensive understanding of the neural connectivity changes.
NBS analysis
To identify the hyper- and hypo-connected functional networks in the VD group, the matrices of the whole-brain coherence were examined to extract subnetworks or topological clusters that were significantly different between the three groups using the whole-brain NBS. For each frequency band, the 62 × 62 connectivity matrices of each group were subjected to analysis using the NBS toolbox. Permutation tests were used to calculate the FWER-corrected p-values for each component (Zalesky et al., Reference Zalesky, Cocchi, Fornito, Murray and Bullmore2012; Zalesky, Fornito, & Bullmore, Reference Zalesky, Fornito and Bullmore2010). The number of permutations is set to 5,000. The F-test was used to evaluate the differences between groups for each frequency band. T-tests were performed to describe the significant main effects of group. At last, BrainNet Viewer (Maxwell, Reference Maxwell2007; Xia, Wang, & He, Reference Xia, Wang and He2013) was utilized to display the connections showing statistically significant differences.
Graph-theory network analysis
GRETNA (Wang et al., Reference Wang, Wang, Xia, Liao, Evans and He2015) was used to analyze the global and regional topological network and nodal properties. Network analysis was performed using the GRETNA toolbox on the MATLAB platform. A range of sparsity thresholds (ranging from 0.05 to 0.50, in increments of 0.05) was applied to all matrices. To explore potential differences in the topological properties of brain networks across groups, both global network metrics, including global efficiency (Eglob), local efficiency (Eloc), clustering coefficient (Cp), shortest Lp, and small-world attributes (Lambda and Sigma), and regional network metrics, including degree centrality (Dc), betweenness centrality (Bc), and nodal efficiency (aNe), were calculated under each threshold. To capture the brain network state across various sparsity thresholds, the area under the curve (AUC) for each matrix was computed and analyzed. The aCp, aLp, aLambda, aSigma, aEg, and aEloc represent the AUC of Cp, Lp, Lambda, Sigma, Eglob, and Eloc, respectively. In addition, the EEG electrodes were projected onto the Brodmann areas of the cerebral cortex according to a study on the anatomical correlations determined by magnetic resonance imaging (MRI) of cortical projections (Koessler et al., Reference Koessler, Maillard, Benhadid, Vignal, Felblinger, Vespignani and Braun2009). The corresponding names of the brain regions are detailed in Supplementary Table S1. At last, BrainNet Viewer (Xia et al., Reference Xia, Wang and He2013) was utilized to display the nodes showing statistically significant differences.
Statistical analysis
A chi-square test was used to determine between-group differences in categorical data. An analysis of variance (ANOVA) test was used to analyze the between-group differences in age, education, and spectral amplitude. For the data that do not conform to the normal distribution, the nonparametric Kruskal–Wallis test was used. The significance threshold was set at p < 0.05. Multiple comparisons were corrected using the false discovery rate (FDR) at a threshold of p < 0.05. The p-values of post hoc tests were adjusted using the Bonferroni correction. Spearman’s rank correlation coefficient was employed to explore the relationship between the scores of psychological scales and the EEG metrics showed significant group differences. All these analyses were conducted using IBM SPSS Statistics 27.0.
Results
Demographic and clinical characteristics of participants
Demographic and clinical characteristics of the three groups were presented in Table 1. The gender, age, and education years had no statistically significant differences between the three groups. All participants with MDD were taking Selective Serotonin Reuptake Inhibitors medications upon enrollment in the study. The VD group scored statistically significantly higher than the HC and NVD groups on the MOAS. The VD and NVD groups scored statistically significantly higher than the HC group on the BDI-II, ATQ, AQ-CV, and DII-DI scales (all p < 0.001), while no statistically significant differences were found between the VD and NVD groups.
Table 1. Demographic and clinical characteristics of the three groups

Note: The data represented the median scores, with the lower and upper quartile in parentheses. The superscript letters ‘a’ and ‘b’ denote the difference between two groups; the same superscript letter indicates that the difference between the two groups is not statistically significant at 0.05 level; and different letters denote that the difference between the two groups is statistically significant at the 0.05 level. The abbreviation ‘95% CI’ represents the 95% confidence interval. For categorical variables (gender), Cramer’s V was used as the effect size, while for other continuous variables, η 2 was employed.
Spectral analysis
Spectral analysis revealed no statistically significant hemispherical differences in the mean amplitude across the six frequency bands in all three groups. ANOVA analysis revealed no statistically significant difference in mean amplitudes of the whole brain at the six frequency bands between the three groups (Supplementary Figure S1).
Microstate analysis
The optimal cluster number for microstates is four for all three groups. The four microstate classes accounted for a mean of 66% (standard deviation [SD] = 7.5%), 70% (SD = 5.5%), and 72% (SD = 5.8%) of the data variance in VD, NVD, and HC groups, respectively. Microstates of class A were found to occur more frequently (corrected p < 0.001) and cover more percentage of time (corrected p < 0.001) in the VD group. No other statistically significant differences were observed in the other three microstates among the three groups. Detailed results are summarized in Table 2.
Table 2. Mean duration, time coverage, and occurrence of each microstate among the three groups

Note: Values represent means, with standard deviations in parentheses. The superscript letters ‘a’ and ‘b’ denote the difference between two groups; the same superscript letter indicates that the difference between the two groups is not statistically significant at the 0.05 level; and different letters denote that the difference between the two groups is statistically significant at the 0.05 level. The abbreviation ‘95% CI’ represents the 95% confidence interval.
Results of the group comparisons for the probability of transition were presented in the Table 3. Compared to the HC and NVD groups, the probability of the microstates transition in the VD group increased significantly between A and B, but decreased significantly between C-D and B-D bidirectionally. Moreover, both the VD and NVD groups showed increased probability of the microstate transition between A and C compared to the HC group.
Table 3. Means for the transition probabilities of microstates among the three groups

Note: Values represent means, with standard deviations in parentheses. The abbreviation ‘95% CI’ represents the 95% confidence interval.
NBS analysis
There were three decreased functional brain connectivity in the total band in the VD group compared to HCs: (a) intra-connectivity in the left frontal area in the total band (Figure 1A), (b) between right frontal-central and left parieto-occipital connectivity in the total band (Figure 1B), and (c) between bilateral central areas connectivity in the alpha1 frequency band (Figure 1C).

Figure 1. Results from NBS between VD and HC. Differential networks with statistical significance are displayed. The dots represent EEG electrodes, and the dark lines in D, E, F, and G denote significantly enhanced connectivity in the VD group, while the light lines in A, B, and C denote significantly attenuated connectivity in the VD group. The number in the parentheses represents the edges and nodes in each subnetwork. Total_N1: the first subnetwork in the total band. Total_N2: the second subnetwork in the total band. alpha1_N1: the first subnetwork in the alpha1 band. alpha1_N2: the second subnetwork in the alpha1 band.
Besides the decreased functional networks, two increased functional brain networks were observed in the VD group compared to the HC group. One was between the bilateral prefrontal cortex (PFC) across alpha1, beta1, and beta2 bands (Figure 1D, E, F); the other was between frontal-central region and parieto-occipital region in beta1, beta2, delta, and theta bands (Figure 1G, H).
Compared to the NVD group, the VD group exhibited two increased FC: one was between the bilateral PFC in the beta band (Figure 2A) and the other was between the frontal-central region and the parieto-occipital region in the theta band (Figure 2B).

Figure 2. Results from NBS between VD and NVD. Differential networks with statistical significance are displayed. The dots represent EEG electrodes, and the dark lines denote significantly enhanced connectivity in the VD group. The number in the parentheses represents the edges and nodes in each subnetwork.
Graph theory analysis
Global network metrics
In the total frequency band, both the VD and NVD groups exhibited decreased small worldness (decreased aSigma), decreased global integration capacity (increased aLambda, aLp, and decreased Eg), but increased local clustering connections (increased aCp and aEloc). All the above-mentioned alterations were more pronounced in the VD group (Supplementary Figure S2). However, these differences did not reach statistical significance.
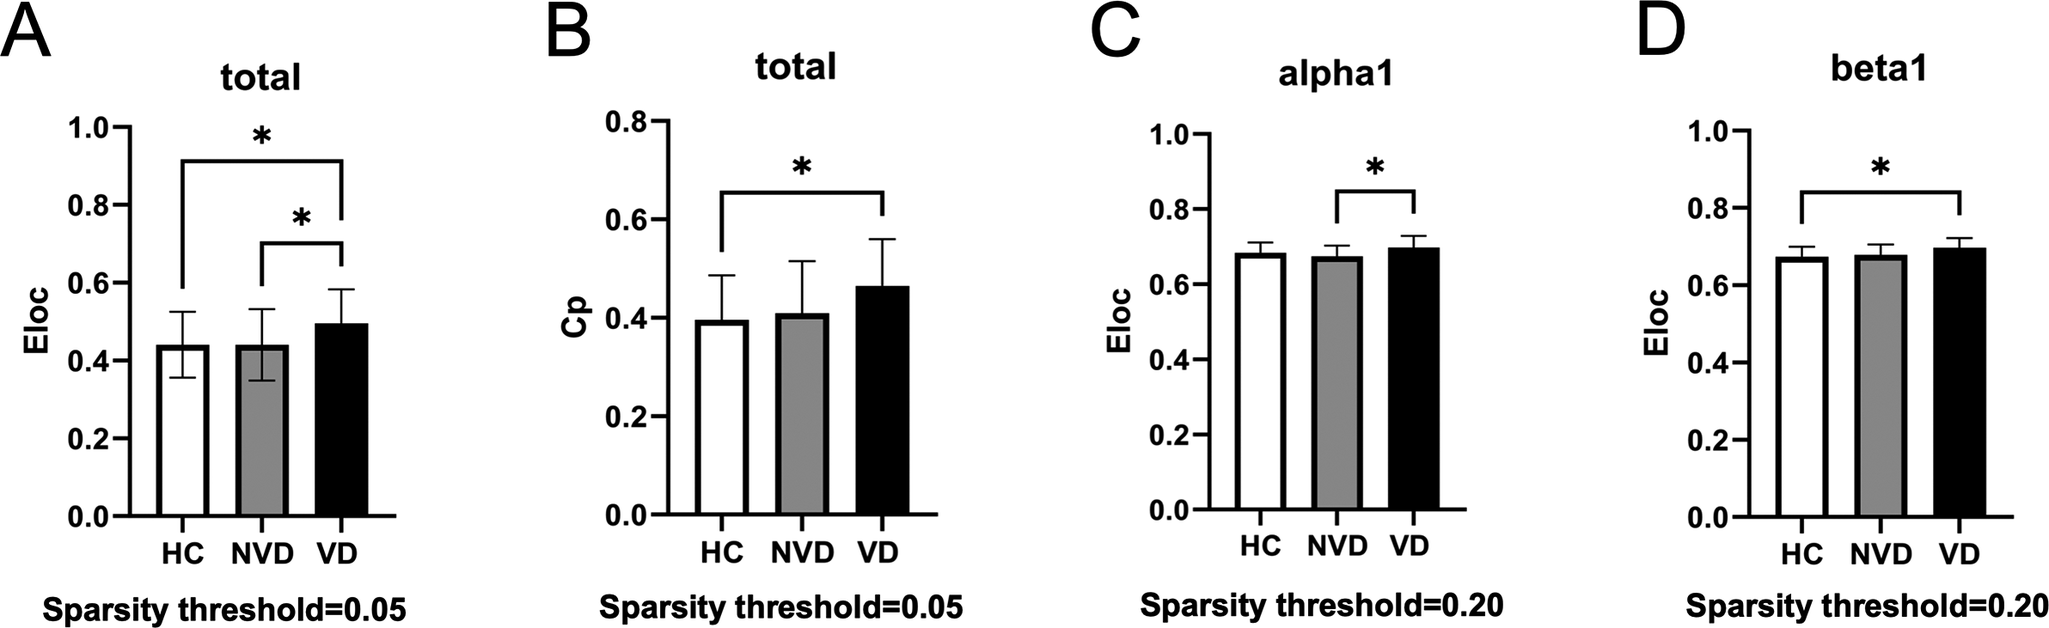
Global network metrics across the three groups were compared under different sparsity thresholds (Figure 3). Significant differences of the global metrics were only observed under the sparsity threshold of 0.05 in the total band and the sparsity threshold of 0.20 in the alpha1 and beta1 bands. At the sparsity threshold of 0.05, Eloc and Cp presented a pattern of VD > NVD > HC, and post hoc analysis showed that the VD group had significantly higher Eloc compared to the NVD and HC groups, and significantly higher Cp compared to the HC group (Figure 3A, B), while no significant differences between the NVD and HC groups were observed. At the sparsity threshold of 0.20, only Eloc showed significantly higher values in the VD group in the alpha1 band compared to the NVD group (Figure 3C), and in the beta1 band compared to the HC group (Figure 3D).

Figure 3. Comparisons of global network metrics at different sparsity thresholds among the three groups. *Indicates the group difference is statistically significant at the P < 0.05 level. Eloc, local efficiency; Cp, clustering coefficient.
Nodal network metrics
As shown in Figure 4A–C, graph theory analysis revealed nodal-level abnormalities in both the VD and NVD groups (p < 0.05, FDR-corrected). Total band EEG analysis revealed reduced aDc at node FC4 (middle frontal gyrus [MFG]) and FC6 (precentral gyrus [PrcG]) in the NVD group and at node FC4 (MFG), F4 (MFG), and F6 (MFG) in the VD group, and elevated aDc at CPz (postcentral gyrus [PocG]) in both the VD and NVD groups. Moreover, both the VD and NVD groups exhibited significantly elevated aDc and aBc at node FP2 (superior frontal gyrus, SFG) in the beta1 band (13-20 Hz), and decreased aBc at node F6 (MFG) in the alpha2 band.

Figure 4. Comparisons of Nodal metrics (aBc, aDc, and aNe) among the three groups. Small dots indicate a significant decrease and large dots indicate a significant increase in VD and NVD. aBc, aDc, and aNe represent the AUC of betweenness centrality, degree centrality, and nodal efficiency, respectively.
As shown in Figure 4D–E, the VD group exhibited a pattern of VD < NVD < HC in aNe at the Pz node (superior parietal lobe [SPL]) and a pattern of VD > NVD > HC in aNe at the PO8 node (middle occipital gyrus [MOG]) in the alpha1 band (8–10.5 Hz). At last, it is worth noting that all nodes with abnormalities in the graph theory analysis were located in the right hemisphere or midline.
Correlation analysis
Correlation analysis was performed between microstate metrics with statistical significance and the scale scores (Figure 5A–B). Microstate A occurrence and contribution were positively correlated with BDI-II, ATQ, and AQ-CV scores (Figure 5A). The probability of microstate A-B transition was positively correlated (p < 0.05) with BDI-II, ATQ, AQ-CV, and DII scores, while the probability of C-D transition was negatively correlated with ATQ, AQ-CV, and DII scores. In addition, the probability of A-C transition was positively correlated with BDI-II and ATQ scores, while the probability of B-D transition was negatively correlated only with ATQ scores (Figure 5B).

Figure 5. Results of correlation analysis. The number in the parentheses represents correlation coefficients. (A) Correlations of microstate A occurrence and contribution with scale scores (BDI-II, ATQ, AQ-CV, and DII-DI). (B) Correlations between microstate transition probabilities and scale scores. (C) Correlations between global metrics and scale scores; 0.05 and 0.20 represent sparsity thresholds; and Cp and Eloc represent clustering coefficient and local efficiency, respectively. (D) Correlations between nodal metrics and scale scores; FP2, CPz, FC4, F6, F4, and PO8 represent nodes; and aBc, aDc, and aNe represent the AUC of betweenness centrality, degree centrality, and nodal efficiency, respectively.
Correlations between the metrics with statistical significance in the graph theory analysis and scale scores have been computed, and the results are presented in Figure 5C–D. In total band, the Cp and Eloc at the threshold of 0.05 were positively correlated with the clinical variables (ATQ, AQ-CV, and MOAS), and only the Cp was positively correlated with DII-DI (Figure 5C). Moreover, in the beta1 band, the Eloc at the threshold of 0.20 was positively correlated with AQ-CV and MOAS (Figure 5C). Additionally, the values of aDc at FC4, F6, and F4 in the total band were negatively correlated with the clinical variables (BDI-II, ATQ, AQ-CV, DII-II, and MOAS). Otherwise, the aDc (at FP2 in beta1 and CPz in total bands), aBc (at FP2 in beta1 band), and aNe (at PO8 in total band) showed positive correlations with these clinical scores (Figure 5D).
Discussion
Microstate analysis
Microstates reflect the quasi-stable momentary fluctuations of neuronal activity, which could assess changes in global brain coordination in association with spontaneous thoughts (Jajcay & Hlinka, Reference Jajcay and Hlinka2023). Previous resting-state functional MRI studies have documented that the four aforementioned microstates correlated with specific functional systems: auditory (microstate A), visual (microstate B), default mode (microstate C), and dorsal attention (microstate D) (Britz, Van De Ville, & Michel, Reference Britz, Van De Ville and Michel2010; Yeo et al., Reference Yeo, Krienen, Sepulcre, Sabuncu, Lashkari, Hollinshead and Buckner2011). The VD group in the present study showed increased microstate A. Microstate A is associated with internal verbal processing and linked to individuals’ arousal level (Musaeus, Nielsen, & Høgh, Reference Musaeus, Nielsen and Høgh2019), which has been proposed as a nonspecific state marker for general psychopathology (de Bock et al., Reference de Bock, Mackintosh, Maier, Borgwardt, Riecher-Rössler and Andreou2020). Individuals with increased microstate A may experience heightened internal verbal activity and rumination (Tarailis, Koenig, Michel, & Griškova-Bulanova, Reference Tarailis, Koenig, Michel and Griškova-Bulanova2024). These increased and uncontrolled negative internal dialogues could lead to increased anxiety and reduced inhibitory control, thereby resulting in impulsive and violent behaviors. Similar to our results, Lin et al. reported that the occurrence of microstate A was associated with an increased risk of violence in schizophrenia (Lin et al., Reference Lin, Li, Liu, Zhong, Sun, Guo and Wang2023). In addition to this, the present study also found that the VD group has a higher probability of the microstate A-B transition, but a lower probability of B-D and C-D transitions. These results suggest that patients in the VD group have hyperactivation of the sensation network, along with lower transition between sensorimotor and attentional network and between default model and attentional model. This indicates difficulties in the coordination between sensation and information processing, as well as between self-referential activities and task-related cognitive control and emotion regulation, which may lead to disruption in self-cognition and outward task responses (Sheline, Price, Yan, & Mintun, Reference Sheline, Price, Yan and Mintun2010). This deduction was also supported by the correlation analysis showing that the probability of A-B transition was positively correlated with the severity of depression, automatic thoughts, and aggression, while the probability of C-D transition was negatively correlated with the severity of automatic thoughts, impulsivity, and aggression. These microstate characteristics in the VD group may constitute a basic EEG background for increased violent risk.
NBS analysis
Decreased functional brain networks in the VD group compared to the HCs
Three attenuated functional networks were observed in the VD group compared to the HCs. The first was located within the left frontal region. The left frontal lobe includes the MFG, which is part of the dorsolateral PFC. This region is important for emotional regulation (Song, Zhang, & Huang, Reference Song, Zhang and Huang2016), executive control, and inhibitory processes (Le, Potvin, Zhornitsky, & Li, Reference Le, Potvin, Zhornitsky and Li2021). Moreover, the left hemisphere is responsible for the processing of positive emotions (Leliveld, Langbein, & Puppe, Reference Leliveld, Langbein and Puppe2013). Reduced FC in the left frontal area may be associated with more severe anhedonia symptoms and a diminished capacity for emotional and behavioral control, potentially contributing to an increased risk of violent behavior.
The second decreased functional networks in the VD group were between the right frontal-central region and the left parieto-occipital lobe in the total band. These connections are part of the frontoparietal network. It has been found that frontal–parietal connections were closely related to attentional processes, whereas the frontal cortex is responsible for task specification, while the parietal cortex is responsible for motion response (LeDuke, Borio, Miranda, & Tye, Reference LeDuke, Borio, Miranda and Tye2023). Both frontal and parietal regions have been indicated in response to aggressive environmental cues (Mathiak & Weber, Reference Mathiak and Weber2006; Strenziok et al., Reference Strenziok, Krueger, Deshpande, Lenroot, van der Meer and Grafman2011). Decreased FC within this network may reflect impaired coordination between the frontal and parietal cortices, which could disrupt the integration of cognitive control and behavioral response (Marek & Dosenbach, Reference Marek and Dosenbach2018). This dysregulation may subsequently lead to rigid cognitive-behavioral patterns and increase the propensity for aggressive behaviors.
In the alpha1 band, weakened FC between the bilateral central regions was observed in the VD group. Consistent with our findings, a previous study also reported that reduced activation in the central brain regions was specifically associated with irritability and aggressive behaviors (Chaarani et al., Reference Chaarani, Kan, Mackey, Spechler, Potter and Banaschewski2020). The central region includes the PrcG and PocG, which are involved in sensory and motor processing (Yu et al., Reference Yu, Chen, Wang, Hu, Ding, Jia and Yang2019). Additionally, the PrcG is thought to play a key role in social cognition, including interpreting facial expressions, perceiving emotions, and recognizing desires (Huang et al., Reference Huang, Chen, Rong, Wan, Chen, Liu and Wang2022). Deficits in these functions are strongly linked to aggressive behavior.
Increased functional brain networks in the VD group compared to the NVD and HC groups
First, increased FC between the bilateral PFC was observed in the VD group compared to the NVD group in the beta1 band and the HC group in the alpha1, beta1, and beta2 bands. The PFC plays a critical role in numerous complex human cognitive, emotional, and behavioral processes (Mahesan, Antonenko, Flöel, & Fischer, Reference Mahesan, Antonenko, Flöel and Fischer2023; Zuo et al., Reference Zuo, Ran, Wang, Li, Han, Tang and Li2018). Previous studies have reported that abnormally enhanced and convergent connectivity between subregions of the PFC in depressed patients is associated with symptoms such as rumination and excessive self-focus (Sheline et al., Reference Sheline, Price, Yan and Mintun2010). Moreover, PFC hyperactivity has also been linked to irritability, aggressive behavior, and angry rumination (Leutgeb et al., Reference Leutgeb, Wabnegger, Leitner, Zussner, Scharmüller, Klug and Schienle2016; Liuzzi et al., Reference Liuzzi, Kryza-Lacombe, Christian, Palumbo, Amir and Wiggins2020; Teles, Maximo, Lahti, & Kraguljac, Reference Teles, Maximo, Lahti and Kraguljac2024). Increased FC between the left and right orbitofrontal cortex (OFC) has also been observed in violent inmates (Leutgeb et al., Reference Leutgeb, Wabnegger, Leitner, Zussner, Scharmüller, Klug and Schienle2016; Teles et al., Reference Teles, Maximo, Lahti and Kraguljac2024). Given the role of the PFC in higher-order control functions, we propose that the increased PFC FC may be a compensatory mechanism for the decreased frontoparietal connectivity. Thus, the combination of decreased frontoparietal FC and enhanced PFC FC may collectively contribute to dysfunction in emotion regulation, impulse control, and executive function, potentially increasing the risk of violent behavior in patients with depression.
Second, the VD cohort exhibited extensively enhanced FC between the frontal-central-occipitoparietal area in the beta1, delta, and theta bands compared to the HC controls, but only in the theta band compared to the NVD group. Enhanced beta power was positively correlated with ratings of nervousness (Knyazev, Reference Knyazev2007), and was related to anxiety and rumination, which are common in depressive patients (de Aguiar Neto & Rosa, Reference de Aguiar Neto and Rosa2019). The increased frontal-central-parietal connectivity in the beta band in the VD group may suggest a hypervigilant neurophysiological state toward environmental threats that aligns with their clinical irritability profile. Previous studies on FC alterations in the theta (Knott, Mahoney, Kennedy, & Evans, Reference Knott, Mahoney, Kennedy and Evans2001; Leuchter et al., Reference Leuchter, Cook, Hunter, Cai and Horvath2012) and delta (Gong et al., Reference Gong, He, Zhang, Zhang, Zhang and Xie2018; Liu et al., Reference Liu, Zhang, Wang, Xu, Chang, Ristaniemi and Cong2020) bands in MDD have shown inconsistent conclusions due to methodological and sample heterogeneity. However, previous studies have reported associations between theta-band FC and rumination-induced irritability (Dell’Acqua et al., Reference Dell’Acqua, Ghiasi, Messerotti Benvenuti, Greco, Gentili and Valenza2021). Increased theta oscillations in frontal (Krämer, Kopyciok, Richter, & Münte, Reference Krämer, Kopyciok, Richter and Münte2009; Williams, Reference Williams1969) and occipital regions (Lindberg et al., Reference Lindberg, Tani, Virkkunen, Porkka-Heiskanen, Appelberg, Naukkarinen and Salmi2005) have also been observed in individuals with violent tendencies, while homicide male offenders with antisocial personality disorder exhibited increased delta band power predominantly in occipital areas (Lindberg et al., 2005). Thus, we speculate that the extensively increased FC pattern in slow-wave bands may correlate with significant cognitive control deficits and could serve as a biomarker for predicting violent tendencies.
Graph theory analysis
Global network metrics
The brain functional networks in both the VD and NVD groups showed reduced global integration and communication efficiency, with a more noticeable decrease in the VD group. Although these differences did not reach statistical significance, it is worthy of further study in the future with a larger sample size. In contrast, increased clustering metrics, including Cp and Eloc in the VD group, indicate pathological hyperconnectivity in local clusters (Supekar et al., Reference Supekar, Uddin, Khouzam, Phillips, Gaillard, Kenworthy and Menon2013) and a higher segregation level of the brain networks (Teles et al., Reference Teles, Maximo, Lahti and Kraguljac2024). Furthermore, the values of Cp and Eloc in total and beta band were positively correlated with scores of impulsivity, automatic thought, anger, and aggression, suggesting the pathological hyperconnectivity in clusters may be associated with violent behaviors and serve as potential markers for violence risk.
Nodal network metrics
The VD group exhibited significantly higher aNe in the alpha1 spectrum at the PO8 node (MOG) compared to both NVD and HC groups. Dysfunction in the MOG could lead to disorganized sensory processing and information integration (Wang et al., Reference Wang, Yang, Cai, Zhou, Zhang, Yang and Chan2020). There was also a study reporting that dysfunction in MOG was associated with aberrant explanation of emotional stimuli (Wang et al., Reference Wang, Zou, Xie, Yang, Zhu, Cheung and Chan2019) and emotion dysregulation (Wang, Zhang, et al., Reference Wang, Zhang, Wang, Cao and Zhang2024). Our study found that elevated aNe in MOG was positively correlated with scores on multiple clinical scales, particularly the MOAS (r = 0.33). Hence, we speculate that a significantly increased aNe in MOG may lead to impaired emotional processing, thereby contributing to violent behavior, potentially serving as a biomarker for predicting aggression in depressed patients. In contrast, the VD group exhibited significantly reduced aNe at the Pz node (SPL) compared to both the NVD and HC groups. Studies have identified decreased aNe in the SPL in patients with MDD (Zhang et al., Reference Zhang, Kranz, Zou, Deng, Huang, Lin and Lee2020), which was related to anhedonia (Wang, Zhou et al., Reference Wang, Zhou, Nie, Deng, Gong, Ma and Liu2024). We, therefore, speculate that more pronounced anhedonia may be associated with increased violence risk, although the specific underlying mechanisms require further investigation.
Right-hemispheric lateralized dysregulation
Right-hemispheric lateralization was observed in graph theory analysis in both the VD and NVD groups. All nodes with abnormalities in the graph theory analysis were located in the right hemisphere or midline. Previous study has shown stronger right-hemispheric activation during processing of negative emotion, especially fear and aggression (Leliveld et al., Reference Leliveld, Langbein and Puppe2013). Right-lateralized hemispheric dysfunction has also been related to cognitive deficits in patients with depression (Kawasaki et al., Reference Kawasaki, Tanaka, Wang, Hokama and Hiramatsu2004; Kucharska-Pietura & David, Reference Kucharska-Pietura and David2003; Rey et al., Reference Rey, Tomer, Levin, Sanchez-Ramos, Bowen and Bruce1995). The results of the present study, to some extent, support the hypothesis of right-lateralized cerebral dysfunction in depression. Such dysfunction can affect emotional processing, perceptual integration, and social cognition (Kucharska-Pietura & David, Reference Kucharska-Pietura and David2003). However, whether right-hemispheric lateralized dysregulation was associated with elevated violence risk warrants further investigation.
Limitations and future directions
There were several limitations that should be considered when interpreting the findings. First, due to the limited source of subjects, the sample size was relatively small. Second, we cannot completely rule out medication effects on EEG amplitudes in patients with depression. Third, the violent group in this study comprised solely of individuals with violent criminal offenses and was not stratified by their level of violence risk. Future studies could enroll more homogeneous samples with different levels of violence risk to systematically elucidate EEG biomarkers associated with violent behaviors in patients with depression. Future studies could enroll more homogeneous samples with different levels of violence risk to systematically elucidate EEG biomarkers associated with violent behaviors in patients with depression.
Conclusions
This study examined resting-state EEG features in depressed patients with violent behavior (VD), nonviolent depressed patients (NVD), and HCs. Results showed that the VD group exhibited increased microstate A and had difficulties in the transition between sensation- and information-processing network, as well as between self-referential activities and task-related cognitive and emotional regulation. Elevated violence risk may be associated with more severe disruptions in FC within the frontal lobe and in the frontoparietal network. These electrophysiological alterations are closely associated with clinical deficits in emotional regulation, executive function, and inhibitory control. This association may explain the emergence of symptoms like irritability, hypervigilance, and anhedonia, which in turn increase the propensity for violence. Therefore, these EEG characteristics show promise as biomarkers that could subserve violence risk assessment in depression. Future studies should recruit larger, homogeneous cohorts with different levels of violence risk to systematically elucidate the EEG biomarkers associated with violent behavior in patients with depression.
Supplementary material
The supplementary material for this article can be found at http://doi.org/10.1017/S0033291725102730.
Data availability statement
The raw data supporting the conclusions of this article will be made available by the authors, without undue reservation.
Acknowledgments
The authors would like to extend their gratitude to all participants and all those who supported this research.
Author contribution
Yingying Xie: Investigation, Data curation, Formal analysis, and Writing – original draft. Wenqian Lu: Investigation, Data curation and Visualization. Jiaxun Chen: Investigation, Data curation, and Visualization. Shuna Tan: Investigation and Visualization. Tianyi Ma: Investigation and Visualization. Yan Gu: Investigation and Supervision. Yan Li: Investigation and Supervision. Ganqing Li: Conceptualization, Methodology, investigation, Data curation, Writing – original draft, Writing – review and editing, Supervision and Funding acquisition.
Funding statement
This work was supported by Shanghai Key Laboratory of Forensic Medicine and Key Laboratory of Forensic Science, Ministry of Justice (KF202515); Sichuan Science and Technology Program (2023YFS0425); and the National Natural Science Foundation of China (81901928).
Competing interests
The authors declare none.
Ethical standard
The studies involving human participants were reviewed and approved by the Medical Ethical Committee of Sichuan University (K2022004).


 Open access