


Introduction
Pollsters and survey researchers have asked Canadians about their voting intentions for more than 75 years. These survey datasets are a treasure trove for political scientists, and in recent years, hundreds of historical polls have become available in open-access datasets.Footnote 1 Unfortunately, however, the “startup costs” involved in downloading, cleaning and integrating hundreds of distinct surveys have been prohibitive, and even when publicly accessible, the full depth and breadth of these datasets remain untapped.
To help solve this problem, we have created an integrated dataset of 680 surveys conducted by the Canadian Election Study, the Consortium on Electoral Democracy, Environics, Gallup and Pollara between 1945 and 2023. This publicly available data source—the Canadian Vote Intention Dataset—contains two variables related to Canadians’ federal voting behaviour (vote choice and vote intention) along with demographic indicators (age, gender, education, occupation, religion, language, union membership) and place types (province, region, community size). With more than one million observations, the dataset enables novel research on the long-term development of party systems, voting behaviour, and electoral cleavages in Canada, but also allows for rich analysis of groups that are often too small to be accessible to survey researchers, such as specific cross-sections of demographic groups (for example, young women with degrees, N=15,137) or small geographic areas (for example, Prince Edward Islanders, N=7,436). To maximize the comparability of estimates across years, we have developed custom annual weights for the integrated dataset. We have also developed an R package and an interactive online application to make the data maximally accessible to researchers, students and the wider public.
In this research note, we detail the development of the Canadian Vote Intention Dataset, including our decisions on variable selection, data cleaning and coding, survey weights, data missingness, and our R package and online application. We then illustrate the potential for the dataset by describing the long-term development of three major demographic divides in Canadian electoral politics: gender, education and community size gaps in vote intention. We conclude by discussing opportunities for further research using the dataset and describe our plans to add additional variables to the dataset in the future.
Canadian Survey Data: Integration and Cleaning
Political scientists have employed integrated versions of publicly available datasets for many years (Gethin et al., Reference Gethin, Martínez-Toledano and Piketty2022; Stephenson et al., Reference Stephenson, Harell, Rubenson and John Loewen2021). Dozens—perhaps hundreds—of books and articles have employed data from multiple Canadian Election Study surveys to explore important questions of Canadian voting behaviour (Daoust and Gareau-Paquette, Reference Daoust and Gareau-Paquette2023; Fournier et al., Reference Fournier, Neil Nevitte, Blais and Everitt2012; Merolla and Stephenson, Reference Merolla and Stephenson2007; Polacko, Reference Polacko2020), political culture (Blanchard, Reference Blanchard2023), polarization (Johnston, Reference Johnston2023; Lachance and Beauvais, Reference Lachance and Beauvais2024; Merkley, Reference Merkley2022) and party systems (Johnston, Reference Johnston1992; Reference Johnston2017).Footnote 2 A number of enterprising scholars have integrated Gallup Canada surveys into combined datasets to study economic voting and political business cycles (Bélanger and Gélineau, Reference Bélanger and Gélineau2010; Gélineau and Bélanger, Reference Gélineau and Bélanger2005; Jones et al., Reference Jones, Ørregaard Nielsen and Popiel2014; Johnston, Reference Johnston1999; Monroe and Erickson, Reference Monroe and Erickson1986), issue ownership (Bélanger, Reference Bélanger2003), campaign effects (Pickup, Reference Pickup2010) and other election-related themes (Bélanger and Godbout, Reference Bélanger and Godbout2010; Loewen and Bastien, Reference Loewen and Bastien2010). While this research is foundational to Canadian political science, it has often involved herculean data coding and integration efforts by the researchers involved, preventing widespread use of available data in both published research and university classrooms. Our purpose in assembling the Canadian Vote Intention Dataset is to radically lower the “barriers to entry” for researchers who wish to make use of historical survey data in their work.
More specifically, our aim for the Canadian Vote Intention Dataset was to build an individual-level database of past federal vote intention surveys that covered as large a time span as possible, included as many demographic indicator variables as possible, and contained as many observations as possible. Optimizing across these three criteria involved trade-offs, the most important of which is the relatively small number of demographic variables available in Canadian survey datasets across the complete (or near-complete) 1945–2023 period. If a researcher sought to integrate available data for the time period since 1995 or 2000, it would be possible to add additional demographic variables (such as racial identity) that are simply not available in a sufficiently consistent format over the longer period. We chose instead to cover the full available time span with a more limited number of demographic variables, allowing us to ensure that the demographic variables that are included are as consistently measured as possible. More practically, this decision also allowed us to carry out the necessary data cleaning and correction in the variable coding, including, in several cases, identifying and correcting errors in the original datasets.
A second trade-off was more practical: while historical polling data are available from many firms, particularly in more recent years, each firm has its own distinctive variable naming procedures, data management protocols and coding practices. This means that there are substantial time costs involved in familiarizing oneself with the distinctive traditions of each firm. For this reason, we decided to focus our attention on a suite of sources that would offer a large number of observations (N=1,019,639) over a relatively long timespan: Gallup/CIPO (1945–2000, N=521,190), the Canadian Election Study (1965–2021, N=125,534), Environics Focus Canada (1978–2013, N=271,109), Pollara Perspectives Canada (1992–2002, N=62,764), and the Consortium on Electoral Democracy’s annual Democracy Checkup series (2019–2023, N=39,042). There are, to be sure, other publicly available surveys in Canada that contain a vote intention variable (our central criteria for inclusion). To our knowledge, however, these sources represent the largest publicly available collections that (a) cover a relatively long timespan and (b) include broadly similar demographic variables. Together, these sources comprise more than one million observations and 680 distinct individual datasets.
To prepare these datasets, we first created a metadata file for each of our five major sources, containing variable names, coding information, variable and value labels, and dates for every question ever asked in each survey. Then, using a combination of automated and hand coding, we identified the “vote intention” variable in each survey, defined as a question asking individuals to indicate how they will vote in an upcoming federal election or how they would vote if a federal election were held today. We then created a coding protocol for all major and minor parties from 1945–2023 (folding some of the very minor parties into a consolidated “other” category) and recoded each unique vote intention question into a consistent coding scheme. We then replicated this variable identification and recoding procedure for each of the other variables in the dataset, including vote choice (how the respondent voted in the most recent federal election), age, education, genderFootnote 3, languageFootnote 4, religionFootnote 5, occupationFootnote 6, union household, community size, province and region.Footnote 7 The dataset also includes variables capturing the survey mode (face-to-face, telephone and online) and the survey date.Footnote 8 We provide a complete codebook for the dataset and additional details about the coding protocol in the supplementary material.Footnote 9
Having created these consistently coded variables, we then carried out many diagnostic tests, most of which involved plotting the distribution of every value of each variable over time (for example, men and women; union and non-union households; and so forth) to check for discontinuities and other oddities and to ensure that no “wild codes” (variable values that were not in our coding scheme) appeared in the data. We also thoroughly checked patterns of missingness in our recoded data relative to sample sizes in the raw data to ensure that no available data had been overlooked. These iterative diagnostic tests turned up several errors—some in our coding procedures and others in the original datasets—which we then corrected in as systematic a fashion as possible (that is, by correcting our original coding procedure rather than by means of post-hoc “hacks” to correct errors).Footnote 10 While errors surely remain in the dataset—and we will actively correct and update the dataset if they emerge—we are pleased to have been able to improve upon the original raw data files, in some cases, as a result of our in-depth diagnostic work.
While our dataset covers an exceptionally long time span and contains a very large number of observations, readers need to be aware of three insurmountable drawbacks of any data integration effort like this one. First, because our goal was to integrate as many surveys as possible into a single consistently coded dataset, we were forced to take a “lowest common denominator” approach on some variables, discarding information available in some sources but not others. For example, between the early 1950s and the early 1970s, Gallup did not collect or report a continuous age or year of birth variable. Instead, they reported respondents’ ages in three categories: 18 to 29, 30 to 49, and 50 or older. As a result, this three-category age variable became the main age category variable to which all other data were recoded. Of course, whenever available, we have also included a continuous age variable in our dataset, allowing researchers to construct their own age category variables to suit their purposes. For some other variables, however, such as religion and education, we were forced to collapse richer information into more simplified coding schemes to keep the coding consistent across the entire period. To gain the benefit of consistent individual-level analysis of demographic trends over the very long term, we must pay some cost in slightly simplified demographic variables.
A second insurmountable drawback is that the meaning of some variables does change over time because of subtle shifts in question wording in the original survey data. The most important example of this is in the case of education. Between 1992 and 1993, the proportion of individuals in the dataset with a degree surges upward, from 15% to 20%. This shift does not reflect a genuine increase of five percentage points in the proportion of Canadians with a degree (university education was increasing rapidly at this time, but not at this speed). Instead, it reflects a small shift in how the Gallup surveys asked the education question.Footnote 11 We report these coding changes in the technical documentation and codebook (available in the supplementary material) so that researchers can be aware of these shifts when using the data for analysis of changing demographic patterns of voting over time.
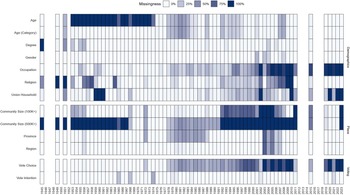
Finally, even within our more restricted set of demographic variables, not all variables are available every year. Figure 1 summarizes patterns of missingness for each variable in the dataset for every available year; light colours indicate very complete data with low levels of missingness, and dark colours indicate higher levels of missingness. As Figure 1 illustrates, some variables are consistently absent for specific stretches of time; the most notable of these absences is age, which, as we noted above, was not included in Gallup’s surveys between the early 1950s and the early 1970s. Missingness is more sporadic for the other variables in the dataset. In general, however, we have complete or nearly complete data for many variables in most years of the dataset.

Figure 1. Data Availability, by Year and Variable. Summary of missingness for each variable (rows) in each year (columns) in the dataset. Light colours indicate low levels of missingness (for example, complete data) and dark colours indicate higher levels of missingness.
Survey Weights
Survey research has changed dramatically since 1945 (Berinsky, Reference Berinsky2017; Butler, Reference Butler2018; Caughey et al., Reference Caughey, Berinsky, Chatfield, Hartman, Schickler and Singh Sekhon2020), and our data includes a combination of quota sampling, probability-based geographic sampling, random telephone sampling, and quota-based sampling from online panels. Moreover, while many of our datasets include survey weights, these weights apply only to the responses in a specific poll. In some cases, researchers with interests in a specific period or geographic region may wish to construct their own survey weights. However, we wanted to make reliable estimates available to the research community without requiring that researchers construct their own weights. We therefore include new weights in the Canadian Vote Intention Dataset which adjust the available observations to age-gender-region proportions each year.
We chose to focus on age-gender-region cell weights for two simple reasons. The first is survey data availability: we have age category, gender and region for the overwhelming majority of observations in the dataset, enabling standardized weights through the entire period of the dataset without losing many observations. The second is census data availability: annual estimates are available from Statistics Canada by age and gender in each province going back to the 1920s, allowing us to construct annual weights without relying on interpolation strategies between census years.
Given that we generally have a very good available sample size for each year in the dataset, we would expect that the dataset would require relatively modest adjustments to match the age-gender-region distributions in the Canadian population. Reassuringly, this is indeed the case, with more than 75 per cent of observations receiving weights between 0.8 and 1.3, more than 95 per cent of observations between 0.66 and 2, and 99 per cent of observations between 0.55 and 5.Footnote 12 Given that these weights require very little inference—they allow us to use available annual census data together with consistently available demographic indicators—we see them as a safe approach for default use by researchers.Footnote 13 Additional strategies are of course available (see Caughey et al., Reference Caughey, Berinsky, Chatfield, Hartman, Schickler and Singh Sekhon2020) if researchers wish to pursue alternative weighting techniques for specific research projects.
Data Availability and Use
Our dataset is available for use by other researchers in three main formats. The first is simply the full data file, with accompanying documentation, which is available on the Canadian Opinion Research Archive.Footnote 14 This full dataset grants researchers the full flexibility to add or remove variables, create customized survey weights, or build models based on their own research interests.
Our data are also available to researchers in a new R package (“cvpa”), which can be installed by any researcher at no cost and contains the survey dataset along with a set of functions to easily enable weighted estimates of party support over time, including estimates among demographic subsamples. One function, “wtd_vote,” creates weighted estimates of party support for specified demographic groups, and a second function, “gap_analysis,” creates statistical estimates of the difference in support among demographic group members for each party. Each figure in the next section was generated using these two functions.
Finally, we have developed an interactive online app (available at https://quantoid.shinyapps.io/cvpa_app/) to allow users to explore patterns of support for each party without the use of any statistical software or coding. Users can explore long-term patterns of vote intention and vote choice in Canada, break down the party support by demographic groups (for example, women and men, older and younger Canadians, Catholics and Protestants) and see estimates of the differences between groups in party support. We anticipate that this app will be especially useful for instructors who wish to share results from the Canadian Vote Intention Dataset with students.
Demographic Divides in Canadian Vote Intention
To provide readers with a better sense of the data analysis that is easily accessible with the Canadian Vote Intention Dataset, we conclude with a descriptive overview of three major demographic trends in Canadian electoral politics: support for federal parties by gender, educational attainment and community size. Each of these patterns is, of course, worthy of more in-depth analysis than we provide here. Our purpose is not to challenge established wisdom or develop new theories of demographics and vote choice, but instead to illuminate long-term trajectories of party support among important demographic groups at a time scale and level of precision that has not previously been possible.
We begin with gender. Important differences in men’s and women’s policy preferences and voting preferences have persisted across time and diverse policy domains in Canada (Erickson and O’Neill, Reference Erickson and O’Neill2002; Gidengil, Reference Gidengil1995; Shorrocks, Reference Shorrocks2018). Since the 1970s, women have tended to hold more left-leaning positions than men in various policy domains, particularly on social spending, market regulation, and conflict in foreign policy (Everitt, Reference Everitt1998; Franceschet, Lucas and Rayment, Reference Franceschet, Lucas and Rayment2024; Gidengil et al., Reference Gidengil, Blais, Nadeau and Nevitte2003), though variation within gender identities are often as important as variation across gender identities (Gidengil, Reference Gidengil2022). Much work remains to be done to understand the origin of these across-gender differences, their magnitude in different policy domains, and their relevance for voting behaviour.
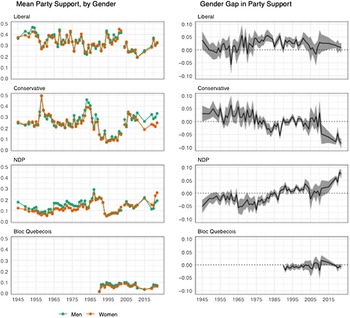
Figure 2 helps to illuminate the long-term development of gender gaps in voting behaviour by plotting support for each party among men (in green) and women (in orange) in the lefthand panels, and the gap between men’s and women’s support for each party in the righthand panels. Positive values in the “gender gap” panels indicate that women are more likely than men to support a given party, and negative values indicate that women are less likely than men to support the party. While the panels on the left suggest that men and women have followed very similar overall trajectories in their support for each party through time, the panels on the right reveal important gender gaps in party support. Since the mid-1970s, the Liberal Party has enjoyed a modest advantage among women, generally in the range of 3-5 percentage points, but this advantage appears to have faded in the early 2000s. The Conservative Party has followed a rather different trajectory, enjoying a slightly sporadic but important advantage among women in the early postwar years, reduced support among women through the Mulroney era, and a much sharper reduction in support among women in the Harper and post-Harper years, consistent with trends in vote choice for conservative parties broadly (Gidengil et al., Reference Gidengil, Hennigar, Blais and Nevitte2005; Oshri et al., Reference Oshri, Harsgor, Itzkovitch-Malka and Tuttnauer2023).

Figure 2. Party Support, by Gender, 1945-2022. Left-hand panels show mean support for each party among men (green) and women (orange). Right-hand panels show estimated gap between men and women in support for each party; positive values indicate that women are more likely than men to support the party; negative values indicate that women are less likely than men to support the party.
Perhaps the most striking story in Figure 2, however, is the long, slow, upward trajectory of women’s support for the New Democratic Party. In the mid-1960s, the New Democrats enjoyed substantially more support among men than among women, but this gender gap has reversed, slowly and steadily, in the decades that followed, consistent with the developmental theory of the gender gap (Inglehart and Norris, Reference Inglehart and Norris2000). Overall, the largest observed gender gaps in the entire figure are women’s support for the NDP in 2021 and 2022, and men’s support for the Conservatives in 2019 and 2022, illustrating that gender gaps play an especially important role in Canadian voting behaviour today.
Our data permit a similar summary of “education gaps” in party support, an area of increasing attention in comparative political science (Gethin et al., Reference Gethin, Martínez-Toledano and Piketty2021). Class divides—including voting differences between those with and without university degrees—have been a subject of attention among Canadian political scientists for decades (Fletcher, Reference Fletcher1990), with important recent research on the timing and consequences of the “degree gap” in recent voting behaviour (Kiss et al., Reference Kiss, Polacko and Graefe2023; Polacko et al., Reference Polacko, Kiss and Graefe2022). Figure 3 summarizes these education-based voting patterns over time. The figure is structurally identical to Figure 2, with mean support on the left and gaps on the right. In this case, positive values in the education gap figures on the right indicate that respondents with university degrees are more likely than those without degrees to support the party, and negative values indicate that the party enjoys more support from those without degrees.

Figure 3. Party Support, by Education, 1945–2022. Left-hand panels show mean support for each party among Canadians without university degrees (green) and those with university degrees (orange). Right-hand panels show estimated gap between those with and without degrees in support for each party; positive values indicate that university-educated respondents are more likely than those without degrees to support the party; negative values indicate that university-educated respondents are less likely than those without degrees to support the party.
Figure 3 offers an intriguing long-term story as well as various striking shorter-term episodes. In the case of the Liberal Party, we see a distinct upward spike in support among university-educated respondents from the late 1950s through to the early 1970s: the Pearson and early Trudeau era, when the Liberal Party was internally restructured by, and reoriented towards, the country’s newly emerging professional and educated urban and suburban classes (Wearing, Reference Wearing1981). This advantage faded in the 1980s as educated Canadians turned their support towards the Mulroney Conservatives, but returned in the 1990s. Since the formation of the new Conservative Party in 2004, the Liberal Party has enjoyed a consistent advantage among educated Canadians, and the Conservative Party has had a nearly symmetrical advantage among those without university degrees. Of course, these education gaps are especially important for political outcomes today; whereas only a tiny fraction of Canadians held university degrees in the 1960s, more than a third of adult Canadians—and well over two-thirds in some federal electoral districts—hold degrees today.
Finally, Figure 4 compares patterns of support across community size from 1945 to 2022. Attention to urban-rural divides has been growing considerably in recent years, and recent research has used aggregate federal election data to show that urban-rural divides have been especially prominent in Canadian voting in the 1960s and the period since the mid-1990s (Armstrong et al., Reference Armstrong, Lucas and Taylor2022; Taylor et al., Reference Taylor, Lucas, Armstrong and Bakker2023). The results in Figure 4 reflect a slightly different estimate from the earlier studies, for two related reasons: first, the binary difference between voters in communities below and above 100,000 in population represents a different quantity from the difference between voters in the least and most urban federal districts (Taylor et al., Reference Taylor, Lucas, Armstrong and Bakker2023); and second, the meaning of a community of 100,000 has changed from one representing a distinctly urban place in the early 1950s to one representing a small city today (Armstrong et al., Reference Armstrong, Lucas and Taylor2022). Even so, the results in the figure add valuable annual data to the earlier studies, suggesting that the Liberal Party began to assemble its large-community advantage already in the late 1950s, saw the advantage fade away over the next two decades, only to return in the mid-1990s. The New Democratic Party’s small but frequent advantage in larger communities—a finding that contrasts somewhat from earlier studies—suggests that the NDP may perform well in somewhat larger communities even as the Liberal Party dominates in the country’s most densely populated urban places.

Figure 4. Party Support, by Community Size, 1945–2022. Left-hand panels show mean support for each party among those living in communities below 100,000 in population (green) and those above 100,000 in population (orange). Right-hand panels show estimated gap between community sizes in support for each party; positive values indicate that those in larger communities are more likely to support the party; negative values indicate that they are less likely to support the party.
Conclusion
We hope that the Canadian Vote Intention Dataset will stimulate considerable new research on the long-term development of Canadian electoral politics. We see many opportunities for research that build upon the illustrative descriptive analyses offered here.
Perhaps most obviously, researchers could explore long-term patterns of federal vote intention and vote choice in other important demographic groups. The dataset is well-equipped for studies of the size, development and eventual disappearance of the famous Catholic-Liberal connection (Blais, Reference Blais2005; Johnston, Reference Johnston2017). It is equally well-suited for detailed analyses of party support by province and region, language and union versus non-union support. Given the size of the dataset, more in-depth subgroup analyses (such as French speakers outside Quebec) are also possible over very long timespans. In general, we hope that the Canadian Vote Intention Dataset will help to establish a set of robust descriptive estimates of the magnitude, direction and long-term development of demographic trends in Canadian voting, including patterns of demographic sorting across multiple groups and identities (Kevins and Soroka, Reference Kevins and Soroka2018; Merkley, Reference Merkley2022), and to motivate more in-depth causal studies of these descriptive findings.
Our data can also be merged with supplementary data to answer other important research questions. For example, information on the gender of party leaders, high-profile party caucus members or the gender composition of party caucuses could be combined with the dataset to enable new analyses of the presence or absence of gender affinity voting in Canadian party support (Gareau-Paquette et al., Reference Gareau-Paquette, Amanda Léal, Taylor, Vandewalle and Dassonneville2024; Goodyear-Grant and Croskill, Reference Goodyear-Grant and Croskill2011). Annual data about the Canadian economy—at the federal, regional or provincial scales—could be merged with the vote intention data to support research on economic voting, incumbent support and macro-responsiveness (Bélanger and Gélineau, Reference Bélanger and Gélineau2010; Kendall and Rekkas, Reference Kendall and Rekkas2012; Soroka and Wlezien, Reference Soroka and Wlezien2009). Data on group appeals in Parliamentary speeches (Beelen et al., Reference Beelen, Timothy Alberdingk Thijm, Kees Halvemaan, Michael Kimmins, Maarten Marx, Rheault, Polyanovsky and Whyte2017) might be used to understand how ordinary citizens respond to explicit group appeals by political elites (Dausgaard and Hjorth, Reference Dausgaard and Hjorth2024). We see major new opportunities for rigorous causal inference by strategically mobilizing these supplementary datasets.
Finally, we see important opportunities to expand the Canadian Vote Intention Dataset itself, particularly by adding information on Canadians’ policy attitudes to the demographic and voting variables that are currently available. We are presently at work on this expanded dataset and have already built the functionality for policy issue data into the available R package and online app. We anticipate that researchers will have access to a large suite of policy attitude questions as part of the dataset within the next twelve months. These policy questions will make the dataset useful not only for more in-depth vote choice analyses, but also for researchers who wish to explore how Canadians’ attitudes on specific policy issues—from macroeconomic policy to women’s inclusion to gun control—have evolved in Canada over the long term.
Supplementary material
For supplementary material/s referred to in this article, please visit https://doi.org/10.1017/S0008423925000241
Acknowledgments
This research is supported by a SSHRC Insight Development Grant (IDG 430-202300595). We are grateful to the anonymous reviewers, Sophie Borwein, Richard Johnston, Eric Merkley, and Matthew Polacko for advice and feedback on earlier drafts of this manuscript.


 Open access