


1. Introduction
Measuring political attitudes in authoritarian regimes, such as popular support of political figures and government policies, has long posed an acute challenge to researchers because of social desirability bias. To address these concerns, scholars have developed innovative methodological advancements aimed at reducing its influence in recent years. Some have proposed experimental methods, such as list experiments, endorsement experiments, and randomized responses, to mitigate social desirability bias in public opinion data (e.g., Gonzalez-Ocantos et al., Reference Gonzalez-Ocantos, de Jonge, Meléndez, Osorio and Nickerson2012; Blair et al., Reference Blair, Christine, Malhotra and Jacob2013, Reference Blair, Imai and Lyall2014; Meng et al., Reference Meng, Pan and Yang2014; Nicholson and Huang, Reference Nicholson and Huang2023; Carter et al., Reference Carter, Carter and Schick2024). Others have turned to the Implicit Association Test, which reveals citizens’ implicit attitudes toward the regime (Truex and Tavana, Reference Truex and Tavana2019; Huang et al., Reference Huang, Intawan and Nicholson2022).
Nevertheless, few researchers systematically investigate an inconvenient truth simmering beneath the surface of a recent methodological innovation—any regression analysis where the outcome variable suffers from social desirability bias is likely to generate biased estimates of the key explanatory variable. The crux of the issue is that when social desirability bias generates nonrandom measurement errors in the dependent variable, regression analysis yields biased estimates of the independent variable.
How much confidence can then be placed in the findings derived from prior studies reliant on statistical analyses of direct questions that suffer from social desirability bias, such as popular support in authoritarian regimes? The answer to this question generates broad substantive and empirical implications. From a substantive perspective, scholars and policymakers have maintained a longstanding interest in understanding the sources of popular support for authoritarian governments, proposing mechanisms like targeted public spending, patronage, and clientelism. If, however, the estimate of key explanatory variables was subject to social desirability bias in the regression analysis, the empirical foundation of these prominent arguments may rest on an uncertain footing. Empirically, cross-national public opinion data, such as the World Value Survey, Asianbarometer, Afrobarometer, Latinobarometro, and LAPOP, are widely used by scholars who study political attitudes in authoritarian regimes. If social desirability bias generates systematic bias of the key explanatory variable in regression analysis, a devastating implication is that any regression result based on these public opinion data is problematic despite years of intellectual and financial investment.
The debate about political trust in China exemplifies the crucial implications of bias stemming from social desirability bias in the outcome variable. Scholars have identified a puzzling high level of citizen trust in the Chinese government across public opinion surveys despite rampant governance issues.Footnote 1 In search of explanations, those who engage in one prominent argument maintain that Chinese citizens’ high level of political trust stems from government performance, ranging from economic growth to public goods provision.Footnote 2 Nonetheless, other scholars question the accuracy of measuring political trust in these surveys and turn to experimental methods to solicit citizens’ genuine level of political trust in China; yet, these studies offer mixed results. On one hand, some experimental studies demonstrate that item nonresponse and preference falsification have inflated citizen trust in the Chinese government;Footnote 3 on the other hand, other experimental evidence suggests that political fear cannot adequately explain the seemingly high level of trust in the government.Footnote 4 To our knowledge, few existing studies systematically evaluate the extent to which social desirability bias affects empirical findings on the impact of various factors on political trust in China.
Leveraging two face-to-face nationally representative surveys in China, one of which contains a list experiment, we empirically investigate the bias in the estimates of key explanatory variables from regression analysis when the dependent variable suffers from preference falsification. Although a list experiment is by no means the silver bullet to resolve the social desirability bias in public opinion data, it remains one of the most widely used techniques for eliciting truthful responses in a challenging research environment.Footnote 5 Importantly, our research design involves comparing coefficient estimates of the same explanatory variable in regression analyses using “uncorrected” data (i.e., responses to direct questions) with those from “corrected” data (i.e., list experiment). The underlying assumption is that if direct questions do not suffer from social desirability bias, estimates of the explanatory variable in the regression analyses for both types of data would exhibit similar signs and be statistically indistinguishable. Instead, our empirical investigation casts doubt on the validity of existing empirical evidence suggesting that expansion of social welfare enhances Chinese citizens’ trust in local government officials. Specifically, our analysis of survey data from a direct question corroborates the statistical evidence in previous studies showing positive correlations between social welfare expansion and trust in local officials. Nonetheless, these correlations disappear—or even have the opposite sign and statistical significance—when we analyze data from a list experiment. Importantly, we extend our regression analysis to trust in the central government in China and other issues in non-China settings, and we consistently arrive at similar conclusions.
Are experimental methods the only viable approach to addressing social desirability bias in public opinion surveys? We explore alternative pathways, specifically several common identification strategies, to assess their potential in mitigating bias in regression analyses that rely on direct questioning. On one hand, we find some suggestive evidence that individual fixed effect models (FE), difference-in-differences (DID), regression discontinuity (RD), and instrumental variables (IV), to a lesser degree, could produce estimates comparable to those reported when analyzing list experiment data. On the other hand, we show that the use of matching methods and multiple imputation is inadequate. Although these pieces of evidence are merely suggestive, they offer crucial implications for scholars to explore diverse research designs aimed at addressing potential bias in estimates stemming from regression analysis of observational data.
Our paper contributes to two strands of literature. Our empirical investigation reveals that evidence supporting the conventional wisdom of performance legitimacy in China could be based on biased empirical findings. Crucially, our empirical analyses shed light on the puzzling coexistence of low trust in local officials alongside the expansion of social welfare programs in the last two decades in China. Our findings reveal that the expansion of these programs has not translated into greater trust in local officials, who remain the primary targets of social unrest. Therefore, a reexamination of the foundations of political trust and regime support in China warrants further attention.
Our findings also generate crucial implications for the analysis of public opinion data in various domains across authoritarian regimes. We highlight some practical solutions for the design and analysis of public opinion surveys in nondemocratic regimes to mitigate bias in regression analysis resulting from social desirability bias. A common approach to address social desirability bias involves the use of various experimental methods, but these methods could be hampered by three constraints: First, the experimental approach could encounter formidable financial constraints, especially for junior scholars. Second, scholars frequently grapple with the challenge of feasibility in implementation in authoritarian regimes and are often constrained to conducting online survey experiments that are limited to a subset of the general population. Third, experimental approaches do not offer strategies to mitigate social desirability bias in conventional survey data. Our paper offers some potential solutions to remedy the use of existing public opinion data to some extent, which could be beneficial for future studies of public opinion in nondemocratic regimes. The main takeaway from our paper is that using the proper identification strategies—if the underlying assumptions are met—could help mitigate this issue to some extent.
2. Preference falsification and bias in regression analysis: an analytical framework
In this section, we underscore the challenges of analytically discerning the direction of bias in existing regression analyses when the dependent variable is subject to social desirability bias. To ground our argument in real-world examples, we illustrate this issue through studying the effect of social welfare programs on political trust in China. We demonstrate that the direction of bias in regression analysis is inherently ambiguous ex ante because it depends on the correlation between the propensity toward social desirability bias and  ${X_i}$.
2.1. Social welfare and political trust in China
Assessing government popularity through public opinion surveys in nondemocracies has always been a challenge, and doing so for China is no exception. Researchers have commonly used a survey question soliciting Chinese citizens’ trust in state or party institutions or officials as a proxy. Surveys conducted by domestic and foreign researchers since the 1990s have consistently shown a high level of citizen trust in the Chinese government, and the trust in the central government has been consistently higher than that in local governments.Footnote 6
The puzzling high level of citizen trust in the Chinese government motivates scholars to offer a wide range of arguments. We focus on one prominent argument involving the notion of performance legitimacy: Chinese citizens’ political trust stems from government policies that enhance individual well-being (Zhao, Reference Zhao2009; Bell, Reference Bell2015). This argument follows the classic model of popular support that emphasizes value orientations and performance evaluations (Easton, Reference Easton1965). One signature policy initiative under the Hu Jintao and Wen Jiabao adminsitration is the campaign of building a “harmonious society,” which in turn vastly expanded social welfare and public goods in China since the early 2000s. For instance, in 2006, the Chinese central government eliminated tuition and fees for all students in compulsory education. Concurrently, the government expanded healthcare and pension coverage, particularly in rural areas.
Scholars have investigated the effects of these policies on political trust in China and found mixed results. On one hand, some scholars find support that these social policies have enhanced citizen trust in central and local governments (Dickson et al., Reference Dickson, Landry, Shen and Yan2016; Huang and Gao, Reference Huang and Gao2018; Li and Wu Reference Li and Wu2018; Turiel et al., Reference Turiel, Cunningham and Saich2019). On the other hand, other scholars have uncovered a minimal effect of these policies on political trust of local officials, primarily attributing this phenomenon to the information environment in China, wherein Chinese citizens tend to credit the central government for these policy initiatives (Lü, Reference Lü2014; Yang and Shen, Reference Yang and Shen2021). As demonstrated in the next section, the mixed results could also stem from social desirability bias in the survey data.
2.2. The propensity toward social desirability bias in Chinese survey data
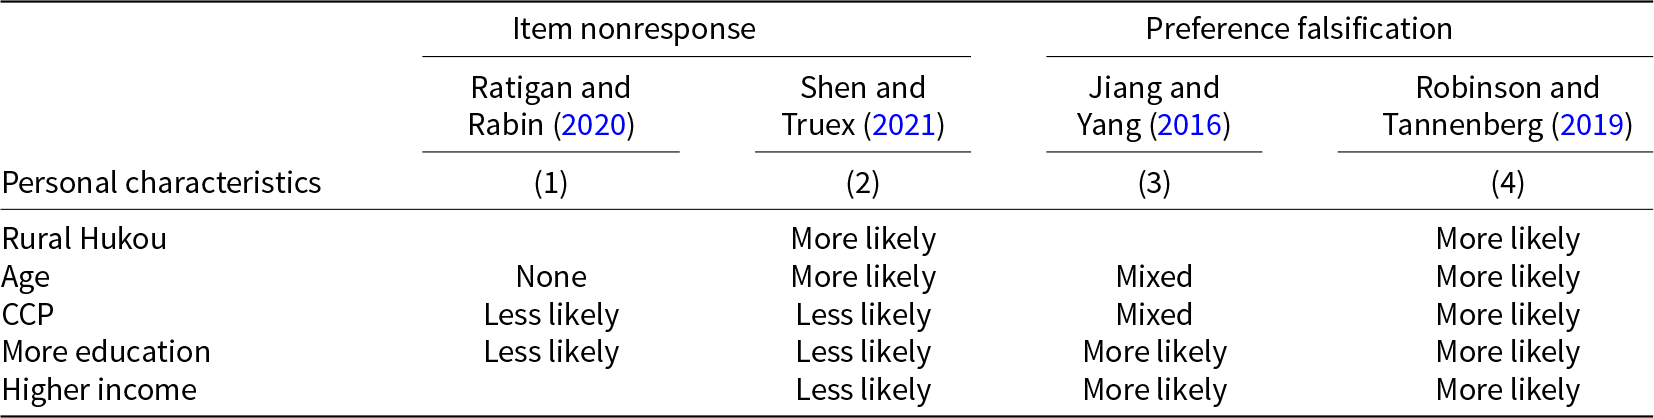
Recent scholarship has shown that survey responses concerning political trust in China are likely subject to social desirability bias. This challenge could be particularly acute in face-to-face interviews, where respondents are more likely to withhold truthful answers to sensitive questions. We highlight the findings of two studies on item nonresponses (Ratigan and Rabin, Reference Ratigan and Rabin2020; Shen and Truex, Reference Shen and Truex2021) and two studies on preference falsification (Jiang and Yang, Reference Jiang and Yang2016; Robinson and Tannenberg, Reference Robinson and Tannenberg2019). For simplicity, we focus mainly on five personal characteristics commonly evaluated in these studies: (1) urban hukou (i.e., household registration status), (2) age, (3) Chinese Communist Party (CCP) membership, (4) education, and (5) individual‒household income.
Table 1 synthesizes findings from these studies, revealing conflicting evidence regarding the influence of personal characteristics on the likelihood of social desirability bias. Although these conflicting findings may stem from variations in sampling strategies, outcome variables, and empirical strategies,Footnote 7 the absence of a clear consensus on which populations are more prone to social desirability bias remains a troubling concern. Specifically, these inconsistencies underscore the difficulty of effectively controlling for variables contributing to social desirability bias in regression analysis. For instance, CCP membership is surprisingly less likely to be associated with item nonresponse, but the results are mixed for preference falsification. In addition, age has the most inconsistent effect on social desirability bias. Shen and Truex (Reference Shen and Truex2021) discover that older individuals are more prone to refuse to answer sensitive questions, but Robinson and Tannenberg (Reference Robinson and Tannenberg2019) and Jiang and Yang (Reference Jiang and Yang2016) observe that individuals across age groups demonstrate varying degrees of preference falsification. For education level, both Ratigan and Rabin (Reference Ratigan and Rabin2020) and Shen and Truex (Reference Shen and Truex2021) find that less educated respondents are more likely to refuse to answer sensitive questions, but Jiang and Yang (Reference Jiang and Yang2016) find that more educated respondents have a higher propensity to falsify their preferences. Robinson and Tannenberg (Reference Robinson and Tannenberg2019) present evidence of preference falsification for both those with and without college degrees.
Table 1. Propensity toward Social Desirability Bias in Chinese Survey Data

Note: This table reports the propensity toward social desirability bias as the value in the attributes of personal characteristics increases. An empty cell indicates the attribute was not evaluated in the study. Ratigan and Rabin (Reference Ratigan and Rabin2020) assess the correlation between personal characteristics and item nonresponses in data from four different surveys, and Column (1) is a synthesis of the results based on trust in officials (Tables 1, 2, and 4). Column (2) is a summary of findings in Figures 4‒5 in Shen and Truex (Reference Shen and Truex2021). Note that they do not directly evaluate the effect of income; we use social class as the proxy for income. Column (3) reports the results based on Figure 6 in Jiang and Yang (Reference Jiang and Yang2016). Finally, Column (4) is based on the results reported in Figure 3 in Robinson and Tannenberg (Reference Robinson and Tannenberg2019). Note that they evaluate four survey questions, and we focus mainly on the effect of social desirability bias on confidence in the national government.
Amid mixed evidence, Table 1 highlights a notable pattern: Some personal traits exhibit divergent behaviors when it comes to preference falsification and item nonresponse. Specifically, individuals at the higher end of the social strata (e.g., better educated, higher income, holding urban hukou) are consistently less likely to refuse to answer sensitive questions but are more likely to falsify preferences. Conversely, those who are at the lower end of social strata are more likely to refuse to answer than falsify preferences. These contrasting patterns indicate that the occurrence of item nonresponse may be influenced by factors like political knowledge and cognitive load in addition to considerations of social desirability bias. Specifically, individuals with less education or income and residence in rural areas may refuse to answer because they either do not understand the concepts in the questions (e.g., democracy, human rights) or the cognitive load of falsifying the answer is too high, and individuals with better education or income and living in urban areas may answer the questions with falsified responses. In other words, the phenomenon of item nonresponse may not necessarily imply social desirability bias but may instead indicate a lack of knowledge or information.
2.3. Biases in existing regression analysis
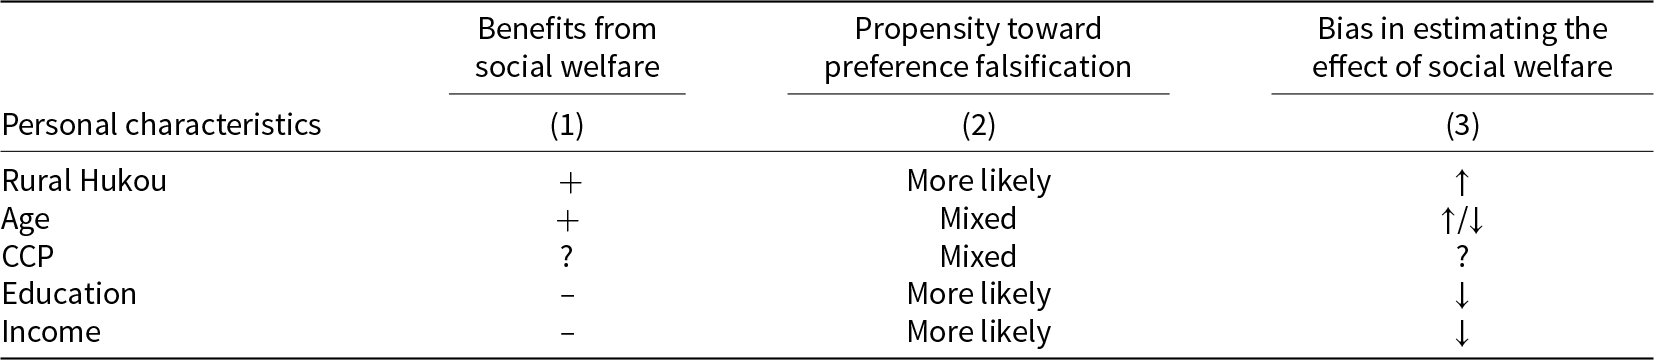
Since item nonresponse does not always indicate social desirability bias (Shamaileh, Reference Shamaileh2025), we now focus solely on bias in regression analysis when the key dependent variable—trust in government officials—exhibits preference falsification. In Table 2, we first indicate expected benefits from social welfare to Chinese citizens given their personal characteristics in Column (1). We then list the propensity toward preference falsification highlighted in Table 1 in Column (2). Finally, we suggest the direction of bias in regression analysis in Column (3).
Table 2. Potential bias in estimating the effects of social welfare on political trust

Note: “ +” indicates a positive correlation and “–” indicates a negative correlation. ‘↓’ indicates a downward bias in the estimate, and ‘↑’ indicates an upward bias in the estimate, and finally ‘?’ indicates an unclear direction for bias in the estimate.
Our analysis reveals the challenge of determining the direction of bias in the regression analysis because of the conflicting effects associated with the various personal attributes in Column (3), Table 2. For example, the expansion of healthcare insurance and the rural pension scheme benefit rural residents, especially the older population. Because Table 1 suggests that rural residents are more likely to falsely report higher trust, we expect an upward bias in the estimate of social policy. Nonetheless, the propensity toward preference falsification across age groups is mixed; hence, we may observe upward or downward bias. In addition, highly educated and wealthier individuals generally did not receive the benefits of social expansion as much as less educated and poorer respondents. Because highly educated and wealthier individuals are more likely to inflate their trust in the government, estimating the effect of social policy on citizen trust results in a downward bias. Finally, Table 2 reveals that not only does the propensity toward preference falsification generate a cross-cutting direction in bias of estimation stemming from regression analysis within the individual, but the overall direction and level of bias in the data also depend on the proportion of individuals with various attributes in the data.
3. Research design
Our research design is motivated by our primary objective to evaluate the impact of preference falsification when estimating the effects of social welfare programs on political trust through regression analysis. We focus on citizen trust of local officials in China for two reasons.
First, county-level governments play a pivotal role in delivering public goods and services, so the citizens are likely to evaluate county officials based on the quality of public goods and services. Second, citizens possess superior information about the performance of county governments based on their daily experiences, rendering their opinions of local politicians less susceptible to value orientation and social desirability bias in contrast to their views on national leaders. Importantly, if our investigation reveals a biased estimate in the analysis of county officials caused by social desirability bias, the extent of this bias would be even greater in the analysis of national government officials because of the more pronounced nature of social desirability bias at the national level.
3.1. Data
In our empirical investigation, we rely primarily on two nationally representative surveys in China. To solicit genuine responses about political trust, we use the responses to a list experiment embedded in the 2015 China Household Finance Survey (CHFS), a national, biennial, longitudinal survey administered by the Research Center at the Southwestern University of Finance and Economics in China since 2011. As our benchmark, we use a direct question regarding political trust from the 2014 China Family Panel Studies (CFPS). This is a nationally representative, biennial, longitudinal survey initiated in 2010 by the Institute of Social Science Survey at Peking University.
We find three primary advantages to using the 2014 CFPS data with a direct question as the benchmark compared to the 2015 CHFS data with the list experiment. First, both the CHFS and CFPS surveys solicited information about citizen trust in county and district officials, therefore mitigating potential differences due to survey design when some nationally representative surveys in China solicit citizen trust in national and local governments, while others focus on officials. Second, none of the other widely used nationally representative surveys in China was conducted in 2015, and they have a smaller sample size (typically around 3000);Footnote 8 the 2014 CFPS was conducted in the year closest to the 2015 CHFS, and both have a large sample size (30,831 responded to our 2015 CHFS and 37,147 to the 2014 CFPS). Third, these two surveys share many similar properties: both (1) are nationally representative surveys covering both urban and rural areas, (2) are the result of similar multistage probability sampling, (3) employ the same survey mode (face-to-face interviews).
As in other studies, our data have some limitations. First, the direct question and the list experiment were not embedded in the same survey. Hence, differences in estimation could result from sampling variation. To mitigate this concern, we restrict our analysis to the survey responses collected from the same set of prefectures in these two surveys. Specifically, the 2014 CFPS and 2015 CHFS covered 122 prefectures and 161 prefectures, respectively. Our sample restriction results in 74 prefecturesFootnote 9 surveyed in both the 2014 CFPS and 2015 CHFS, resulting in 12,156 respondents in the 2015 CHFS data and 14,368 in the 2014 CFPS data. Crucially, if variations in estimates between our analysis of CFPS and CHFS data were primarily driven by sampling variation, we would not have observed that certain identification strategies used in the analysis of 2014 CFPS data (Section 5.2) produce estimates comparable to those in the analysis of 2015 CHFS data (Section 4.2).
Second, these two surveys were conducted in different years, so the variation in responses could be driven by observed and unobserved change over time. To our knowledge, no significant political or economic events occurring in 2015 had an extreme impact on the effect of performance legitimacy in China. To alleviate the concern that differences in estimates are driven by temporal factors, we report the results from regression analysis of the 2016 CFPS data along with those of the 2014 data.
Third, a list experiment, along with all the other experimental approaches, is not a panacea to social desirability bias. First, measurement error may still exist, resulting from strategic and nonstrategic behaviors by some respondents. For example, some respondents may grasp the underlying intent when presented with the sensitive item in the treatment group, leading them to still withhold their truthful responses, while others may simply misunderstand the question format altogether.Footnote 10 Second, existing studies have shown that list experiments could overestimate or underestimate the measurement bias of sensitive questions.Footnote 11 Third, list experiments generally produce noisy results, and scholars have pointed out a bias–variance trade-off between list experiments and direct questions (Blair et al., Reference Blair, Coppock and Moor2020). Importantly, the measurement error in the list experiment could be nonrandom, resulting in a downward bias in the coefficient estimates. Finally, regression results from the list experiment and direct questioning may not be directly comparable because of question design and potential framing effects.
Keeping in mind these limitations of list experiments, we adopt several strategies to ensure the validity of our empirical analysis. Fundamentally, the potential measurement error stemming from list experiments is most likely to be problematic if we aim to directly compare the level of political trust from different surveys. Nonetheless, the objective of our paper is to compare the estimates of social welfare programs on citizen trust in local officials in regression analyses. In other words, the null hypothesis is whether the estimate from the regression analysis of “uncorrected data” (i.e., direct question) is statistically different from that in the “corrected data” (i.e., a list experiment). If a genuine correlation exists between a social welfare program and political trust, the direction and statistical significance of the estimates should remain consistent across various datasets even though the estimates of the social welfare program may differ. Moreover, our list experiment data includes 12,156 respondents, thereby mitigating some of the inefficiency in estimation commonly found in existing studies, which often rely on only a few thousand observations. Finally, we understand that a list experiment is still subject to measurement errors due to strategic or nonstrategic behaviors of the respondents. To assess the robustness of our list experiment analyses, we reanalyze the list experiment data by following the methodologies proposed by Blair et al. (Reference Blair, Chou and Imai2019) that account for various measurement errors. Specifically, we consider the top-biased error model when a subset of respondents chooses the maximal (ceiling) response value and a uniform bias model when a subset of respondents randomly chooses responses. We further analyze the list experiment data using nonlinear least squares regression, which involves fewer assumptions, and a robust maximum likelihood estimation (MLE) model. Figure A-6 in Appendix I reports the results and shows substantively similar results. The estimates under these models are mostly statistically insignificant, similar to the MLE results employed in the main analysis.
3.2. Measures of dependent variable
Both the 2014 CFPS and the 2015 CHFS included questions soliciting citizen trust in local government officials. Specifically, respondents of the CFPS survey were directly asked the following question:
On a scale from 0 to 10, where 0 is completely not trustworthy and 10 is completely trustworthy, please rate your trust in the following groups of individuals: county or district officials.
In the list experimentFootnote 12 embedded in the 2015 CHFS survey, each respondent in the sampled community within a prefecture was randomly assigned to either the control or treatment group. Respondents in the control group were asked the following question:
Of doctors, scientists, teachers, and lawyers, how many of these four groups of people do you trust?
Respondents in the treatment group were asked the following:
Of doctors, scientists, teachers, lawyers, and county or district officials, how many of these five groups of people do you trust?
In the following analysis, the responses to these two questions in the CHFS and CFPS are the dependent variables. Because the 2014 CFPS directly asked the citizen trust question, we use it as the benchmark analysis for bias in the estimates resulting from preference falsification. Indeed, we find systematic evidence that certain groups of individuals—such as rural, older, CCP nonmembers, less educated, nonlocal hukou holders, higher income earners, and men—are more likely to refuse to answer the direct question.Footnote 13 Meanwhile, we use the analysis of the list experiment data from the 2015 CHFS to reveal unbiased estimates because the list experiment mitigates preference falsification in the dependent variable.
3.3. Estimation framework
To assess the effect of social welfare programs on citizen trust in local government officials in China, we primarily focus on three programs: (1) health insurance, (2) pension insurance, and (3) the New Rural Pension Scheme (NRPS). For the estimation of list experiment data, we use the List package in R developed by Blair and Imai (Reference Blair and Imai2012).
To generate comparable results with the MLE methods in the analysis of the list experiment data, we collapse the 11-point scale of the measure of citizen trust on the 2014 CFPS into a binary variable: we code the dependent variable 1 when the original responses were 6 and above and 0 otherwise. We then employ a Logit model to analyze the CFPS data.Footnote 14 The coding decision may seem arbitrary. In our robustness checks, we reanalyze the CFPS data by choosing either a different cutoff point or using an OLS model to analyze the 2014 CFPS data from the 11-point scale, and the substantive interpretation of these results remains similar to those reported below.Footnote 15
We include several covariates at the individual or prefecture level that were used in existing studies. To approximate the results in existing statistical analyses of regime support, we use the same measure of the independent variable and—in some instances—the same model specification in our analysis.
4. Main results
We first report the descriptive statistics for citizen trust in local government officials on the 2014 & 2016 CFPS and the 2015 CHFS. We then present the estimation results stemming from regression analysis.
4.1. The level of citizen trust
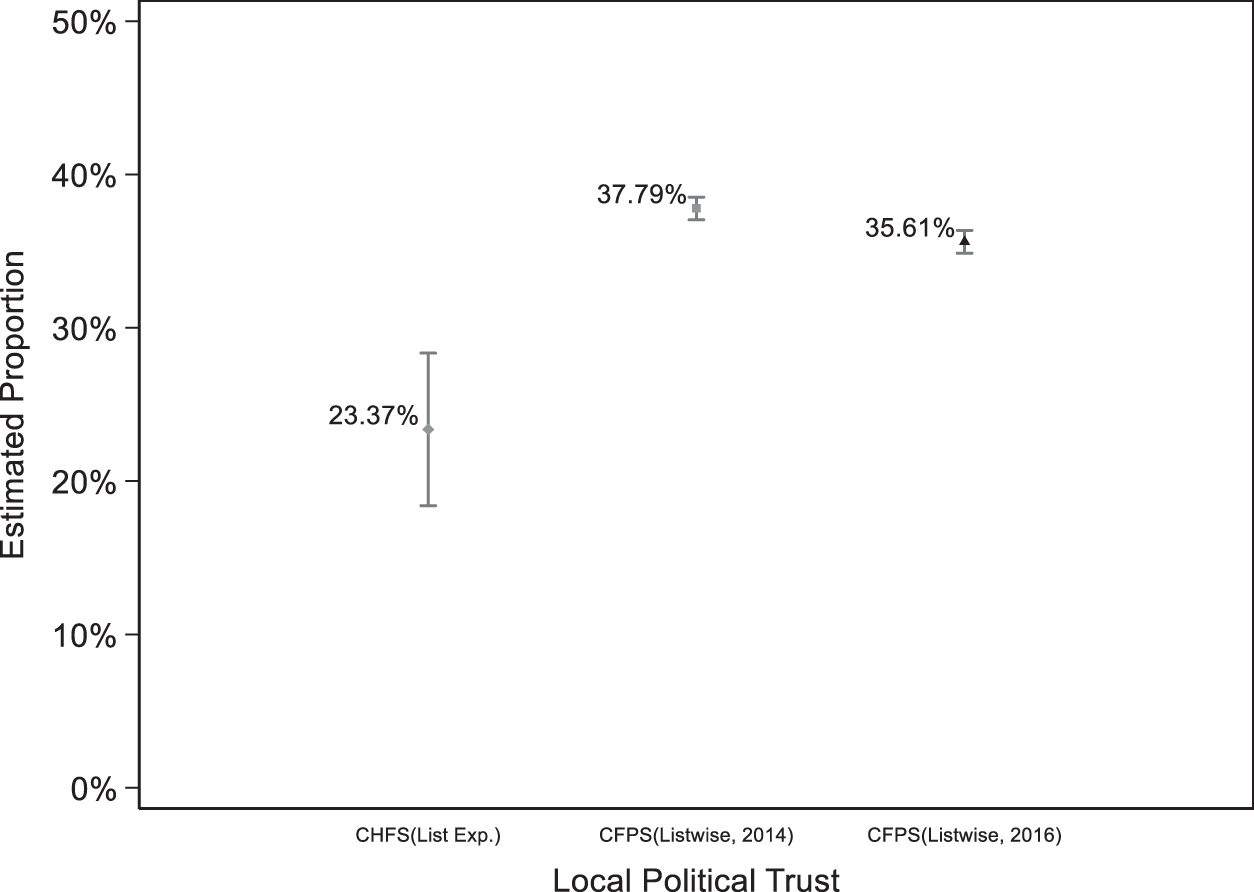
In Figure 1, we first report the level of citizen trust in local officials in the data from the 2014 and 2016 CFPS as well as the 2015 CHFS. The list experiment in the 2015 CHFS reveals significantly lower trust in local officials than that reported in the CFPS data. The 2015 CHFS suggests that the estimated proportion of respondents who trust county or district level officials is 23.4% (95% CI: 18.4, 28.4). The direct question on the 2014 CFPS indicates that the level of citizen trust is 37.8% (95% CI: 37.1, 38.5), and the 2016 CFPS revealed a slight decline: 35.6% (95% CI: 34.9, 36.4). The similarity in trust in local government officials between the 2014 and 2016 CFPS data indicates that the low level of trust in local government officials in the 2015 list experiment data is unlikely to be driven by political or economic events occurring in 2015. We observe a larger variation in the estimation of citizen trust from the list experiment data than from the survey data from a direct question. This is consistent with the bias–variance trade-off between list experiments and direct questions discussed in Blair et al. (Reference Blair, Coppock and Moor2020).

Figure 1. Citizen trust in county or district officials.
We then break down the measure of citizen trust by individual characteristics, revealing two patterns worth noting.Footnote 16 First, we found overestimation of citizen trust in local officials across all subgroups except for the individuals in the bottom 20% income category. Second, we evaluate the CHFS–CFPS difference within each subgroup and find that the magnitudes of upward biases are similar across subgroups. Overall, the descriptive statistics of the level of citizen trust in local officials suggest that social desirability bias exists in measures of citizen trust in the government in China through direct questioning.
4.2. Estimation results
The descriptive statistics provided above demonstrate quantitatively distinct estimates regarding the level of trust Chinese citizens have in local officials. We will now assess the effects of various types of social welfare programs on political trust. In our analysis, we use binary variables to indicate whether a survey respondent has received health insurance, pension insurance, and the New Rural Pension Scheme (NRPS).
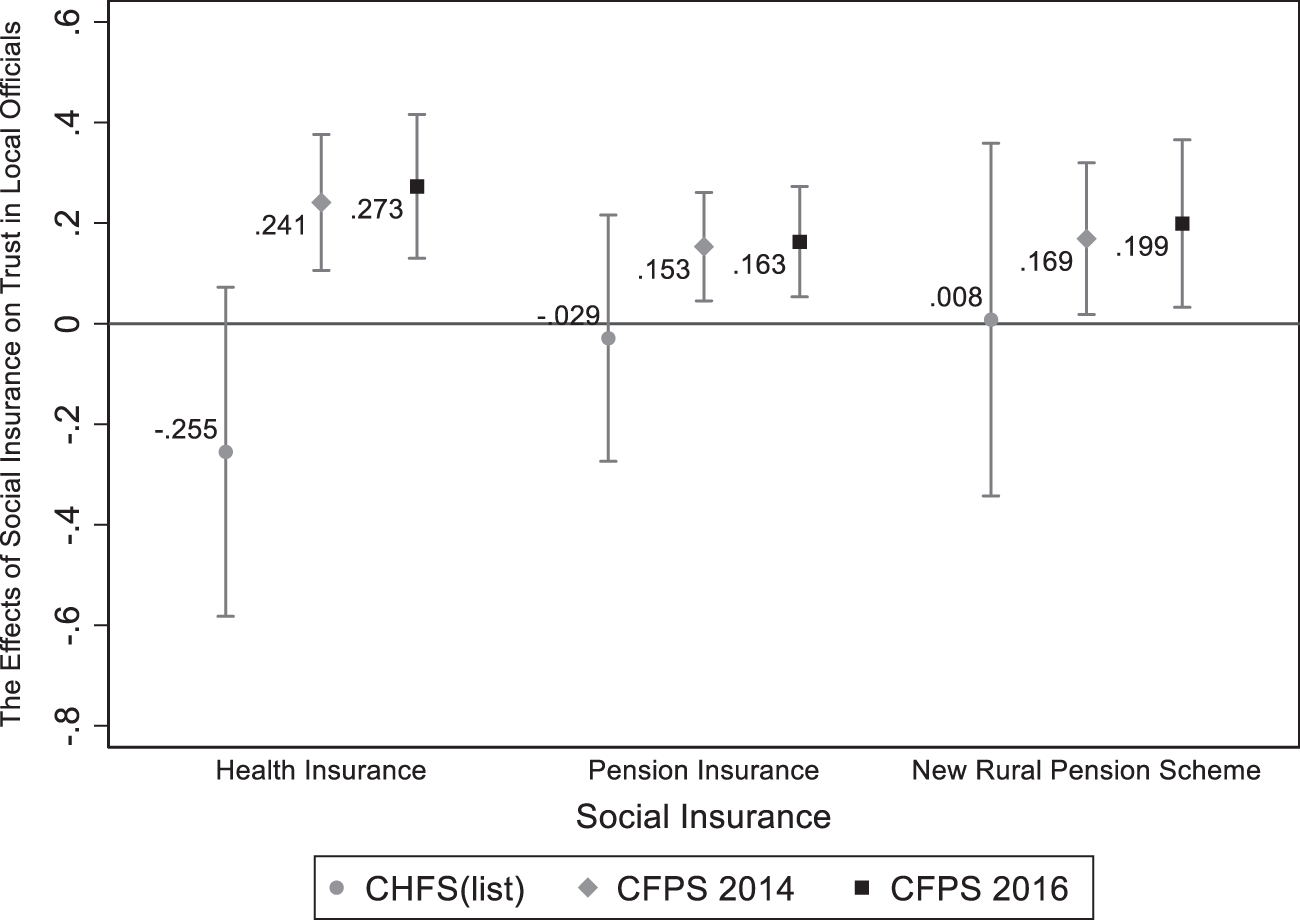
Figure 2 reveals that the analysis of list experiment data shows a negative correlation between receiving health insurance and trust in local government officials, but the estimate is not statistically significant (P-value: 0.127). The analyses of the 2014 and 2016 CFPS data containing direct questioning, however, report positive and statistically significant coefficient estimates. Substantively, if we were to use data suffering from social desirability bias, it would have shown a positive correlation between beneficiaries of health insurance and trust in local government officials, leading to an overestimation bias. The analyses of pension insurance and the New Rural Pension Scheme suggest a similar pattern. Again, the estimates of regression analysis based on the list experiment data are close to zero, and they are not statistically significant. The analysis of direct questioning data shows positive and statistically significant estimates, again suggesting a positive effect of social welfare programs on citizen trust in local officials. Notably, the list experiment results are consistent with Lü (Reference Lü2014), who finds that a 2005 social policy abolishing tuition and fees for compulsory education in China did not increase citizens’ trust in local officials. Yang and Shen (Reference Yang and Shen2021) also find no evidence that the New Rural Pension Scheme enhances trust in local officials.

Figure 2. The effects of social welfare programs on citizen trust in county or district officials.
Importantly, we cannot completely attribute discrepancies in the above analyses to the bias–variance trade-off between list experiments and direct questions (Blair et al., Reference Blair, Coppock and Moor2020). Despite larger standard errors for the estimates in the analyses of the list experiment data, the estimates are either negative or close to zero. An improvement in efficiency in the list experiment analysis will lead only to the same substantive conclusion.
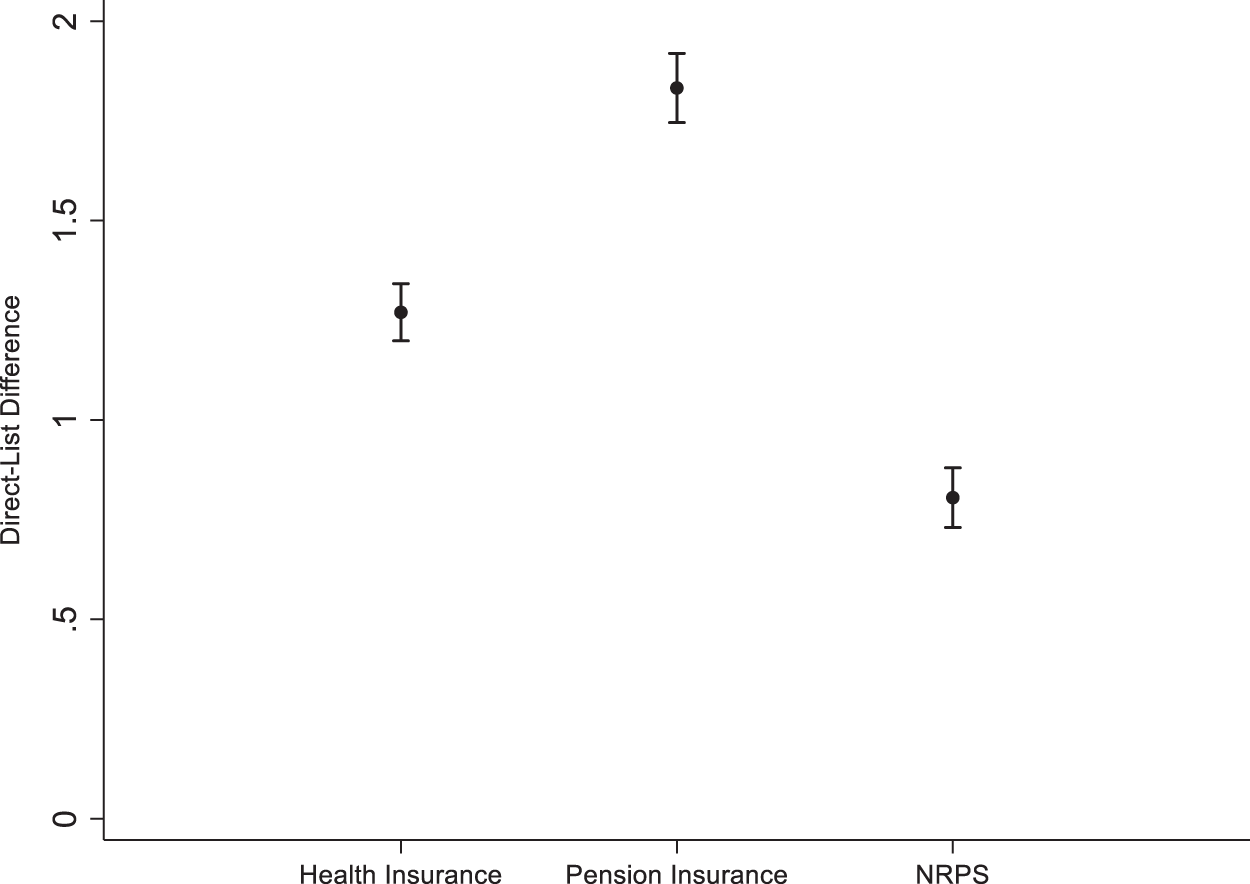
It is important to note that the analyses of list experiment data and direct questions utilize different estimation frameworks, each with its own assumptions. Consequently, a standard mean-test of coefficient estimates between these two models may be inappropriate. Instead, we use a bootstrapping approach to resample the data with replacement, enabling us to compare the kernel density distributions of estimates derived from both the list experiment and direct questions, and perform a t-test to assess the differences between these distributions. Figure A-5 in Appendix F demonstrates that the medians of the bootstrapped estimate distributions based on list experiment data are either negative or centered on zero, and they are not statistically significant at the 0.10 level. In contrast, the medians of the bootstrapped estimate distributions based on direct questions are often positive and statistically significant at the 0.10 level.Footnote 17 We then conduct a mean-test based on the statistics derived from the bootstrapped estimates (Table A-6). We find that regression analyses based on direct questions consistently overestimate the key explanatory variable compared to the list experiment data (Figure 3). The bias is especially large in the analysis of pension insurance relative to other social welfare programs. Collectively, these results suggest a significant overestimation of the impact of social welfare programs on trust in local officials when using data with direct questions.

Figure 3. Mean comparison of estimates from direct question and list experiment.
4.3. Robustness checks
The differences in estimation of these survey datasets could be driven by a variety of reasons other than the bias stemming from social desirability bias. We evaluate these concerns and find no evidence that the differences in estimates across the datasets stem from these concerns.
Design Effect of the Survey Question. The wording of the question structure and response options may introduce variations in the estimation analysis. The responses to the CFPS survey question on trust in local government officials are based on an 11-point scale instead of a binary measure. In the main analysis, we chose 6 as the cutoff point for coding trust in local officials. To assess whether the estimation results are sensitive to this choice, we reanalyze the 2014 and 2016 CFPS data by shifting the cutoff point to either 5 or 7. We also use OLS to analyze the data with the original 11-point scale. Table A-7 in Appendix G shows that the estimation results of the CFPS data remain overestimated in most models. Importantly, Section 5.2 shows that some identification strategies yield similar estimates when using the 2014 CFPS data compared to the 2015 CHFS data. Stated differently, if the variations in estimation predominantly arise from differences in wording, we would not have observed consistent results in the analysis of list experiment data and the analysis of direct questions using more robust identification strategies.
Multiple Imputation. One could argue that multiple imputation could potentially remedy measurement errors stemming from item nonresponse, but doing so does not address the issue of preference falsification. To illustrate this point, we report the analyses of the 2014 and 2016 CFPS data from multiple imputation.Footnote 18 Table A-8 in Appendix H further demonstrates that the regression analysis of multiple-imputed 2014 CFPS data generates similar point estimates compared to those with listwise deletion reported in Figure 2. Substantively, using multiple imputation, we are unable to address the preference falsification issue.
Extended Analyses Beyond Social Welfare. Are our key findings unique in the analysis of the effect of social welfare programs on political trust in China? We extend our analysis to other sources of political trust by Chinese citizens proposed in the existing literature. On one hand, many researchers point to China’s rapid economic growth as a key source of popular support and performance legitimacy. On the other hand, government corruption erodes political trust in both democratic and nondemocratic regimes, and scholars have investigated the effect of China’s recent anticorruption campaign on political trust in China (Kang and Zhu, Reference Kang and Zhu2021; Wang and Dickson, Reference Wang and Dickson2022). To answer the question posed above, we evaluate the effects of household income and the intensity of China’s anticorruption campaign in our data. Appendix J reveals similar evidence that existing results may contain an overestimation bias. Specifically, Table A-9 reaffirms that analyses employing direct questions are prone to overestimation bias in the analysis of the anticorruption campaign, which is consistent with the finding in Wang and Dickson (Reference Wang and Dickson2022). Meanwhile, analysis of the list experiment data shows that household income has a negative and statistically significant correlation with trust in local officials (Table A-10). Examining the distributions of estimates from bootstrapped resampling of both the list experiment and direct questions data, along with the t-test results, we find consistent evidence that aligns with the main findings (Table A-6).
Extended Analyses Beyond CHFS and CFPS Data. Up until this point, our analysis has focused primarily on a single outcome variable—trust in local officials in China. However, does the divergence in estimates between the list experiment and direct questions persist in other settings, such as with different outcome variables in China or other non-China contexts? To answer this question, we analyzed data containing both list experiment and direct questions in several existing publications.Footnote 19 In one study, Nicholson and Huang (Reference Nicholson and Huang2023) assess trust in the central government in China using both a list experiment and direct questions. In our reanalysis using their direct question, we find that self-monitoring, a personal trait, is negatively correlated with trust in the central government, while adherence to Confucian values is positively associated with higher trust. However, the estimates derived from the list experiment data reveal that neither of these attributes has a statistically significant impact on trust in the central government (Table A-11). Next, we analyze data beyond China, and still find similar divergence in the regression analysis of direct question and the list experiment. For instance, Traunmüller et al. (Reference Traunmüller, Kijewski and Freitag2019) employ a list experiment and direct questions to examine whether victims of sexual violence may underreport their experience in Sri Lanka. The central argument is that Tamils who either supported rebel groups or had family members involved in them were more likely to experience sexual violence during the war. Indeed, our regression analysis of their list experiment data finds evidence supporting this argument, whereas the analysis of direct question data finds no such evidence (Table A-12). Finally, Gonzalez-Ocantos et al. (Reference Gonzalez-Ocantos, de Jonge, Meléndez, Nickerson and Osorio2020) employ a list experiment and direct questions to identify instances of vote-buying and intimidation in Guatemala. In our reanalysis of their list experiment data, we find that rural residents are less likely to experience vote-buying, yet more likely to face intimidation (Table A-13). However, analyses based on direct questions fail to reveal this critical insight. Instead, they suggest that individuals with strong reciprocity values are more prone to intimidation, a conclusion that is contradicted by the list experiment findings.
5. Evaluation of alternative identification strategies to mitigate bias in the estimate
Our empirical analysis offers strong evidence for overestimation bias in existing regression analysis by using direct questions as the dependent variable. One solution is to employ various experimental methods, but this solution is financially costly and practically implausible in many circumstances; moreover, the use of experimental methods does not offer any solution to address the potential bias in the estimate in the analysis of existing survey data, such as the World Value Survey and Asian Barometer.
We examine several commonly used identification strategies in existing studies and evaluate their effectiveness to alleviate bias stemming from social desirability bias in the regression analysis. We primarily focus on FE, DID, IV, RDD, and propensity score matching (PSM).
5.1. Model assumptions
Individual Fixed Effects Model. Scholars have employed individual fixed effects models in order to mitigate social desirability bias (Pop-Eleches et al., Reference Pop-Eleches, Robertson and Rosenfeld2022). Individual-level fixed effect models potentially mitigate bias in the estimate if a key assumption is met—the propensity toward social desirability bias is stable within individuals over time. In other words, we assume that individuals would exhibit the same level of preference falsification if presented with the same question on different occasions. Hence, the within-individual variation of the dependent variable for respondent i from time t to t + 1 could be explained only by the change in the key variables over time.
The Difference-in-Differences Model. DID is another common strategy for researchers to identify the causal effect of an intervention introduced externally and to address bias stemming from social desirability bias (Chlouba et al., Reference Chlouba, Smith and Wagner2022; Fouka and Tabellini Reference Fouka and Tabellini2022; Frye and Borisova, Reference Frye and Borisova2019; Mikulaschek et al., Reference Mikulaschek, Pant and Tesfaye2020). One key underlying assumption is that the propensity toward social desirability bias is stable within groups over time. The key difference between FE and DID models is that researchers can relax the stable social desirability bias assumption at the group level for the DID specification instead of at the individual level for FE models. This model specification can be particularly useful in cases where surveys have a panel structure at the geographic location level (such as country, province, or city) but lack panel data at the individual level. For instance, Guriev and Treisman (Reference Guriev and Treisman2020) employ this strategy to analyze country-level panel data from the Gallup World Poll to evaluate the popularity of authoritarian leaders.
The Instrumental Variable Model. IV strategy is widely employed to identify the causal effects of the variable of interest in the analysis of sensitive questions (Chlouba et al., Reference Chlouba, Smith and Wagner2022; Fouka and Tabellini 2022). The proper use of IV requires satisfying a strong yet untestable assumption—exclusion restriction—such that the instrumental variable is not related to the outcome variable except for the explanatory variable being instrumented. One advantage of the IV strategy is that it could mitigate bias in the regression analysis if the instrument is unrelated to the unobserved factor contributing to social desirability bias, thus blocking the backdoor path for this confounder to influence the dependent variable.
Regression Discontinuity Design. Another solution to mitigate social desirability bias is RDD (Cavaille and Marshall Reference Cavaille and Marshall2019; Larreguy et al., Reference Larreguy, Marshall and Querubín2016; Desposato et al., Reference Desposato, Wang and Wu2021), the validity of which relies on the assumption that the propensity toward social desirability bias is stable within the control and treatment groups along the cutoff point. In fact, the RDD strategy could be a very effective solution to mitigate bias in the estimate. As long as RDD assumptions are satisfied, one may reasonably assume that the observed and unobserved characteristics, including the propensity toward social desirability bias, are statistically indifferent between the control and treatment groups. Hence, researchers are able to identify the causal estimate because of ‘as-if’ random assignment in the RDD design.
Propensity Score Matching. Although PSM is not traditionally employed to address social desirability bias, researchers increasingly use it to identify causal effects of variables of interest. By employing various matching algorithms, researchers can sort a subset of observations into control and treatment groups for analysis. For PSM to mitigate bias in the estimate, the key underlying assumption is that the propensity toward social desirability bias is static within the control and treatment groups under the matching algorithm. In other words, the design of the PSM algorithm is crucial in mitigating bias in the estimate.
5.2. Estimation results
To ensure that our analyses meet the underlying assumptions of these identification strategies, we focus exclusively on evaluating one explanatory variable, the New Rural Pension Scheme (NRPS). Using a single explanatory variable allows us to clearly demonstrate whether identification strategies could mitigate bias in the estimate without concern for the heterogeneous estimation results that could be driven by the disparity in the effects of various government policies. Importantly, the unique benefit qualification feature of the NRPS program allows us to satisfy the assumptions underlying all the identification strategies mentioned above; the data on health and pension insurance, by contrast, do not present the opportunities to satisfy the assumptions of IV and DID models. For example, Table 1 indicates that age exhibits a mixed effect on social desirability bias from existing studies, making it a reliable instrument for IV analysis because it is unlikely to have a direct confounding influence on political trust. In particular, our data show little correlation between any particular age group and political trust in the CFPS data, particularly around the age of 60 years.Footnote 20 Meanwhile, the NRPS program was rolled out gradually by counties, thus presenting an opportunity for a DID analysis. Finally, age (60 and older) is the most important eligibility criterion for rural residents to receive NRPS benefits, but not the only one. Hence, we employ a fuzzy RD design. Notably, Appendix O shows that we do not observe a discontinuity in trust in local officials regardless of the bandwidth that we choose. Thus, no clear evidence suggests that respondents eligible for, or soon to receive, NRPS benefits are either more or less critical of local government officials.
Before we present the estimation results, we should note that these identification strategies involve exploring the dimensions of variation in the dependent and independent variables. The IV, RDD, and PSM primarily entail exploring cross-sectional differences, resembling the analysis of the list experiment data; whereas the FE and DID take advantage of both temporal and cross-sectional variations. These differences by themselves carry important implications for identifying the causal effects of an explanatory variable of interest, but doing so is beyond the scope of this paper. In what follows, we assess whether the estimates of NRPS from these models are close to the benchmark estimate using the list experiment data.
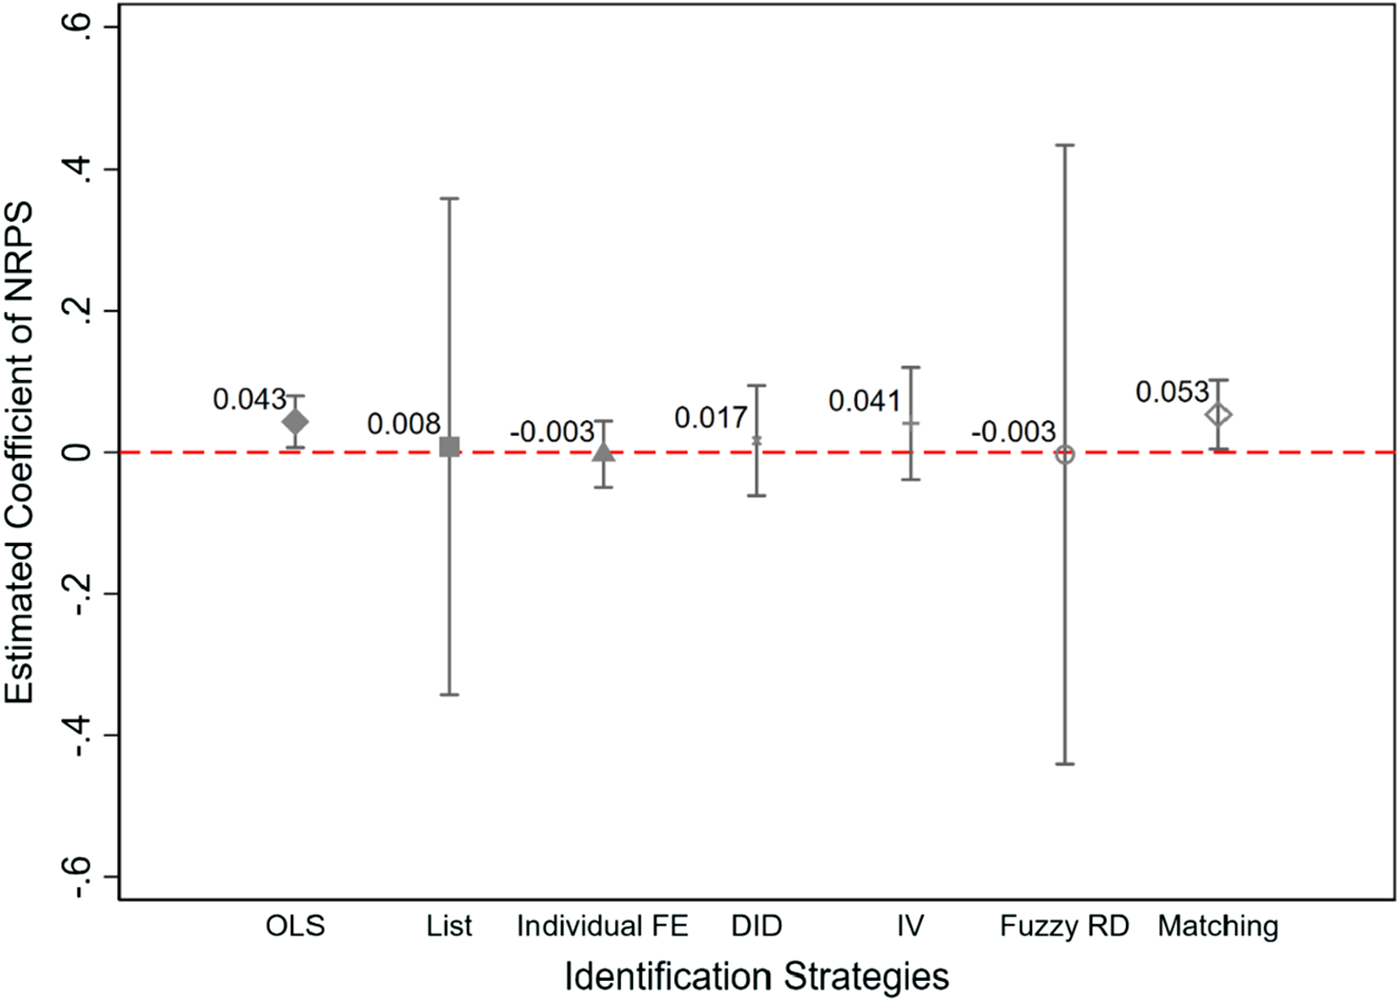
Figure 4 reports the estimation results using the identification strategies discussed above. For comparison, we report the point estimates based on the analysis of the 2014 CFPS and the 2015 CHFS list experiment data. To begin, the point estimate obtained through the OLS modelFootnote 21 for the 2014 CFPS data, where the dependent variable is derived from a direct question, is positive and statistically significant. This aligns with the results obtained using the logit model as presented in Figure 2. Meanwhile, we find that FE, DID, and fuzzy RDD all report estimates comparable to that of the list experiment result—the point estimates are close to zero and statistically insignificant. Notably, the fuzzy RDD exploits cross-sectional variation similar to the estimation framework in the analysis of the list experiment, while individual FE and DID exploit both temporal and cross-sectional variations, yet these estimations all yield strikingly similar results. Notably, the estimate from IV analysis has a larger magnitude (0.041). If we restrict the sample in IV analysis to the 50‒70 age group and the 55‒65 age group, the estimates are negative but statistically insignificant.Footnote 22 Although the point estimate is not statistically significant, the size of the estimate is comparable to the OLS estimate. By this measure, we are not very confident that the IV analysis is as adequate as the individual FE, DID, and fuzzy RDD identification strategies to mitigate the bias in the estimate.

Figure 4. The effects of NPRS on citizen trust in county or district officials.
Overall, Figure 4 reveals that individual FE, DID, and fuzzy RDD generate the estimation most comparable to that of the list experiment; hence, these identification strategies help mitigate the bias in the estimate stemming from social desirability bias. The estimate based on the IV approach produces similar substantive interpretation, but the size of the estimate is comparable to the OLS analysis. The PSM framework underperforms in mitigating bias because the estimates are positive and statistically significant.
6. Conclusion
Our paper sheds new light on the issue of social desirability bias, generating important methodological and substantive implications beyond China. Methodologically, we highlight an important yet empirically unexplored issue: Bias stemming from regression analysis of survey data that is susceptible to social desirability bias. Importantly, we demonstrate that the direction of bias in the estimate is often ambiguous and cross-cutting ex ante; hence, researchers cannot analytically deduce the extent to which social desirability bias impacts existing statistical evidence. Moreover, we show that the careful use of certain identification strategies may mitigate bias in the estimate. This finding offers a potential silver lining in the empirical investigation presented in this paper: Researchers can still use existing public opinion survey data, provided that the assumptions underlying the causal identification strategy are adequately met.
Substantively, we call into question the prevailing wisdom concerning sources of political trust in China. Some may claim that existing empirical support for performance legitimacy may still be valid because we primarily investigate trust in local government officials, and the survey data draw from a time period different from that in the earlier study. Although this claim has merit, the analysis of a direct question revealing a positive and statistically significant effect similar to earlier studies is very concerning.
Our study is just the first step in underscoring the impact of social desirability bias on public opinion data in a challenging environment. We suggest three fruitful directions for future research. First, we evaluate only the determinants of trust in local officials. Although our results provide important implications for sources of support to the national government and officials, an empirical question remains: How much and in what direction is the existing empirical evidence biased? As demonstrated in our reanalysis of the data from Nicholson and Huang (Reference Nicholson and Huang2023) concerning trust in the central government, the estimates of explanatory variables are likely biased when the outcome variable is derived from a direct question. Therefore, a systematic reevaluation of the sources of popular support in China could offer valuable insights into both the resilience and the vulnerabilities of the regime. Second, we rely only on the list experiment to establish the baseline for the genuine level of political support, while other techniques may establish a better baseline. Much more is left to do in exploring better strategies to overcome bias in regression analysis to generate robust evidence concerning the analysis of data exhibiting social desirability bias. Third, how widespread is the issue highlighted in this paper in studies beyond China? In recent years, the fields of political science and social science at large have been rocked by the “Reference Brodeurreplication crisis,” raising critical concerns about the reliability of empirical findings in both experimental and non-experimental settings.Footnote 23 Social desirability bias is only one of the concerns underlying the replication crisis. We join recent scholars in calling for more careful analysis of public opinion data when some variables are subject to potential social desirability bias. The key takeaway, however, is not throwing the baby out with the bathwater by distrusting any empirical evidence derived from observational data entirely. Instead, we propose that the thoughtful application of identification strategies can help mitigate social desirability bias in existing data.
Supplementary material
The supplementary material for this article can be found at https://doi.org/10.1017/psrm.2025.10080. To obtain replication material for this article, please visit https://doi.org/10.7910/DVN/ZZS72T.
Acknowledgements
We thank Max Goplerud, Haifeng Huang, Kosuke Imai, Connor Jerzak, Stephen Jessee, Dan Mattingly, Pablo Pinto, Graeme Robertson, Daniel Tavana, Matthew Tyler, and the audience at the 2022 PolMeth and TexMeth as well as the 2023 APSA Meetings for comments and suggestions. All errors remain our own.


 Open access