


Introduction
The recent COVID-19 pandemic exposed severe gaps in US hospitals’ emergency preparedness.Reference Jarrett, Garrick and Gaeta1 Hospitals, especially those with high caseloads during the pandemic’s initial surge, were overwhelmed by record numbers of inpatient admissions requiring critical care.Reference Jarrett, Garrick and Gaeta1, Reference Jeffery, D’Onofrio and Paek2 These challenges stretched hospitals’ ability to deliver community care and had real consequences for patient health outcomes and hospitals’ financial solvency.Reference Okonkwo, Aguwa and Jang3–Reference French, Hulse and Nguyen6 Without diligent preparation, it is straightforward to imagine similar challenges emerging in the event that the US enters a large-scale combat operation (LSCO) and significant numbers of combat casualties require care in domestic health care facilities.
Civilian-military partnerships are currently being strengthened to prepare for a potential near-term LSCO.Reference Deussing, Post and Lee7 While the scenarios for potential LSCOs vary, all predict substantial rates of casualties and medical evacuations.Reference Remondelli, Remick and Shackelford8 These enormous combat casualty numbers will, in turn, overload the military health system, which serves active-duty members, as well as the Department of Veteran Affairs’ medical centers, and will require support from civilian health care systems.Reference Remondelli, Remick and Shackelford8 However, the cost to civilian health systems for providing such support, both in terms of financial costs and the impact on civilian patients, remains unknown.
The National Disaster Medical System (NDMS) is charged with providing definitive care—meaning comprehensive medical or surgical treatment from assessment though follow-upReference James and Pennardt9—to combat casualties in the US returning from LSCOs; however, to date it has never been activated for this purpose.Reference Kirsch, Lee and Kimball10 Through the NDMS, over 1800 civilian health care facilities would accept combat casualties on a voluntary basis in coordination with the Administration for Strategic Preparedness and Response within the Department of Health and Human Services.11 In 2019, to address the potential national security threat of an LSCO, Congress mandated the US Secretary of Defense to conduct the NDMS Pilot Program (“Pilot”) to assess current NDMS civilian-military interoperability at 5 Pilot sites across the continental US and offer recommendations for strengthening the NDMS.Reference Lee, Allard, Adeniji, Quintanilla and Kirsch12 In this study, we evaluate the financial impact on a set of NDMS-participating hospitals at a single Pilot site in Omaha, Nebraska.
The current financial landscape for US hospitals is complex, reflecting a fragmented US health care market. Existing payment structures incentivize hospitals to maximize profitable scheduled surgical procedures,Reference Khullar, Bond and Schpero13 which in turn cross-subsidize less profitable service lines like trauma.Reference Horwitz14, Reference David, Lindrooth, Helmchen and Burns15 Moreover, regardless of procedure or service line, there is a large variation in the reimbursement amounts actually paid by providers. Compared to commercial insurers, reimbursements paid by Medicare and Medicaid are lower and typically do not cover their patients’ hospital costs.Reference Lopez, Neuman, Jacobson and Levitt16 Consequently, health systems compete for higher-paying commercially insured patientsReference Rosko, Al-Amin and Tavakoli17 and operate on thin profit margins (3-5% on average).Reference Wang, Bai and Anderson18 To maintain already thin profit margins, health systems prioritize filling empty beds. This is because, given the fixed operating costs of running a hospital, filling beds increases marginal revenue. As a result, many civilian health systems function at or near capacity. For example, the US Centers for Disease Control and Prevention’s hospital occupancy tracker shows that from October 2022 through March 2024, the average percentage of occupied inpatient and intensive care unit staffed beds was approximately 75%.19 Thus, disasters that displace capacity, such as the COVID-19 pandemic or combat casualty repatriation scenarios, can financially ruin hospitals. During the COVID-19 pandemic, civilian health care systems required federal bailout dollars to remain solvent when elective procedures were significantly reduced and low-value/low-margin care increased,Reference Khullar, Bond and Schpero13, Reference Ochieng, Fuglesten Biniek, Musumeci and Neuman20 even on top of the 20% increase made to Medicare reimbursements for patients with COVID during the public health emergency period.Reference Ochieng, Fuglesten Biniek, Musumeci and Neuman20
For care provided to combat casualties under an NDMS activation, according to currently published NDMS reimbursement rates, the government would reimburse non-NDMS participant hospitals at Medicare or Medicaid rates and NDMS participants at 125% of Medicare rates.21 If there is a Stafford Act Declaration, which enables federal disaster assistance,22 it is also possible that reimbursement rates could increase for non-NDMS participants. In contrast, the 2017 NDMS activation in response to Hurricane Irma reimbursed participating hospitals only 110% of Medicare rates.23 Higher reimbursement rate could both induce more hospitals to participate in the NDMS system, since participating health care systems would need to balance providing care to the combat casualties with sustaining enough “normal” operations to still treat civilian patients and allow for financial stability. It is possible that systems would limit participation unless the federal government guaranteed funding to cover surge costs (e.g., increased staffing, medical supplies, and overhead).
This study’s objective was to understand the financial impact and civilian patient care impact of civilian hospital’s providing definitive care. We do this by focusing on a group of civilian hospitals around the NDMS Pilot site of Omaha, Nebraska. Following the literature from COVID-19, we especially aimed to quantify the impact of accepting a large influx of casualties on hospital financial viability under different reimbursement scenarios.
Methods
Based on our team’s previous research about the economic impact of medical disaster scenarios,Reference Zebrowski, Petrozzo and Zikry24 our hypotheses were: (i) typical hospital procedures, especially elective, non-urgent or less-urgent procedures would be forced to temporarily pause, as all available resources would need to be diverted to urgently care for combat casualties, and (ii) daily total revenue would fluctuate as the usual civilian payment streams (from commercial payers, Medicaid, and Medicare) would be replaced by payment by Tricare or other means of Department of War (DOW) or federal government support. To test these hypotheses, we developed a discrete event simulation (DES) model. DES models simulate the progression of events along a defined trajectory and have been used previously to study hospital capacity and throughput, including in times of acute increased demand.Reference Hauschild, Hauret, Richardson, Jones and Lee25, Reference McCuskee, Petrozzo, Buckler, Weber, Travis and Zebrowski26
The baseline scenario for this DES model assumed an influx of 150 combat casualties daily, for 100 consecutive days, distributed across 2 NDMS-participating health systems (encompassing 5 hospitals), located in Omaha, Nebraska. In the following section we first describe the data and methods used for model parameterization. Then we describe the DES model itself as well as different scenarios we simulated.
Data Sources and Model Parameterization
Parameters for the DES model included: (1) volume of civilian patients currently receiving care (i.e., expected hospital caseloads and who among them could safely be prioritized for replacement by combat casualties), (2) types of combat casualties that would be arriving (i.e., the expected types and quantities of injuries and illnesses), (3) payments for existing civilian patients and expected payments for combat casualties, and (4) hospital characteristics such as number of beds and other capacity-related variables.
We used 5 data sources for model parameterization: (1) An injury taxonomy from the Defense Centers for Public Health,Reference Hauschild, Hauret, Richardson, Jones and Lee25 which categorized ICD-10 diagnoses into injury and illness types; (2) the “NDMS surge model”—a list of broad disaster-relevant injury categories, as well as a predicted distribution of expected casualties across the injury category list, developed and validated by NDMS team-members alongside other federal agencies and physicians; (3) Agency for Healthcare Research and Quality’s Health Cost and Utilization Project (HCUP) State Inpatient Databases (SID) from 2019 to 2020 for Nebraska, Iowa, and Colorado, which provided the universe of hospital inpatient claims (each line of which contains procedure codes, length of stay (LOS) and diagnosis-related group (DRG), among other variables) for those years and states; (4) de-identified hospital-specific cost accounting data from 2 Omaha health care systems (encompassing 5 NDMS hospitals) during 2022–2023, which provided financial data aggregated over DRG, payer (e.g., Medicaid, Medicaid, or commercial), and urgency (non-urgent versus elective). For each DRG-payer-urgency triplet, we received the total number of cases, average LOS, and a set of cost accounting variables, such as average total cost and average reimbursement payment (see Appendix Table 1 for the full set of variables included); finally, (5) American Hospital Association (AHA) Annual survey data from 2022, which provided hospital-level capacity data.
Table 1. Summary of DES model parameters, definitions, and data sources

Notes: Hospital cost accounting data was sourced from 2 Omaha area health systems in 2022-2023, comprising 5 hospitals that are part of the NDMS pilot (but serve civilian populations). HCUP data was State Inpatient Data from 2019 to 2020 from Nebraska, Iowa, and Colorado. The NDMS surge model is a list of 13 broad disaster-relevant injury categories, and a predicted distribution of expected casualties across the injury category list, developed and validated by NDMS team members alongside other federal agencies and physicians. The proprietary sorting algorithm was developed by our team (described in McCuskee, Petrozzo, et al.Reference Zebrowski, Petrozzo and Zikry24) and generated a crosswalk linking injury-relevant ICD-10 diagnosis codes to the 13 LSCO injury categories from the NDMS surge model. We then applied this ICD-LSCO injury category crosswalk to the HCUP data using the primary ICD-10 diagnosis code listed in each HCUP encounter. Since the HCUP data contains DRGs as well as ICD-10 codes, this effectively gave us a DRG-to-injury-category crosswalk, enabling us to calculate distributions of DRGs (frequencies) and LOS (median, IQR) for each LSCO injury category, which we applied to combat casualties.Reference Zebrowski, Petrozzo and Zikry24
First, using a proprietary sorting algorithm developed by our team (described in McCuskee et al.Reference McCuskee, Petrozzo, Buckler, Weber, Travis and Zebrowski26), we generated a crosswalk linking the injury-relevant ICD-10 diagnosis codes (from the injury taxonomy) to one of 13 LSCO injury categories from the NDMS surge model. We then applied this ICD-LSCO injury category crosswalk to our third data set—the HCUP cohort—using the primary ICD-10 diagnosis code listed in each HCUP encounter. Since the HCUP data contains DRGs as well as ICD-10 codes, this effectively gave us a DRG-to-injury-category crosswalk, enabling us to calculate distributions of DRGs (frequencies) and LOS (median, IQR) for each LSCO injury category,Reference McCuskee, Petrozzo, Buckler, Weber, Travis and Zebrowski26 which we applied to combat casualties.
Next, we used the hospital-level cost accounting data to calculate model parameters applicable to civilians. We calculated the distribution of DRGs-payer-urgency triplets, which we needed to determine civilian patient’s arrival rate in the model. We also calculated average LOS, reimbursement, and profit margin (within each triplet). It was crucial that the cost-accounting data was provided at this level of granularity. First, reimbursement varies by payer (i.e., commercial payments tend to be highest, while Medicaid payments tend to be lowest). Second, DRGs are typically the basis for payment for inpatient stays, particularly for Medicare patients.Reference Weber, Floyd, Kim and White27 Third, urgency determines which civilian patients should not be replaced by combat casualties.
We also used the hospital-level cost accounting data to calculate potential reimbursement for combat casualties. Our baseline model assumed that combat casualties were reimbursed at the Medicare rate (again, determined by the DRG). From there, we evaluated different scenarios for how the federal government would reimburse hospitals for combat casualty care (see hyperparameters described below), as a fraction of Medicare rates. We also used the hospital cost accounting data to estimate hospital-level financial loss from the hypothetical replacement of civilian patients by combat casualties.
Finally, we used the 2022 American Hospital Association (AHA) Annual survey data to calculate baseline (i.e., normal condition) hospital bed capacity. To accurately simulate beds under surge conditions, we calculated the sum of all adult non-skilled nursing facility (SNF) beds reported to the AHA. This number was always less than the total licensed beds reported for a given hospital.
Table 1 lists all model parameters and summarizes data sources. The Mount Sinai Hospital’s Institutional Review Board (IRB) deemed the protocol not human subject research.
Reimbursement and Surge Hyperparameters
We also set 3 model hyperparameters. First, we set the reimbursement rate for combat casualty as a fraction of the Medicare reimbursement rate, either: (i) 75%, (ii) 100%, or (iii) 125%. These levels reflect scenarios that could occur, respectively, in dire circumstances (reimbursement rates reduced), under the status quo for non-NDMS participants, or under the status quo for NDMS participants,21 as touched upon in the Introduction section. Next, within each of the 3 reimbursement rate scenarios, we set hospitals’ capacities (number of beds) at either (i) a surge of 10% over baseline or (ii) a surge of 20% over baseline. We chose these capacities based on official government recommendations and the literature.Reference Hick, Einav and Hanfling28, Reference Armstrong29 Finally, also within each reimbursement rate scenario (but separate from capacity), we allowed for an additional per-patient lump-sum transfer of either: (i) $1000, or (ii) $5000. These reflect federal bailout scenarios seen during the COVID-19 pandemic.Reference Grogan, Lin and Gusmano30
Outcomes
Our main outcomes were daily occupancy, counts of displaced civilian patients, average daily net income (payments minus total costs), and total payments for simulated military patients. Using daily occupancy, we also estimated time-to-full capacity and surge capacity.
DES Model
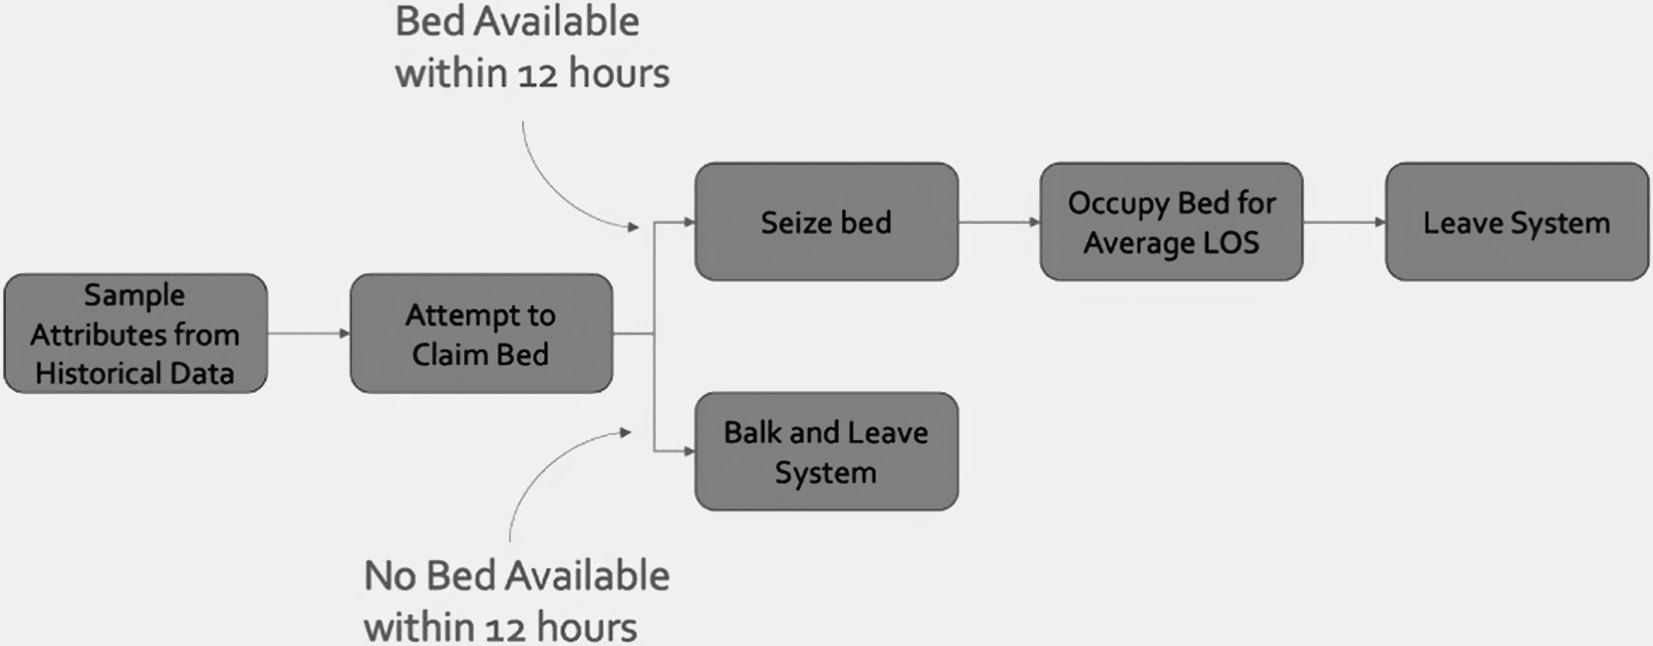
Figure 1 illustrates our DES model. The model simulated the flow of 2 types of patients—civilian patients and combat casualties—through a series of discrete time events during the hospitalization process. Simulation was performed using the simmer Reference Ucar, Smeets and Azcorra31 package for R-4.0.3 (R Foundation for Statistical Computing, Vienna, Austria). The model runs for a total of 350 simulated days: the first 150 days only civilian patients arrive at hospitals (baseline), the next 100 days both civilian patients as well as combat casualties arrive (surge), and the final 100 days again only civilian patients arrive (recovery).

Figure 1. Patient trajectory in discrete event simulation model.
Notes: Graphical representation of patient movement within discrete event simulation model. LOS = length of state. Historical data consists of (1) Hospital cost accounting data was sourced from 2 Omaha area health systems in 2022-2023, comprising 5 hospitals that are part of the NDMS pilot (but serve civilian populations) and (2) HCUP data was State Inpatient Data from 2019 to 2020 from Nebraska, Iowa, and Colorado.
We modeled civilian patient arrival time using a random exponential function to estimate the average daily arrivals for each hospital. At the time of arrival, the model would perform a case-weighted random sample from the hospital-level cost-accounting data and assign the DRG, average LOS, total cost, and payment amount for the sampled DRG-payer-urgency triplet to the simulated civilian patient. If a bed was available, the patient would seize it and hold that resource until the attributed LOS elapsed, then release the bed and leave the simulated system. If a bed was not immediately available, the patient would be placed in a bed queue. If a bed did not become available within 12 hours after arrival, the patient would “balk” and leave the system. Using this methodology, we were able to simulate normal operating conditions for the 5 hospitals when the model reached baseline equilibrium.
We developed a parallel trajectory for combat casualties entering the system. The LSCO trajectory was activated on the 150th day, to ensure the model first reached baseline equilibrium with just civilian patients. At that point, we added an inbound surge of 150 combat casualties per day using the distribution of injury categories from the NDMS-surge model for 100 days. We derived this rate from the NDMS Pilot Program’s scenario of 1000 combat casualties per day for 100 days.32 Given that Omaha serves as one of 5 initial Pilot sites, we scaled the number of incoming combat casualties to Omaha’s size and location relative to the other 4 sites (Sacramento, California; Denver, Colorado; San Antonio, Texas; National Capital Region). We implemented combat casualty arrivals using the same random exponential function described above. We attributed higher priority to combat casualties, who would thus seize an available bed before a civilian patient. Combat casualties were assigned to the hospital with the shortest queue and would remain in queue through definitive care. Each combat casualty was assigned a DRG and a LOS (from the HCUP data) as well as an estimated payment and cost (from hospital cost-accounting data). For both civilian patients and combat casualties, we attributed payments to the day of arrival.
For each scenario (defined as a combination of hyperparameters described above), we performed 1500 simulations to derive robust estimates and confidence intervals. Following the simulations, we calculated descriptive statistics (mean and 95% confidence intervals) for each outcome. Outcomes were plotted over the entire simulation period, and we demarcated the 3 periods: baseline (days 1-149), NDMS activation (days 150-249), and recovery (days 250-349). We assessed outcomes for each of the 5 hospitals as well as aggregated over the region.
Results
Description of Raw Data
The cost-accounting data shared by the 2 Omaha health systems contained a total of 56,828 cases per year across 747 DRGs. Overall, the payer mix was 41% Medicare, 29% commercial insurance, 18% Medicaid, and 12% other or self-pay. Average LOS was 6 days (SD: 6.4 days). About a quarter (28%) of cases were considered elective admissions. The 2019-2020 HCUP data from Nebraska, Iowa, and Colorado contained 1,945,272 cases across 775 DRGs and 15,782 primary ICD-10 codes. Average LOS for these encounters was 4.7 days (SD: 7.4 days). Approximately one-quarter (24.8%) of encounters were documented as electives. Using the DRG-to-Injury category crosswalk, we calculated expected LOS, expected payer, expected payments, and total costs. Overall, across all general acute care hospitals included in the AHA data, the average hospital number of adult beds was 131 (SD 161); for the 5 hospitals in our model, this average was 226 (SD 216). Appendix Table 1 shows the linkages between the hospital financial data, HCUP data, and injury classifications. Expected payments and costs are proprietary and not shown.
Simulated Occupancy and Civilian Patient Displacement
Figure 2 shows changes in occupancy for each hospital following an NDMS activation. All hospitals began the simulation with zero occupancy. Average occupancy rapidly increased and reached an equilibrium by simulation day 50. Days 50-149 were considered pre-surge, normal baseline operating conditions. On day 150, when combat casualties began arriving in the Omaha area, hospitals’ average occupancies rapidly increased to maximum (100%) capacity and remained at capacity through the end of the combat casualty influx period. Following simulation day 250, when combat casualties stopped arriving, maximum capacity was briefly sustained, given longer LOS for many injury categories relative to civilian patients, then decreased quickly, falling briefly below pre-surge levels and then equilibrated.

Figure 2. Simulated occupancy across 5 hospital facilities following an NDMS activation during an LSCO.
Notes: Authors’ calculation is based on discrete event simulation model of average occupancy at each of the 5 Omaha hospital facilities. The simulation period is demarcated into baseline (days 1-149), activation (days 150-249), and recovery (days 250-349). The DES model runs under the scenario that, for the 100 activation days, 150 new combat casualties arrive daily at 5 Omaha-based civilian hospitals. Dark lines indicate means; shaded bars indicate 95% confidence intervals (CI). Means and CI were calculated over the 1500 simulations we ran.
Once a hospital reached maximum capacity, the model dictated that simulated civilian patients not given a bed within 12 hours of arrival would balk and leave the simulation. Prior to the influx of combat casualties, all hospitals had capacity to admit civilian patients. However, across simulations, an average total of 10,905 civilian patients [95% CI: 10551-11248] were displaced and (in our model) left untreated during the period in which combat casualties were arriving. Table 2 shows the estimated number of civilian patients displaced by combat casualties across hospitals. No combat casualties were left untreated during this period.
Table 2. Simulated civilian patient displacement across hospital facilities, represented as mean patient count and 95% confidence interval

Notes: Authors’ calculation is based on discrete event simulation model of civilian displacement under the scenario that, for 100 days (the surge period), 150 combat casualties are treated daily at 5 Omaha-based civilian hospitals. Means and 95% confidence intervals were calculated over the 1500 simulations we ran.
Figure 3 shows that civilian patient displacement varied across the 5 hospitals in our model. The dark line indicates the average level of civilian occupancy on each day of the simulation, and the lighter bars show the confidence intervals. After the NDMS activation, civilian occupancy was 0% at 2 hospital sites (A and C), meaning all civilians were replaced there. However, hospitals D and E maintained a small number of beds occupied by civilians and hospital B had a much higher occupancy (approximately 70%) by civilian patients. Civilian occupancy varied directly with available bed capacity.

Figure 3. Simulated changes in civilian occupancy across 5 hospital facilities following NDMS activation during an LSCO.
Notes: Authors’ calculation is based on discrete event simulation model of civilian displacement at each of the 5 Omaha hospital facilities. The simulation period is demarcated into baseline (days 1-149), activation (days 150-249), and recovery (days 250-349). The DES model runs under the scenario that, for the 100 activation days, 150 new combat casualties arrive daily at 5 Omaha-based civilian hospitals. Dark lines indicate means; shaded bars indicate 95% confidence intervals (CI). Means and CI were calculated over the 1500 simulations we ran. Here, 0% civilian occupancy = 100% displacement by combat casualties.
Financial Impact
During the NDMS activation, hospitals will lose revenue from civilian patient displacement (see Table 2) and will earn revenue from new combat casualty reimbursements. Table 3 shows the impact on hospital finances of adding 150 combat casualties per day, under different scenarios as to the amount hospitals will be reimbursed by the government, or government agencies. Column 2 in Table 3 shows the average total revenue (payments) for combat casualties under each of our different reimbursement/surge-capacity scenarios. Column 3 shows how changing patient composition impacts hospitals’ overall net income, expressed as a percent change from simulated pre-surge net income. For example, under the scenario that hospitals are reimbursed 125% of the Medicare reimbursement rate for combat casualties, we estimated total combat casualty payments to be $462 million and hospitals would see a net income gain of 2,281% of their pre-surge 100-day baseline. Therefore, if a hospital’s net income over the 100 days prior to the surge was $10,000, the hospital’s net income would increase to $238,100 during an influx of combat casualties. In contrast, under the scenario that hospitals are reimbursed 75% of Medicare rates, we estimated total combat casualty payments to be $277 million and, assuming the same theoretical $10,000 100-day net income (prior to the surge), the influx of combat casualties would cause the hospital to lose $315,110.
Table 3. Simulated aggregate financial impact to 5 Omaha hospitals during the proposed NDMS activation under different reimbursement scenarios

Notes: Authors’ calculation is based on discrete event simulation model of civilian displacement under the scenario that, for 100 days (the activation period), 150 combat casualties are treated daily at these 5 Omaha-based civilian hospitals. ‘Medicare’ indicates the expected Medicare reimbursement rate (allowed amount) for a given diagnosis-related group (DRG). ‘Surge capacity’ indicates the percent of additional beds made available at each of the 5 hospital facilities. Aggregate Payments were calculated as the total reimbursements made by the government for all treated combat casualties over the entire surge period, and are averaged across the 1500 simulations. Change in Aggregate Hospital Net Income was calculated as the difference between net income under the surge scenario (i.e., for combat casualties and any non-displaced civilian patients) and net income the hospital would have received had they received no combat casualties and continued to just treat civilians under usual circumstances.
Finally, Figure 4 shows hospitals’ average net income for each simulated day with 95% confidence intervals under the 125% Medicare payment scenario. Some hospitals in the simulation showed negative net income prior to NDMS activation. During activation, however, under the combat casualty reimbursement rate of 125% Medicare payment, hospitals showed a consistent or slightly increased net income. Under lower reimbursement percentage scenarios, all hospitals showed significant decreases in net income.

Figure 4. Simulated net income changes across 5 hospital facilities following an NDMS activation during an LSCO under scenario of combat casualty reimbursement at 125% of Medicare rate.
Notes: Authors’ calculation is based on discrete event simulation model of net income changes from civilian displacement with combat casualties at each of the 5 Omaha hospital facilities. The simulation period is demarcated into: baseline (days 1-149), activation (days 150-249), and recovery (days 250-349). The DES model runs under the scenario that, for the 100 activation days, 150 new combat casualties arrive daily at the 5 Omaha-based civilian hospitals and that hospitals are reimbursed for combat casualties 125% of the Medicare reimbursement rate. Dark lines indicate means; shaded bars indicate 95% confidence intervals (CI). Means and CI were calculated over the 1500 simulations we ran. Here, 0% civilian occupancy= 100% displacement by combat casualties.
Discussion
Activation of NDMS following an influx of combat casualties during an LSCO will require clear reimbursement agreements with civilian health care systems. By evaluating different reimbursement scenarios, our results elucidated how health care revenue will change if many combat casualties require definitive care. Using our simulated model, which focused on 5 hospitals in a single NDMS Pilot site, we found significant civilian patient displacement and wide variation in impact on hospitals’ finances, depending on the proposed reimbursement scenario. Notably, hospitals have increased their net income under scenarios that provided 125% of the Medicare reimbursement rate, which is the currently published rate for NDMS participants.21 Non-NDMS participants, however, who would only receive 100% of Medicare rates,21 would see significant income declines.
Our results are supported by and should be interpreted within the context of the COVID-19 literature, specifically how the COVID-19 pandemic affected hospital finances. Like hospitals receiving combat casualties in our simulated model, hospitals treating large number of COVID-19 infections experienced massive influxes in lower-margin trauma admissions and corresponding decreases in higher-margin but non-urgent elective procedures.Reference Birkmeyer, Barnato, Birkmeyer, Bessler and Skinner33, Reference Best, McFarland, Anderson and Srikumaran34 This “normal” patient displacement, in turn, had financial implications for hospitals. One study, for example, found that compared with 2019, a hospital’s 2020 net patient revenues fell by 3.2%, while operating expenses increased by 1.5% and operating margins fell 130% on average, or 5.3 percentage points. In response, the federal government enacted assistance programs on an unprecedented scale, which helped hospitals’ 2020 profit margins remain similar to prior years.Reference Rhodes, Santos and Young35
Results from this simulation could be useful to federal, state, and local decision-makers—including policymakers and hospital administrators—at all levels of disaster preparedness. While the scope of an LSCO-based NDMS activation cannot be perfectly predicted, for instance, in terms of the number, acuity, or duration of repatriated combat casualties, simulation models still provide useful estimation of average effect size and variance. Additionally, our model highlights opportunities for military-civilian collaboration across the health sector. For example, our model relied on hospitals’ proprietary quantitative data (e.g., patient mix, cost, revenue), some of which cannot be gleaned from publicly available data. Additional data sharing agreements between civilian and military partners used to inform simulated models could increase civilian hospitals’ willingness to treat combat casualties during an LSCO, as well as catalyze financial and policy decision-making and negotiations.
A benefit of our methodology is ease of replication and adaptation. Researchers can replicate our simulations using datasets generated from any health care facility to model impact within local markets and with a variety of reimbursement scenarios. Such replications could also address some of our model limitations: First, our simulation focused on only 5 hospitals in one mid-sized city, which limits generalizability. Currently, there are nearly 1800 NDMS-participating hospital facilities across the US,11 and facility and regional characteristics vary greatly, including their sizes, payer mixes, and capacity constraints.32 In the event of an NDMS activation, the 65 Veterans’ Affairs and DOW Federal Coordinating Centers would manage the medical distribution of combat casualties to NDMS participants.11 The location, size, and scope of the LSCO would influence where incoming combat casualties are sent, and it is possible that only some facilities or regions would receive casualties, or potentially all. Therefore, to accurately capture the financial impact of an LSCO, next steps should include a robust model of each region alongside a national model that incorporates capacity estimates, throughput projections, and economic modeling.
A regional model could include the addition of post-acute care facilitiesReference Ajibade, Sethi and Lee36 (e.g., skilled nursing, rehabilitation, long-term acute care) and/or hospital transfers, both of which would improve understanding of how combat casualties would move within a geographic area. Regarding post-acute care, many injuries will require extensive rehabilitation, with or without initial acute care hospitalization. Rehab facilities often face staffing limitations and may not be able to surge like hospitals. Without the ability to quickly discharge from acute care facilities to post-acute care, hospitals will also be limited in their ability to accept additional combat casualties requiring higher levels of care. Regarding transfers, allowing for civilian patient or combat casualty movement between facilities—either intra-system transfers (“level-loading”) or transfers between health systems—could smooth capacity and improve outcomes. Model replications with larger geographic foci should incorporate transfers parameterized by findings from the large literature on system-level planning.Reference Hick, Einav and Hanfling28, Reference Barghi Shirazi, Moslehi, Rasouli and Masoumi37–39
Similarly, replications could also enable simulating alternative assumptions about the characteristics of combat casualties, such as their arrival rate, their number, and their severity or type. In our model, we assumed casualties arrived at a constant rate (150 per day for 100 days), but influx may be more dispersed. Additionally, our model relied on a predicted distribution of injuries (from the NDMS-surge model), which might not match the actual distribution.
Third, this simulation featured almost 100% replacement of civilian patients with combat casualties in 4 of the 5 hospitals in our sample, because combat casualties took higher priority over civilian patients regardless of civilian procedure (i.e., DRG). Allowing the model to demonstrate complete displacement of civilian patients with combat casualties is likely unrealistic and results should be caveated as an extreme scenario, especially given laws such as the Emergency Medical Treatment and Active Labor ActReference Lerner, Schwartz and Coule40 as well as published mass casualty triage guidelines like “Sort, Assess, Lifesaving Interventions, Treatment/Transport.”Reference Lerner, Schwartz and Coule40 More realistically, such laws and guidelines in addition to hospitals’ own surge protocols will determine which civilian patient cases (e.g., births, civilian traumas) are treated during LSCO-related NDMS activations. Future model iterations should incorporate scenarios in which acute civilian patients are prioritized equally to acute combat casualties. In addition, transfers either to post-acute facilities or other hospitals, as per our discussion above, could ameliorate displacement.
Finally, we only looked at changes to income that would occur during an NDMA activation and did not look at costs. Extrapolating from changes in net income to changes in net operating margins would only be valid under assumptions that marginal costs would remain constant, regardless of occupancy, surge status, or time. However, we know from experience with other disasters that capital and labor costs can increase non-linearly.Reference Brinster, Escousse and Rivera41 Increasing marginal costs would require larger (positive) aggregate net income changes to remain financially solvent. Finally, civilian revenue is known to be cyclical and varies over time;Reference Gibbs, Carr, Mulcahy and Walshe42 thus, the financial impact on hospitals could also vary depending on the timing of an LSCO.
Conclusion
Ensuring the US health care system’s readiness for an LSCO is critical to maintain health and mitigate potential long-term effects of disrupting access to care. Modeling the complex dynamics associated with NDMS activation permits comparisons of courses of action; our results show that hospitals stand to lose significant revenue unless reimbursement for combat casualty care is sufficiently high. It is encouraging that, under currently published reimbursement rates, scenarios used in our models indicate that net income will remain positive, although this is for contracted NDMS-participants only. Government relief programs that stem profit losses during an LSCO-associated NDMS activation may reassure the rest of the civilian health care system and encourage health care system stability while maximizing patient health outcomes.
Supplementary material
The supplementary material for this article can be found at http://doi.org/10.1017/dmp.2026.10313.
Disclaimer
The opinions and assertions expressed herein are those of the author(s) and do not reflect the official policy or position of the Icahn School of Medicine at Mount Sinai, University of Nebraska Medical Center, Uniformed Services University of the Health Sciences, the Department of War, or The Henry M. Jackson Foundation for the Advancement of Military Medicine, Inc.
Competing interests
These authors have no conflicts to report.
Funding Statement
The authors would like to acknowledge support from U.S. Army Medical Research Acquisition Activity OTA Contract# W81XWH-15-9-0001. Dr. McCuskee would like to acknowledge funding from NIEHS 5K12ES33594. Dr. Zebrowski would like to acknowledge funding from NIMHD R01MD017495.


 Open access