


When societies face major challenges with far-reaching consequences, such as the COVID-19 pandemic, organizations across sectors are expected to publicly communicate, coordinate, and contribute to crisis relief efforts (Clarke & Fuller, Reference Clarke and Fuller2010; Fehsenfeld & Levinsen, Reference Fehsenfeld and Levinsen2019; Rim et al., Reference Rim, Yang and Lee2016; Selsky & Parker, Reference Selsky and Parker2005). Many organizations have recognized the value of social media for information sharing, crisis sense-making, and stakeholder engagement (Kim et al., Reference Kim, Saffer, Liu, Sun, Li, Zhen and Yang2021). Importantly, social media provides opportunities for organizations to build trust and garner support for cross-sector partnerships (Boyer, Reference Boyer2019).
When organizations such as government agencies, corporations, and nonprofits discuss crisis responses on social media, in addition to highlighting their own actions, they often mention their allies with whom they have collaborated in such actions. Organizations may also retweet/repost information from other organizations to promote shared values or useful information (Sun et al., Reference Sun, Yang and Saffer2021). Such communication practices create social-mediated, cross-sector networks, which are valuable for coordinating actions and resources and promoting strategic partnerships (Shumate et al., Reference Shumate, Fu and Cooper2018). The network approach to cross-sector partnerships is important because the formation and success of individual partnerships are usually embedded and contingent upon the functioning of the large-scale network (Manning & Roessler, Reference Manning and Roessler2014; Shumate et al., Reference Shumate, Fu and Cooper2018).
It is important to note that large-scale cross-sector networks would not be possible without brokersFootnote 1 who connect otherwise disconnected clusters (Burt, Reference Burt2004). Brokers could facilitate information exchange and mutual understanding across sectors, improve communication outcomes, and contribute to network formation (Stohl & Stohl, Reference Stohl and Stohl2005; Yang & Cheong, Reference Yang and Cheong2019). Nevertheless, the literature suggests that cross-sector relations in general and brokerage in particular are not always positively received by the public (Maktoufi et al., Reference Maktoufi, O’Connor and Shumate2020; Olson & Thjømøe, Reference Olson and Thjømøe2011). Research suggests that the public and stakeholders sometimes display distrust or disapproval toward cross-sector ties, and question involved organizations’ motivation, effectiveness, and relevant expertise (Maktoufi et al., Reference Maktoufi, O’Connor and Shumate2020; Olson & Thjømøe, Reference Olson and Thjømøe2011).
The situation thus poses a dilemma for organizations. In the social media era, many organizations are advised to communicate their crisis responses on social media to promote their socially responsible efforts (Kim et al., Reference Kim, Saffer, Liu, Sun, Li, Zhen and Yang2021). However, when they do communicate with their cross-sector partners on social media, it could be an uncharted territory, and public reactions are difficult to anticipate. How should organizations best approach cross-sector communication in times of heightened public attention? What are the factors that influence public reactions? To answer these questions, we identify different types of brokers that emerge in cross-sector networks and how the public respond to their roles.
We make several significant contributions to cross-sector partnership research. First, drawing from the brokerage typology literature (Gould & Fernandez, Reference Gould and Fernandez1989), our classification of five types of brokers (i.e., representative, gatekeeper, liaison, itinerant, and coordinator) shows how different types of within-sector and cross-sector brokers are received differently by the publics. The typology extends Manning and Roessler’s (Reference Manning and Roessler2014) concept of cross-sector bridging agents, who promote partnership formation across sector boundaries and translate complex conditions into opportunities. This typology provides a nuanced understanding of brokers in cross-sector partnerships.
Second, in addition to studying how organizations communicate cross-sector collaborations, we also explore how the public respond with different emotions to different types of brokers as a form of public engagement (Boyer, Reference Boyer2019). Our innovative approach of assessing public reactions at a large scale is valuable for the promotion of a wide range of cross-sector relationships on social media. When examining public responses, in addition to considering how being a certain type of broker affects a focal organization (known as first-order brokerage from the private goods perspective) (Burt, Reference Burt2004), we also explore the public goods perspective of brokerage by looking at how the public respond to the same-sector organizations connecting with brokers (known as second-order brokerage, see Burt, Reference Burt2007).
Finally, we propose that the impact of brokerage is moderated by organizations’ sector affiliations, meaning that governmental agencies, corporations, and nonprofits receive different public responses when performing the same broker roles. This may be because the public have different expectations toward organizations from different sectors and hold them to different standards (Selsky & Parker, Reference Selsky and Parker2005). This insight is valuable for cross-sector partnership managers to establish proper expectations of public responses and design their evaluation metrics accordingly.
To test our hypotheses, we collected COVID-19-related tweets from thousands of U.S. government agencies, corporations, nonprofits, and how publics commented on these organizations. We find that nonprofits playing brokerage roles are positively received by the public, but government organizations playing brokerage roles are more likely to be criticized by the public. Moreover, the nonprofits are more likely to receive spillover benefits than governments. Overall, this study makes unique contributions to the cross-sector communication literature and provides a nuanced understanding of brokers’ roles in bridging social sectors.
Cross-Sector Communication Networks: Opportunities and Challenges
Cross-Sector Communication on Social Media
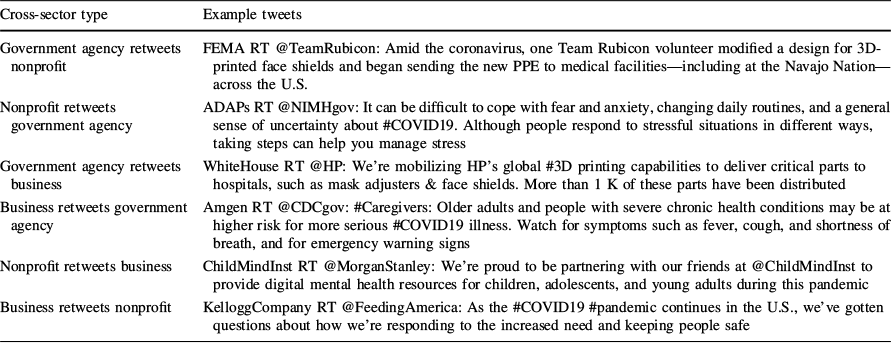
In today’s society, governments cannot sufficiently solve many social issues, nor could or should businesses be relied upon as the sole alternative to the state (Simpson et al., Reference Simpson, Lefroy and Tsarenko2011). Especially in times of great crisis, civil actors often step up and become an integral part of public service and strengthen the resilience of the overall system (Clarke & Fuller, Reference Clarke and Fuller2010). Nonprofits are broadly considered as able to address specialized needs, promote equality and inclusion, and advocate for the voiceless but are limited by their institutional power and resources (Stohl & Stohl, Reference Stohl and Stohl2005). With each sector’s strengths and limitations, it is unsurprising that cross-sector collaboration is ubiquitous nowadays (Clarke & Crane, Reference Clarke and Crane2018). Cross-sector collaboration can range from formal, contractual relationships to informal exchange of information or symbolic representation of shared values (Selsky & Parker, Reference Selsky and Parker2005). Around the world, companies often work with nonprofits to build trustworthy images in CSR projects while nonprofits can obtain resources to sustain their operation (Rim et al., Reference Rim, Yang and Lee2016). Government agencies may involve nonprofits in specialized governance issues, which allows nonprofits to grow their prominence and influence in public life (Brinkerhoff & Brinkerhoff, Reference Brinkerhoff and Brinkerhoff2002). Such cross-sector collaborations are prevalent in the context of COVID-19 (see Table 1, e.g., Tweets).
Table 1 Example tweets of cross-sector communication on COVID-19

Cross-sector type |
Example tweets |
|---|---|
Government agency retweets nonprofit |
FEMA RT @TeamRubicon: Amid the coronavirus, one Team Rubicon volunteer modified a design for 3D-printed face shields and began sending the new PPE to medical facilities—including at the Navajo Nation—across the U.S. |
Nonprofit retweets government agency |
ADAPs RT @NIMHgov: It can be difficult to cope with fear and anxiety, changing daily routines, and a general sense of uncertainty about #COVID19. Although people respond to stressful situations in different ways, taking steps can help you manage stress |
Government agency retweets business |
WhiteHouse RT @HP: We’re mobilizing HP’s global #3D printing capabilities to deliver critical parts to hospitals, such as mask adjusters & face shields. More than 1 K of these parts have been distributed |
Business retweets government agency |
Amgen RT @CDCgov: #Caregivers: Older adults and people with severe chronic health conditions may be at higher risk for more serious #COVID19 illness. Watch for symptoms such as fever, cough, and shortness of breath, and for emergency warning signs |
Nonprofit retweets business |
ChildMindInst RT @MorganStanley: We’re proud to be partnering with our friends at @ChildMindInst to provide digital mental health resources for children, adolescents, and young adults during this pandemic |
Business retweets nonprofit |
KelloggCompany RT @FeedingAmerica: As the #COVID19 #pandemic continues in the U.S., we’ve gotten questions about how we're responding to the increased need and keeping people safe |
As many individual organizations form dyadic relationships with each other, complex and large-scale interorganizational networks could gradually take shape (Shumate & O’Connor, Reference Shumate and O’Connor2010). These networks provide the social structures that further facilitate or constrain cross-sector collaboration. Increasingly, many organizations have taken their cross-sector communication to social media. Scholars have noted that the embracing of social media helps enhance transparency and collaboration in cross-sector partnerships. Studies have found that organizations from different sectors build hyperlink networks or use retweets/mentions/posts on social media to engage with each other, foster shared values, and create images of unified communities (Shumate et al., Reference Shumate, Fu and Cooper2018). Such networks may exhibit different patterns depending on the level of contentiousness of social issues in different communities (Häussler, Reference Häussler2019).
Despite their prevalence, previous research also identified various issues associated with collaborations and communication that span sectoral lines. Many have noted that diverse organizational goals, barriers in communication, perceptions of power imbalance and mistrust, and the management of complex logistics of working with geographically dispersed partners have traditionally constrained efforts to extend collaborations across sectoral boundaries (Manning & Roessler, Reference Manning and Roessler2014). These differences can lead to friction and hinder cohesive decision-making. Some suggest that cross-sector collaborations do not always serve public interest. Competing priorities between profit-driven private sector entities and public or nonprofit organizations can result in initiatives that prioritize organizational benefits over societal needs. Even in the digital realm, research suggests that network ties in cross-sector collaborations are often fractured along geographic and sectoral lines (Shumate & O’Connor, Reference Shumate and O’Connor2010).
In addition, it is necessary to recognize that cross-sector communication on social media is often representational in the sense that such communication not only exchanges information between connecting organizations, but also conveys symbolic signals to the public and other stakeholders (Maktoufi et al., Reference Maktoufi, O’Connor and Shumate2020; Shumate & O’Connor, Reference Shumate and O’Connor2010). Such publicly visible symbolic signals project a sense of unity and solidarity. As the public read the tweets that reflect interactions among organizations, they could gain a sense of who are the organizations involved and these organizations’ stands, values, and actions on issues. Regardless of collaborators’ intentions, cross-sector collaborations are not always perceived positively. Studies show that some collaborations could trigger stakeholder skepticism and criticism (Maktoufi et al., Reference Maktoufi, O’Connor and Shumate2020; Olson & Thjømøe, Reference Olson and Thjømøe2011; Shumate & O’Connor, Reference Shumate and O’Connor2010).
Public Response to Cross-Sector Communication
The public visibility of connections on social media makes public response critical to the legitimacy of cross-sector collaborations (Boyer, Reference Boyer2019). Recent research has emphasized the importance of citizen engagement and information exchange in shaping perceptions of such collaborations (Boyer, Reference Boyer2019). During crises such as COVID-19, heightened uncertainty and risk further amplify the emotional intensity of public responses to organizational crisis communication (Eisele et al., Reference Eisele, Litvyak, Brändle, Balluff, Fischeneder, Sotirakou, Ali and Boomgaarden2022). In this study, we explore how cross-sector communication affects public response in a networked context.
While previous studies on cross-sector communication provide valuable insights, most rely on experiments or surveys and typically focus on one or a few organizations. Consequently, little is known about how the public responds to cross-sector ties within a networked, socially mediated context. This gap is problematic because cross-sector communication rarely occurs in isolation. The public often evaluates organizational alliances not as isolated incidents but as part of a dynamic, interconnected information system. Moreover, as cross-sector collaborations are shared widely on social media, these connections become publicly visible, enabling the public to engage with organizations more readily. Such visibility can also facilitate public pressure on service managers for changes in cross-sector partnerships (Boyer, Reference Boyer2019).
Given these dynamics, a computational approach leveraging big data can offer more realistic models to account for the complex interplay of factors influencing public responses. This study examines how the public and stakeholders respond to brokers who bridge otherwise disconnected organizations within and across sectors. Brokers are central to large-scale cross-sector networks, as such networks would not be possible without their efforts (Quintane & Carnabuci, Reference Quintane and Carnabuci2016). Specifically, we ask: How do the public and stakeholders respond to brokers’ messages when they establish these connections? Do public responses vary depending on the type of actor involved (e.g., governmental, corporate, or nonprofit)? Furthermore, does the presence of brokers influence how the public perceives and responds to the surrounding organizations? We explore these questions in the sections that follow.
Toward a Nuanced Understanding of Brokerage
The Multifaceted Brokerage
Brokers are an important type of critical actors who contribute to building partnerships by interacting with other constituents across organizational boundaries (Manning & Roessler, Reference Manning and Roessler2014). In the context of cross-sector communication, some brokers bridge disconnections within a sector, while others bridge disconnections with partners from another sector or even multiple sectors. Hence, without cross-sector brokers, cross-sector networks are unlikely to form. When bridging across sectors, brokers not only mediate the flows of communication, they also negotiate organizational norms and identities associated with different sectors (Maktoufi et al., Reference Maktoufi, O’Connor and Shumate2020). Brokerage is not a single instance of action, but a mechanism by which disconnected actors can interact socially, economically, and politically (Stovel & Shaw, Reference Stovel and Shaw2012). The crucial characteristics of brokers are that they bridge gaps in social structure and help “goods, information, opportunities, or knowledge flow across that gap” (Stovel & Shaw, Reference Stovel and Shaw2012; p.141).
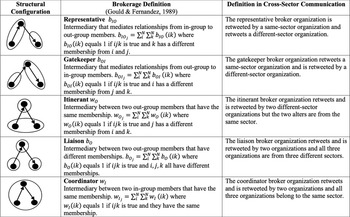
The complexity of social-mediated cross-sector communication calls for a brokerage typology that recognizes the different roles that brokers perform when bridging sectors. Drawing from Gould and Fernandez (Reference Gould and Fernandez1989), in this study, we identify five distinctive types of brokers, including one type of within-sector brokers and four types of cross-sector brokers. These five types of brokers differ based on whether the broker is in the same group as neighbors and the direction of communication.
Specifically, as illustrated in Fig. 1, for representative and gatekeeper roles, a broker is in the same sector as one of the neighbors. An example would be a nonprofit broker connecting with another nonprofit and a corporation. The broker may predominantly share interests with the same-sector neighbor, and it plays an important role in letting in outside information or representing its own sector’s view. For liaison and itinerant, the broker links two actors that belong to different sectors than the broker itself. The broker may hold values and interests that are different from those of both neighbors. Previous research shows that a broker needs to be disinterested and fair enough to play the liaison or itinerant role (Fernandez & Gould Reference Fernandez and Gould1994). An example of an itinerant broker is a government agency that mediates between two companies. Finally, the coordinator role means all three actors belong to the same sector and may face fewer challenges of coordinating between cross-sector organizations. This typology captures different configurations in what Manning and Roessler (Reference Manning and Roessler2014) conceptualize bridging agents as a collective process involving internal and external intermediaries. Studies adopting this typology found that different broker roles lead to varied outcomes. For instance, Balachandran and Hernandez (Reference Balachandran and Hernandez2018) found that when a broker is not in the same institution with either neighbor, such brokerage is associated with innovation radicalness, because crossing both structural and institutional boundaries exposes actors to very different information. In comparison, when three parties are within the same institutional boundary, brokerage is associated with innovation volume, because a shared institutional base would facilitate the integration of novel information.

Fig. 1 Visualization and explanation of five types of brokers
The Moderating Role of Organizations’ Sector Affiliations
Additionally, previous research found that the outcome of brokerage may be moderated by brokers’ sectoral affiliations in a cross-sector collaboration context. This may be due to the fact that the public have different perceptions and expectations about each sector. As noted by Brinkerhoff and Brinkerhoff (Reference Brinkerhoff and Brinkerhoff2002), the publics often expect the government to be impartial in their interaction with businesses and nonprofits, and some critics are worried that governmental organizations can be monolithic and intrusive, and there might be power asymmetry. Businesses are commonly considered as more effective and able to provide cost-efficient solutions, but they can also be seen as uncaring and harboring unrevealed interests. Nonprofits are seen as community- or value-driven, but may be considered powerless when interacting with organizations from other sectors. These expectations could shape how the public evaluate cross-sector communication. For instance, in a study of brokerage in the health policy domain, Fernandez and Gould (Reference Fernandez and Gould1994) found that for government agencies, whether they held a disinterested policy position would affect the effect of liaison and itinerant roles, because these two roles would require the broker to be fair. Informed by previous research, we expect that in the context of crisis communication, organizations’ sector affiliation could also moderate public response to their brokerage.
So far, we have discussed different types of brokers and moderators in the context of cross-sector communication. Next, we outline outcomes that are associated with these variables.
Brokerage Outcomes: Private and Public Goods Aspects
Brokerage can be understood as an important form of social capital, because brokers are positioned with competitive advantages to access and control information (Burt, Reference Burt2004). Burt’s (Reference Burt2004) original concept of brokerage is related to its impact as a type of private goods, where brokers could leverage their network positions to maximize their own interests. This stream of private goods research on brokerage focuses on how brokers themselves benefit from such network positions. Later research expands this concept to examine brokerage as public goods, where brokers can spill benefits to others who are their close contacts (Burt, Reference Burt2007; Clement et al., Reference Clement, Shipilov and Galunic2018). This stream of public goods research on brokerage focuses on how connecting to brokers can bring benefits and thus shift attention to the community around brokers rather than just brokers themselves.
Specifically, in this study, in terms of the outcomes of brokerage, we focus on public emotional responses to brokers and their neighbors. We focus on these two outcomes because interorganizational communication on social media is publicly visible and could serve strategic communication purposes (Shumate & O’Connor, Reference Shumate and O’Connor2010). Scholars have noted that without public support, cross-sector partnerships could hardly sustain or succeed (Selsky & Parker, Reference Selsky and Parker2010). Attracting public attention, increasing public awareness, and managing stakeholder relationships on social media are critical for generating public support. As argued above, previous studies suggest that public emotional responses are important indicators of whether the public support or oppose cross-sector relationships (Maktoufi et al., Reference Maktoufi, O’Connor and Shumate2020; Olson & Thjømøe, Reference Olson and Thjømøe2011). In addition, when a brokerage is well-received among stakeholders, it may increase tie-formation opportunities for organizations associated with the broker (Yang & Cheong, Reference Yang and Cheong2019).
Private Goods and Brokerage
Burt’s (Reference Burt2004) structural hole theory articulates the advantages of brokerage, particularly for brokers themselves. According to Burt, brokers can exert influence by mediating interactions between disconnected actors, potentially leveraging these interactions to play one side against another. A central assumption of structural hole theory is that actors strategically exploit network structures for personal gain. Subsequent research largely supports the value of brokerage for individual brokers. Extending this logic, it is plausible that organizations occupying broker positions could also benefit, attracting heightened emotional responses—whether positive or negative—from the public regarding their initiatives. Specifically, when organizations adopt different types of broker roles (e.g., representative, gatekeeper, liaison, itinerant, or coordinator), their audiences are likely to recognize these functions and respond in varied ways. Previous research has established the connection between audience emotional reactions to organizations’ social media communication strategies (Imran et al., Reference Imran, Ofli, Caragea and Torralba2020). Furthermore, as previously discussed, public perceptions and expectations of organizations often vary across sectors. Consequently, sector affiliation is likely to moderate how the public responds to these broker roles. Based on this reasoning, we propose:
H1
Organizations that perform one or several of the broker roles (i.e., representative, gatekeeper, liaison, itinerant, and coordinator) in a cross-sector communication network would receive significantly more emotional (both positive and negative) public responses than non-broker organizations.
H2
Organizations’ sector affiliations (government agencies, businesses, and nonprofits) would significantly moderate emotional (both positive and negative) public responses to different types of broker roles.
Public Goods and Brokerage
The public goods perspective considers the effect of the presence of brokers for others socially close to them (also known as second-order brokerage, see Burt, Reference Burt2007). Empirically, this is examined through how a focal actor benefits from others’ brokerage, or if connecting to brokers could benefit the focal actor. According to Burt (Reference Burt2007), connecting with brokers increases the resources and opportunities available to focal actors, because brokers tend to have better access to resources. As such, a focal actor connecting to a broker could have more diverse perspectives at disposal, and benefit from the possibility of more nonredundant opportunities (Obstfeld, Reference Obstfeld2005).
Existing research on second-order brokerage showed mixed evidence. Burt’s (Reference Burt2007) study on supply chain managers, investment bankers, and analysts showed that such indirect brokerage was unassociated with performance. Burt explained that first-order brokerage generates more returns than second-order brokerage especially when resource flow is fluid, which makes direct relationships more meaningful in information transmission; and when the focal actor prefers to search for solutions locally. Galunic et al. (Reference Galunic, Ertug and Gargiulo2012) showed the positive externalities of network brokerage can be transmitted to indirect contacts, but only when they are leaders in the organization, because higher rank would boost the advantage of being a broker, and leaders are more motivated to broker resources for subordinate neighbors.
Following research findings that brokers have an unequal influence on their contacts, we propose that an actor is more likely to be influenced by its neighbors’ brokerage if they share sector membership. This argument is based on recent studies on how a focal actor could benefit from closely-connected brokers (Clement et al., Reference Clement, Shipilov and Galunic2018). That is, brokers can generate positive externalities by passing novel ideas to fellow community members (Clement et al., Reference Clement, Shipilov and Galunic2018). Thus, sharing sector membership may facilitate the benefits of brokerage to spill over. To guide our analysis, we ask if connecting with different types of brokers will benefit same-sector contacts.
In addition, as argued above, due to the different public expectations for the three sectors, we also explore if brokers’ sector affiliations moderate the spillover effects. This can also be explained by the different characteristics of within-sector connections. For example, NGOs primarily build interorganizational networks to collaborate on providing public service during crises and consolidate overlapping issue identities (Li et al., Reference Li, Shin, Sun, Kim, Qu and Yang2021). By comparison, corporations tend to form networks with others from dissimilar industries to avoid competing for public attention from similar segments of consumers. Further, for government agencies, agencies centralized in certain public services (e.g., Federal Emergency Management Agency, Centers for Disease Prevention and Control (CDC)), based on preexisting protocols, may play an especially critical role in ensuring coordination among involving government agencies. These different within-sector relations may affect the extent to which the benefits of brokerage would spill over to their same-sector neighbors. Hence, we propose the following research questions:
RQ1
How does the presence of various types of brokers (i.e., representative, gatekeeper, liaison, itinerant, and coordinator) in a cross-sector communication network affect connected members’ emotional (both positive and negative) public responses that they receive?
RQ2
Do brokers’ sector affiliations (government agencies, businesses, and nonprofits) moderate its contacts’ emotional (both positive and negative) public responses?
Method
Data Collection
Our study focuses on cross-sector communication networks formed during the initial half year of the COVID-19 outbreak in the United States. This is the period when organizations from different sectors began to form cross-sector collaborations, and brokers may play an especially important role introducing new collaborations. We collected data from Twitter/X because it is one of the most widely used social media platforms by organizations from multiple sectors (Li et al., Reference Li, Shin, Sun, Kim, Qu and Yang2021). For nonprofits, Twitter/X is increasingly important for public education, mobilization, and advocacy (Li et al., Reference Li, Shin, Sun, Kim, Qu and Yang2021). For corporations, Twitter/X is an important channel for responding to stakeholders’ demands and showcasing CSR (Rim et al., Reference Rim, Yang and Lee2016).
Our sample consists of a representative list of U.S. organizations that included: (1) US federal government departments, federal and regional health agencies, and the governor and senatorFootnote 2 of each state; (2) Fortune 1,000 US companies; and (3) a list of top 1,000 US nonprofits from the Guide Star database (guidestar.org) based on revenues. In addition, since some active nonprofits in the COVID-19 issue space may not necessarily have large revenues, we then used a large-scale Twitter/X dataset collected through COVID-19 keywords (Chen et al., Reference Chen, Lerman and Ferrara2020) to identify additional nonprofits that actively tweeted about COVID-19. With the compiled list of around four thousand accounts, we retrieved the most recent 3200Footnote 3 tweets from each account and retained the tweets containing the same COVID-19 keywords in Chen et al.’s (Reference Chen, Lerman and Ferrara2020) dataset. We focus on retweet relations because retweets may indicate agreement with the content of the messages (Yang and Saffer, Reference Yang and Saffer2021). An example of a government agency retweeting a nonprofit or a firm may be about how the nonprofit or the firm produces facilities and equipment for the pandemic. An example of a nonprofit and a firm retweeting a government agency may be about further broadcasting essential guidelines and cautious behaviors to tackle COVID-19. An example of retweeting between a nonprofit and a firm may be about collaboration in responses. Between January 6th and May 31st, we obtained 21,139 retweet relations among 1,696 organizations, including 311 government agencies, 138 companies, and 1,247 NGOs. The retweet network was dichotomized on the tie weight of one.Footnote 4
Dependent Variables
Emotional Public Response
To calculate emotional public response toward these organizations, we searched in one of the most comprehensive COVID-19 dataset collected by Chen et al. (Reference Chen, Lerman and Ferrara2020), which contained over one hundred million tweets about COVID-19 between January and May, 2020. For 1,696 organizations, we retrieved all the tweets initiated by Twitter/X users that mentioned these organizations. An example of a public mention tweet directed at an organization is “@WHO what a joke of an organization,” which includes the account name of the organization mentioned and a piece of text. Among the 1,696 organizations, we found that 1,027 organizations received at least one public mention. Among these organizations, there are 289 government agencies, 116 companies, and 622 NGOs. They received 188,227 mentions from the general public (M = 182.92, SD = 1456.05). We removed URLs and account names mentioned and conducted lemmatization. After preprocessing, there were 178,456 non-empty tweets left.
To capture the positive and negative valence of public responses to organizations, we conducted sentiment analysis using four widely adopted methods. The first method is the Linguistic Inquiry and Word Count (LIWC) software, which has been widely used to analyze social media text (Tausczik & Pennebaker, Reference Tausczik and Pennebaker2010). This program calculates the percentage of positive words and negative words within a piece of text, and we classify a tweet as positive, neutral, or negative by comparing the positive–negative ratio, i.e., if there are more positive words than negative words, then this tweet is positive.
The second method is Valence Aware Dictionary for Sentiment Reasoning (VADER) (Hutto & Gilbert, Reference Hutto and Gilbert2014). This program is more sensitive to sentiment expressions in social media texts, which usually exhibit unique linguistic features such as slangs, emoticons, and repetition of punctuations. VADER also calculates a compound polarity score that normalizes between -1 and 1, with scores larger than 0 indicating positive sentiments.
The third method is Sentiment140, which has been proved to be an effective tool specialized at Twitter/X sentiment analysis (Zimbra et al., Reference Zimbra, Abbasi, Zeng and Chen2018). Sentiment140 uses a maximum entropy classifier trained on a large Twitter/X corpus and classifies text into positive, neutral, and negative.
Finally, since the above three methods did not specifically address the challenge of negation in sentiment analysis, the fourth method seeks to account for negation. We used the publicly available SentiWordNet lexicon and adopted a widely accepted negation rule defined as follows: negative sentiment means negative words not preceded by a negation within four words and positive words preceded by a negation within four words in the same sentence, and vice versa for positive sentiment.
All four methods of tweet sentiment analysis have advantages and disadvantages. Thus, we used a majority vote to determine the final sentiment class of each public mention tweet. That is, each tweet is classified into positive, neutral, and negative if at least two of the four methods agree on the classification. The four methods largely exhibited consistency. There were 6.98% of tweets showing an even split (2/2) between negative and neutral, 6.12% showing an even split between positive and neutral, and 1.57% showing an even split between positive and negative. For the former two cases, we prioritized positive and negative results. The rationale is that neutral sentiment may result from the brevity of tweets (up to 140 characters) which makes it difficult to match any words in lexicons (Zimbra et al., Reference Zimbra, Abbasi, Zeng and Chen2018). Neutral coding was tested in robustness checks. For the third case, the 1.57% of tweets were treated as positive in the main analysis and we tested the negative coding in robustness checks.
In the main analysis, 61,788 tweets are positive, 51,164 tweets are neutral, and 65,504 tweets are negative. Based on such classification, two binary variables of positive and negative public responses were created as dependent variables. For tweets that mention government organizations, 32.03% are positive tweets, and 25.88% are negative tweets; for tweets that mention nonprofit organizations, 23.73% are positive tweets, and 37.28% are negative tweets; for tweets that mention firms, 25.77% are positive tweets, and 35.82% are negative tweets.
Independent Variables
First-Order Brokerage
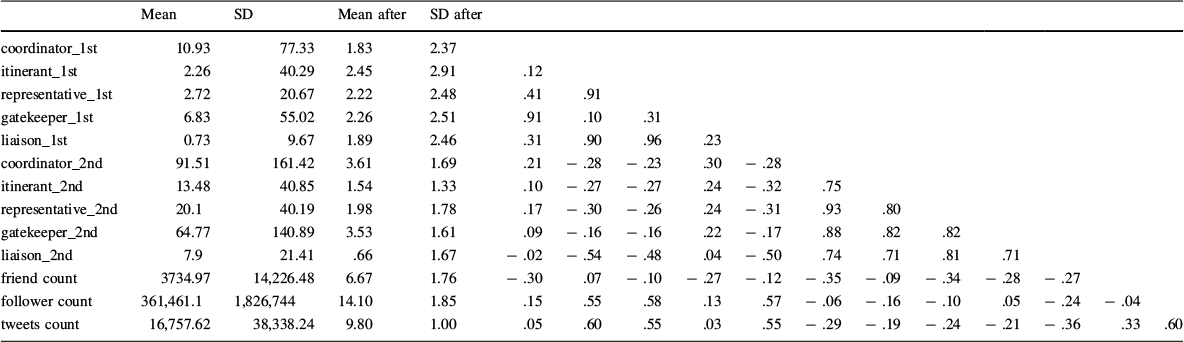
We performed the Gould–Fernandez brokerage analysis (also referred to as “G&F index”) as the measure for each focal organization’s first-order brokerage (Gould & Fernandez, Reference Gould and Fernandez1989). Using the trisector retweet network and sector membership, each actor was measured in terms of five types of brokerage: coordinator (M = 10.93, SD = 7.33), itinerant (M = 2.26, SD = 40.29), representative (M = 2.72, SD = 20.67), gatekeeper (M = 6.83, SD = 55.02), and liaison (M = 0.73, SD = 9.67).
Same-Sector Second-Order Brokerage
Following Burt (Reference Burt2007) and Clement et al. (Reference Clement, Shipilov and Galunic2018), we operationalized second-order brokerage as the average G&F index of a focal actor’s direct neighbors who shared the same sector as the focal actor. Consistent with first-order brokerage, coordinator (M = 91.51, SD = 161.42), representative (M = 20.1, SD = 40.19), and gatekeeper (M = 64.77, SD = 140.89) are higher than itinerant (M = 13.48, SD = 40.85) and liaison (M = 7.9, SD = 21.41). Organizations without same-sector neighbors would be removed for modeling in this part.
Control Variables
Topic
We controlled organizations’ recent topics in retweet networks to differentiate between how publics responded to what organizations said and their brokerage roles. We used latent Dirichlet allocation (LDA) to capture 19 prominent topics in the retweet network, including business, healthcare, test, sanitation, vulnerable, official, information, stay at home, social interaction, support, global, frontline, vaccine, strategy, risk, update, and mental. Organizations’ utterance of recent topics was treated as a control variable.
Tweets Count
We also controlled organizations’ general activity to engage with the public on Twitter/X. The number of tweets published was collected as an organizational covariate (M = 16,757.62, SD = 38,338.24).
Follower Count
The number of followers was included as an indication of organizations’ general popularity (M = 361,461.08, SD = 1,826,743.98).
Friends Count
The number of friends indicated the proportion of organizations’ followers that they also followed (M = 3,734.97, SD = 14,226.48).
State
Federal government departments were coded as “national,” and local health agencies, state governors, and senators were coded as their respective states. Companies and NGOs were coded by their headquarters locations. Descriptive statistics are shown in Table 2.
Table 2 Descriptive statistics of first-order and second-order brokerage
Mean |
SD |
Mean after |
SD after |
|||||||||||||
|---|---|---|---|---|---|---|---|---|---|---|---|---|---|---|---|---|
coordinator_1st |
10.93 |
77.33 |
1.83 |
2.37 |
||||||||||||
itinerant_1st |
2.26 |
40.29 |
2.45 |
2.91 |
.12 |
|||||||||||
representative_1st |
2.72 |
20.67 |
2.22 |
2.48 |
.41 |
.91 |
||||||||||
gatekeeper_1st |
6.83 |
55.02 |
2.26 |
2.51 |
.91 |
.10 |
.31 |
|||||||||
liaison_1st |
0.73 |
9.67 |
1.89 |
2.46 |
.31 |
.90 |
.96 |
.23 |
||||||||
coordinator_2nd |
91.51 |
161.42 |
3.61 |
1.69 |
.21 |
− .28 |
− .23 |
.30 |
− .28 |
|||||||
itinerant_2nd |
13.48 |
40.85 |
1.54 |
1.33 |
.10 |
− .27 |
− .27 |
.24 |
− .32 |
.75 |
||||||
representative_2nd |
20.1 |
40.19 |
1.98 |
1.78 |
.17 |
− .30 |
− .26 |
.24 |
− .31 |
.93 |
.80 |
|||||
gatekeeper_2nd |
64.77 |
140.89 |
3.53 |
1.61 |
.09 |
− .16 |
− .16 |
.22 |
− .17 |
.88 |
.82 |
.82 |
||||
liaison_2nd |
7.9 |
21.41 |
.66 |
1.67 |
− .02 |
− .54 |
− .48 |
.04 |
− .50 |
.74 |
.71 |
.81 |
.71 |
|||
friend count |
3734.97 |
14,226.48 |
6.67 |
1.76 |
− .30 |
.07 |
− .10 |
− .27 |
− .12 |
− .35 |
− .09 |
− .34 |
− .28 |
− .27 |
||
follower count |
361,461.1 |
1,826,744 |
14.10 |
1.85 |
.15 |
.55 |
.58 |
.13 |
.57 |
− .06 |
− .16 |
− .10 |
.05 |
− .24 |
− .04 |
|
tweets count |
16,757.62 |
38,338.24 |
9.80 |
1.00 |
.05 |
.60 |
.55 |
.03 |
.55 |
− .29 |
− .19 |
− .24 |
− .21 |
− .36 |
.33 |
.60 |
Brokerage measures are log transformed to reduce skewness
Analytical Strategy
To test how first-order and second-order brokerage are associated with public responses, we employed mixed-effects logistic regression models. Random effects can handle the clustering of public responses within organizations. Fixed effects of states can account for the different levels of pandemic seriousness, economic situations, and public policies in different states, and fixed effects of weeks can capture the fluctuation in public attention.
Results
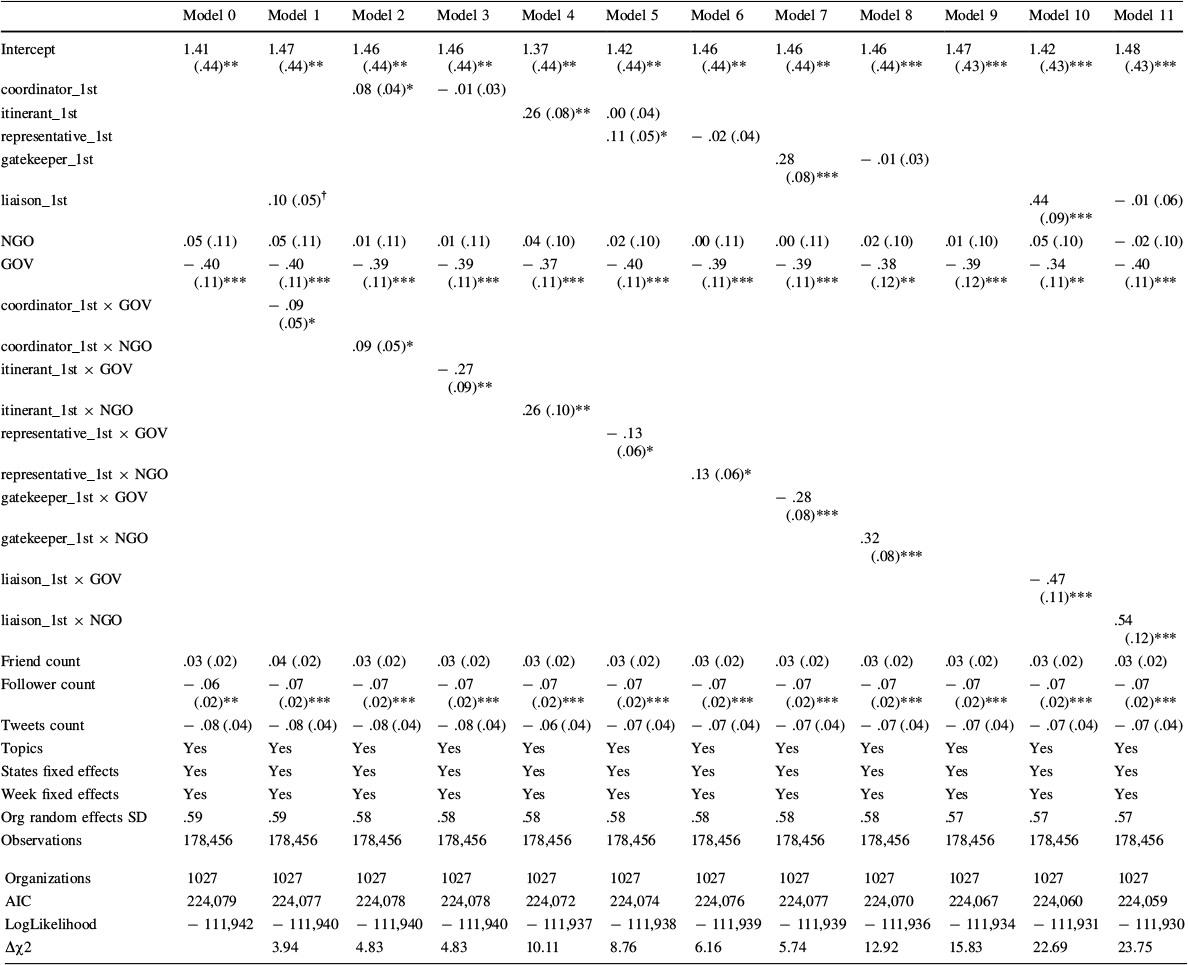
H1 and H2 examine the private goods perspective of brokerage. Tables 3 and 4 showed how first-order brokerage affected positive and negative public sentiment, and how such effects differed for different sectors. For organization types, we found that government agencies were less likely to receive positive responses and more likely to receive negative responses. It is likely that the public expected government agencies to take leadership during the outbreak period, and they were also more likely to receive blame.
Table 3 Mixed-effects logistic regression models of first-order brokerage on positive public response moderated by sector

Model 0 |
Model 1 |
Model 2 |
Model 3 |
Model 4 |
Model 5 |
Model 6 |
Model 7 |
Model 8 |
Model 9 |
Model 10 |
Model 11 |
|
|---|---|---|---|---|---|---|---|---|---|---|---|---|
Intercept |
1.41 (.44)** |
1.47 (.44)** |
1.46 (.44)** |
1.46 (.44)** |
1.37 (.44)** |
1.42 (.44)** |
1.46 (.44)** |
1.46 (.44)** |
1.46 (.44)*** |
1.47 (.43)*** |
1.42 (.43)*** |
1.48 (.43)*** |
coordinator_1st |
.08 (.04)* |
− .01 (.03) |
||||||||||
itinerant_1st |
.26 (.08)** |
.00 (.04) |
||||||||||
representative_1st |
.11 (.05)* |
− .02 (.04) |
||||||||||
gatekeeper_1st |
.28 (.08)*** |
− .01 (.03) |
||||||||||
liaison_1st |
.10 (.05)† |
.44 (.09)*** |
− .01 (.06) |
|||||||||
NGO |
.05 (.11) |
.05 (.11) |
.01 (.11) |
.01 (.11) |
.04 (.10) |
.02 (.10) |
.00 (.11) |
.00 (.11) |
.02 (.10) |
.01 (.10) |
.05 (.10) |
− .02 (.10) |
GOV |
− .40 (.11)*** |
− .40 (.11)*** |
− .39 (.11)*** |
− .39 (.11)*** |
− .37 (.11)*** |
− .40 (.11)*** |
− .39 (.11)*** |
− .39 (.11)*** |
− .38 (.12)** |
− .39 (.12)*** |
− .34 (.11)** |
− .40 (.11)*** |
coordinator_1st × GOV |
− .09 (.05)* |
|||||||||||
coordinator_1st × NGO |
.09 (.05)* |
|||||||||||
itinerant_1st × GOV |
− .27 (.09)** |
|||||||||||
itinerant_1st × NGO |
.26 (.10)** |
|||||||||||
representative_1st × GOV |
− .13 (.06)* |
|||||||||||
representative_1st × NGO |
.13 (.06)* |
|||||||||||
gatekeeper_1st × GOV |
− .28 (.08)*** |
|||||||||||
gatekeeper_1st × NGO |
.32 (.08)*** |
|||||||||||
liaison_1st × GOV |
− .47 (.11)*** |
|||||||||||
liaison_1st × NGO |
.54 (.12)*** |
|||||||||||
Friend count |
.03 (.02) |
.04 (.02) |
.03 (.02) |
.03 (.02) |
.03 (.02) |
.03 (.02) |
.03 (.02) |
.03 (.02) |
.03 (.02) |
.03 (.02) |
.03 (.02) |
.03 (.02) |
Follower count |
− .06 (.02)** |
− .07 (.02)*** |
− .07 (.02)*** |
− .07 (.02)*** |
− .07 (.02)*** |
− .07 (.02)*** |
− .07 (.02)*** |
− .07 (.02)*** |
− .07 (.02)*** |
− .07 (.02)*** |
− .07 (.02)*** |
− .07 (.02)*** |
Tweets count |
− .08 (.04) |
− .08 (.04) |
− .08 (.04) |
− .08 (.04) |
− .06 (.04) |
− .07 (.04) |
− .07 (.04) |
− .07 (.04) |
− .07 (.04) |
− .07 (.04) |
− .07 (.04) |
− .07 (.04) |
Topics |
Yes |
Yes |
Yes |
Yes |
Yes |
Yes |
Yes |
Yes |
Yes |
Yes |
Yes |
Yes |
States fixed effects |
Yes |
Yes |
Yes |
Yes |
Yes |
Yes |
Yes |
Yes |
Yes |
Yes |
Yes |
Yes |
Week fixed effects |
Yes |
Yes |
Yes |
Yes |
Yes |
Yes |
Yes |
Yes |
Yes |
Yes |
Yes |
Yes |
Org random effects SD |
.59 |
.59 |
.58 |
.58 |
.58 |
.58 |
.58 |
.58 |
.58 |
.57 |
.57 |
.57 |
Observations |
178,456 |
178,456 |
178,456 |
178,456 |
178,456 |
178,456 |
178,456 |
178,456 |
178,456 |
178,456 |
178,456 |
178,456 |
Organizations |
1027 |
1027 |
1027 |
1027 |
1027 |
1027 |
1027 |
1027 |
1027 |
1027 |
1027 |
1027 |
AIC |
224,079 |
224,077 |
224,078 |
224,078 |
224,072 |
224,074 |
224,076 |
224,077 |
224,070 |
224,067 |
224,060 |
224,059 |
LogLikelihood |
− 111,942 |
− 111,940 |
− 111,940 |
− 111,940 |
− 111,937 |
− 111,938 |
− 111,939 |
− 111,939 |
− 111,936 |
− 111,934 |
− 111,931 |
− 111,930 |
Δχ2 |
3.94 |
4.83 |
4.83 |
10.11 |
8.76 |
6.16 |
5.74 |
12.92 |
15.83 |
22.69 |
23.75 |
1. Only significant results are displayed. 2. Standard errors are in parentheses. 3. †p < .10; *p < .05; **p < .01; ***p < .001
Table 4 Mixed-effects logistic regression models of first-order brokerage on negative public response moderated by sector

Model 0 |
Model 1 |
Model 2 |
Model 3 |
Model 4 |
Model 5 |
Model 6 |
Model 7 |
Model 8 |
Model 9 |
Model 10 |
|
|---|---|---|---|---|---|---|---|---|---|---|---|
Intercept |
− 2.37 (.45)*** |
− 2.43 (.45)*** |
− 2.32 (.44)*** |
− 2.37 (.44)*** |
− 2.32 (.44)*** |
− 2.37 (.45)*** |
− 2.37 (.45)*** |
− 2.37 (.45)*** |
− 2.38 (.44)*** |
− 2.38 (.44)*** |
− 2.43 (.44)*** |
itinerant_1st |
− .29 (.09)** |
− .01 (.04) |
− .03 (.04) |
||||||||
representative_1st |
− .08 (.05)† |
.04 (.04) |
|||||||||
gatekeeper_1st |
− .22 (.08)** |
.02 (.03) |
|||||||||
liaison_1st |
− .09 (.05)† |
− .45 (.10)*** |
− .01 (.05) |
||||||||
NGO |
.06 (.11) |
.07 (.11) |
.08 (.11) |
.09 (.11) |
.10 (.11) |
.11 (.11) |
.08 (.11) |
.10 (.11) |
.07 (.11) |
.12 (.11) |
|
GOV |
.49 (.11)*** |
.49 (.11)*** |
.46 (.11)*** |
.49 (.11)*** |
.44 (.10)*** |
.47 (.11)*** |
.47 (.11)*** |
.45 (.12)*** |
.46 (.12)*** |
.43 (.11)*** |
.49 (.11)*** |
BUS |
− .03 (.11) |
||||||||||
itinerant_1st × GOV |
.29 (.10)** |
||||||||||
itinerant_1st × NGO |
− .24 (.10)* |
||||||||||
itinerant_1st × BUS |
− .52 (.27)† |
||||||||||
representative_1st × GOV |
.12 (.06)* |
||||||||||
representative_1st × NGO |
− .13 (.06)* |
||||||||||
gatekeeper_1st × GOV |
.23 (.09)** |
||||||||||
gatekeeper_1st × NGO |
− .28 (.09)** |
||||||||||
liaison_1st × GOV |
.48 (.11)*** |
||||||||||
liaison_1st × NGO |
− .42 (.12)*** |
||||||||||
Friend count |
− .03 (.02) |
− .04 (.02) |
− .03 (.02) |
− .03 (.02) |
− .03 (.02) |
− .03 (.02) |
− .03 (.02) |
− .03 (.02) |
− .03 (.02) |
− .03 (.02) |
− .03 (.02) |
Follower count |
.11 (.02)*** |
.12 (.02)*** |
.12 (.02)*** |
.12 (.02)*** |
.11 (.02)*** |
.12 (.02)*** |
.12 (.02)*** |
.12 (.02)*** |
.12 (.02)*** |
.12 (.02)*** |
.12 (.02)*** |
Tweets count |
− .01 (.04) |
.00 (.04) |
− .02 (.04) |
− .02 (.04) |
− .01 (.04) |
− .01 (.04) |
− .01 (.04) |
− .01 (.04) |
− .01 (.04) |
− .02 (.04) |
− .01 (.04) |
Topics |
Yes |
Yes |
Yes |
Yes |
Yes |
Yes |
Yes |
Yes |
Yes |
Yes |
Yes |
States fixed effects |
Yes |
Yes |
Yes |
Yes |
Yes |
Yes |
Yes |
Yes |
Yes |
Yes |
Yes |
Week fixed effects |
Yes |
Yes |
Yes |
Yes |
Yes |
Yes |
Yes |
Yes |
Yes |
Yes |
Yes |
Org random effects SD |
.56 |
.56 |
.55 |
.55 |
.56 |
.56 |
.56 |
.55 |
.55 |
.54 |
.56 |
Observations |
178,456 |
178,456 |
178,456 |
178,456 |
178,456 |
178,456 |
178,456 |
178,456 |
178,456 |
178,456 |
178,456 |
Organizations |
1027 |
1027 |
1027 |
1027 |
1027 |
1027 |
1027 |
1027 |
1027 |
1027 |
1027 |
AIC |
228,406 |
228,404 |
228,399 |
228,403 |
228,404 |
228,406 |
228,406 |
228,402 |
228,400 |
228,388 |
228,394 |
LogLikelihood |
− 114,106 |
− 114,104 |
− 114,101 |
− 114,103 |
− 114,103 |
− 114,104 |
− 114,104 |
− 114,102 |
− 114,101 |
− 114,095 |
− 114,098 |
Δχ2 |
3.65 |
10.31 |
6.80 |
5.64 |
3.91 |
4.19 |
7.44 |
9.73 |
22.28 |
15.32 |
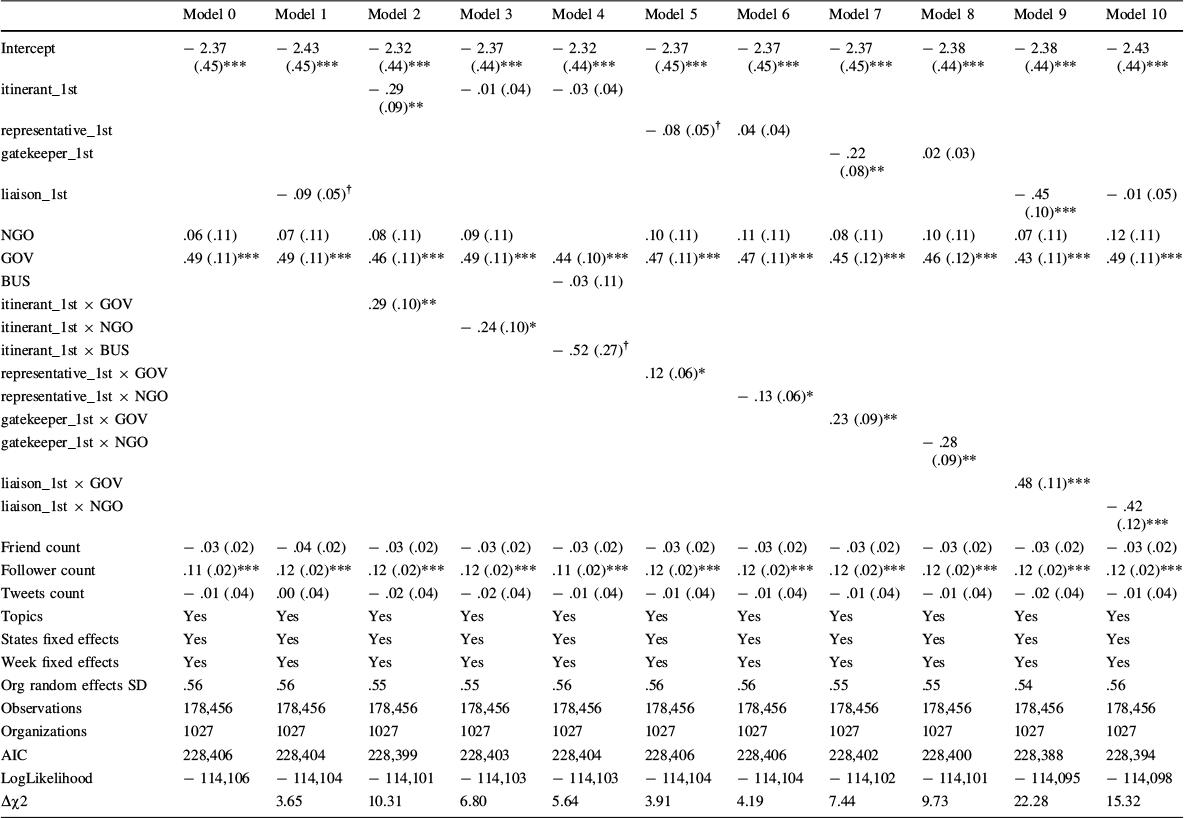
1. Only significant results are displayed. 2. Standard errors are in parentheses. 3. †p < .10; *p < .05; **p < .01; ***p < .001
Among all five brokerage types, only liaison brokerage had a marginally positive correlation with positive public sentiment, and a negative correlation with negative public sentiment. Liaison organization broker among three sectors and the difficulty of handling among three sectors require the broker to be impartial. The positive public responses toward liaison brokers highlight the necessity of cross-sector collaboration in a social crisis.
The moderation effects display a consistent trend. For positive public responses in Table 3, government sector affiliation had negative interactions with all five brokerage types, whereas nonprofits had positive interactions with five brokerage types. Similarly, for negative public responses in Table 4, government sector affiliation had positive interactions with all brokerage types but coordinator. That is to say, in this crisis, government organizations playing brokerage roles were more likely to be criticized by the public. Under comparison, nonprofits playing brokerage roles were positively received by the public.
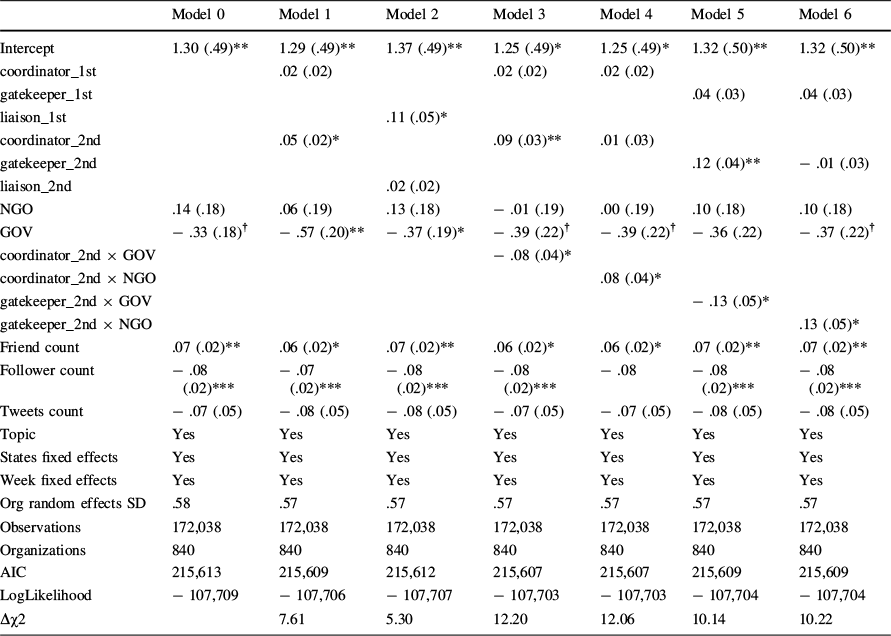
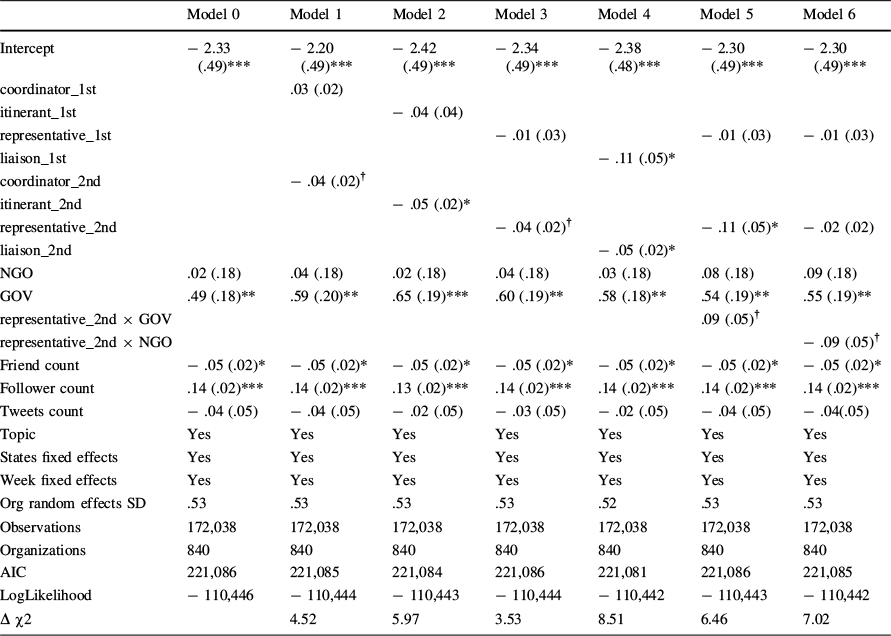
RQ1 and RQ2 examine the externalities of brokerage from the public goods perspective (Tables 5, 6). After controlling for first-order brokerage, second-order coordinator brokerage significantly associated with positive public responses. Although first-order liaison brokerage associated with positive public responses, the results showed that such an effect was unlikely to spill over to neighbors. However, for negative public responses, second-order liaison brokerage had a negative effect. Taken together, connecting to liaison brokers may not increase positive public responses but can reduce public criticism. Moreover, connecting to coordinator, itinerant, and representative brokers had the benefit of reducing public criticism.
Table 5 Mixed-effects logistic regression models of second-order brokerage on positive public response moderated by sector

Model 0 |
Model 1 |
Model 2 |
Model 3 |
Model 4 |
Model 5 |
Model 6 |
|
|---|---|---|---|---|---|---|---|
Intercept |
1.30 (.49)** |
1.29 (.49)** |
1.37 (.49)** |
1.25 (.49)* |
1.25 (.49)* |
1.32 (.50)** |
1.32 (.50)** |
coordinator_1st |
.02 (.02) |
.02 (.02) |
.02 (.02) |
||||
gatekeeper_1st |
.04 (.03) |
.04 (.03) |
|||||
liaison_1st |
.11 (.05)* |
||||||
coordinator_2nd |
.05 (.02)* |
.09 (.03)** |
.01 (.03) |
||||
gatekeeper_2nd |
.12 (.04)** |
− .01 (.03) |
|||||
liaison_2nd |
.02 (.02) |
||||||
NGO |
.14 (.18) |
.06 (.19) |
.13 (.18) |
− .01 (.19) |
.00 (.19) |
.10 (.18) |
.10 (.18) |
GOV |
− .33 (.18)† |
− .57 (.20)** |
− .37 (.19)* |
− .39 (.22)† |
− .39 (.22)† |
− .36 (.22) |
− .37 (.22)† |
coordinator_2nd × GOV |
− .08 (.04)* |
||||||
coordinator_2nd × NGO |
.08 (.04)* |
||||||
gatekeeper_2nd × GOV |
− .13 (.05)* |
||||||
gatekeeper_2nd × NGO |
.13 (.05)* |
||||||
Friend count |
.07 (.02)** |
.06 (.02)* |
.07 (.02)** |
.06 (.02)* |
.06 (.02)* |
.07 (.02)** |
.07 (.02)** |
Follower count |
− .08 (.02)*** |
− .07 (.02)*** |
− .08 (.02)*** |
− .08 (.02)*** |
− .08 |
− .08 (.02)*** |
− .08 (.02)*** |
Tweets count |
− .07 (.05) |
− .08 (.05) |
− .08 (.05) |
− .07 (.05) |
− .07 (.05) |
− .08 (.05) |
− .08 (.05) |
Topic |
Yes |
Yes |
Yes |
Yes |
Yes |
Yes |
Yes |
States fixed effects |
Yes |
Yes |
Yes |
Yes |
Yes |
Yes |
Yes |
Week fixed effects |
Yes |
Yes |
Yes |
Yes |
Yes |
Yes |
Yes |
Org random effects SD |
.58 |
.57 |
.57 |
.57 |
.57 |
.57 |
.57 |
Observations |
172,038 |
172,038 |
172,038 |
172,038 |
172,038 |
172,038 |
172,038 |
Organizations |
840 |
840 |
840 |
840 |
840 |
840 |
840 |
AIC |
215,613 |
215,609 |
215,612 |
215,607 |
215,607 |
215,609 |
215,609 |
LogLikelihood |
− 107,709 |
− 107,706 |
− 107,707 |
− 107,703 |
− 107,703 |
− 107,704 |
− 107,704 |
Δχ2 |
7.61 |
5.30 |
12.20 |
12.06 |
10.14 |
10.22 |
1. Only significant results are displayed. 2. Standard errors are in parentheses. 3. †p < .10; *p < .05; **p < .01; ***p < .001
Table 6 Mixed-effects logistic regression models of second-order brokerage on negative public response moderated by sector

Model 0 |
Model 1 |
Model 2 |
Model 3 |
Model 4 |
Model 5 |
Model 6 |
|
|---|---|---|---|---|---|---|---|
Intercept |
− 2.33 (.49)*** |
− 2.20 (.49)*** |
− 2.42 (.49)*** |
− 2.34 (.49)*** |
− 2.38 (.48)*** |
− 2.30 (.49)*** |
− 2.30 (.49)*** |
coordinator_1st |
.03 (.02) |
||||||
itinerant_1st |
− .04 (.04) |
||||||
representative_1st |
− .01 (.03) |
− .01 (.03) |
− .01 (.03) |
||||
liaison_1st |
− .11 (.05)* |
||||||
coordinator_2nd |
− .04 (.02)† |
||||||
itinerant_2nd |
− .05 (.02)* |
||||||
representative_2nd |
− .04 (.02)† |
− .11 (.05)* |
− .02 (.02) |
||||
liaison_2nd |
− .05 (.02)* |
||||||
NGO |
.02 (.18) |
.04 (.18) |
.02 (.18) |
.04 (.18) |
.03 (.18) |
.08 (.18) |
.09 (.18) |
GOV |
.49 (.18)** |
.59 (.20)** |
.65 (.19)*** |
.60 (.19)** |
.58 (.18)** |
.54 (.19)** |
.55 (.19)** |
representative_2nd × GOV |
.09 (.05)† |
||||||
representative_2nd × NGO |
− .09 (.05)† |
||||||
Friend count |
− .05 (.02)* |
− .05 (.02)* |
− .05 (.02)* |
− .05 (.02)* |
− .05 (.02)* |
− .05 (.02)* |
− .05 (.02)* |
Follower count |
.14 (.02)*** |
.14 (.02)*** |
.13 (.02)*** |
.14 (.02)*** |
.14 (.02)*** |
.14 (.02)*** |
.14 (.02)*** |
Tweets count |
− .04 (.05) |
− .04 (.05) |
− .02 (.05) |
− .03 (.05) |
− .02 (.05) |
− .04 (.05) |
− .04(.05) |
Topic |
Yes |
Yes |
Yes |
Yes |
Yes |
Yes |
Yes |
States fixed effects |
Yes |
Yes |
Yes |
Yes |
Yes |
Yes |
Yes |
Week fixed effects |
Yes |
Yes |
Yes |
Yes |
Yes |
Yes |
Yes |
Org random effects SD |
.53 |
.53 |
.53 |
.53 |
.52 |
.53 |
.53 |
Observations |
172,038 |
172,038 |
172,038 |
172,038 |
172,038 |
172,038 |
172,038 |
Organizations |
840 |
840 |
840 |
840 |
840 |
840 |
840 |
AIC |
221,086 |
221,085 |
221,084 |
221,086 |
221,081 |
221,086 |
221,085 |
LogLikelihood |
− 110,446 |
− 110,444 |
− 110,443 |
− 110,444 |
− 110,442 |
− 110,443 |
− 110,442 |
Δ χ2 |
4.52 |
5.97 |
3.53 |
8.51 |
6.46 |
7.02 |
1. Only significant results are displayed. 2. Standard errors are in parentheses. 3. †p < .10; *p < .05; **p < .01; ***p < .001
For interaction effects, consistent with findings of first-order brokerage, government organizations were less likely to receive positive externalities from coordinator and gatekeeper brokers, whereas nonprofits connecting to same-sector coordinators and gatekeepers were more likely to benefit from such externalities. Similar patterns were found for representative brokerage in terms of negative public responses.
Robustness Check
As the first robustness check, we tried the alternative coding of the 1.57% of disputable tweets (positive/negative split) and coded them as negative, which gave us 58,974 positive tweets, 68,318 negative tweets, and 51,164 neutral tweets. The new results were consistent with the main analysis.
As the second robustness check, we tried the alternative coding of 6.98% (negative/neutral split) and 6.12% (positive/neutral split) disputable tweets and coded them as neutral, which gave us 50,867 positive tweets, 53,043 negative tweets, 74,546 neutral tweets. The results were consistent with the main analysis and the first robustness check.
Discussion
Recognizing the importance of brokers in cross-sector communication, this study examines broker organizations that emerged in cross-sector communication during the initial stage of the COVID-19 pandemic and how the public responded to them on social media. Our findings showed that different types of brokers received significantly different public responses, and such responses were moderated by organizations’ sector affiliations.
Private Goods Perspective
The literature on brokerage tends to primarily define broker positions based on network structural features (Burt, Reference Burt2007). Nevertheless, the condition becomes complicated in the context of cross-sector partnerships, where cross-sector communication is common and organizations not only bridge network gaps, but also cross-sector boundaries (Boyer, Reference Boyer2019). Moreover, when such communication takes place on social media, the direction of information flow is also visible to the public and thus may influence public reactions. In this study, we conceptualize brokers based on organizations’ sector affiliations and the direction of information flow, and examine the role of brokerage through a novel and nuanced perspective.
Our analysis showed that while brokers may occupy advantageous network positions, their bridging efforts are not always received positively. Moreover, the organizations’ sector affiliations could moderate public responses. Specifically, previous studies have found that some brokers may receive negative responses when building cross-sector ties. These studies tend to attribute the public responses to the public’s individual characteristics (Maktoufi et al., Reference Maktoufi, O’Connor and Shumate2020; Olson & Thjømøe, Reference Olson and Thjømøe2011). Our study offers an alternative explanation based on the broker roles that organizations perform. Our analysis showed that, across the three sectors, when organizations primarily act as liaisons, they were more likely to be perceived positively. This finding shows that brokers mediating among the three sectors are likely to be perceived positively by the public.
Additionally, our analysis also found that across the three sectors, government agencies were more likely to receive negative responses than the other two sectors. It is likely that in times of a public health crisis, the public look up to government agencies for guidance and actions. Government agencies thus generally get blamed when things go wrong. We also find that government organizations functioning as any type of brokers were associated with less positive public response. This finding was consistent with negative public response except for coordinator broker type. This shows that in the COVID-19 public health crisis, although cross-sector collaboration has been perceived as essential, the public generally had distrust in government organizations coordinating with other sectors. Government sector should play a leadership role in a public crisis; however, such public distrust may impede policy implementation.
By sharp contrast, nonprofits playing brokerage roles were positively received by the public. This finding is consistent with that of previous cross-sector studies. For example, Moldavanova and Goerdel (Reference Moldavanova and Goerdel2018) noted that expanding social connections is widely considered as important for improving the capacity and sustainability of nonprofits. As such, stakeholders of nonprofits may well expect them to expand connections and function as brokers. In addition, research shows that the general public tends to hold positive attitudes toward nonprofits in comparison to government agencies and companies (Aaker et al., Reference Aaker, Vohs and Mogilner2010). As such, the reactions from both stakeholders and the public may be more favorable toward nonprofits than organizations from other sectors. That is to say, with public distrust toward government organizations, nonprofits could shoulder the function of connecting different sectors in a social crisis. Thus, sector affiliation matters.
Public Goods Perspective
The public goods perspective is especially relevant for cross-sector partnerships because the strengthening of communities of cross-sector collaborators is essential to address complex social issues (Clarke & Fuller, Reference Clarke and Fuller2010). The public goods perspective looks at brokers’ impact from their same-sector neighbors’ viewpoint, and asks what benefits can these neighbors receive. Although coordinator brokers did not bring themselves favorable public response, their same-sector neighbors received positive spillover. By comparison, although liaison brokers themselves were viewed positively by the public, their same-sector neighbors did not benefit from the positive spillover but could receive less negative response. Liaison brokers manage trisector relationships, their socially responsible image may spillover to neighbors, but sometimes the complexity of managing relations across three sectors may also come with risks.
The effects of second-order brokerage can be moderated by sector affiliations in the sense that relational benefits are difficult to diffuse among government agencies but more fluidly among nonprofits. Consistent with moderation effects for first-order brokerage, government sector was less likely to receive spillover benefits than nonprofits. One possible explanation is that government agencies have relatively strictly defined jurisdictions and therefore are less likely to expand their connections based on their contacts. In contrast, on social media, nonprofits may be more readily connected with their partners’ partners.
Practical Implications
Research has documented that public objection and resistance could seriously damage the legitimacy (Selsky & Parker, Reference Selsky and Parker2010). Scholars have recommended that organizations should engage with their publics through channels such as social media (Ihm & Kim, Reference Ihm and Kim2021; Sun et al., Reference Sun, Yang and Saffer2021). While scholars recognize the importance of social-mediated engagement, few recognize the complexity of engagement such as indirect connections and mixed public reactions. As illustrated by our study, public reactions to cross-sector brokerage are a complicated story.
Specifically, nonprofits may actively position themselves as brokers in cross-sector collaborations, particularly during social crises, to leverage their favorable public perception and sector-specific advantages. Nonprofits can not only strategically foster existing cross-sector partnerships (Ozman and Gossart, Reference Ozman and Gossart2023), but also enhance their public image by mediating between diverse stakeholders, fostering trust, and facilitating cooperation in addressing complex societal challenges. Such cross-sector collaboration may even benefit nonprofits’ resilience in crises (Waerder et al., Reference Waerder, Thimmel, Englert and Helmig2021). By contrast, government agencies need to carefully select communicating partners, and avoid conditions where being a broker or connecting with a broker may appear to prioritize their own interests over the broader communities or appear inefficient in playing a leadership role in a social crisis.
Limitations and Future Research
This study does have limitations. First, the study focuses on Twitter/X interactions because this is one of the most popular platforms for organizations to broadcast their actions and promote strategic relationships. However, organizations may signal different relationships on other platforms. Future studies may expand to other social media platforms to see if the operational logic of platforms interacts with public reactions. Moreover, this study focuses on social-mediated brokerage and how the public respond to such relationships. Previous research has suggested that publics may also have strong feelings about cross-sector alliances in offline settings (Boyer, Reference Boyer2019). It is important for future research to examine factors that shape public perceptions about offline brokers.
Second, although we can observe the public reactions, we did not conduct a survey or interview with public audiences to understand their motivations. Future studies could verify these effects and continue building theories that could guide effective cross-sector relationship management. Although social media has provided a big dataset of public responses, we do not know the accurate identities of these users, which are a computationally challenging task (López-Monroy et al., Reference López-Monroy, González and Solorio2020).
Third, our research is conducted in the context of the COVID-19 crisis. Our findings may still hold for other societal-level crises where different sectors are expected to coordinate and contribute to crisis relief under heightened public expectations. This is because such cross-sectional communication requires organizations of different sectors to play different brokerage roles. Future research may further examine organizations’ cross-sector brokerage in other crises.
Conclusion
Overall, our study offers a nuanced view of broker types in the context of social-mediated cross-sector communication. Our analysis shows that while being a broker or connecting with brokers generally offer organization's advantageous network positions, such actions may not always be received positively by the public. Relationship building in highly visible arenas such as social media should involve careful and strategic considerations that account for public expectations associated with different types of brokers and different sectors. Our study positions public responses to cross-sector relationships in networked systems, and offers a new angle to understand public reactions.
Declaration
Conflict of interest
The authors have no conflicting interest to declare.


 Open access