


Introduction
The family Sphyraenidae (barracudas), which is typically represented in shelf waters of tropical and temperate seas in many regions of the world, comprises only one genus Sphyraena and 28 species (Ballen, Reference Ballen2019). They are pelagic to demersal marine fishes, single or in schools.
Four Sphyraenidae species occur in the Mediterranean Sea, two of which, Sphyraena chrysotaenia (Klunzinqer, 1884) and S. flavicauda (Ruppell, 1838), are of Red Sea origin (Kara and Bourehail, Reference Kara and Bourehail2020). S. sphyraena , is a widespread species found in the eastern Atlantic from the Bay of Biscay to Angola, including the Mediterranean and Black Sea, Canary Islands, and Azores (Froese et al., Reference Froese, Papaioannou and Scotti2022). This pelagic species primarily lives close to the surface (Golani et al., Reference Golani, Ozturk and Basusta2006), but individuals can also be found in midwater, down to depths of 100 meters (Ben-Tuvia, Reference Ben-Tuvia, Whitehead, Bauchot, Hureu, Nielsen and Tortonose1986). As a temperate species, it typically shares habitats and resources with the thermophilic S. viridensis (Cuvier, 1829) (Kalogirou et al., Reference Kalogirou, Wennhage and Pihl2012; Villegas-Hernández et al., Reference Villegas-Hernández, Muñoz and Lloret2014). In many reports, S. sphyraena (Linnaeus, 1758) and S. viridensis are considered as the juvenile and adult of the same species S. sphyraena (Kara and Bourehail, Reference Kara and Bourehail2003; Golani et al., Reference Golani, Ozturk and Basusta2006; Relini and Orsi-Relini, Reference Relini and Orsi-Relini1997; Vacchi et al., Reference Vacchi, Boyer, Bussotti, Guidetti and La Mesa1999). Pastore (Reference Pastore2009) describe a new species S. intermedia and believe that it is not hybrid between S. sphyraena and S. viridensis . Considering otolith shape, Bourehail et al. (Reference Bourehail, Morat, Lecompte-Finiger and Kara2015) distinguish the two species S. sphyraena and S. viridensis .
Although barracudas are an important commercial group of fishes in the Mediterranean Sea whose production reached 1800 tons in 2018 (FAO, 2020), little is known about their life history and population dynamics. Existing work is particularly concerned with the south-eastern Mediterranean and targets mainly the two Lessepsian species S. chrysotaenia and S. flavicauda (Wadie et al., Reference Wadie, Reskalla and Dowidar1989; Allam et al., Reference Allam, Faltas and Ragheb2004a, Reference Allam, Faltas and Ragheb2004b; Zouari-Ktari et al., Reference Zouari-Ktari, Ennejjar, Bradai, Ghorbel and Bouain2007; El Ganainy et al ., Reference El Ganainy, Amin, Ali and Osman2017). In the Western Mediterranean, only Bourehail and Kara (Reference Bourehail and Kara2021a, Reference Bourehail and Kara2021b) studied the growth and mortality of S. viridensis from eastern Algeria, while Villegas-Hernández et al. (Reference Villegas-Hernández, Muñoz and Lloret2014) compared its reproduction with those of S. sphyraena in Roses Gulf (North-Western Mediterranean). The two publications of Allam et al. (Reference Allam, Faltas and Ragheb2004a, Reference Allam, Faltas and Ragheb2004b) on the growth and reproduction of S. sphyraena from the Egyptian coasts remain to date the only ones devoted to the biology and dynamics of this species in the Mediterranean.
Fish age estimation provides important demographic parameters to analyse and assess fish populations (Maceina and Sammons, Reference Maceina and Sammons2006). One of the main problems in age and growth studies is the selection of the most suitable structure to age the fish. Comparison of age estimates between structures is an alternative technique of validation that may provide useful information on the accuracy and bias of age estimating structures (Sylvester and Berry, Reference Sylvester and Berry2006). Therefore, ideally at the start of a demographic study, the fish should be aged by more than one method.
This study focuses on the population structure and dynamics of Sphyraena sphyraena along the eastern coast of Algeria. Age was estimated using and comparing two methods: scalimetry and otolithometry. The resulting data were used to characterize the species’ growth and estimate its mortality parameters. These findings provide a foundational basis for the stock assessment of S. sphyraena in Algerian waters, essential for its sustainable and rational management.
Material and methods
Random sample of S. sphyraena (N = 583, 145 < TL (mm) < 449, 12.11 < TW (g) < 325.08) was weekly collected from the commercial catch landing from Eastern Algeria (36°54’N, 7°45’E) (Figure 1) between November 2007 and November 2008. The temperature in this area is between 14 and 25.5 °C (Frehi et al., Reference Frehi, Couté, Mascarell, Perrette-Gallet, Ayada and Kara2007). All fishes were measured for total length (TL, mm), total weight (body wet weight: TW, g), and sexed. The sex ratio (SR) was tested for significance (female to male = 1:1) using the chi-squared test (P < 0.05). About 10 scales were removed from the area below the pectoral fin, washed, and stored dry in individually labelled plastic vials. Sagittal otoliths were extracted by a transverse section on the posterior dorsal part of the head, cleaned in distilled water, and stored dry in Eppendorf tubes.

Figure 1. Location of studied site in the South-Western Mediterranean Sea.
Scales of S. sphyraena were placed between two glass slides while the otoliths were mounted on watch glass. The radius of the scales was measured along a line running from the focus to the edge of the scale. The whole otolith was viewed with reflected light against a black background using a binocular microscope while immersed in a clearing fluid (Anise Essential Oil). Otolith growth increments were measured with the antisulcal face up and from the nucleus towards the post-rostrum end. All unreadable scales and otoliths were eliminated.
Annular ring counts were made independently by two readers who were blinded to information about fish length and date of capture. Final age estimates were achieved when the same results were obtained from the two readers. A third reading was performed if the first two readings differed from each other. If agreement could not be reached, the otolith was discarded. The average error index (APE; Beamish and Foumier, Reference Beamish and Foumier1981) and the variation coefficient mean (CV; Chang, Reference Chang1982) were used to compare the reading results. Observed lengths at different ages were compared with the back-calculated data by Student’s t -test.
To determine the time of annulus formation on the scale or the sagitta, the monthly average marginal growth index (GI) of scales or sagitta otoliths for each age group were calculated by the relative equation (Gallucci et al., Reference Gallucci, Saila, Gustafson and Rothschild1996): GI = (R – r max)/(r max – r ), where R is the scale or sagitta radius at capture, r max is the outermost annulus, and r max-1 is the previous ring to the outermost annulus. The fish total length (TL, in cm) and the scale or sagitta radius measured (R , in micrometre division) relationship was determined by linear regression method: TL = a + b R , where: (a) and (b) are constants. The intercept (a) of the previous relation was used for correction of back calculation fish length-at-each year of life by Lee’s formula (Lee, Reference Lee1920): Ln = r (TL – a )/R + a , where Ln n is the length (cm) at age n’, TL is the total fish length at capture (cm), r is the scale or sagitta radius at annulus ‘n’ formation, R is the scale or sagitta radius at capture (in micrometre division). Back-calculated lengths at different ages were fitted to von Bertalanffy’s growth model: TL = L ∞ (1 − e-k (t – to)), where TL is the length (cm) at age t (year), L∞ is asymptotic length (cm), K is the growth coefficient, t is theoretical time when length was 0.
The growth performance index Ø = 2 log L ∞ + log k (Munro and Pauly, Reference Munro and Pauly1983) was calculated to compare the growth of this population with the results obtained in other regions. The length–weight relationship was calculated for each sex and for the whole population applying the exponential function EW = aTLb, where EW is the eviscerated weight. Logarithmic transformation (log10) of these two parameters allowed linearizing the equation to determine growth parameters. Difference in the relation of the total length–eviscerated weight between sexes was tested by ANCOVA, and the hypothesis of isometric growth by the t -test (Kruskal–Wallis test).
Total mortality rate (Z ) was estimated by the analysis of the capture curve converted in length using the FiSAT II program (Gayanilo et al., Reference Gayanilo, Sparre and Pauly2005). Pauly’s method (Pauly, Reference Pauly1980) as well as Ralston’s regression method (Ralston, Reference Ralston, Polovina and Ralston1987) were applied to evaluate the natural mortality rate (M ). Fishing mortality (F ) was assessed as follows; F = Z – M , whereas the exploitation rate was determined through following formula E = F /Z .
Statistical analyses were performed with MINITAB 18 software package.
Results
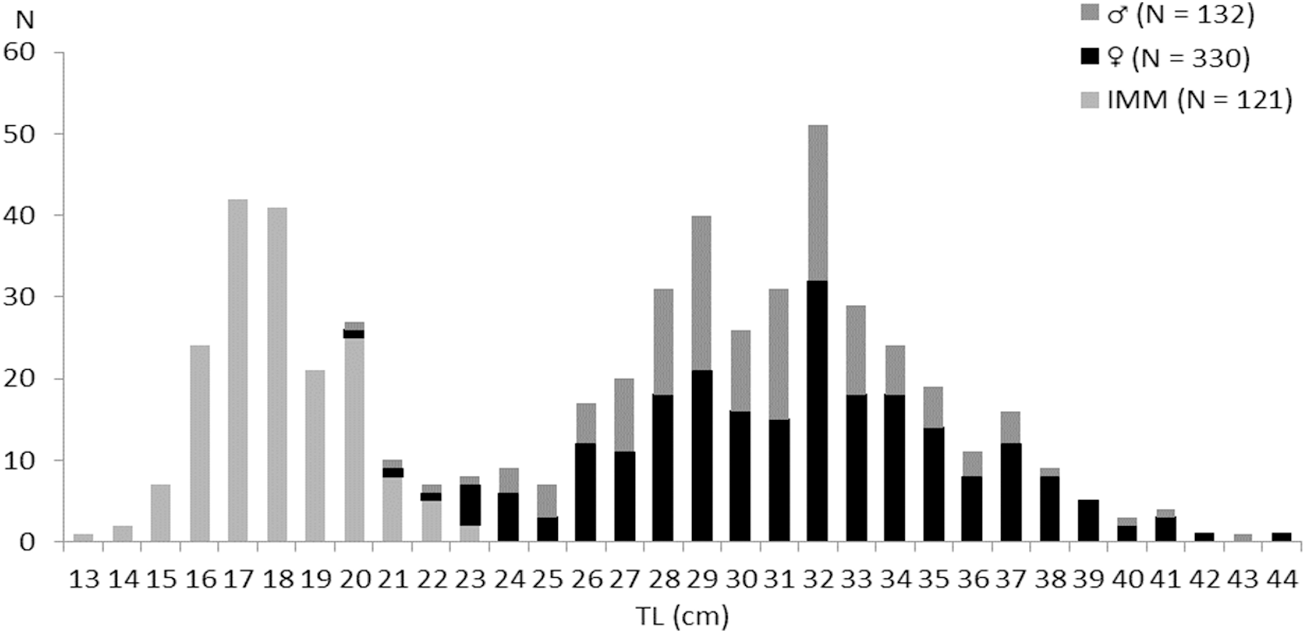
On a total of 583 examined fish, 330 (56.6%) were females (20.7 ≤ TL (cm) ≤ 44.9, 33.29 ≤ TW (g) ≤ 325.08), 132 (22.64%) were males (20.6 ≤ TL (cm) ≤ 43, 37.29 ≤ TW (g) ≤ 249.2), and 121 (20.75%) were immature (13.5 ≤ TL (cm) ≤ 16.1, 17.3 ≤ TW (g) ≤ 64.31) (Figure 2). The overall sex ratio (SR) was 69.44% in favour of females. This value is significantly greater than 50% (χ2 = 27; P ≤ 0.01) (Figure 3).

Figure 2. Length frequency of males, females, and immatures (IMM) of Sphyraena sphyraena sampled in eastern coast of Algeria.

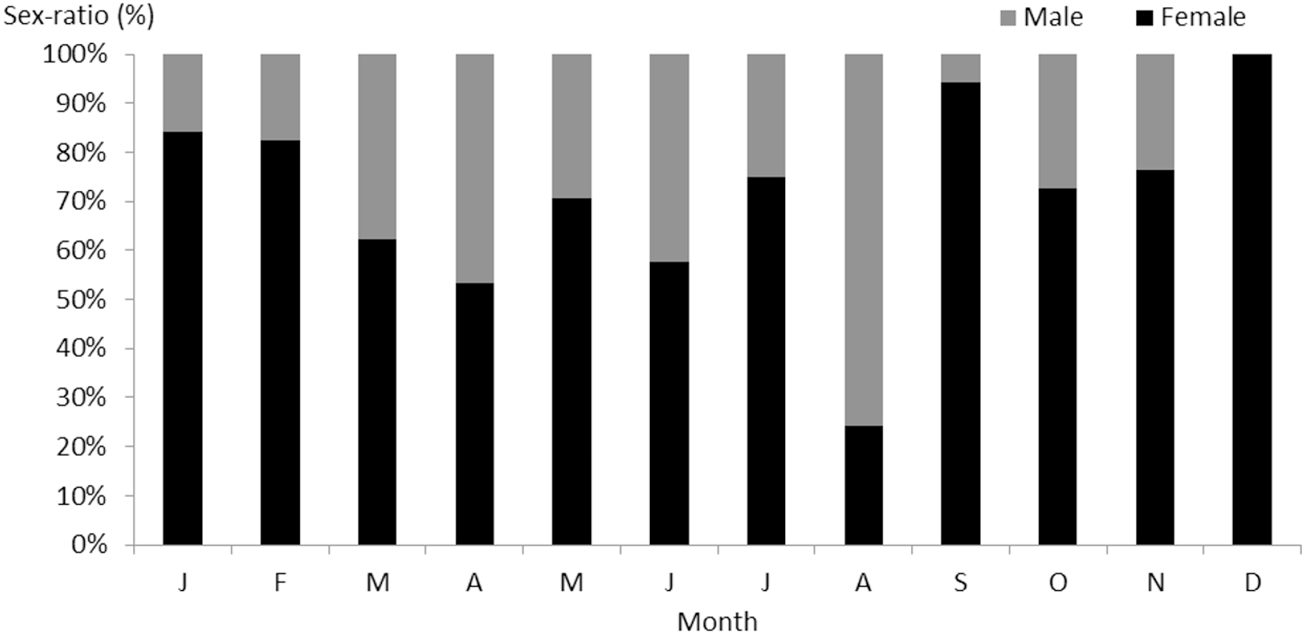
Figure 3. Monthly variations in the sex ratio of S. Sphyraena in eastern coast of Algeria.
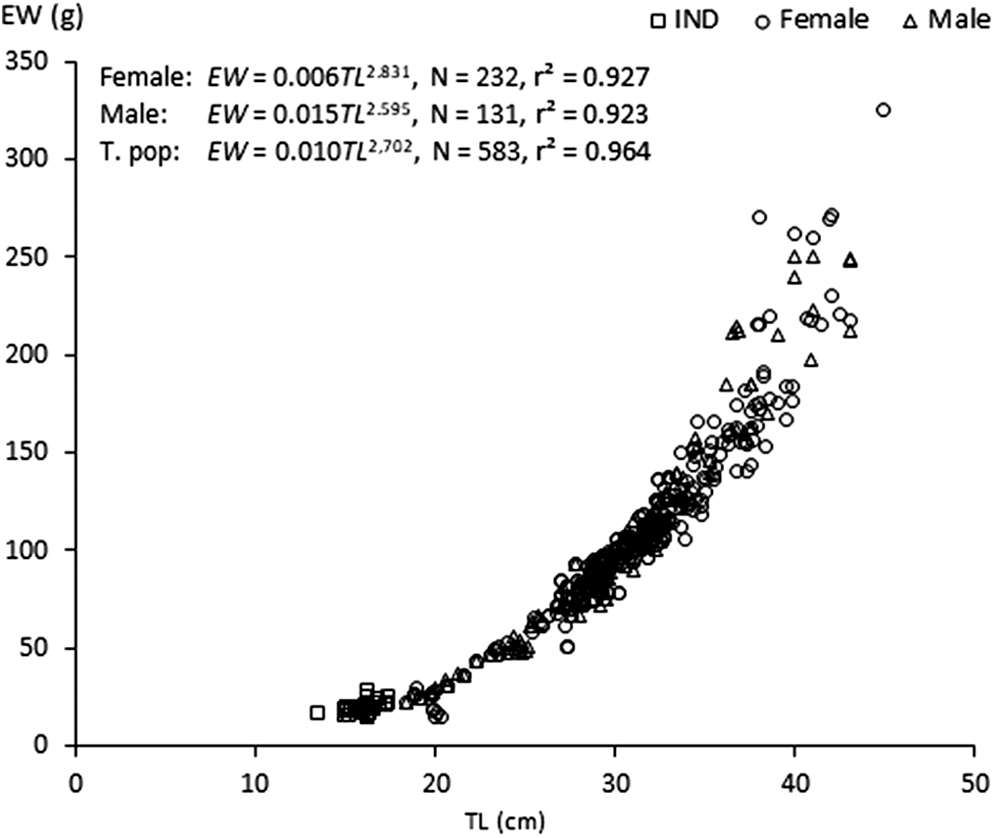
Length–weight relationship were EW = 0.015TL2.595 (r2 = 0.923, 20.6 < TL (cm) < 43) in males, EW = 0.006TL2.831 (r2 = 0.927, 20.7 < TL (cm) < 44.9) in females, and EW = 0.010TL2,702 (r2 = 0.964, 13.5 < TL (cm) < 44.9) for all individuals (Table 1). Results showed that the growth rates were negative allometry for females, for males and for the whole sample (t -test, P < 0.05). The ANCOVA test indicated that length-weight relationships were not significantly different in slopes or intercept between the two sexes (ANCOVA, n = 462; P > 0.05) (Figure 4).

Figure 4. Length-weight relationships of both sexes of Sphyraena sphyraena in eastern coasts of Algeria.
Table 1. Parameters of the length–weight relationships for females, males and all fish of Sphyraena Sphyraena of eastern coasts of Algeria

Notes : The isometry was tested by Student t -test (H0: t = 3); a , intercept; b , slope; n , sample size; r 2, coefficient of determination.
S. sphyraena’s scales are cycloid, distinguished by their thinness and rounded shape. The sagittae exhibit a lanceolate and slender morphology (Figure 5). Several challenges were encountered when using scales to determine the age of Sphyraena sphyraena . First, scales were not consistently present, and regenerated scales were frequently observed. In addition, the sampling sites varied due to the prevalence of bare areas on the fish’s body. The scales themselves were very small, easily detached, and those that remained were excluded because of inconsistent readings.

Figure 5. Scale and Sagittal otolith of S. Sphyraena in eastern coast of Algeria. (Numbers indicate annuli counted along the scale or sagitta radius).
The relationships between TL and otolith radius (Ro) or scale radius (Rs) was calculated for the sexes combined. Fish length and radii of the calcified structure were closely correlated (P = 0.00).
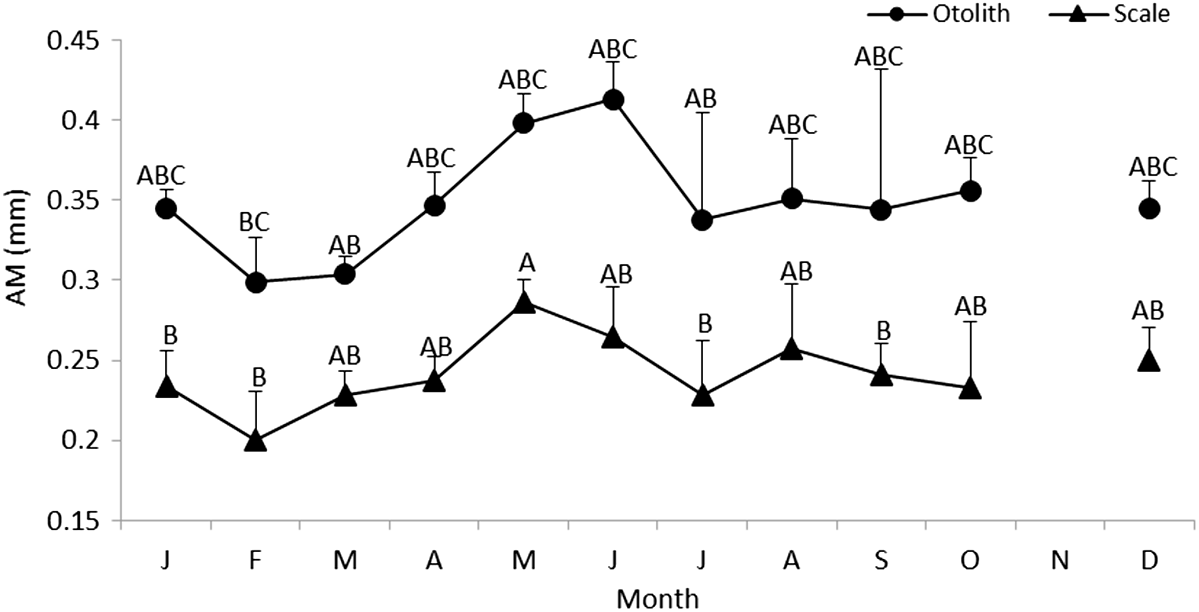
A one-way ANOVA applied to mean values of the marginal increment (MI) indicated their significant heterogeneity (F = 73.74 for MI of otoliths, F = 66.05 for MI of scales, P < 0.001). Comparing successive monthly mean marginal increment values of otoliths and scales using mean comparison tests showed a significant difference between January and February (Figure 6). Thus, the rings were considered to be annual increments. The lowest values of marginal increment were recorded in February.

Figure 6. Monthly variation of the marginal increment (MI) of Sphyraena sphyraena from eastern coasts of Algeria; The different letters indicate significant differences between sampling points.
Otoliths and scales of S. sphyraena showed clear growth rings. The annuli from the scales were easily and clearly identifiable. Among the total scales examined (N scales = 148), 93 (62.7 %) were useful for age estimation. Sphyraena sphyraena otolith consisted of clearly discernible opaque and translucent zones. Of the total otolith removed (N otolith = 129), 92 (71%) were retained for age determination. The low IAPE of scales (1.5%) and otoliths (1.2%) demonstrated the consistency and the high precision in ageing for each structure.
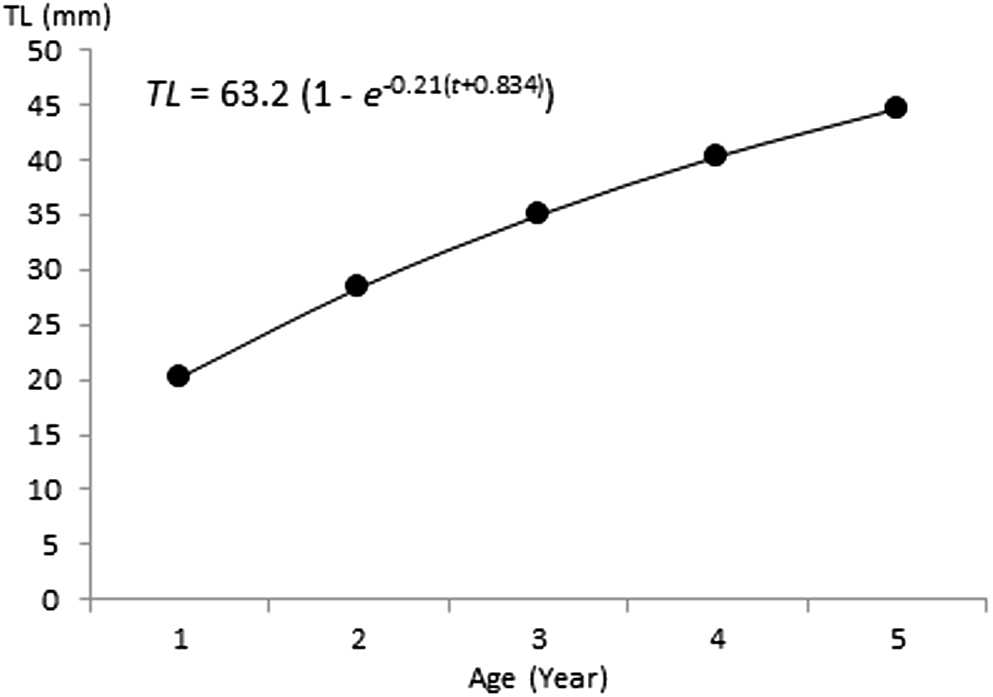
Otolith reading revealed the presence of four age groups (Table 2). Back calculated lengths as obtained by Lee’s equation were 19.51, 31.21, 35.5, and 41.7 cm TL for otolithometry and 21.3, 28.63, 34.04, and 40.17 for scalimetry for age groups I, II, III, and IV, respectively, (Table 3). The highest increment in linear growth occurred by the end of the first year (45%) after which the rate of increase in length declined rapidly (20 cm). Age groups II and III was the most abundant (N Otolith: 34 (54%), 14 (22%); N Scales: 34 (36%), 47 (50%)) among the four age groups studied. ANOVA test shows that there were no significant differences between the estimated lengths per age (P < 0.05) obtained by both methods (Table 4). However, taking into consideration the lower standard deviations of means for estimates based on otolith readings (r = 0.97 for otoliths, r = 0.71 for scales), the first seem to be more appropriate for ageing European barracuda S. sphyraena . Back-calculated length-at-age data were fitted to von Bertalanffy growth function (Figure 7). The parameters L∞, k, and t0 were estimated to be 63.5 cm, 0.403, and –0.193 year, respectively, for scalimetry, and 63.2 cm, 0.21, and –0.834 year, respectively, for otolithometry. Parameters estimated from scale and otoliths were significantly similar (Hotteling T 2 test, T 2 = 31.86; P > 0.05). The growth performance index (Ø ) was 2.57 for the sampled fish.

Figure 7. Von Bertalanffy growth curves for Sphyraena sphyraena in eastern coasts of Algeria.
Table 2. Age–length key of Sphyraena Sphyraena from eastern coasts of Algeria

Table 3. Back-calculated lengths at age for total population of Sphyraena Sphyraena in eastern coast of Algeria based on otolith and scale reading

Notes: R 1–R 4, growth rings in scales and otolith.
N , number of fish; M , mean length by age class; SD, standard deviation.
Table 4. Comparison of observed and back-calculated total lengths (cm) of Sphyraena Sphyraena from eastern coast of Algeria

The total mortality (Z ), natural mortality (M ), and fishing mortality (F ) of S. sphyraena were estimated at 1.19 year−1, 0.826 year−1, and 0.363 year−1, respectively. The estimated exploitation ratio (E ) was 0.305.
Discussion
This study is the first documented attempt to evaluate the age, growth, and mortality of S. sphyraena in the Western Mediterranean. The only available data on the population dynamics of this species in the Mediterranean are given by Allam et al. (Reference Allam, Faltas and Ragheb2004a) in Egypt.
With an annual average of 36.36%, the sex ratio of the S. sphyraena population of the eastern coast of Algeria is generally in favour of females. Numerical equality is recorded only once in June. The dominance of males in the catches in August coincides with the start of spawning. Females would then be less accessible to fishing gear, which suggests different behaviour of males and females during this period. The numerical dominance of females in S. sphyraena is also confirmed by Chemmam-Abdelkader et al. (Reference Chemmam-Abdelkader, Ezzeddine-Najaï and Kraiem2007) on the Tunisian coast. According to Kartas and Quignard (Reference Kartas and Quignard1984), variations in dominance in favour of one sex may be due to one or more causes such as the early maturity of females and/or their weaker growth.
The analysis of covariance showed no significant difference between males and females in the length–weight relationship for the same range of lengths. Biogeographic analysis of S. sphyraena length–weight relationship showed dissimilarities among areas (Table 5). The relative growth was similar in the Centre and in the Eastern Mediterranean (Kalogirou et al., Reference Kalogirou, Wennhage and Pihl2012; Nikiforidou et al., Reference Nikiforidou, Anastasopoulou, Xenikakis and Mytilineou2024), in Egyptian water (Allam et al., Reference Allam, Faltas and Ragheb2004b), and in the Atlantic (Kalogirou et al., Reference Kalogirou, Wennhage and Pihl2012), but it is better than in other regions (Petrakis and Stergiou, Reference Petrakis and Stergiou1995). The Greek coasts showed the weakest relative growth. These divergences can be assigned to several factors, such as the difference in sample sizes or the difference in the size composition of the individuals in each sample (Moutopoulos and Stergiou, Reference Moutopoulos and Stergiou2002). Petrakis and Stergiou (Reference Petrakis and Stergiou1995) suggest that the utilization of the length–weight relationship must be limited to the interval of size used to evaluate linear regression parameters. Otherwise, these variations are especially the reflection of environmental conditions for each locality, such as temperature, salinity of the sea water, availability of food, intraspecific competition, and modifications of maturity stages.
Table 5. Biogeographic comparison of parameters of length–weight relationships of Sphyraena sphyraena

Notes: N , sample size; a , intercept; b , slope; r 2, coefficient of determination
A significant challenge in estimating age and growth is selecting the most appropriate structure for aging the fish. Scales have been widely utilized for age estimation; however, their use has faced criticism primarily because the ages of older fish are often underestimated (Beamish and McFarlane, Reference Beamish, McFarlane, Prince and Pulos1983; Carlander, Reference Carlander1987). Otolith age determination is thought to be more accurate because otoliths have a higher priority inutilization of calcium (Carlander, Reference Carlander1987). In our study, these calcified structures were clear and easy to read, with high readability. The interpretation of the calcified structures of S. sphyraena was largely successful. The low IAPE values for scales (1.5%) and otoliths (1.2%) indicate a high level of consistency and precision in aging for each structure.
Sphyraena sphyraena back-calculated length at age did not significantly differ for otoliths and scales. The highest estimated age was 4+ years, lower than the maximum age demonstrated by Froese et al. (Reference Froese, Papaioannou and Scotti2022) (5 years), and by Allam et al. (Reference Allam, Faltas and Ragheb2004a) (8 years). On the other hand, our age readings were higher than those reported in another available study (3 years) (Wadie and Rizkallah, Reference Wadie and Rizkallah2001). The most significant variation in the life span of S. sphyraena appears to occur within populations from the same region.
Monthly variations of marginal increment values confirmed the annual pattern of deposition of an opaque and a translucent increment on the scales and otoliths of S. sphyraena of the eastern coasts of Algeria. It also proved that annuli were deposited during February. The high correlation found between TL and otoliths (r = 0.97) or scales (r = 0.71) radius indicates that both hard structures are useful for estimating age and for reconstructing past growth history of fishes by back calculation (Campana, Reference Campana1990; Francis, Reference Francis1990).
Growth parameters estimated in this study were similar to the growth data of this species in Ionian sea: L∞ = 63.65 cm and K = 0.14 year −1 (Nikiforidou et al., Reference Nikiforidou, Anastasopoulou, Xenikakis and Mytilineou2024). This similarity may be attributable to the dominance of individuals in the same age classes in both populations, in conjunction with the already mentioned small proportion of the oldest individuals (>4 years) in the studies area. In addition, growth increments for both populations were greatest in the first 2 years. Observed similarities were also reflected in almost the same values for (Ø ): 2.57 (Nikiforidou et al., Reference Nikiforidou, Anastasopoulou, Xenikakis and Mytilineou2024) for the northern and southeastern Mediterranean populations.
According to Amponsah et al. (Reference Amponsah, Ofori-Danson and Nunoo2016), variations in estimates of asymptotic lengths may be attributed to factors such as differences in maximum observed length, sampling methods, nature of data, computation methods used and the obtained length frequency. The relatively high growth rate shown by S. sphyraena in this study might depicts the response by the fish stock to the intense fishing pressure (Amponsah et al., Reference Amponsah, Ofori-Danson and Nunoo2016). A report by Allam et al. (Reference Allam, Faltas and Ragheb2004a) indicate a slower growth rate L ∞ = 55.27 cm and K = 0.123 year−1 for S. sphyraena in the Egyptian Mediterranean waters and suggested that variation in growth rate may result from disparity in food abundance or size composition of the stock. Again, report by Najmudeen et al. (Reference Najmudeen, Seetha and Zacharia2015) indicate that regional differences in growth rate are common among the same exploited species and attributes this to sample strength and size. Also, Sparre and Venema (Reference Sparre and Venema1992) submitted that growth parameters differ from species to species and also stock to stock even within the same species as a result of different environmental conditions.
The estimated average instantaneous rates of total (1.19 year−1), natural (0.826 year−1), and fishing (0.363 year−1) were all lower than those reported by Najmudeen et al. (Reference Najmudeen, Seetha and Zacharia2015) for S. obtusata in India, which were 2.8, 1.3, and 1.54 year−1, respectively. Furthermore, the estimated fishing mortality suggests that S. sphyraena is currently subject to a low exploitation rate in the Gulf of Annaba (E = 0.305), in contrast to the higher rate reported by Allam et al. (E = 0.787) for the same species in in the Egyptian Mediterranean waters.
The current study provides the first reference regarding age and growth of European barracuda S. sphyraena in Western Mediterranean Sea. Our results clearly demonstrate that both otolith and scales reading provide an efficient approach for estimating age composition, mortality rates, and biological indicators.
Fishery scientists and managers might benefit from this study’s basic information; however, additional biological research is required to determine the reproduction and feeding of this species in the area studies.
Author contributions
Bourehail N.: Sampling, sample processing, data analysis, and writing of the first draft. Kara M. H.: Fundraising, administrative management, supervision, manuscript revision, and finalisation.
Funding
This research received grant from the General Directorate of Scientific Research and Technological Development (DGRSDT, Algeria) within the framework of the National Research Fund.
Competing interests
The authors declare that they have no known competing financial interests or personal relationships that could have appeared to influence the work reported in this paper.
Data availability
All data supporting the findings of this study are available within the paper.
Ethical standards
The research has been complied with all the relevant national regulations and institutional policies for the care and use of animals.


 Open access