


Schizophrenia is a major mental health disorder that often leads to persistent cognitive, social and functional impairments and has the 12th highest disability weight of all conditions according to the Global Burden of Disease study. Reference Salomon, Haagsma, Davis, de Noordhout, Polinder and Havelaar1,Reference Charlson, Ferrari, Santomauro, Diminic, Stockings and Scott2 The importance of cognitive impairments in schizophrenia has been acknowledged since the time of Kraepelin Reference Kraepelin3 and Bleuler, Reference Bleuler4 and recent research has clarified the centrality of cognitive dysfunction in the disorder. Reference Buchwald, Narayanan, Siegert, Vignes, Arrowsmith and Sandham5–Reference Gebreegziabhere, Habatmu, Mihretu, Cella and Alem7 Despite the development of the Measurement and Treatment to Improve Cognition in Schizophrenia (MATRICS), no consensus exists on which cognitive abilities to target or prioritise in therapies aimed at enhancing cognition. Reference Best and Bowie8 Symptom network analysis is a promising new means of addressing this question. Symptom networks are graphical models that can be applied according to the network theory of mental disorders, which construes a psychological disorder as a complex, dynamic system of interacting symptoms. Symptom networks may help to elucidate the dependencies among different cognitive domains and other clinical or psychosocial variables and assist in clarifying treatment targets for cognitive remediation and psychopharmacology.
A growing body of research has included cognition in symptom networks of schizophrenia, Reference Buchwald, Narayanan, Siegert, Vignes, Arrowsmith and Sandham5,Reference Galderisi, Rucci, Kirkpatrick, Mucci, Gibertoni and Rocca9–Reference Abplanalp, Lee, Horan, Kern, Penn and Green11 and in our systematic review of symptom networks of schizophrenia and schizophreniform and schizoaffective disorders, cognition was a central component across all symptom network studies of schizophrenia that included cognition in the network. Reference Buchwald, Narayanan, Siegert, Vignes, Arrowsmith and Sandham5 In particular, Abplanalp et al Reference Abplanalp, Lee, Horan, Kern, Penn and Green11 noted that processing speed was the primary predictor of other cognitive processes. Our recent systematic review identified a research gap, in that no published network studies have examined the directional associations of symptoms with cognitive functioning (or vice versa), other clinical correlates and quality of life (QOL) outcomes in individuals with schizophrenia. Reference Buchwald, Narayanan, Siegert, Vignes, Arrowsmith and Sandham5 Here, we aimed to build on a strong body of previous studies that have identified the relationships between cognition and other domains of health, such as negative symptoms, Reference Dominguez Mde, Viechtbauer, Simons, van Os and Krabbendam12–Reference Melillo, Caporusso, Giordano, Giuliani, Pezzella and Perrottelli14 or QOL. Reference Dong, Lu, Zhang, Zhang, Ng and Ungvari15,Reference Marder and Galderisi16 We used Bayesian networks for the added utility of being able to identify complex relationships, to help clarify which cognitive impairments had associations or conditional independencies with other cognitive functions, symptoms and QOL. Consequently, we hypothesise that cognitive indices are central to the network, and that cognitive variables are associated with QOL, general symptoms and negative symptoms, but not with positive symptoms.
Method
Participant characteristics
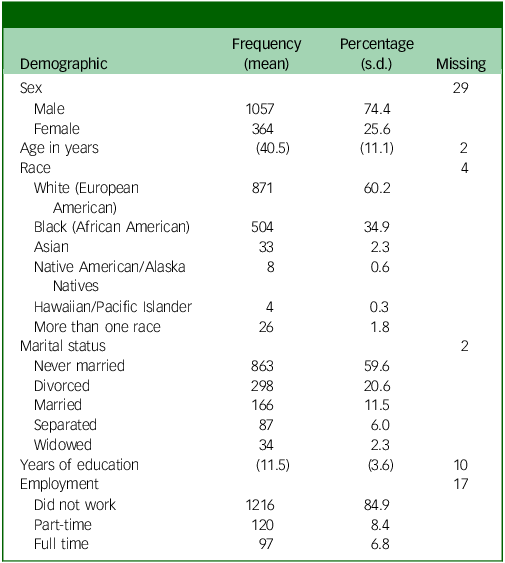
This study analysed data provided by 1450 people diagnosed with schizophrenia (PDS) from the National Institute of Mental Health Data Archive CATIE study. Participants recruited into this study were aged between 18 and 65 years, had a research diagnosis of schizophrenia and were able to take oral antipsychotic medication. Participants were excluded if they: (a) had a diagnosis of schizoaffective disorder, intellectual disability or other cognitive disorder; (b) had previously had severe adverse reactions to the proposed treatments; (c) had only had one psychotic episode; (d) had previously been treatment resistant; (e) were pregnant or breast-feeding; or (f) were considered to have a severe and unstable medical condition. Reference Swartz, Stroup, McEvoy, Davis, Rosenheck and Keefe17 We added no further exclusion criteria to this sample except for removing participants with more than half of their data missing. The authors assert that all procedures contributing to this work comply with the ethical standards of the relevant national and institutional committees on human experimentation and with the Helsinki Declaration of 1975, as revised in 2013. All procedures involving human participants and/or patients were approved by the Auckland University of Technology Ethics Committee (22/387 Static Symptom Networks of Schizophrenia) for the subsequent analyses of the CATIE study conducted in the current study. Written informed consent and ethical approval were provided for the original CATIE study. Reference Swartz, Stroup, McEvoy, Davis, Rosenheck and Keefe17 Table 1 provides the descriptive statistics for participants selected for the CATIE trial. A total of 1057 (74.4%) of the sample were males, with the average age of the sample being 40.5 years (s.d. = 11.1). Participants identified themselves as White or European American (871; 60.2%), Black or African American (504; 34.9%) or Asian American (33; 2.3%). Some participants identified with more than one race (26; 1.8%). In addition, 863 participants had never been married (59.6%) and 1216 did not work (84.9%), and the participants had an average of 11.5 years of education.
Table 1 Demographic characteristics
Sampling procedures
The CATIE study was a multisite randomised controlled trial conducted between January 2001 and December 2004 at 57 US sites, including university clinics, veterans’ affairs medication centres, mental health agencies, non-profit agencies, private practice centres and mixed sites. Whereas the CATIE study compared the effectiveness of medications over time, we selected only the baseline data for analysis in the present study.
Measures and covariates
A range of assessment data was available for this study. We included demographic, clinical, QOL and cognitive variables for our study. Demographic variables included age, sex, race, education, employment and marital status. Regarding clinical assessments, the Positive and Negative Syndrome Scale (PANSS) developed by Kay et al Reference Kay, Fiszbein and Opler18 can be considered the gold standard outcome measure for measuring symptoms in studies of the efficacy of schizophrenia treatment. Reference Kumari, Malik, Florival, Manalai and Sonje19 The PANSS has fair internal consistency and excellent interrater reliability Reference Peralta and Cuesta20,Reference Bell, Milstein, Beam-Goulet, Lysaker and Cicchetti21 and shows strong correlations with other symptom assessments of schizophrenia. Reference Bell, Milstein, Beam-Goulet, Lysaker and Cicchetti21 We also included the total score from the Calgary Depression Scale for Schizophrenia (CDSS). The CDSS has moderate to excellent reliability, high divergent validity and strong predictive validity, and correlates well with other measures of depression. Reference Lako, Bruggeman, Knegtering, Wiersma, Schoevers and Slooff22 The Drug Attitude Inventory (DAI) Reference Awad23 and Insight and Treatment Attitudes Questionnaire (ITAQ) Reference McEvoy, Apperson, Appelbaum, Ortlip, Brecosky and Hammill24 were included to identify illness insight and attitudes towards medication adherence. Another scale used in this study was the Clinical Global Impressions (CGI) scale, which was modified to consider an index of severity for drug and alcohol use rated by a clinician. Reference Guy25 We also included the clinician global impression severity index in the subsequent analyses. The QOL assessment tool used in the CATIE study was derived from Heinrichs et al, Reference Heinrichs, Hanlon and Carpenter26 and the assessment used to evaluate cognition was MATRICS. In the MATRICS version used during the CATIE trial, five cognitive domains were assessed: verbal, vigilance, processing speed, reasoning and working memory. These five domains were constructed on the basis of the assessments identified in Table 2. We initially included a measure of defined daily dose of antipsychotic medication. However, this was not a parent variable, as discussed below, and was therefore removed.
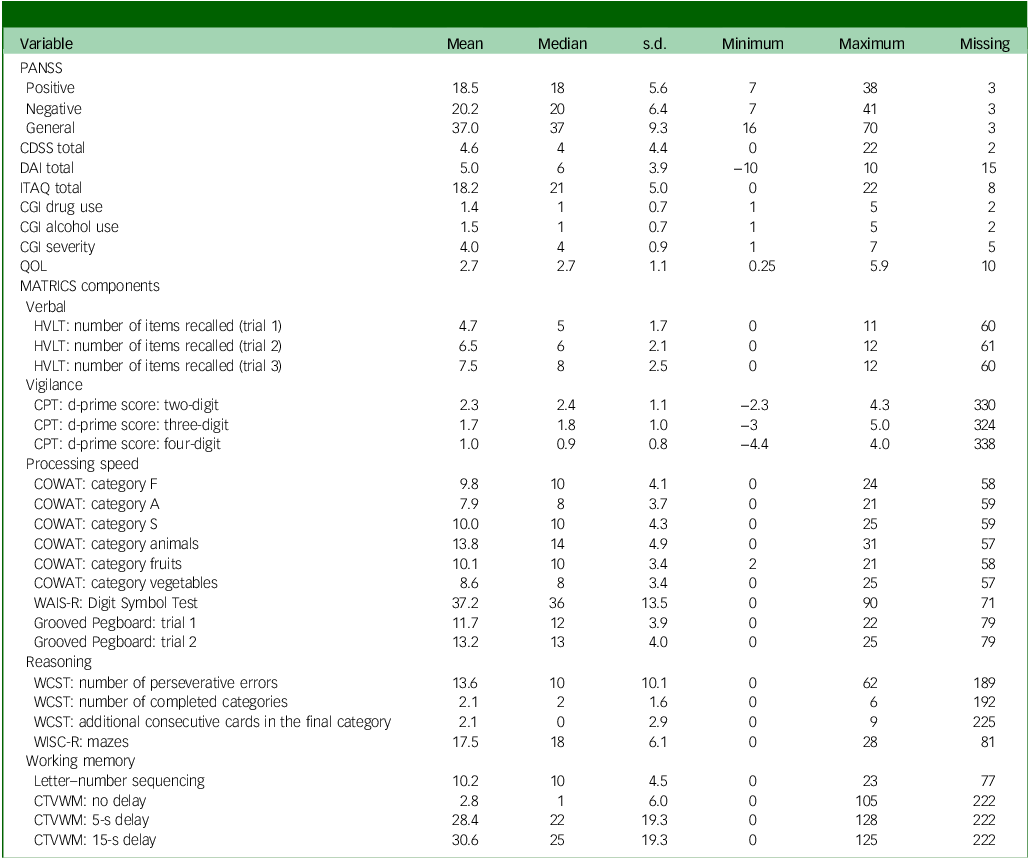
Table 2 Clinical characteristics

PANSS, Positive and Negative Syndrome Scale; CDSS, Calgary Depression Scale for Schizophrenia; DAI, Drug Attitude Inventory; ITAQ, Insight and Treatment Attitudes Questionnaire; CGI, Clinical Global Impressions; QOL, Quality of Life; MATRICS, Measurement and Treatment Research to Improve Cognition in Schizophrenia; HVLT, Hopkins Verbal Learning Test; CPT, Continuous Performance Test; COWAT, Controlled Oral Word Association Test; WAIS-R, Weschler Adult Intelligence Scale-Revised; WCST, Wisconsin Card Sorting Task; WISC-R, Weschler Intelligence Scale for Children – Revised; CTVWM, Computerised Test for Visuospatial Working Memory.
Data diagnosis
We removed participants from this study if they had more than 50% missing information in all variables reported in our study (n = 10). The remaining missing data (2.4% of all observations) were imputed using the random forest imputation by Stekhoven & Bühlmann, Reference Stekhoven and Bühlmann27 which allows both categorical and continuous variables to be imputed. This reduced the sample size to 1450, and all results reported in this study are derived from this subset of individuals from the CATIE study. All assessment subscales were assumed to be continuous, except the CGI subscales. The MATRICS subscales reported herein are provided as standardised scores (mean = 0, s.d. = 1) as opposed to age-standardised scores, as provided by Keefe et al. Reference Keefe, Bilder, Harvey, Davis, Palmer and Gold28 All demographic variables were considered to be discrete, except for age, for the random forest imputation. The Bayesian network algorithm does not allow categorical variables to be daughter nodes of continuous variables in the comprehensive bnlearn R version 4.9.4 package we used. Reference Scutari and Denis29,Reference Scutari and Silander30 Hence, we treated age as a categorical variable (ages <30, 31–45, >45 years) following imputation to ensure all demographics were discrete variables. We also assumed that the CGI subscales were continuous in the Bayesian network despite being based on a Likert scale. No other transformations were implemented.
Analytic strategies
Networks are comprised of nodes (variables) and edges (associations between variables). One graphical network approach, Bayesian networks, uses directed acyclic graphs to decompose the joint probability distribution of the variables. Reference Scutari and Denis29 Directed relationships encode the dependency structure among a set of variables. Parent nodes have an edge directed away from the node towards a child node, which has an incoming edge. On a Windows PC, we used R version 4.3.2 31 to analyse and implement the Bayesian networks in this study. To reconstruct relationship networks, we implemented a hybrid Bayesian network using the hill climbing method from R package bnlearn. Reference Scutari and Denis29 We used a hybrid Bayesian network, which allowed both discrete and continuous variables to be included in the model, using a mixture of multinomial distributions for the parameter estimation of the discrete variables and normal distributions for the parameter estimation of the continuous variables. A blacklist of disallowed edges was automatically included when using the bnlearn package, Reference Scutari and Denis29 so that discrete variables (demographics) could not be child nodes of continuous variables (clinical assessments). No other blacklists were specified when reconstructing the network. The hill climbing algorithm was initialised with an empty network; edges were then iteratively deleted or added, or the edge direction was reversed to locally optimise a network score, which reflected a fit to the data and was penalised for complexity. Although this algorithm identified a single set of orientations for parent and child relationships, other network structures may have fitted the data equally well but had different edge orientations. Reference Scutari and Denis29 We did not estimate the Markov equivalence class, which is a set of partially directed acyclic graphs that fit the data equally well. A Markov equivalence class would have been helpful to identify but not confirm potential causal relationships. Hence, we refer to relationships in this study as associations as opposed to causal relationships. Reference Scutari and Denis29 The direction of edges in a Markov equivalence class only needs to be specified when they are compelled, to avoid cycles, or form part of converging connections, as described by Scutari & Denis. Reference Scutari and Denis29 We used the Bayesian information criterion as a network score criterion. We implemented another score-based algorithm in bnlearn, Tabu, which led to the same solution in the network structure as the hill climbing algorithm. Reference Scutari and Denis29
Several other statistical methods were employed to investigate the Bayesian network and its properties; an overview of these can be found in the Supplementary Material available at https://doi.org/10.1192/bjo.2025.10929. We expanded a single Bayesian network by reconstructing an averaged network, that is, an amalgamation of many, possibly suboptimal networks, using bootstrapped versions of the data. There is evidence that averaging network models improves predictive validity. Reference Scutari and Denis29 The network reconstructed on the complete data is referred to as a Bayesian network, whereas the Bayesian network based on bootstrapped samples was called the averaged Bayesian network; these were two networks with different structures and parameters. Structural equation models (SEMs) were implemented on the structure of the Bayesian network and the averaged Bayesian network; these were used to estimate regression coefficients and evaluate the fit of the model. We included the comparative fit index, Tucker–Lewis index, root mean squared error of approximation, Bayesian information criterion and Akaike information criterion. We also evaluated the fit of the modelling using a chi-squared test of model fit. Following this, we computed the centrality statistics betweenness, closeness and degree. Bayesian networks allow the user to query conditional probability relationships between variables. We thus queried the Bayesian network for the parent and child relationships of processing speed and QOL to compute the final results. The R code used for the analysis can be found in the Data Availability statement, and additional information on the analytic strategies can be found in the Supplementary Material.
Results
Table 2 presents an overview of the baseline assessment scores for the assessments included before imputation. Participants in this study generally presented with average scores on the positive (50th–55th percentile), negative (40th–45th percentile) and general (45th–50th percentile) subscales of the PANSS. Reference Kay, Fiszbein and Opler18 On average, participants scored 4.6 on the CDSS, corresponding to reporting symptoms that were between absent and mild on average across the sample and across items (mean = 0.51 for each item). On average, the sample had a positive attitude towards medication, as indicated by the DAI. Similarly, participants on average responded with scores on the ITAQ indicating partial to good insight (mean = 1.7 for each item). For both CGI drug use and CGI alcohol use, scores indicated responses that were on average between abstinence and substance use without impairment. The QOL scale mean scores reflected intermediate but significant levels of impairment.
Regarding the MATRICS cognitive battery, most participants scored between −1.6 standard deviations and −2.5 standard deviations from the mean on the Hopkins Verbal Learning Test, based on the results from the CATIE trial. Reference Keefe, Bilder, Harvey, Davis, Palmer and Gold28 Participants also performed 1.5 standard deviations or below the mean for males across all ages for the three indices of the Identical Pairs Continuous Performance Test, based on the norms published by Rapisarda et al, Reference Rapisarda, Kraus, Tan, Lam, Eng and Lee32 and between the 9th and 10th percentiles for processing speed and the Controlled Oral Word Association Test, based on the norms of Ruff et al. Reference Ruff, Light, Parker and Levin33 Last, the participants in this study scored 2.1 standard deviations below the mean for letter number sequencing based on the norms of Gold et al. Reference Gold, Carpenter, Randolph, Goldberg and Weinberger34
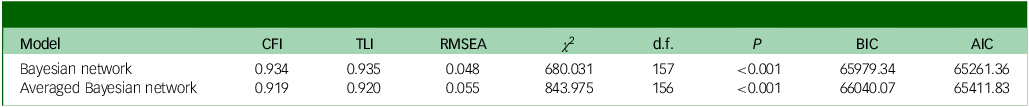
Table 3 shows the fit statistics for each model and the significance of the implied variance–covariance matrix and observed variance–covariance matrix. The averaged Bayesian network had considerably worse comparative fit index and Tucker–Lewis index than the Bayesian network; the root mean squared error of approximation was lower for the Bayesian network, and the Bayesian information criterion and Akaike information criterion favoured the Bayesian network compared with the averaged Bayesian network. Both models were significant (P < 0.001), indicating that the model-implied variance–covariance matrix significantly differed from the observed variance–covariance matrix in both models. Given that the Bayesian network had a better fit than the averaged Bayesian network, subsequent results were based on the Bayesian network. Furthermore, many of the relationships in the averaged Bayesian network were also found in the Bayesian network; 29 edges were shared between the two networks, whereas 18 edges were unique to the Bayesian network, and 16 edges were unique to the averaged Bayesian network. The network plot, SEM plot, centrality statistics and adjusted P-values for the averaged Bayesian network can be found in Supplementary Figs 1–3 and Supplementary Table 2.
Table 3 Fit statistics for the Bayesian network and averaged Bayesian network

CFI, Comparative Fit Index; TLI, Tucker–Lewis index; RMSEA, root mean square error of approximation; BIC, Bayesian information criterion; AIC, Akaike information criterion.
Figure 1 shows the structure of the reconstructed Bayesian network. Edges were coloured in green if the estimated regression coefficient was positive in the SEM and red if the coefficient was negative. These coefficients took into consideration the effects of other confounding variables. Age, employment and race were not child nodes of any other variables, whereas the MATRICS vigilance subscale, MATRICS verbal subscale and ITAQ total score were child nodes only. The MATRICS processing speed was associated with all other MATRICS scales (positive relationship). Moreover, MATRICS reasoning was conditionally independent of MATRICS vigilance, given the values for MATRICS working memory. The PANSS general subscale was associated with MATRICS working memory (a negative relationship, as inferred by the SEM fit), and the PANSS negative subscale was associated with MATRICS processing speed (negative relationship). The PANSS negative subscale was conditionally independent of all other MATRICS subscales, given scores on processing speed. The PANSS positive subscale was conditionally independent of cognition as assessed by the MATRICS and conditionally independent of the MATRICS given either the PANSS negative subscale or the PANSS general subscale. QOL was associated with the DAI total score (positive relationship), CDSS total score (negative relationship), CGI severity index (negative relationship), PANSS negative subscale (negative relationship), MATRICS processing speed (positive correlation) and employment (negative relationship). QOL was conditionally independent of age, education, sex, MATRICS working memory, PANSS positive subscale, PANSS general, CGI drug use and CGI alcohol use, given the parents’ DAI total, CDSS total, CGI severity index, PANSS negative subscale, and MATRICS processing speed. CGI drug use index was associated with the CDSS total (positive relationship), and the PANSS positive subscale (positive relationship) was associated with CGI drug use. The CGI alcohol use index was a parent of the PANSS negative subscale (negative relationship), and the PANSS positive subscale was conditionally independent of CGI alcohol use given the PANSS negative subscale.
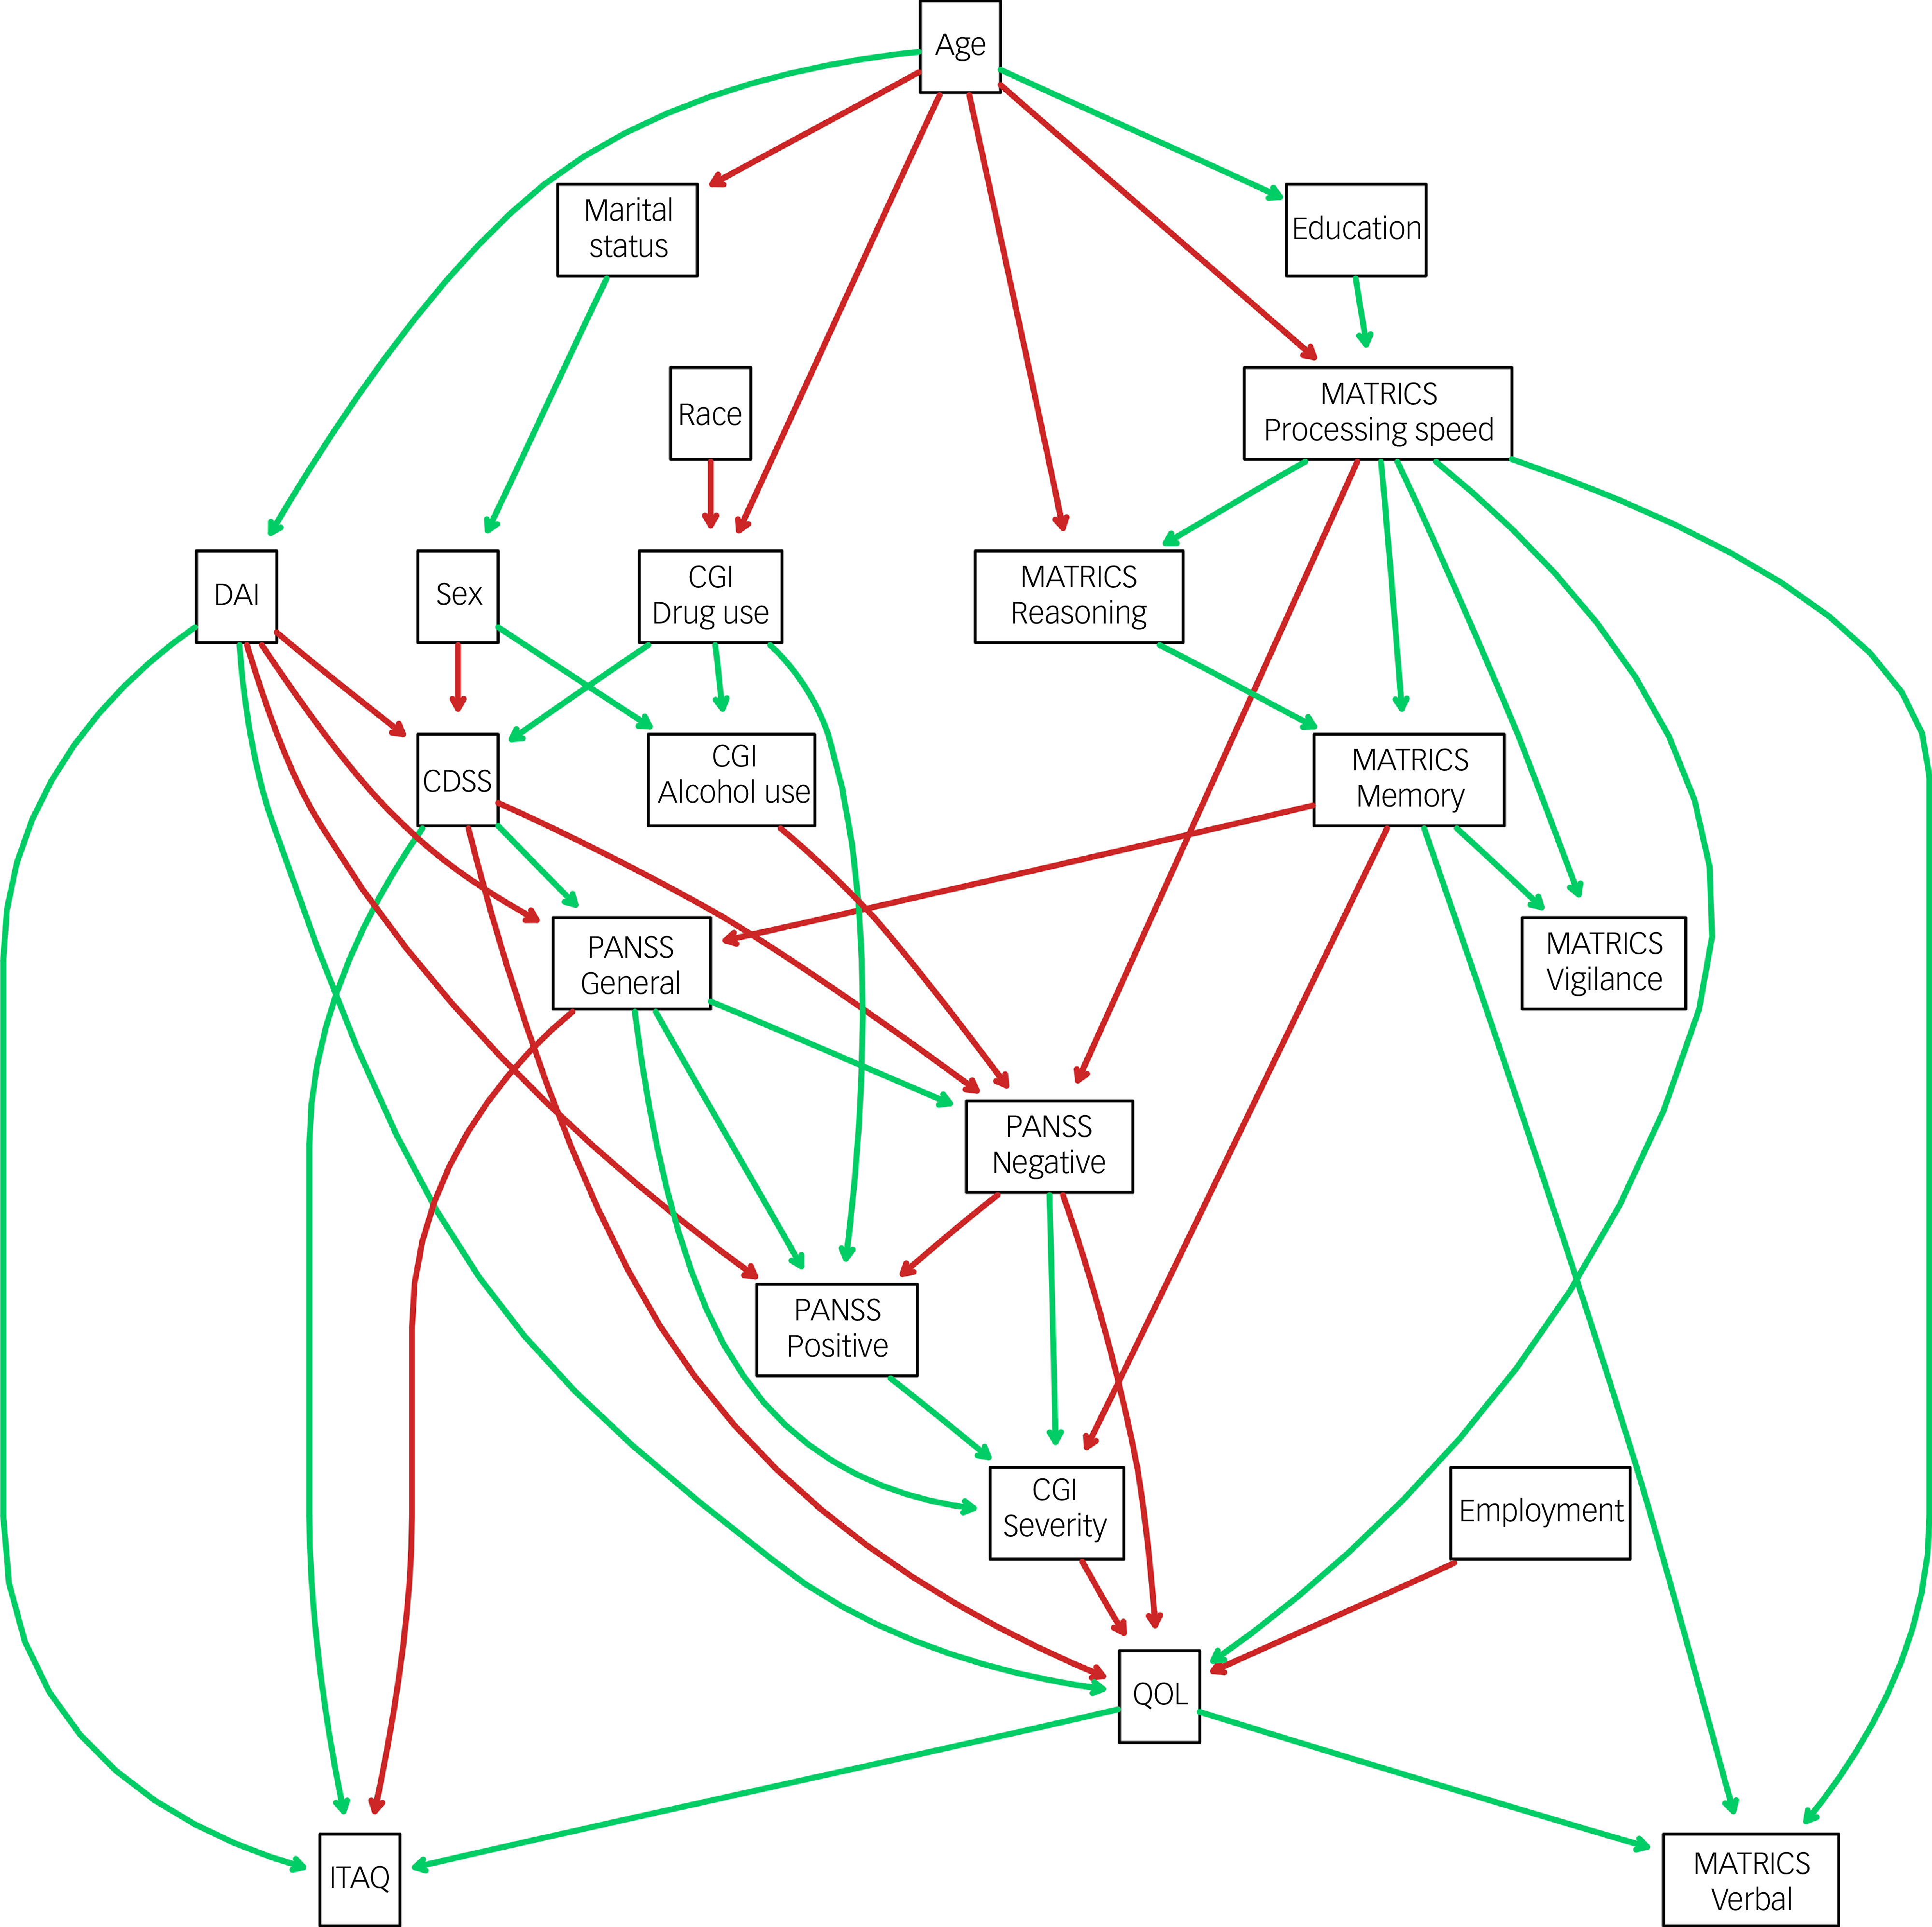
Fig. 1 Averaged Bayesian network. MATRICS, Measurement and Treatment Research to Improve Cognition in Schizophrenia; DAI, Drug Attitude Inventory; CDSS, Calgary Depression Scale for Schizophrenia; CGI, Clinical Global Impression; PANSS, Positive and Negative Syndrome Scale; QOL, Quality of Life; ITAQ, Insight and Treatment Attitudes Questionnaire.
Figure 2 shows the same network structure as Fig. 1 but with the addition of standardised regression coefficients and significance values for the relationships between parent and child variables. All P-values were subject to the multiple comparison correction method of Holm, Reference Holm35 and all Holm-adjusted P-values can be found in Supplementary Table 1. All the relationships between the MATRICS subscales were positive and significant, with the strongest relationships being those between the MATRICS processing speed scale and the MATRICS vigilance and MATRICS working memory subscales. The MATRICS processing speed subscale had a significant and moderate negative association with the PANSS negative subscale (b = −0.25; P < 0.001), and the MATRICS memory subscale was a negative and significant moderate parent of the PANSS general subscale (b = −0.14; P < 0.001). The PANSS general subscale had a strong significant positive relationship with the PANSS negative subscale (b = 0.61; P < 0.001) and PANSS positive subscale (b = 0.64; P < 0.001). There was also a strong positive relationship between the CDSS and PANSS general (b = 0.35; P < 0.001), but the CDSS had a moderate, negative and significant association with the PANSS negative subscale (b = −0.14; P < 0.001). The PANSS positive subscale had a strong positive and significant association with the CGI severity index (b = 0.45; P < 0.001). Of the six parents of QOL, the strongest association was that for the PANSS negative subscale, which was significant and negatively associated (b = −0.33; P < 0.001) with QOL scores. Last, the MATRICS processing speed subscale had a moderate and significant association with QOL (b = 0.12; P < 0.001), and employment was also associated with QOL, via a strong negative relationship (b = −0.32; P < 0.001). The parents of QOL explained a total of 37.1% of the variance in QOL.
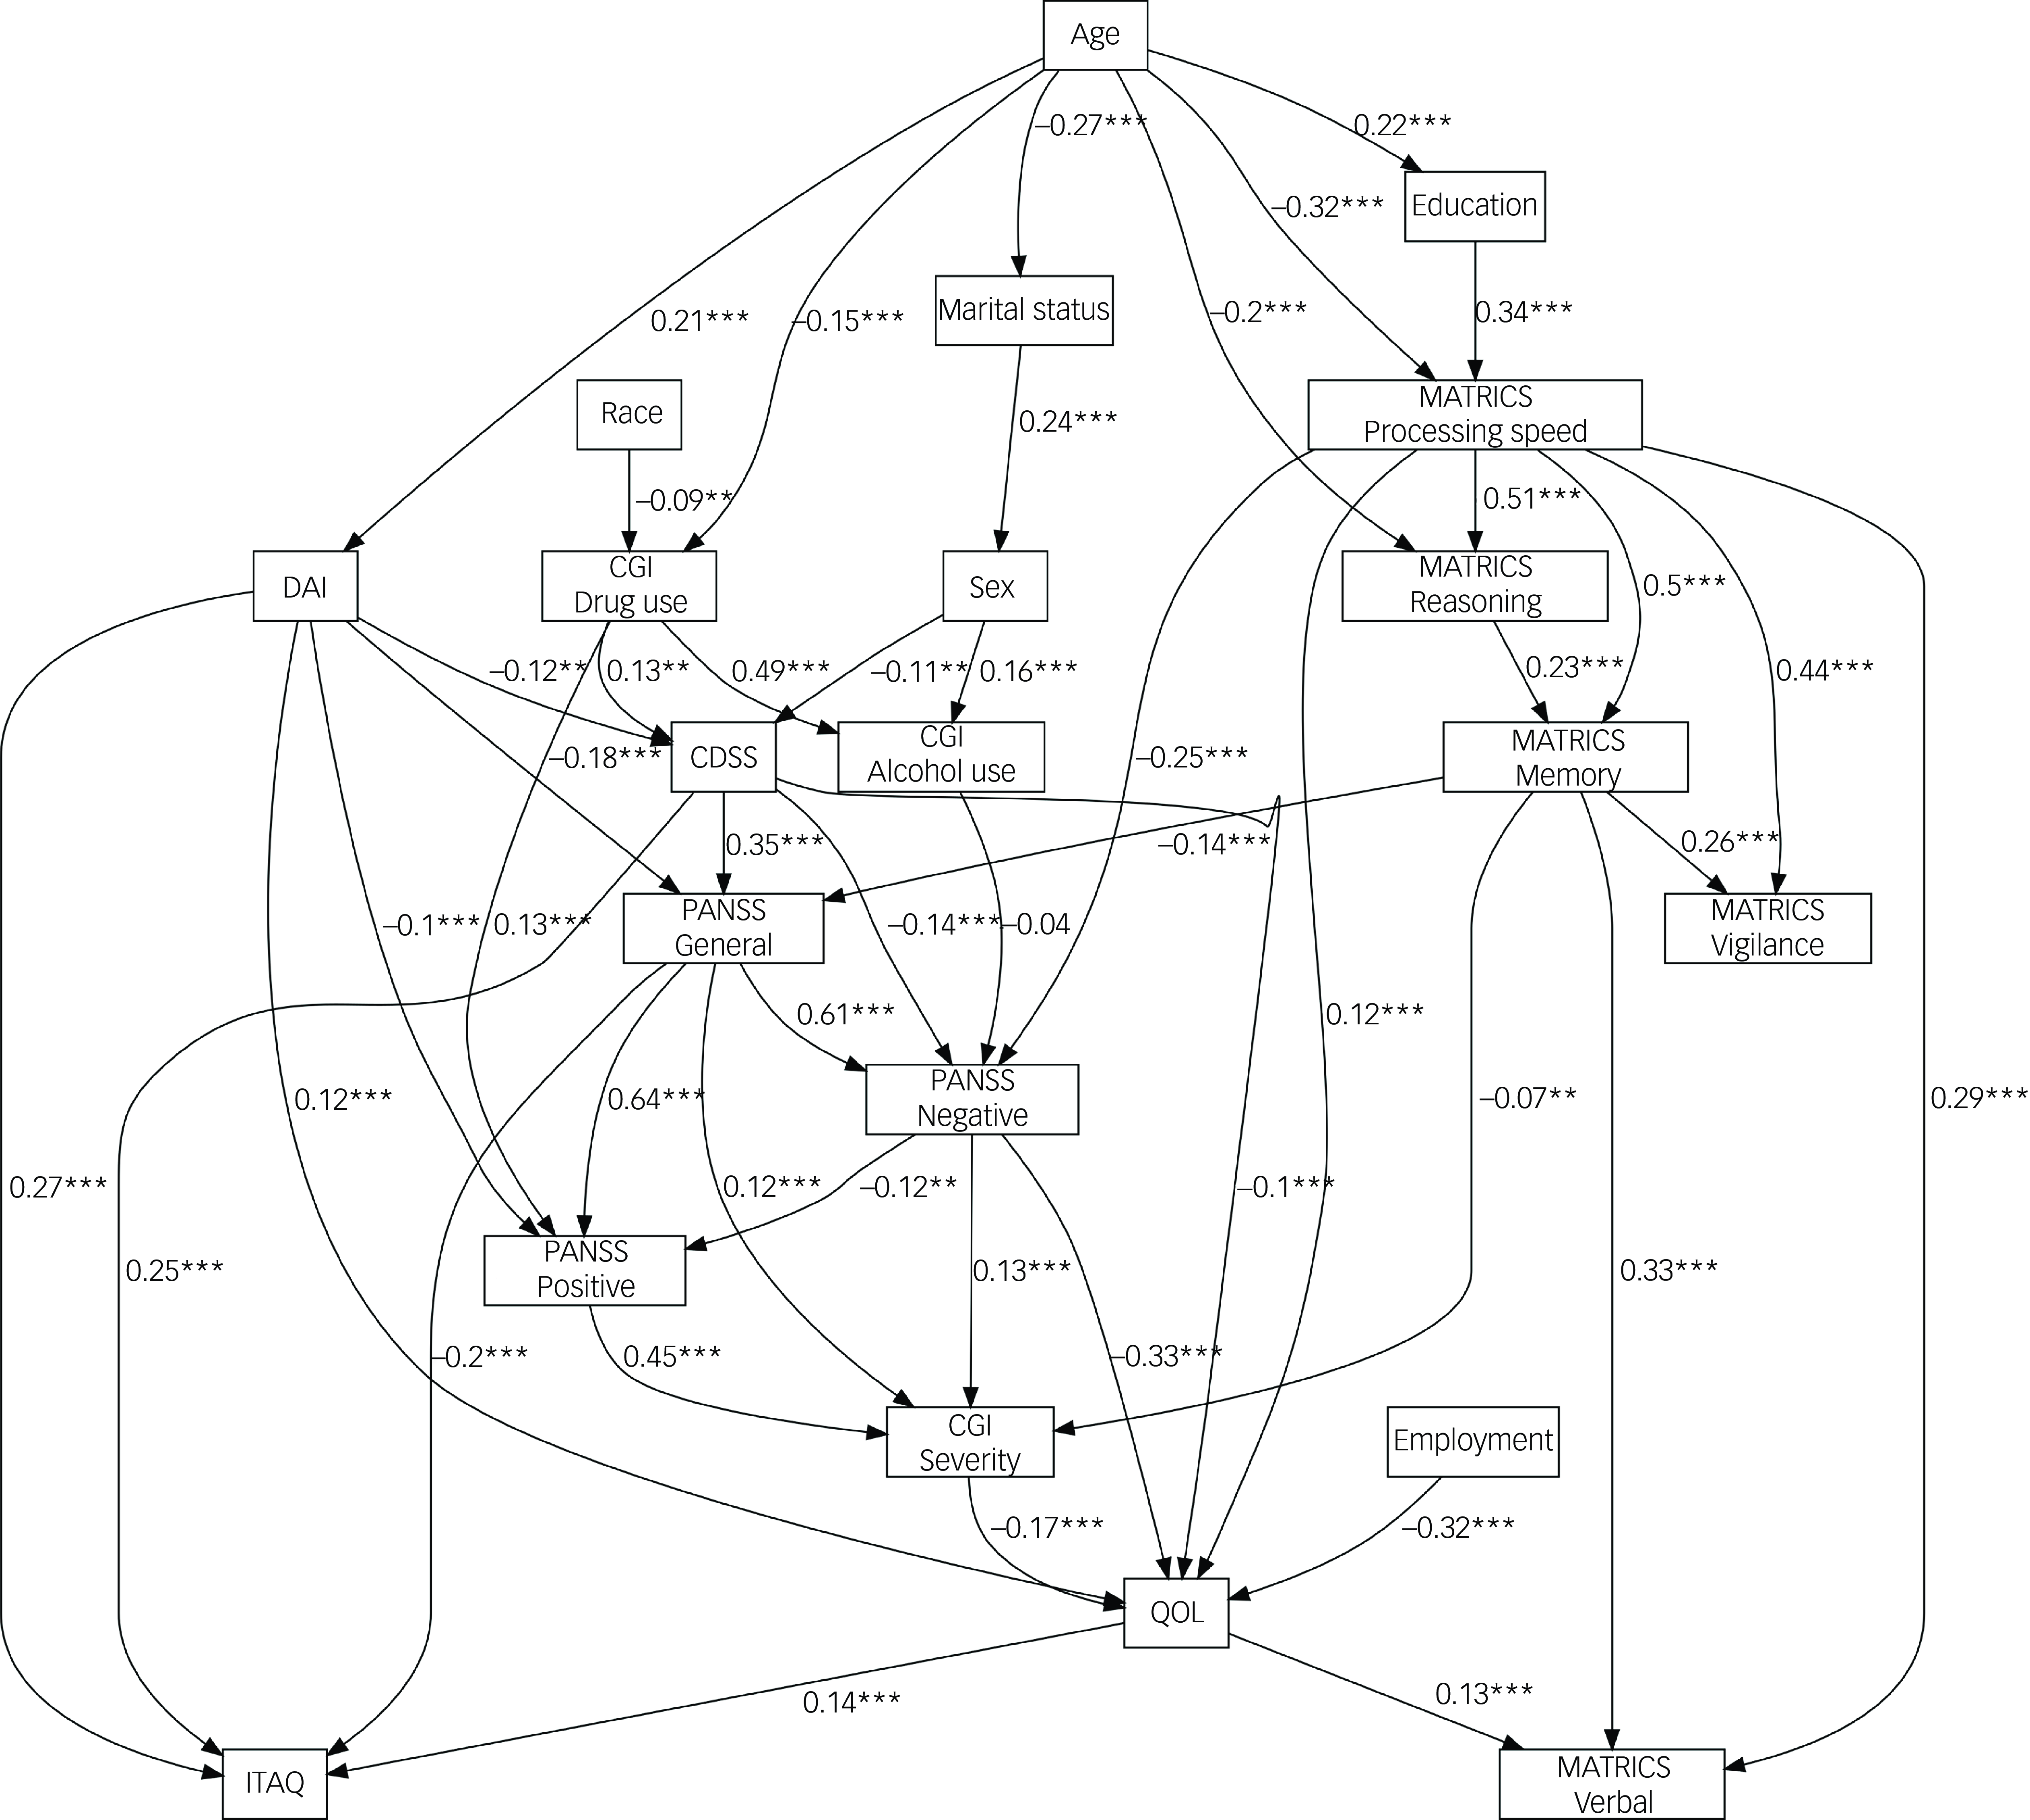
Fig. 2 Structural equation model of averaged Bayesian network. MATRICS, Measurement and Treatment Research to Improve Cognition in Schizophrenia; DAI, Drug Attitude Inventory; CDSS, Calgary Depression Scale for Schizophrenia; CGI, Clinical Global Impression; PANSS, Positive and Negative Syndrome Scale; QOL, Quality of Life; ITAQ, Insight and Treatment Attitudes Questionnaire. ** p < .01; *** p < .001.
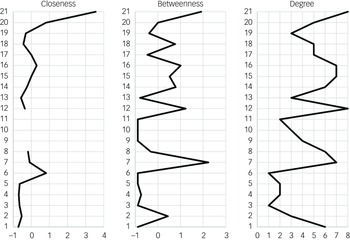
The three charts in Fig. 3 show the centrality statistics for the Bayesian network. QOL had the highest closeness, followed by employment and CGI severity index. The CDSS had the highest betweenness, followed by QOL and the MATRICS processing speed subscale. For degree, QOL and the MATRICS processing speed subscale had the highest numbers of edges (eight), followed by the CDSS, PANSS negative subscale and PANSS general subscale with seven edges each. The MATRICS processing speed subscale had more outgoing edges than QOL.
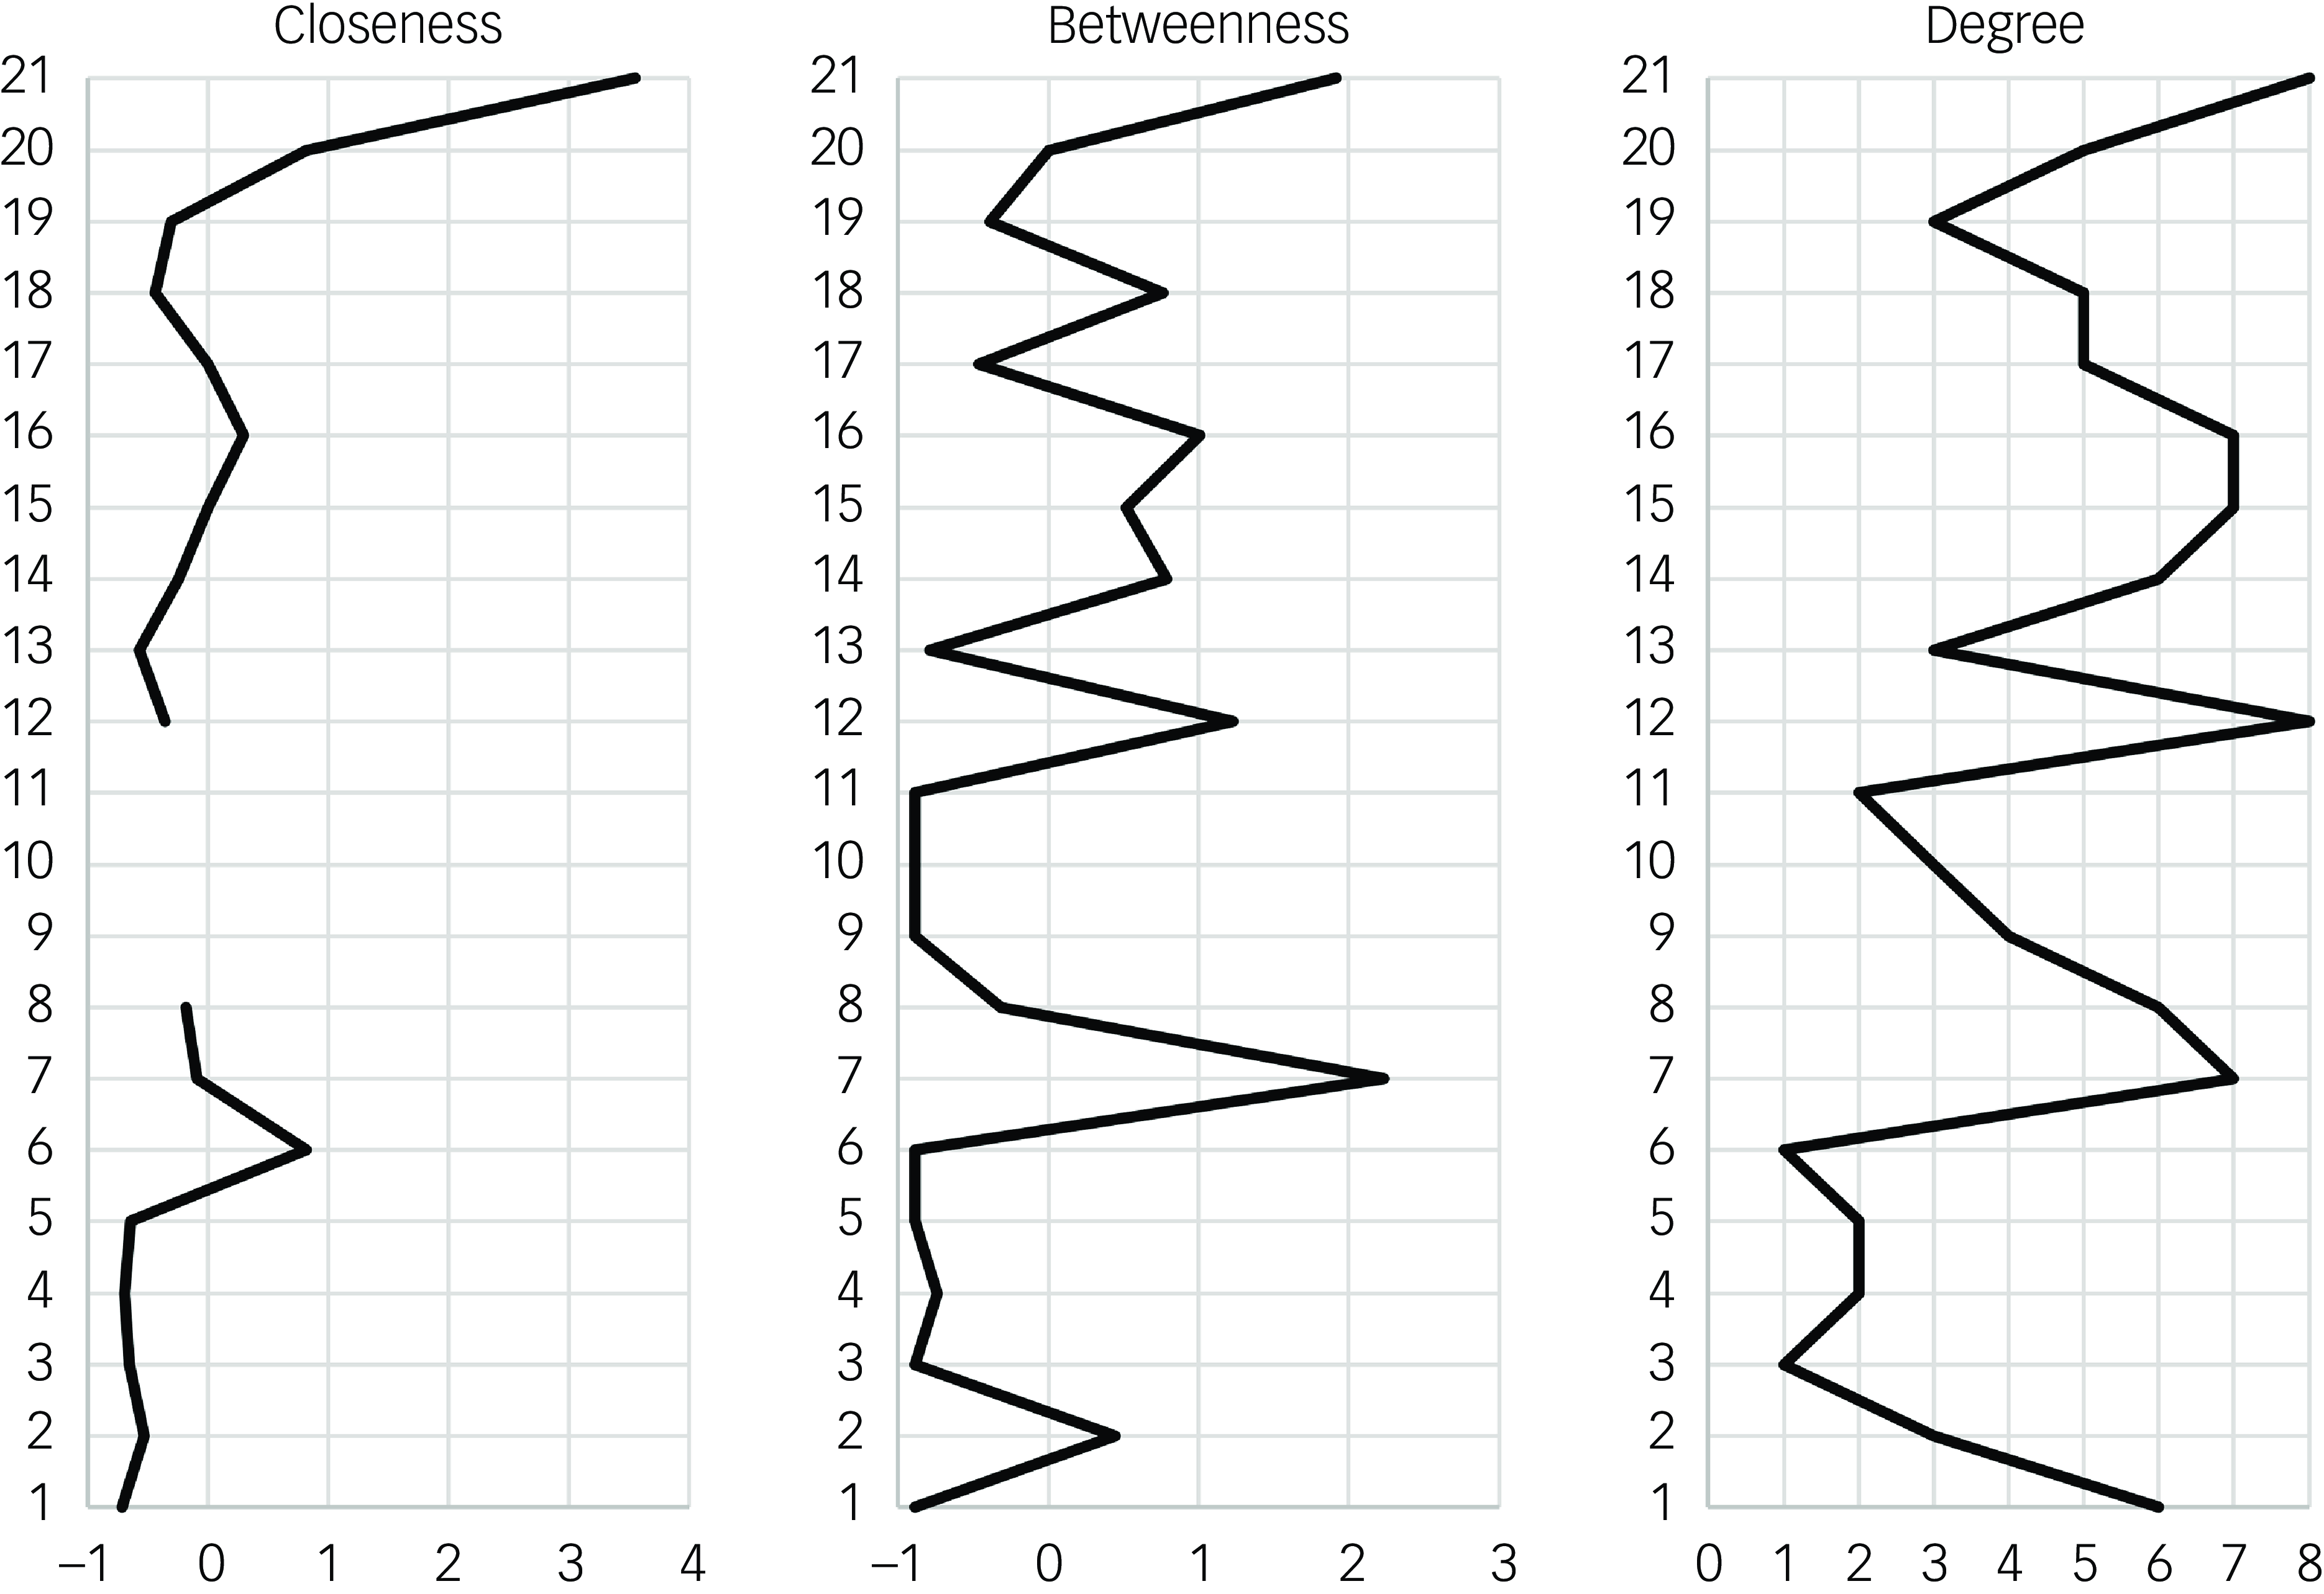
Fig. 3 Centrality statistics of the averaged Bayesian network. Standardised values are given for closeness and betweenness: 1, age; 2, sex; 3, race; 4, marital status; 5, education; 6, employment; 7, Calgary Depression Scale for Schizophrenia total; 8, Drug Attitude Inventory total; 9, Insight and Treatment Attitudes Questionnaire total; 10, Measurement and Treatment Research to Improve Cognition in Schizophrenia (MATRICS) verbal; 11, MATRICS vigilance; 12; MATRICS processing speed; 13, MATRICS reasoning; 14, MATRICS working memory; 15, Positive and Negative Syndrome Scale (PANSS) general; 16, PANSS negative; 17, PANSS positive; 18, Clinical Global Impression (CGI) drug use; 19, CGI alcohol use; 20, CGI severity; 21, quality of life.
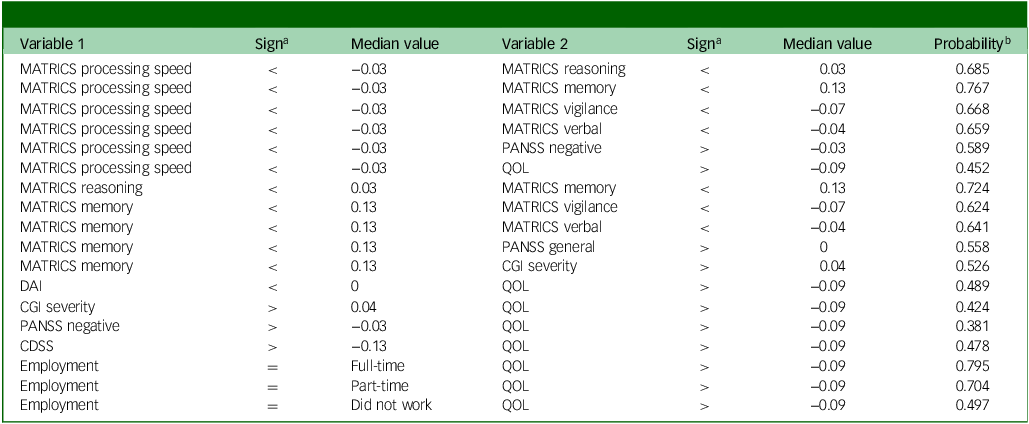
Table 4 presents the probability queries on the network’s MATRICS subscales and variables associated with these subscales. All values in the table are based on the median response for that variable. Overall, the results suggested that the associations between MATRICS subscales were stronger than those between MATRICS nodes and nodes representing the PANSS negative subscale, PANSS positive subscale, CGI severity and QOL, for median values. For the largest conditional associations, the probability of an individual scoring higher than the median on QOL, given that they were employed, was 0.795. In addition, the probability of a participant scoring less than the median on MATRICS memory was 0.767 if they scored less than the median for MATRICS processing speed and 0.724 if they scored less than the median for MATRICS reasoning if they scored less than the median for MATRICS processing speed. Scoring above the median on the PANSS negative was also associated with a 0.632 probability of scoring less than the median on the QOL index, and scoring below the median of processing speed was associated with a 0.452 probability of scoring above the median on the QOL index.
Table 4 Network conditional probability queries of MATRICS subscales and parents of QOL
MATRICS, Measurement and Treatment Research to Improve Cognition in Schizophrenia; QOL, Quality of Life; PANSS, Positive and Negative Syndrome Scale; CGI, Clinical Global Impression; DAI, Drug Attitude Inventory; CDSS, Calgary Depression Scale for Schizophrenia.
a. ‘Sign’ indicates whether scores are less than (<), greater than (>) or equal to (=) the median value.
b. ‘Probability’ indicates the probability of variable 2 being less than or greater than the median value, if variable 1 is less than or greater than the median.
Discussion
This study explored the directed relationships between cognitive, sociodemographic and clinical characteristics of PDS. We found that slower processing speed could be the primary cognitive impairment in PDS, as it was centrally located and associated with performance on all cognitive domains measured by the MATRICS. Processing speed was also associated with reduced subjective well-being (QOL) when we controlled for negative symptoms, illness severity and depression. Furthermore, cognitive performance was not associated with positive symptoms of schizophrenia; however, slower processing speed was related to greater severity of negative symptoms. In addition, poorer working memory, as measured by the MATRICS, was associated with higher levels of general symptoms on the PANSS. For PDS, being in full-time employment was a strong protective factor that increased the probability of having a higher QOL.
Our findings were generally in agreement with those of other research. General research on the MATRICS has found that the seven-factor structure of the MATRICS yields the best model fit when correlations are allowed between the factors. Reference McCleery, Green, Hellemann, Baade, Gold and Keefe36 Hence, the factors should be treated as non-orthogonal. Reference McCleery, Green, Hellemann, Baade, Gold and Keefe36 Our findings support this by indicating that the MATRICS subscales are interdependent and not independent of one another. In particular, processing speed was centrally associated with all other MATRICS subscales, consistent with findings by other authors. Reference Abplanalp, Lee, Horan, Kern, Penn and Green11
The present study’s findings that processing speed had high network centrality, closeness and degree were also aligned with previous research. Reference Buchwald, Narayanan, Siegert, Vignes, Arrowsmith and Sandham5 Abplanalp et al Reference Abplanalp, Lee, Horan, Kern, Penn and Green11 reported that processing speed was associated with all other MATRICS subscales and identified processing speed as a key cognitive process to target for treatment. We extended this research to identify other clinical correlates and QOL, fitted an SEM with standardised coefficients for effect sizes, and conducted probability queries on the network. A previous meta-analysis Reference Dickinson, Ramsey and Gold37 also found that processing speed was the most impaired of all cognitive domains in PDS; it also supported the order of impairment levels for the MATRICS subscales in PDS found in the present study, with the exception of vigilance. Reference Dickinson, Ramsey and Gold37
Research to date has not conclusively identified processing speed as most important for PDS, and there is no scientific or clinical consensus yet on which cognitive functions should be prioritised for the treatment of cognition for PDS. Reference Best and Bowie8 Working memory may also be a core cognitive deficit of schizophrenia, as it is associated with difficulties in handling social and interpersonal situations, Reference Eack and Newhill38 and Halverson, Orleans-Pobee Reference Watson, Zhang, Rizvi, Tamaiev, Birnbaum and Kane39 identified that social cognition was most important in explaining functional outcome. The CATIE data used in the present study predated the inclusion of social cognition as a subscale in the MATRICS. Future research could explore the centrality of processing speed found in the present study and that of Abplanalp et al Reference Abplanalp, Lee, Horan, Kern, Penn and Green11 and the findings of Halverson and Orleans-Pobee Reference Watson, Zhang, Rizvi, Tamaiev, Birnbaum and Kane39 of social cognition and functional outcomes by including functional outcomes alongside the MATRICS subscales and symptom measures, using a Bayesian symptom network.
Processing speed had a significant positive relationship with QOL in our study, albeit with a small effect size (β = 0.12). In addition, greater severity of negative symptoms had the highest coefficient for association with QOL; this was supported by previous systematic reviews and a meta-analysis. Reference Eack and Newhill38,Reference Watson, Zhang, Rizvi, Tamaiev, Birnbaum and Kane39 Our findings were also consistent with other research suggesting that positive symptoms are conditionally independent of QOL when results are corrected for the association of negative symptoms, and with previous studies that reported negative symptoms being more associated with decreases in QOL compared with positive symptoms. Reference Carbon and Correll40,Reference Novick, Montgomery, Cheng, Moneta and Haro41 The present study also identified full-time employment as a strong protective factor for PDS, compared with part-time employment or unemployment. Other research has reported that employment is associated with QOL. Reference Bouwmans, de Sonneville, Mulder and Hakkaart-van Roijen42 However, in contrast to Bouwmans et al, Reference Bouwmans, de Sonneville, Mulder and Hakkaart-van Roijen42 we did not find cognitive impairment and negative symptoms to be associated with employment in our study.
Processing speed from the MATRICS subscales was moderately associated with negative symptoms, in agreement with strong evidence from three systematic reviews and a combined meta-analysis. Reference Dominguez Mde, Viechtbauer, Simons, van Os and Krabbendam12–Reference Melillo, Caporusso, Giordano, Giuliani, Pezzella and Perrottelli14 All three systematic reviews found a significant but modest negative association between negative symptoms and cognition. Notably, Veerman et al Reference Veerman, Schulte and De Haan43 found that processing speed may mediate the association between working memory and negative symptoms. According to Melillo et al, Reference Melillo, Giordano, Caporusso, Tomassini, Perrottelli and Giuliani44 processing speed may be more consistently associated with severity of negative symptoms compared with other cognitive functions. In our study, processing speed seemed to mediate the relationship between cognitive functioning and negative symptoms, as all other MATRICS subscales were conditionally independent of negative symptoms once we had accounted for processing speed.
Both the negative and the general subscales of the PANSS were identified as mediating variables in the present study, making cognitive assessment scores and the PANSS positive subscale conditionally independent. Although this aligned with previous evidence that cognition is weakly correlated with positive symptoms, Reference Rek-Owodziń, Tyburski, Plichta, Waszczuk, Bielecki and Wietrzyński45 we did not find this association in our network, and other evidence suggests independence between these symptom groups, as concluded in a meta-analysis. Reference Ventura, Thames, Wood, Guzik and Hellemann46 Galderisi et al Reference Galderisi, Rucci, Kirkpatrick, Mucci, Gibertoni and Rocca9 found in their network study of schizophrenia that positive symptoms were not highly linked with other nodes in the network; however, our results suggested that they were was significantly associated with other PANSS subscales, as well as with drug attitude inventories and CGI severity. A later study by Galderisi et al Reference Galderisi, Rucci, Mucci, Rossi, Rocca and Bertolino10 found that positive symptoms were only weakly associated with other symptoms, whereas cognition was strongly associated with functional capacity. Amore et al Reference Amore, Murri, Calcagno, Rocca, Rossi and Aguglia47 used partial correlation networks of the PANSS, CDSS, MATRICS and other assessments. Although they did not comment on cognition specifically, they found that an index representing MATRICS scores was a central variable within the network.
The findings of the present study suggest that targeting processing speed in therapy for PDS could be more beneficial than focusing on other cognitive functions, as all other cognitive processes have associations with processing speed. Future research could identify plausible causal relationships between processing speed and other cognitive functions in PDS. Consistent with previous research, Reference McCleery, Green, Hellemann, Baade, Gold and Keefe36 we found that processing speed was the most impaired cognitive function in PDS and may be the core cognitive deficit. Cognitive remediation for processing speed may globally improve cognitive processes, enhance QOL and reduce negative symptoms. Reference Briganti, Scutari and McNally48 However, treating this cognitive process in isolation may also be difficult and not ideal for PDS. Treatments may provide improvements across a range of cognitive functions, Reference Santos, González-Fraile, Zabala, Guillén, Rueda and Ballesteros49 and a literature review has concluded that treating a specific cognitive function with cognitive remediation has a general effect rather than an isolated effect. Reference Reddy, Horan, Jahshan and Green50 Our results supported this concept, as we found that cognitive functions measured by the MATRICS had complex associations with each other. We conclude that processing speed may be the central cognitive impairment in schizophrenia, in agreement with Abplanalp et al. Reference Abplanalp, Lee, Horan, Kern, Penn and Green11
Limitations
This study advances our understanding of the associations between variables by accounting for key confounders and modelling their interrelationships. However, several limitations should be acknowledged. First, the cross-sectional design precluded any complete inference of causal directionality. Network edges capture conditional associations, but these may reflect unmeasured or latent variables, which were not directly modelled and could substantially alter the observed structure. Reference Briganti, Scutari and McNally48 Second, although Bayesian networks provide a flexible framework for representation of relationships in the data, the approximation algorithms needed for model estimation did not allow us to rule out alternative structures that might explain the observed dependencies equally well or better. Reference Briganti, Scutari and McNally48 Third, orientation of edges should be interpreted with caution: when directionality is not compelled by the data, edges are retained irrespective of orientation, meaning that apparent causal interpretations (e.g. between processing speed and working memory) are not empirically justified. Another key consideration is that the measures used in the present study were from the CATIE pharmaceutical trial baseline assessment. Since that time, the conceptualisation of negative symptoms has slightly changed; consequently, the measures may have limited validity. Future studies should consider using the Clinical Assessment Interview for Negative Symptoms and the Brief Negative Symptom Scale for improved reliability and validity. Reference Kumari, Malik, Florival, Manalai and Sonje19 Finally, the interpretation of centrality indices remains debated. Although they are commonly reported, their validity as indicators of intervention targets in psychological and cognitive networks is exploratory in nature, and any conclusions drawn from them should be validated empirically in future studies. Reference Bringmann, Elmer, Epskamp, Krause, Schoch and Wichers51
Supplementary material
The supplementary material is available online at https://doi.org/10.1192/bjo.2025.10929
Data availability
The data are available from the National Institute of Health Data Archive and are therefore not disseminated by the authors (NDA Study DOI: 10.15154/ev0h-1q75). The computer code to replicate the study is available in the link below. https://github.com/KhanBuchwald/Symptom_network_insights_from_the_CATIE_study_on_schizophrenia-The_impact_of_processing_speed.git.
Acknowledgements
Data and/or research tools used in the preparation of this manuscript were obtained from the NDA. The NDA is a collaborative informatics system created by the National Institutes of Health (NIH) to provide a national resource to support and accelerate research in mental health. Data-set identifier(s): 10.15154/ev0h-1q75. This manuscript reflects the views of the authors and may not reflect the opinions or views of the NIH or of the submitters submitting original data to the NDA.
Author contributions
All authors contributed to conceptualisation, data curation, methodology, project administration, and review and editing of the manuscript. R.J.S., M.V., A.N. and M.S. contributed to the PhD supervision of K.B. K.B. and M.V. contributed to formal analysis, investigation and software use. M.V. contributed to validation of the results, and K.B. contributed to writing of the original draft and visualisation.
Funding
This research received no specific grant from any funding agency, commercial or not-for-profit sectors.
Declaration of interest
None.


 Open access
eLetters
No eLetters have been published for this article.