

1. Introduction
The transition to clean energy is driving global competition for rare earth elements (REEs), which are crucial to future green economies and the defense industry. Currently, China dominates the global supply chain for REEs, posing a strategic vulnerability for countries like the United States, which heavily relies on imports for various industries.Footnote 1 The U.S. government has recognized the issue of rare earth supply chains as a primary concern for national security. The U.S. has initiated efforts to establish a domestic supply chain, including partnerships with companies like MP Materials and Lynas Rare Earths. MP Materials is a U.S.-based company specializing in rare-earth mining and processing, playing a key role in reducing reliance on REE supply. In addition, Australia, the U.S., and Japan, as allies with a stake in REEs, are collaborating to build a secure supply chain. However, reducing dependence on China will take time and require significant home-based research and investment. It is a long-term process that could take a decade or more to develop a resilient supply chain. While complete supply chain independence from China may be unrealistic, efforts are being made to diversify and secure the supply of REEs. The goal is to have a competitive alternative market that offers fewer policy disruptions and economic complications.
In this paper, we explore various aspects of a potential duopoly between China and the rest Of the world (ROW) in REE markets, as a possible market structure that may emerge over time.Footnote 2 Specifically, we analyze the interaction between these two players and assess their market share within a duopoly framework. To achieve this, we employ a duopoly game framework that accounts for extraction activities and the available resource stock, drawing on the work of Groot et al. (Reference Groot, Withagen and De Zeeuw2003). Furthermore, to better capture the dynamics of reserves, including known and unknown resources, we modify the reserve dynamics to focus on known reserves and emphasize the concept of relative scarcity. Rather than focusing on their exhaustibility, we acknowledge the challenges associated with their discovery and refinement. In line with this perspective, assuming that when REEs become scarce, there is an impact on the probability of discovering previously economically unviable deposits and on the improvement of production processes. This perspective highlights the dynamic nature of resource availability and the potential to overcome scarcity through technological advancements, exploration, and policy measures.
Our research explores two critical dimensions within the framework described. First, we investigate the implications of diminishing the marginal cost of China’s competitors through technological advancements. By examining the potential impact of these advancements, we aim to shed light on how they can shape the dynamics of the REE markets. Second, we analyze in depth the influence of supportive policies on overall market dynamics.Footnote 3 Recognizing the significant role that policies can play in shaping market behavior, we explore how production subsidies can affect the strategic interactions between China and the ROW within a duopoly context. By addressing these aspects, our study contributes to a broader understanding of the REE markets and their intricate dynamics by incorporating considerations of known reserve dynamics and relative scarcity, as well as the interplay between China and the ROW.
On methodological grounds, we adopt a forward-looking, moving-horizon strategy as the solution concept, which challenges the unrealistic cognitive assumptions inherent in a model-consistent expectation approach. We embrace the idea, supported by Woodford (Reference Woodford2019), that agents look ahead only a finite distance into the future and rely on a learned value function to evaluate potential outcomes based on their own and others’ actions and the changes in the environment that set the constraints for the actions. Like the recently proposed reinforcement learning (see Bertsekas, Reference Bertsekas2024), our procedure involves an N-step lookahead prediction that incorporates future system dynamics.
It can simulate the decision-making process for policymakers operating under finite time horizons, constrained by limited information, potentially leading to adaptive responses even when the dataset changes. By considering these features, we gain insights into the practical challenges of policy design, including agents’ myopic tendencies and inattention (Grüne et al. Reference Grüne, Semmler and Stieler2015; Di Bartolomeo et al. Reference Di Bartolomeo, Di Pietro, Saltari and Semmler2018). Formally, we implement the solution of our model by using a Nash version of a nonlinear model predictive control approach, NMPC, which is a receding horizon method that solves a nonlinear optimal control problem at each point in time by updating the model predictions and strategies based on the results of the previous iteration,Footnote 4 which in the form of MPC is in the literature used as the basis for reinforcement learning (Bertsekas, Reference Bertsekas2024).
Regarding our economic topic, the extraction of non-renewable resources used as inputs in production and consumption within an intertemporal model has long been a subject of interest in economics. Hotelling (Reference Hotelling1931), expanding on Ramsey’s (Reference Ramsey1928) earlier work, introduced an initial model for optimizing resource extraction. Salant (Reference Salant1976) elaborated on this by incorporating dynamic game theory into non-renewable resource markets, specifically in a cartel-fringe setting. This work laid the groundwork for subsequent research by Pindyck (Reference Pindyck1978), Lewis and Schmalensee (Reference Lewis and Schmalensee1980a, Reference Lewis, Schmalensee, Lewis and Schmalensee1980b), and Salant (Reference Salant1982). Ulph and Folie (Reference Ulph and Folie1980) expanded on Salant’s model by incorporating production costs and allowing fringe firms to determine their production as price takers in response to the cartel’s price decisions.
Groot et al. (Reference Groot, Withagen and De Zeeuw2000, Reference Groot, Withagen and De Zeeuw2003) proposed a leader–follower model. In this model, the leader determines the extraction rate based on the value of the resource stocks, and then the follower acts simultaneously, considering the leader’s extraction rate.Footnote 5 Greiner et al. (Reference Greiner, Semmler and Mette2012) made significant progress by presenting a dynamic model that examines the evolving nature of known reserves. Their analysis focused on a monopolistic resource owner and incorporated two state variables: the resource’s proven reserves and its cumulative extraction history. Additionally, they introduced a decision variable: the optimal extraction rate.
Our study contributes to the above literature in several ways. First, building on the work of Groot et al. (Reference Groot, Withagen and De Zeeuw2003), we introduce a dynamic supply-side game with a duopoly that models the simultaneous interaction between leader and follower firms in the context of exhaustible natural resources. Second, we incorporate the dynamics of known reserves, which are not all known at the beginning, as outlined by Greiner et al. (Reference Greiner, Semmler and Mette2012), and we propose a modified model that accounts for a duopolistic market structure, including extraction costs and the evolution of the stock of discovered resources. However, we consider the rarity of REEs in terms of the challenges associated with their discovery and refinement, rather than their exhaustibility.
Accordingly, we assume that when REEs become scarce, there is a higher probability of discovering new deposits that were previously considered economically unviable, as well as of improving production processes. Lastly, we present a numerical solution to a noncooperative, differential game between China and the ROW using the model predictive control (MPC) approach while examining the effect of policymakers’ levels of myopia. We interpret a preference for the short run over the long run (higher myopia vs. lower myopia) as a measure of political instability, i.e., the tendency of policymakers to prioritize immediate gains over long-term sustainability. This myopic behavior may result in suboptimal resource management, affecting market stability and strategic decision-making in the REE sector. Di Bartolomeo et al. (Reference Di Bartolomeo, Di Pietro, Saltari and Semmler2018) explained that varying decision horizons characterize different policy equilibria.
A limitation of our framework should be mentioned. Our setup is built on the simplifying assumption that the ROW behaves as a single, unified actor. In practice, ROW includes multiple countries with heterogeneous interests, making coordinated action inherently difficult. While this abstraction keeps the model tractable and analytically focused, it is important to acknowledge that this simplification may overlook relevant strategic frictions among international players. As such, the results should be interpreted with this caveat in mind.
The remainder of the paper is structured as follows. Section 2 presents stylized facts, Section 3 introduces the methodology for solving differential games with moving-horizon strategies, and Section 4 illustrates our duopoly framework. Section 5 introduces the “monopoly power” product cycle, i.e., the scenarios we consider, which correspond to different phases of the REE markets. Section 6 presents our results. Finally, the paper provides conclusions in Section 7.
2. Some stylized facts
This section presents key findings on REEs based on data from the International Energy Agency (IEA) and the US Geological Survey.Footnote 6 According to the US Geological Survey (2023), REEs are abundant in the Earth’s crust, but minable concentrations can be challenging to locate compared to other mineral commodities. Additionally, REE processing operations can result in adverse environmental impacts, and China’s dominance across various parts of the REE supply chain, including mining, separation, and refining, poses challenges (IEA, 2021). This dominance extends to light rare-earth elements, such as neodymium, praseodymium, lanthanum, and cerium, as well as to heavy rare-earth elements, including dysprosium, terbium, ytterbium, and yttrium.
After the mid-1990s, China rapidly established itself as the dominant global supplier of REEs, a group of 17 chemically similar elements crucial to modern technologies, surpassing the United States’ previous dominance. By the late 1990s, China controlled around 95% of the global supply of REEs. This dominance was achieved through a combination of low production costs, vast resource deposits, and substantial government investment in REE extraction and processing capabilities. China’s stronghold in this sector has had a profound impact on global industries, particularly those related to clean energy technologies and advanced electronics.
China’s advantage in the REE market extends beyond its production capacity. It also holds significant REE reserves, giving it a long-term strategic position. According to data from the US Geological Survey (2023), China leads the world in REE reserves, followed by Vietnam, Russia, and Brazil. These countries collectively possess substantial untapped REE resources, although they have not yet reached the same production scale as China. This reserve distribution highlights the concentration of REE resources in a few key regions globally, further intensifying China’s dominance in the market.
Despite China’s dominance, its share of global REE mining has declined gradually in recent years. Nevertheless, it continues to exert considerable control over downstream REE operations, particularly at the refining and processing stages. As of 2019, China held 90% of the global market share in REE processing operations, according to the IEA (IEA, 2021). This is a critical advantage, as raw REEs extracted from the earth must undergo complex chemical processing before they can be used in advanced manufacturing processes.
Although other countries have processing facilities, they are limited to handling light REEs. For instance, Malaysia has four processing plants, while France, India, and Estonia also contribute to light REE processing. However, China remains the dominant player in processing heavy REEs, which are rarer and more difficult to refine, but essential for several high-tech applications. This gives China a substantial edge in the global REE market, particularly in industries that rely on these elements for advanced technologies such as wind turbines, solar technology, battery production, and electric vehicles (EVs).
China’s dominant position has not gone unchallenged. In 2010, China significantly reduced its exports of REEs, leading to a surge in prices and raising concerns about global supply chain vulnerabilities. In response, various countries and companies have initiated efforts to diversify REE production and reduce reliance on China. According to recent reports, approximately 20 new REE mining and processing projects are underway in Australia, Canada, and the United States. These projects aim to increase the global supply of REEs and provide alternative sources for industries that rely heavily on these critical elements. Some of these projects are expected to commence operations in the mid-to-late 2020s, contributing to the diversification of the REE supply chain.
Rare earth elements are indispensable for producing clean energy technologies, particularly in the manufacturing of wind turbines, solar panels, batteries, and EVs. These technologies rely heavily on REEs to produce permanent magnets, a key component in the motors of wind turbines and EVs. Among the various REEs, neodymium, dysprosium, praseodymium, and terbium are considered the most critical for clean energy applications. These elements are used in the production of permanent-magnet synchronous motors, which are widely used in electric vehicles and play a crucial role in improving their energy efficiency. However, several challenges have arisen due to the increasing demand for REEs in the clean energy sector. One significant issue is the lack of established recycling pathways for REEs, which makes it difficult to reuse these elements after they are used in products such as EVs and wind turbines. This has led to a growing dependence on primary sources of REEs. Furthermore, the high demand for REEs has driven prices sharply higher. For example, the price of neodymium, a key element for permanent magnets, surged from approximately USD 60 per kilogram in June 2020 to over USD 120 per kilogram by February 2021. This dramatic price increase has led some manufacturers to explore alternatives.
The price trends of key REEs such as neodymium, dysprosium, and terbium from 2018 to 2022 reflect the growing pressures on the REE market. These elements have seen significant price increases due to their critical role in emerging clean energy technologies. According to data from the US Geological Survey (2023), the price of terbium has risen sharply in recent years, reaching over USD 2,000 per kilogram by 2022. Meanwhile, the prices of neodymium and dysprosium have also increased, albeit at a more gradual pace.
Looking ahead, the demand for REEs is expected to grow significantly, driven by the global shift toward clean energy and the increasing adoption of electric vehicles. According to the IEA (2021), the demand for REEs is projected to triple by 2040 under the Stated Policies Scenario (STEPS) and could increase sevenfold under the sustainable development scenario (SDS). This anticipated growth underscores the importance of securing stable and diversified supply chains for REEs to support the global energy transition and meet the needs of the rapidly expanding clean energy sector.
3. The moving-horizon decision framework
This section introduces our solution concepts based on moving-horizon strategies implemented via MPC techniques. The MPC technique is a control strategy that aims to determine an optimal decision policy by solving an optimization problem at each time step. This optimization problem predicts the system’s future behavior over a finite time horizon and finds the sequence of control actions that minimize a predefined cost function while satisfying constraints on the system’s states and control inputs.Footnote 7
We begin by addressing the problem of a single agent, following the framework outlined by Grüne and Pannek (Reference Grüne and Pannek2013). Subsequently, we extend this to cover strategic interactions among multiple players, introducing the concept of Nash MPC equilibrium as discussed by Saltari et al. (Reference Saltari, Semmler and Di Bartolomeo2022). Usually, the MPC procedure is written in continuous time, but it can be converted to discrete time, often using the Euler discretization method (see Grüne et al. Reference Grüne, Semmler and Stieler2015).
Consider the following state-space model:
 \begin{equation}x(t+1)=f(x(t),u(t)),\mathrm{with}\, {x}(0)=x_{0},\end{equation}
where $x(t)\in X\subseteq \mathbb{R}^{n}$
is the state of the system at time
$x(t)\in X\subseteq \mathbb{R}^{n}$
is the state of the system at time $t$
,
$t$
, $u(t)\in U\subseteq \mathbb{R}^{m}$
is the control input at time
$u(t)\in U\subseteq \mathbb{R}^{m}$
is the control input at time $t$
, and
$t$
, and $f\colon \mathbb{R}^{n}\times \mathbb{R}^{m}\rightarrow \mathbb{R}^{n}$
is the system dynamics function that defines how the state evolves based on the current state and control input. In the model,
$f\colon \mathbb{R}^{n}\times \mathbb{R}^{m}\rightarrow \mathbb{R}^{n}$
is the system dynamics function that defines how the state evolves based on the current state and control input. In the model, $X$
is the set of allowable states, and
$X$
is the set of allowable states, and $U$
is the set of admissible control inputs.
$U$
is the set of admissible control inputs.
At each time step $t$
, the objective of MPC is to minimize a cost function (
$t$
, the objective of MPC is to minimize a cost function ( $J$
) that represents the system’s performance over a finite time horizon (
$J$
) that represents the system’s performance over a finite time horizon ( $T$
):
$T$
): $J=\sum _{k=0}^{T-1}L(x(k),u(k))+V(x(T))$
. The cost function is typically composed of a period cost,
$J=\sum _{k=0}^{T-1}L(x(k),u(k))+V(x(T))$
. The cost function is typically composed of a period cost, $L(x(t),u(t))$
, which penalizes deviations from a desired state or control effort at each time step, and a terminal cost,
$L(x(t),u(t))$
, which penalizes deviations from a desired state or control effort at each time step, and a terminal cost, $V(x(T))$
, which penalizes the state at the end of the prediction horizon).
$V(x(T))$
, which penalizes the state at the end of the prediction horizon).
Formally, for each $t\in \{1,N-1\}$
, the MPC optimization problem can be written as follows:
$t\in \{1,N-1\}$
, the MPC optimization problem can be written as follows:
 \begin{equation} \mathop{\min}\limits_{u(t),u(t+1),\ldots ,u(t+T-1)}J=\sum _{k=0}^{T-1}L(x(t+k),u(t+k))+V(x(t+T))\end{equation}
Subject to: $x(t+1)=f(x(t),u(t))$
and
$x(t+1)=f(x(t),u(t))$
and $x(t)\in X,u(t)\in U,x(t-1)\in x_{C}$
, where
$x(t)\in X,u(t)\in U,x(t-1)\in x_{C}$
, where $x_{C}$
is the current state of the system at
$x_{C}$
is the current state of the system at $t$
.
$t$
.
Defining by $u^{\ast}(i\vee j)$
the optimal control that solves the above problem for the control at time
$u^{\ast}(i\vee j)$
the optimal control that solves the above problem for the control at time $i\in [1,N-1]$
when the MPC is solved at time
$i\in [1,N-1]$
when the MPC is solved at time $j\in [1,N-1]$
, the optimal MPC control is just the sequence
$j\in [1,N-1]$
, the optimal MPC control is just the sequence $\{u^{*}(i|i)\}_{i=0}^{N-1}$
, i.e.,
$\{u^{*}(i|i)\}_{i=0}^{N-1}$
, i.e., $u^{*}(1|1),u^{*}(2|2),\ldots ,u^{*}(N-1|N-1)$
.
$u^{*}(1|1),u^{*}(2|2),\ldots ,u^{*}(N-1|N-1)$
.
In a nutshell, at each time step $t$
, MPC finds the optimal control sequence that minimizes
$t$
, MPC finds the optimal control sequence that minimizes $J$
subject to the state-space model between
$J$
subject to the state-space model between $t$
and
$t$
and $T$
, given the current state of the system as the initial condition. The MPC controller computes an optimal control sequence for the horizon, (
$T$
, given the current state of the system as the initial condition. The MPC controller computes an optimal control sequence for the horizon, ( $u^{*}(t)$
,
$u^{*}(t)$
, $u^{*}(t+1)$
, …,
$u^{*}(t+1)$
, …, $u^{*}(t+T-1)$
). However, only the first control action
$u^{*}(t+T-1)$
). However, only the first control action $u^{*}(t)$
is applied to the system at time
$u^{*}(t)$
is applied to the system at time $t$
. At the next step,
$t$
. At the next step, $t+1$
, the system’s state is re-measured. The optimization problem is solved again for the updated state
$t+1$
, the system’s state is re-measured. The optimization problem is solved again for the updated state $x(t+1)$
, generating a new optimal control sequence for the next horizon
$x(t+1)$
, generating a new optimal control sequence for the next horizon $T$
. This process is repeated at each step, creating a receding horizon approach, where the optimization problem is continuously updated based on the latest state information.
$T$
. This process is repeated at each step, creating a receding horizon approach, where the optimization problem is continuously updated based on the latest state information.
Now, our objective is to illustrate how to extend the MPC solution to incorporate strategic interactions among multiple policymakers with $N$
periods of a decision horizon and
$N$
periods of a decision horizon and $T$
periods of a planning horizon (Saltari et al. Reference Saltari, Semmler and Di Bartolomeo2022). For brevity, we will consider a scenario involving two players. In this context, the evolution over the planning horizon is influenced by the decisions made by two policymakers:
$T$
periods of a planning horizon (Saltari et al. Reference Saltari, Semmler and Di Bartolomeo2022). For brevity, we will consider a scenario involving two players. In this context, the evolution over the planning horizon is influenced by the decisions made by two policymakers:
 \begin{equation}x(t+1)=f(x(t),u^{1}(t),u^{2}(t)),\mathrm{with}\ {x}(0)=x_{0},\end{equation}
Here, player 1 sets $u^{1}(t)\in U_{1}\subseteq \mathbb{R}^{{m_{1}}}$
, player 2 sets
$u^{1}(t)\in U_{1}\subseteq \mathbb{R}^{{m_{1}}}$
, player 2 sets $u^{2}(t)\in U_{2}\subseteq \mathbb{R}^{{m_{2}}}$
, with
$u^{2}(t)\in U_{2}\subseteq \mathbb{R}^{{m_{2}}}$
, with $m_{1}+m_{2}=m$
, and
$m_{1}+m_{2}=m$
, and $x(t)\in X\subseteq \mathbb{R}^{n}$
.
$x(t)\in X\subseteq \mathbb{R}^{n}$
.
Each player $k\in \{1,2\}$
seeks to optimize their objective function over a finite time horizon (
$k\in \{1,2\}$
seeks to optimize their objective function over a finite time horizon ( $T$
). The function is denoted by
$T$
). The function is denoted by $J^{k}$
and depends on their state and control variables. Formally,
$J^{k}$
and depends on their state and control variables. Formally, $J^{k}=\sum _{k=0}^{T-1}L^{i}(x(k),u^{1}(t),u^{2}(t))+V^{i}(x(T))$
. Once again, we assume that players solve their problems by iteratively solving an optimal control problem at each sampling instant, following a receding decision horizon approach. The MPC two players’ optimization problem, for each
$J^{k}=\sum _{k=0}^{T-1}L^{i}(x(k),u^{1}(t),u^{2}(t))+V^{i}(x(T))$
. Once again, we assume that players solve their problems by iteratively solving an optimal control problem at each sampling instant, following a receding decision horizon approach. The MPC two players’ optimization problem, for each $t\in \{0,N\}$
, can be written as follows:
$t\in \{0,N\}$
, can be written as follows:
 \begin{equation}\begin{cases} \mathop{\min}\limits_{u^{1}\left(t\right),u^{1}\left(t+1\right),\ldots ,u^{1}\left(t+T-1\right)}J^{1}=\sum _{k=0}^{T-1}L\left(x\left(t+k\right),u^{1}\left(t+k\right),u^{2}\left(t+k\right)\right)+V\left(x\left(t+T\right)\right)\\[10pt]\mathop{\min}\limits_{u^{2}\left(t\right),u^{2}\left(t+1\right),\ldots ,u^{2}\left(t+T-1\right)}J^{2}=\sum _{k=0}^{T-1}L\left(x\left(t+k\right),u^{1}\left(t+k\right),u^{2}\left(t+k\right)\right)+V\left(x\left(t+T\right)\right) \end{cases}\end{equation}
Subject to: $x(t+1)=f(x(t),u^{1}(t),u^{2}(t))$
and
$x(t+1)=f(x(t),u^{1}(t),u^{2}(t))$
and $x(t)\in X,u^{1}(t)\in U_{1},u^{2}(t)\in U_{2}$
,
$x(t)\in X,u^{1}(t)\in U_{1},u^{2}(t)\in U_{2}$
, $x(t-1)\in x_{C}$
, where
$x(t-1)\in x_{C}$
, where $x_{C}$
is the current state of the system at
$x_{C}$
is the current state of the system at $t$
.Footnote
8
$t$
.Footnote
8
The Nash MPC solution is then just the sequence, $\{u^{1\ast}(i|i),u^{2\ast}(i|i)\}^{N-1}_{i=0}$
i.e., for each
$\{u^{1\ast}(i|i),u^{2\ast}(i|i)\}^{N-1}_{i=0}$
i.e., for each $i\in [1,N-1]$
, the pair of the optimal controls that solve the above problem for the control at time
$i\in [1,N-1]$
, the pair of the optimal controls that solve the above problem for the control at time $i$
when the MPC is solved at time
$i$
when the MPC is solved at time $i$
. In other words, for each player, the chosen control or strategy maximizes the objective function, given the other player’s strategy and the initial state. The control is, however, applied over the decision horizon by executing only the first control actions at the current time step, then solving the optimization problem again at the next step with an updated state measurement, repeating this process in a receding-horizon fashion until time
$i$
. In other words, for each player, the chosen control or strategy maximizes the objective function, given the other player’s strategy and the initial state. The control is, however, applied over the decision horizon by executing only the first control actions at the current time step, then solving the optimization problem again at the next step with an updated state measurement, repeating this process in a receding-horizon fashion until time $N-1$
.
$N-1$
.
The Nash MPC equilibrium defines a strategy profile in which each player optimizes its objective function, taking into account the expected behavior of the other players and the game’s dynamics. A plausible definition of a Nash equilibrium would then be that at each instant of time, t, the respective control decisions of the players, defined by the controls u(t) would converge toward some constants. This concept can be generalized to include more than two players. However, it is essential to recognize that this definition resembles a traditional Nash solution concept, albeit with certain restrictions on the strategy space. Additionally, regarding existence and stability, it should be noted that the regularity conditions identified by Grüne and Pannek (Reference Grüne and Pannek2013) for individual agents may not necessarily apply in situations involving distinct payoff functions and strategic interactions among players (Grüne, et al., Reference Grüne, Semmler and Stieler2015, sect. 3; Saltari et al. Reference Saltari, Semmler and Di Bartolomeo2022).Footnote 9
4. The economic model
The rest of the paper focuses on the dynamics of China’s and ROW’s market shares. This is analyzed using an extended version of the theoretical model of natural resource extraction by Groot et al. (Reference Groot, Withagen and De Zeeuw2003), adapted to a duopoly framework. In this model, China maintains a leading position due to its vast resource stocks and lower marginal extraction costs than other countries.
Our analysis considers the rarity of REEs, related to the difficulty of discovery and refinement, rather than their scarcity in the Earth’s crust. This limited access to resources is captured in our model through the dynamics of the stock of available (discovered) resources. Unlike Hotelling’s models for non-renewable resources,Footnote 10 which focus on exhaustibility, we emphasize the concept of (relative) scarcity. In this respect, we assume that when REEs become scarce, it is more likely that new deposits that were previously economically unviable will be discovered and that production processes will improve.Footnote 11
Formally, the evolution of the discovered reserves of REEs, $s_{t},$
is influenced by the detection of new resources at a rate
$s_{t},$
is influenced by the detection of new resources at a rate $f\geq 0$
and the world’s exploitation of those resources. As noted earlier and as drawn from Greiner et al. (Reference Greiner, Semmler and Mette2012), we assume that the discovery rate depends on resources yet to be discovered. Our optimization problem considers
$f\geq 0$
and the world’s exploitation of those resources. As noted earlier and as drawn from Greiner et al. (Reference Greiner, Semmler and Mette2012), we assume that the discovery rate depends on resources yet to be discovered. Our optimization problem considers $e_{t}^{C}$
and
$e_{t}^{C}$
and $e_{t}^{R}$
as control variables, representing extraction activities driven by China and those of the ROW, while
$e_{t}^{R}$
as control variables, representing extraction activities driven by China and those of the ROW, while $s_{t}$
is the state variable representing the stock of discovered resources. Hence, the discovered reserves of REEs evolve as follows:
$s_{t}$
is the state variable representing the stock of discovered resources. Hence, the discovered reserves of REEs evolve as follows:
 \begin{equation}\dot{s_{t}}=f(s_{t})-e_{t}^{W}\ s_{0} = \overline{s}\ \ \text{for}\ \ t\in R_{0}^{+} \end{equation}
where $f'(s_{t})\lt 0$
, i.e., the effort in search of REEs and improvement of their utilization and the entire supply chain depends inversely on their availability. The second term,
$f'(s_{t})\lt 0$
, i.e., the effort in search of REEs and improvement of their utilization and the entire supply chain depends inversely on their availability. The second term, $e_{t}^{W}$
, is extraction due to the activities of the dominant Chinese position and those of the rest of the world, i.e.,
$e_{t}^{W}$
, is extraction due to the activities of the dominant Chinese position and those of the rest of the world, i.e., $e_{t}^{W}=e_{t}^{C}+e_{t}^{R}$
. The constant
$e_{t}^{W}=e_{t}^{C}+e_{t}^{R}$
. The constant $\overline{s}$
represents the initial level of known resources. We assume that increases in REEs are linear, i.e.,
$\overline{s}$
represents the initial level of known resources. We assume that increases in REEs are linear, i.e., $f(s_{t},s^{0})=\theta (s^{z}-s_{t})$
, where
$f(s_{t},s^{0})=\theta (s^{z}-s_{t})$
, where $s^{z}$
as the parameter of resources and
$s^{z}$
as the parameter of resources and $\theta$
are positive parameters. Equation (5) modifies Greiner et al. (Reference Greiner, Semmler and Mette2012) to account for relative scarcity.
$\theta$
are positive parameters. Equation (5) modifies Greiner et al. (Reference Greiner, Semmler and Mette2012) to account for relative scarcity.
China extracts $e_{t}^{C}$
at time
$e_{t}^{C}$
at time $t$
with constant marginal extraction costs
$t$
with constant marginal extraction costs $m^{C}$
, while ROW pursues its extraction
$m^{C}$
, while ROW pursues its extraction $e_{t}^{R}$
with marginal extraction costs
$e_{t}^{R}$
with marginal extraction costs $m^{R}$
. As in Groot et al. (Reference Groot, Withagen and De Zeeuw2003), we assume a linear demand function of the total supply (
$m^{R}$
. As in Groot et al. (Reference Groot, Withagen and De Zeeuw2003), we assume a linear demand function of the total supply ( $e_{t}^{w}$
):
$e_{t}^{w}$
):
 \begin{equation} p_{t}=\overline{p}-e_{t}^{w} \end{equation}
where $\overline{p}$
represents the choke price, i.e., a level above which demand for the resource (
$\overline{p}$
represents the choke price, i.e., a level above which demand for the resource ( $e_{t}^{W}$
) will be zero.Footnote
12
To ensure that China and the ROW have sufficient incentives to extract, we assume their marginal extraction costs are lower than the choke price.
$e_{t}^{W}$
) will be zero.Footnote
12
To ensure that China and the ROW have sufficient incentives to extract, we assume their marginal extraction costs are lower than the choke price.
Given the strategies of the other group, both players aim to maximize their discounted profits at each point in time $t=R_{0}^{+}$
, using the Nash MPC equilibrium.
$t=R_{0}^{+}$
, using the Nash MPC equilibrium.
The market leader (China) maximizes the following optimization problem in each instant of time $t$
:
$t$
:
 \begin{eqnarray}&& \mathop{\max}\limits_{e_{t}^{C}} \int_{t}^{t+T} e^{-rt} \left(\overline{p}-e_{t}^{w}-m^{C}\right) e_{t}^{C}dt\nonumber\\[10pt]&&\text{s.t.}\ \ \dot{s_{t}}=\theta (s^{z}-s_{t})-e_{t}^{w}, \quad e_{t}^{w}=e_{t}^{C}+e_{t}^{R} \end{eqnarray}
Here, $r$
is the discount rate. The length
$r$
is the discount rate. The length $T$
is the agent’s planning horizon.
$T$
is the agent’s planning horizon.
Similarly, in each instant of time $t$
, the follower seeks to maximize its profits; its optimization problem is formulated as follows:
$t$
, the follower seeks to maximize its profits; its optimization problem is formulated as follows:
 \begin{eqnarray}&& \mathop{\max}\limits_{e_{t}^{R}}\int _{t}^{t+T}e^{-rt}\left(\overline{p}\left(1+z_{R}\right)-e_{t}^{w}-m^{R}\right)e_{t}^{R}dt\nonumber\\[10pt]&& \text{s.t.}\ \ \dot{s_{t}}=\theta (s^{z}-s_{t})-e_{t}^{w}, \quad e_{t}^{w}=e_{t}^{C}+e_{t}^{R}\end{eqnarray}
where $z_{R}$
is a subsidy to support production in the rest of the world. Given China’s longstanding dominance in the market, with access to greater resources and infrastructure, we expect it to maintain its leadership role in the duopoly. However, China’s dominant position would lead the ROW to adopt policies to encourage new entrants into the duopoly market.Footnote
13
We eventually capture this scenario by assuming
$z_{R}$
is a subsidy to support production in the rest of the world. Given China’s longstanding dominance in the market, with access to greater resources and infrastructure, we expect it to maintain its leadership role in the duopoly. However, China’s dominant position would lead the ROW to adopt policies to encourage new entrants into the duopoly market.Footnote
13
We eventually capture this scenario by assuming $z_{R}\gt 0$
.
$z_{R}\gt 0$
.
The iterative solutions of problems (7) and (8) search for a fixed point at each time $t$
. The optimal strategies are mutually consistent in the game equilibrium, resulting in a sequence of solutions. In this model, at each moment in time
$t$
. The optimal strategies are mutually consistent in the game equilibrium, resulting in a sequence of solutions. In this model, at each moment in time $t$
, the solutions to the market dynamics solve China’s extraction path,
$t$
, the solutions to the market dynamics solve China’s extraction path, $e_{t}^{C}$
, and theROW’s extraction,
$e_{t}^{C}$
, and theROW’s extraction, $e_{t}^{R}$
, based on their optimal strategies.Footnote
14
$e_{t}^{R}$
, based on their optimal strategies.Footnote
14
5. The policy experiments
The dynamics we assess involve the gradual reduction of Chinese monopoly power in REE markets, within a duopoly in which the simultaneous interaction of leader and follower firms is crucial. We consider three scenarios or phases. In the first scenario, China maintains a highly dominant position, and a weak duopoly of the ROW can only be achieved with public support for other countries’ economies. Next, we examine the effects of technological advancements by other countries, which significantly reduce the gap while still maintaining a cost differential with China. Finally, we assume a REE market characterized by a duopoly, with no public support. In this scenario, however, we continue to assume a dominant position for China, albeit reduced, as the resource factor becomes less significant compared to the factors that characterize monopolistic power in this market.
To be concrete, our scenarios can be formally described as follows.
-
1. Non-competitive duopoly market. China is assumed to have a dominant position with low marginal costs compared to the ROW ( $m^{C}\lt m^{R}$
). Despite China allowing new suppliers, its strong market position makes it challenging for the ROW to gain higher market share. The ROW implements a support policy in the form of a production subsidy to enter the market (
$z_{R}\gt 0$
).
$m^{C}\lt m^{R}$
). Despite China allowing new suppliers, its strong market position makes it challenging for the ROW to gain higher market share. The ROW implements a support policy in the form of a production subsidy to enter the market (
$z_{R}\gt 0$
). -
2. Duopoly market with support. The marginal extraction cost of the ROW decreases due to technological advancements, thereby making the ROW more competitive. Compared to the previous scenario, we assume that
$m^{R}-m^{C}$
falls, but remains positive. We maintain the assumption that the ROW implements a support policy in the form of a subsidy (
$z_{R}\gt 0$
). -
3. Duopoly market without support. This scenario examines the impact of the absence of supporting policies on the REE market structure (
$z_{R}=0$
), keeping China’s dominant position (
$m^{R}-m^{C}\gt 0$
).


Overall, these scenarios provide insights into the dynamics of the REE market, the role of supportive policies, and the implications of policymakers’ myopia on resource extraction.
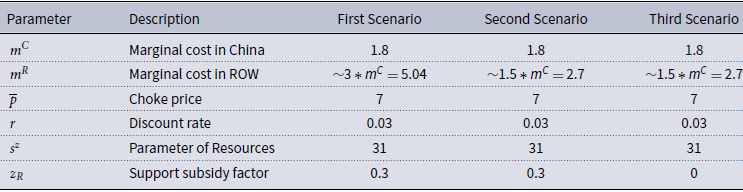
The solution necessitates numerical simulations conducted using the MPC routines described in Saltari et al. (Reference Saltari, Semmler and Di Bartolomeo2022). The calibration of the scenarios is as follows. For all scenarios, we normalize $m^{C}$
= 1.8,
$m^{C}$
= 1.8, $s^{z}$
=31,
$s^{z}$
=31, $\overline{p}$
= 7, and
$\overline{p}$
= 7, and $r$
= 0.03 as plausible values.Footnote
15
Conversely,
$r$
= 0.03 as plausible values.Footnote
15
Conversely, $m^{R}$
and
$m^{R}$
and $z_{R}$
vary depending on the scenario.Footnote
16
Expressly, in the primary scenario, we assume a high
$z_{R}$
vary depending on the scenario.Footnote
16
Expressly, in the primary scenario, we assume a high $m^{R}$
,i.e., around 3 times higher than the cost faced by the Chinese industry and a supporting subsidy of 30% of the choke price. In the scenario with lower marginal costs in the ROW, we set
$m^{R}$
,i.e., around 3 times higher than the cost faced by the Chinese industry and a supporting subsidy of 30% of the choke price. In the scenario with lower marginal costs in the ROW, we set $m^{R}$
, 1.5 times higher than China’s, and the same as the previous scenario
$m^{R}$
, 1.5 times higher than China’s, and the same as the previous scenario $z_{R}$
= 0.3. Finally, in the scenario without a supporting policy, we keep
$z_{R}$
= 0.3. Finally, in the scenario without a supporting policy, we keep $m^{R}$
the same as the second scenario, but we assume
$m^{R}$
the same as the second scenario, but we assume $z_{R}$
= 0. For a complete list of the parameters and values used in the numerical simulations, see the Appendix.
$z_{R}$
= 0. For a complete list of the parameters and values used in the numerical simulations, see the Appendix.
In all scenarios, we consider that policymakers operate under limited information or constrained information-processing capacity, leading to imprecise responses.Footnote
17
This limitation is addressed by adopting the MPC approach, acknowledging that policymakers’ decision-making processes, the decision horizon, do not involve maximizing over the complete planning horizon. Instead, we incorporate varying forecasting horizons, with each value representing a different degree of policymakers’ myopia. By adopting this approach, we effectively capture and analyze the impact of myopic decision-making on policy outcomes.Footnote
18
Regarding the decision horizon $T,$
which measures varying levels of myopia, we explore three decision horizons (
$T,$
which measures varying levels of myopia, we explore three decision horizons ( $T$
): 3, 5, and 7, corresponding to high (3), medium (5), and low (7) levels of policymakers’ myopia, respectively. It should be noted that while these scenarios assume fixed policies, in practice, governments may adjust them dynamically in response to evolving market conditions. Future research could explore adaptive policy changes that better reflect real-world conditions.
$T$
): 3, 5, and 7, corresponding to high (3), medium (5), and low (7) levels of policymakers’ myopia, respectively. It should be noted that while these scenarios assume fixed policies, in practice, governments may adjust them dynamically in response to evolving market conditions. Future research could explore adaptive policy changes that better reflect real-world conditions.
6. Results
As outlined, our numerical study explores three distinct scenarios. The first scenario represents a non-competitive duopoly market in which China is assumed to hold a dominant position, characterized by lower marginal costs. In the second scenario, we investigate the consequences of reduced marginal costs for the ROW. Lastly, we evaluate the impact of eliminating the supporting policies in the third scenario. The figures on the stock of reserves discovered reflect depletion rates over time, with labels indicating differences in depletion rates across scenarios, highlighting the impact of policy interventions on the longevity of reserves. The figures on extraction rates show China’s and the ROW’s extraction patterns, clarifying how policymakers’ decision horizons influence extraction strategies. Lastly, the profitability figures illustrate the financial impact of different extraction strategies, revealing variations in profitability across scenarios.
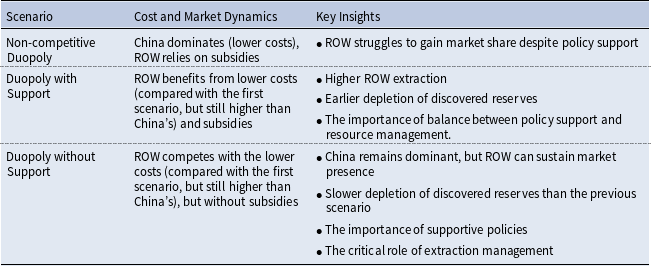
6.1 Non-competitive duopoly market
As outlined, our study explores three distinct scenarios. The first scenario represents a non-competitive duopoly market in which China is assumed to hold a dominant position and has lower marginal costs. We assume the existence of a support public policy, which takes the form of a subsidy to the ROW and is implemented through a higher choke price. Figures 1, 2, and 3 present the findings, focusing on the impact of varying levels of policymakers’ myopia.

Figure 1. Stock of discovered reserves in a non-competitive duopoly market scenario. The solid, dashed, and dash-dotted lines represent high, medium, and low levels of policymakers’ myopia, respectively.

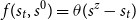
Figure 2. China’s extraction of discovered reserves in a non-competitive duopoly market. Line styles indicate levels of myopia: solid for high, dashed for medium, and dash-dotted for low.

Figure 3. ROW’s extraction of discovered reserves in a non-competitive duopoly market. Line styles indicate levels of myopia: solid for high, dashed for medium, and dash-dotted for low.
Figure 1 illustrates the stock of discovered reserves, revealing distinct patterns based on policymakers’ myopia levels. Policymakers with longer decision horizons (i.e., lower levels of myopia) display a more aggressive utilization of the discovered reserves. In contrast, those with shorter decision horizons exhibit a more conservative approach to utilization and consequently hold a higher level of stock at each instant.
Figures 2 and 3 illustrate the extraction rates of the discovered reserves by China and the ROW, respectively. Our results indicate that policymakers with shorter decision horizons (i.e., greater myopia) are more inclined to maintain the current extraction level in China over the long term. In contrast, they anticipate that the ROW will initiate its REE extraction at a lower level, which is subsequently expected to increase from period 5 onwards.Footnote 19 Conversely, policymakers with longer decision horizons (i.e., less myopic) predict that the ROW will begin with a high extraction rate, gradually decreasing as the stock of discovered reserves declines. As the stock approaches exhaustion, both China and the ROW reduce their extraction rates. Notably, in Figure 3, in that scenario, high myopia results in significantly lower initial extraction by the ROW, leading to a relatively higher remaining stock of resources compared to other scenarios in which both players extract aggressively.
Figure 4 illustrates the profit trends for both China and the ROW in this scenario. The profit figures in the following scenarios reveal discernible patterns in the projected profits for China and the ROW. These patterns are denoted by solid, dashed, and dash-dotted lines, representing high, medium, and low levels of policymakers’ myopia, respectively.

Figure 4. Profit trajectories for China and the ROW under a non-competitive duopoly market scenario. The figure highlights the effect of different levels of policymakers’ myopia on profitability.
A closer examination of the profit trends depicted further validates the viability of maintaining the ROW’s market presence. In Figure 4, it is evident that, because the marginal cost of the ROW is high, lower extraction results in higher profits due to lower expenses. This dynamic suggests that strategic reductions in extraction can enhance profitability for the ROW, despite their inherently higher marginal costs.
In the non-competitive duopoly market scenario, where China holds a dominant position due to lower marginal costs, while the ROW benefits from public policy support, our simulations highlight that policymakers with shorter decision horizons tend to maintain steady extraction levels for China but anticipate a gradual increase in the ROW’s extraction. In contrast, those with longer horizons expect the ROW to start with higher extraction, which decreases over time due to resource depletion. Profits for the ROW, as shown in Figure 4, increase with strategic reductions in extraction, suggesting that despite higher marginal costs, the ROW can remain profitable by managing its extraction levels more cautiously.
6.2 Duopoly market with policy support
This section examines the implications of reduced marginal costs for the ROW, while China maintains its dominant position. Precisely, we assess a scenario in which the marginal extraction cost for ROW decreases from its previous level to 1.5 times China’s. This reduction in marginal costs can be attributed to factors such as long-standing companies benefiting from market experience or technological advancements that enable new competitors to operate more efficiently.Footnote
20
To simulate this scenario, we adjust ROW’s marginal cost ( $m^{R}$
) to a new level, 1.5 times higher than China’s. Moreover, we assume that the ROW continues to benefit from supportive policies, including subsidies and favorable regulations. These changes reflect how policy support can make ROW extraction activities more economically feasible, despite higher costs than in China.
$m^{R}$
) to a new level, 1.5 times higher than China’s. Moreover, we assume that the ROW continues to benefit from supportive policies, including subsidies and favorable regulations. These changes reflect how policy support can make ROW extraction activities more economically feasible, despite higher costs than in China.
Figure 5 illustrates the depletion of discovered reserves over time for China and the ROW across three levels of policymaker myopia (high, medium, and low). Compared to the previous scenario, in a duopoly market with policy support, myopia seems to exacerbate the depletion of reserves, highlighting a potential risk of over-extraction, especially when immediate economic incentives are prioritized over long-term sustainability. Figure 5 illustrates the depletion of discovered reserves over time for China and the ROW across three levels of policymaker myopia (high, medium, and low).

Figure 5. Stock of discovered reserves in a duopoly market with policy support. Solid, dashed, and dash-dotted lines correspond to high, medium, and low myopia, respectively.
Policymakers with shorter decision horizons (more myopic) tend to deplete reserves at a much faster rate, as seen by the steeper decline in the solid line representing high myopia. This rapid depletion is driven by expectations that both China and ROW will continue their high extraction rates over the coming periods. In contrast, policymakers with longer decision horizons (less myopic) extract reserves more gradually, leading to a more measured rate of depletion, as illustrated by the medium- and low-myopia curves. Notably, supportive policies accelerate extraction activities in both China and the ROW, particularly for policymakers who prioritize immediate benefits and see value in using more reserves more quickly.
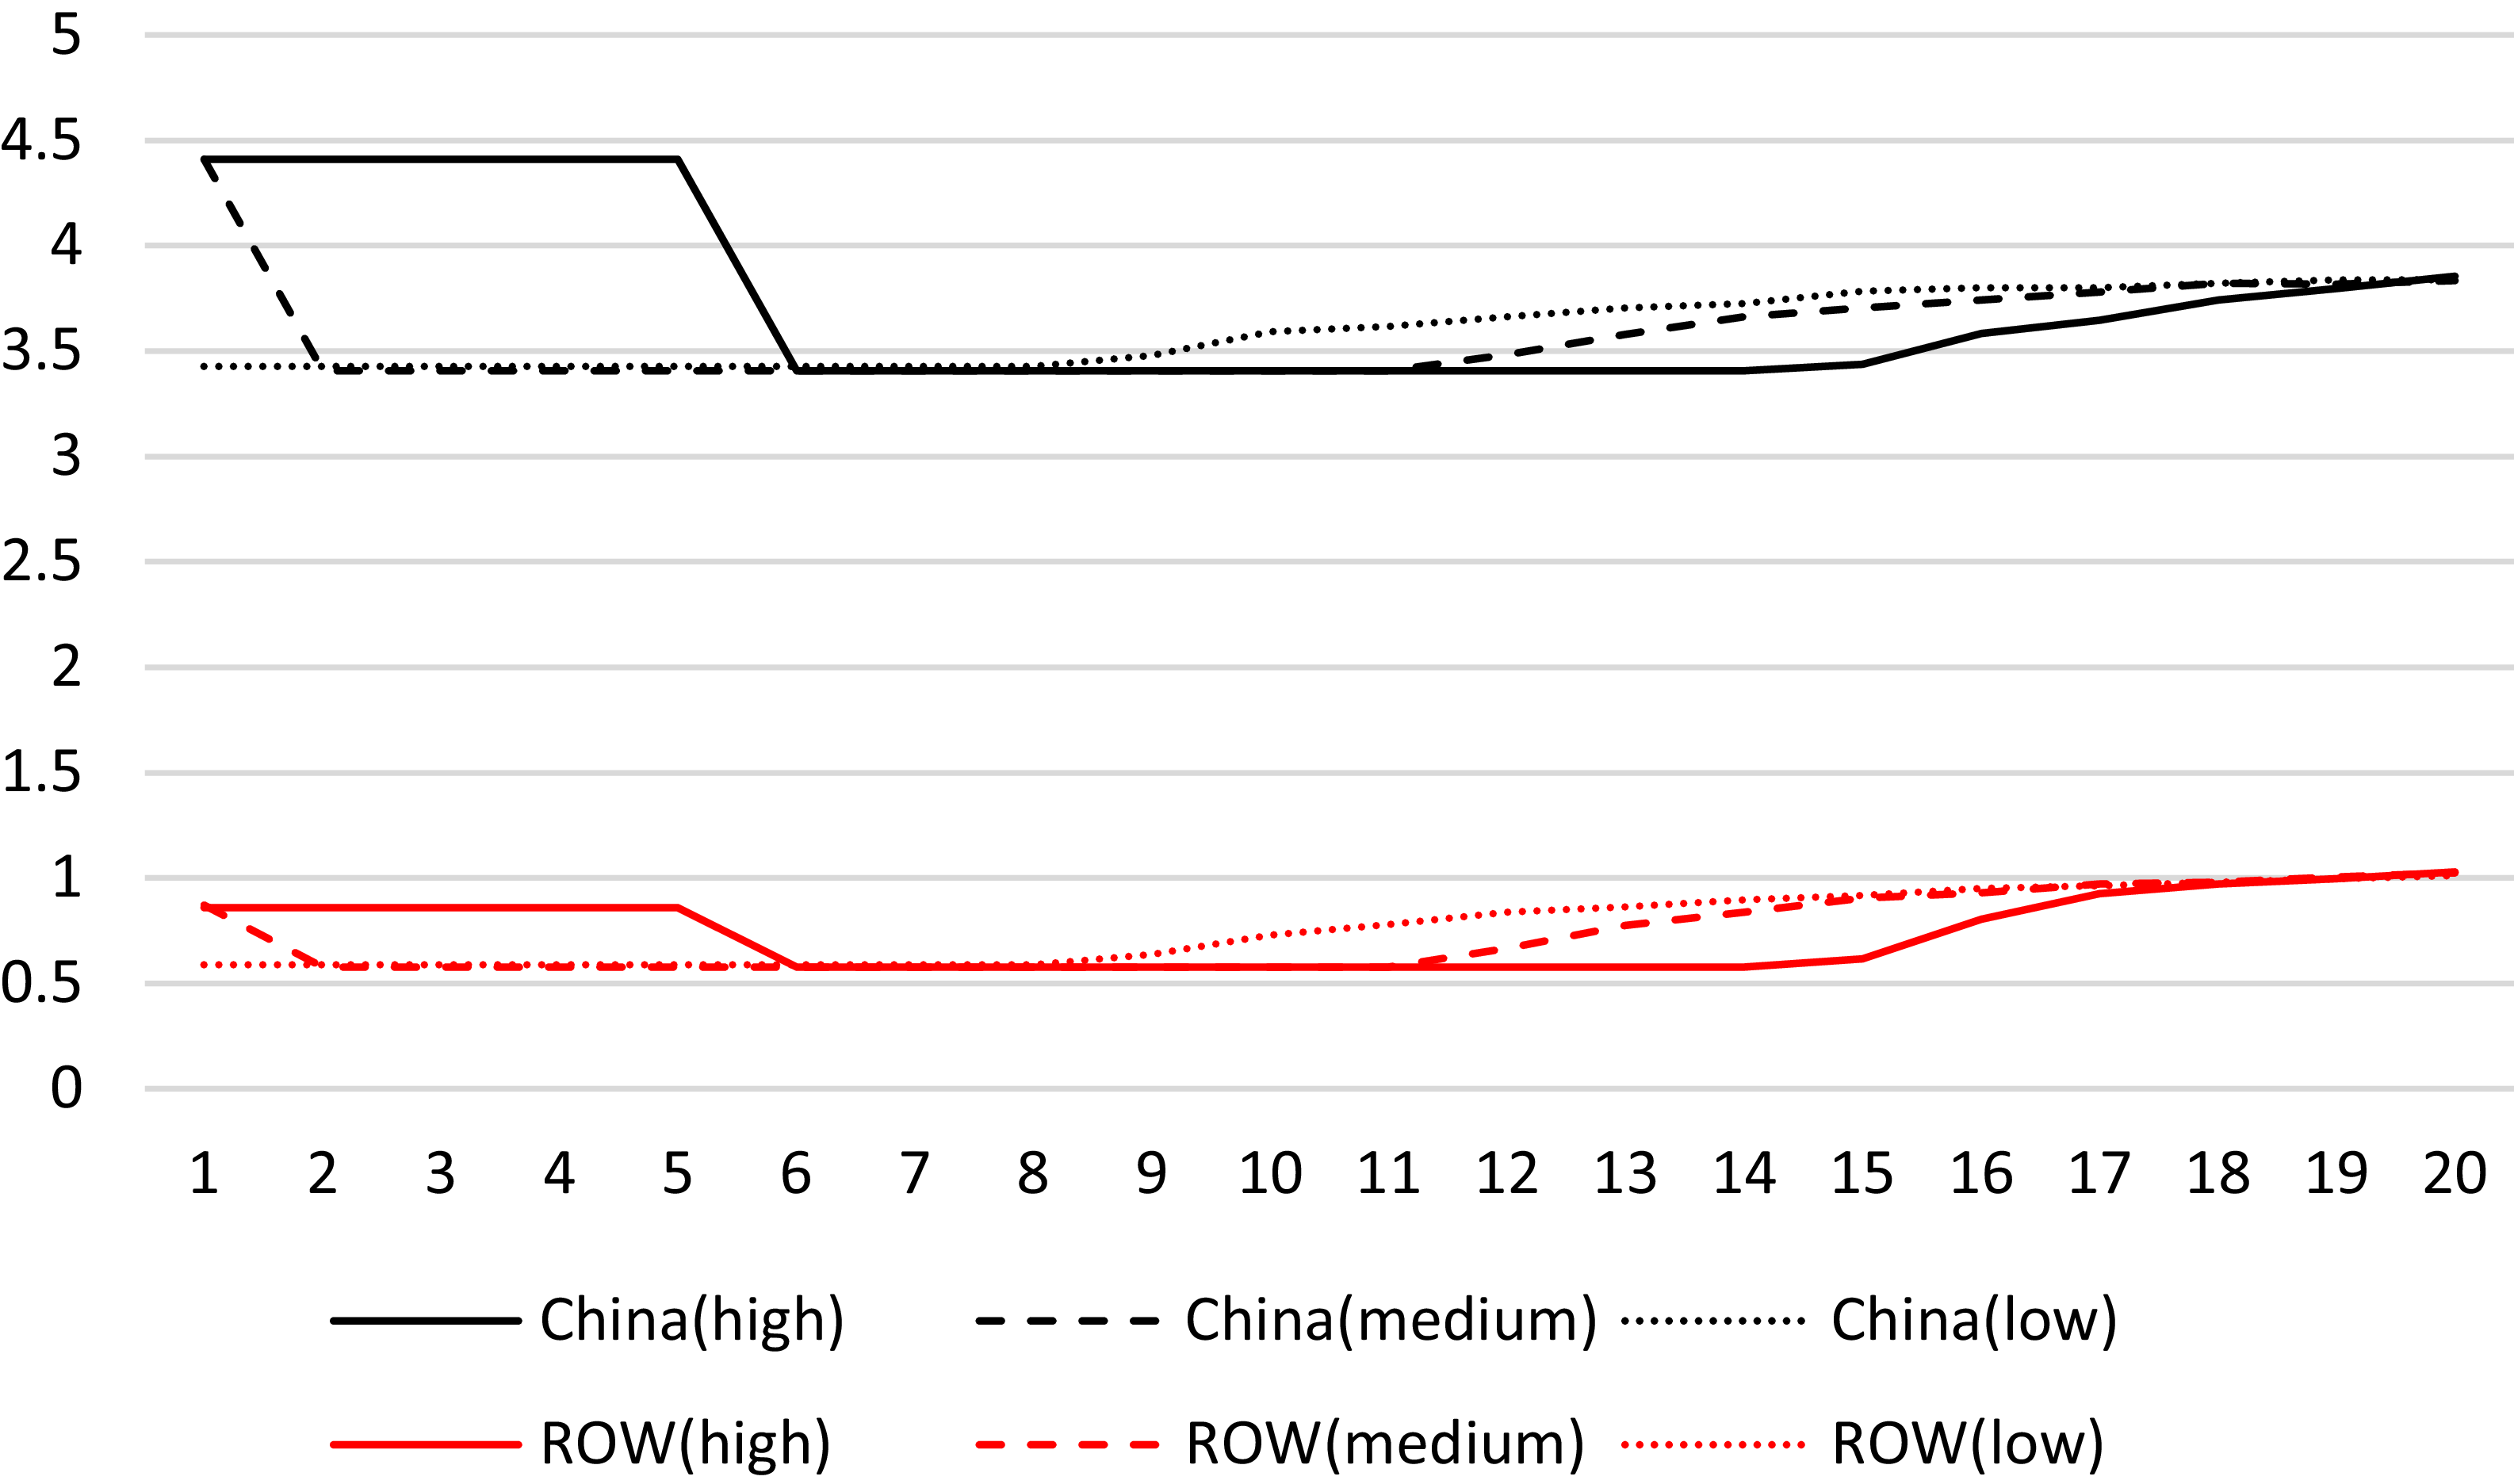
Figure 6 shows China’s extraction rate from discovered reserves across different levels of policymaker myopia. The solid line representing high myopia reflects China’s tendency to maintain higher extraction levels initially, but the rate decreases sharply around period 3. This suggests that policymakers anticipate a finite reserve limit, prompting them to reduce extraction rates earlier than anticipated. Interestingly, even with lower extraction costs for ROW, China maintains relatively higher extraction levels for a significant period, underscoring its competitive advantage and market dominance. Policymakers with longer decision horizons exhibit lower extraction rates, as shown by the dashed and dash-dot lines for medium and low myopia, respectively. The supportive policies encourage China to maintain higher extraction rates despite a gradual depletion of its reserves.

Figure 6. China’s extraction rate of discovered reserves in a duopoly market with policy support. Line styles represent high (solid), medium (dashed), and low (dash-dotted) levels of policymakers’ myopia.
In contrast, Figure 7 illustrates ROW’s extraction behavior, which follows a similar trend but with more aggressive extraction levels compared to China. ROW, benefiting from policy support and a reduction in marginal costs, extracts more reserves early on, particularly in the high myopia case, as shown by the solid line. The dashed and dash-dot lines for medium and low myopia show that policymakers with longer horizons expect ROW’s extraction to taper off gradually. The presence of supportive policies plays a crucial role here: despite ROW’s higher marginal costs than China’s, these policies make ROW’s extraction more economically viable, leading to relatively sustained extraction levels, especially in the early periods.

Figure 7. ROW’s extraction rate of discovered reserves in a duopoly market with policy support. Line styles represent high (solid), medium (dashed), and low (dash-dotted) levels of policymakers’ myopia.
Figure 8 presents the profit trends for both China and the ROW, assuming the ROW’s lower marginal cost and the presence of supporting policies. Initially, the reduction in ROW’s marginal cost leads to increased extraction by both China and ROW, resulting in a market oversupply. This oversupply drives down profits for both players, as supply outstrips demand. However, as extraction rates decline in subsequent periods, market equilibrium is restored, and profits stabilize. ROW’s profits rise at a faster pace compared to China, as the supportive policies help to offset its higher extraction costs. Eventually, ROW’s profits surpassed China’s, reflecting its growing market share in this policy-supported environment.

Figure 8. Profit trajectories for China and the ROW in a duopoly market with policy support. The figure shows the evolving profitability under varying levels of policymakers’ myopia.
To summarize, in this scenario, the combination of reduced marginal costs and policy support significantly boosts the ROW’s extraction levels and market presence. However, this aggressive extraction leads to earlier depletion of discovered reserves, particularly for policymakers with shorter decision horizons. Myopic policymakers tend to prioritize immediate economic gains, thereby accelerating resource depletion, while those with longer horizons manage reserves more sustainably. The findings highlight the balance between policy support and resource management. While supportive policies can enhance ROW’s market competitiveness, they also risk encouraging overextraction, mainly when policymakers focus on short-term gains. For long-term resource sustainability, it is crucial to design policies that not only reduce marginal costs but also incentivize responsible extraction practices, given the finite nature of REEs and the challenges of resource scarcity.
6.3 No supporting policy
In the final scenario, we examine the impact of supporting policies on the market structure. To simulate the removal of the mentioned supporting policies (i.e., $z_{R}$
= 0), we maintain the assumption of the lower marginal cost of the ROW. However, as in the previous scenario, China maintains its dominant position and enjoys a lower marginal cost than the ROW, with the ROW’s marginal extraction cost 1.5 times higher than China’s.
$z_{R}$
= 0), we maintain the assumption of the lower marginal cost of the ROW. However, as in the previous scenario, China maintains its dominant position and enjoys a lower marginal cost than the ROW, with the ROW’s marginal extraction cost 1.5 times higher than China’s.
As shown in Figure 9, policymakers with shorter decision horizons (i.e., higher myopia) tend to deplete a larger share of the discovered reserves early on. This tendency stems from their focus on immediate gains, without fully accounting for the long-term implications of resource exhaustion.

Figure 9. Stock of discovered reserves in a duopoly market without policy support. Solid, dashed, and dash-dotted lines denote high, medium, and low myopia, respectively.
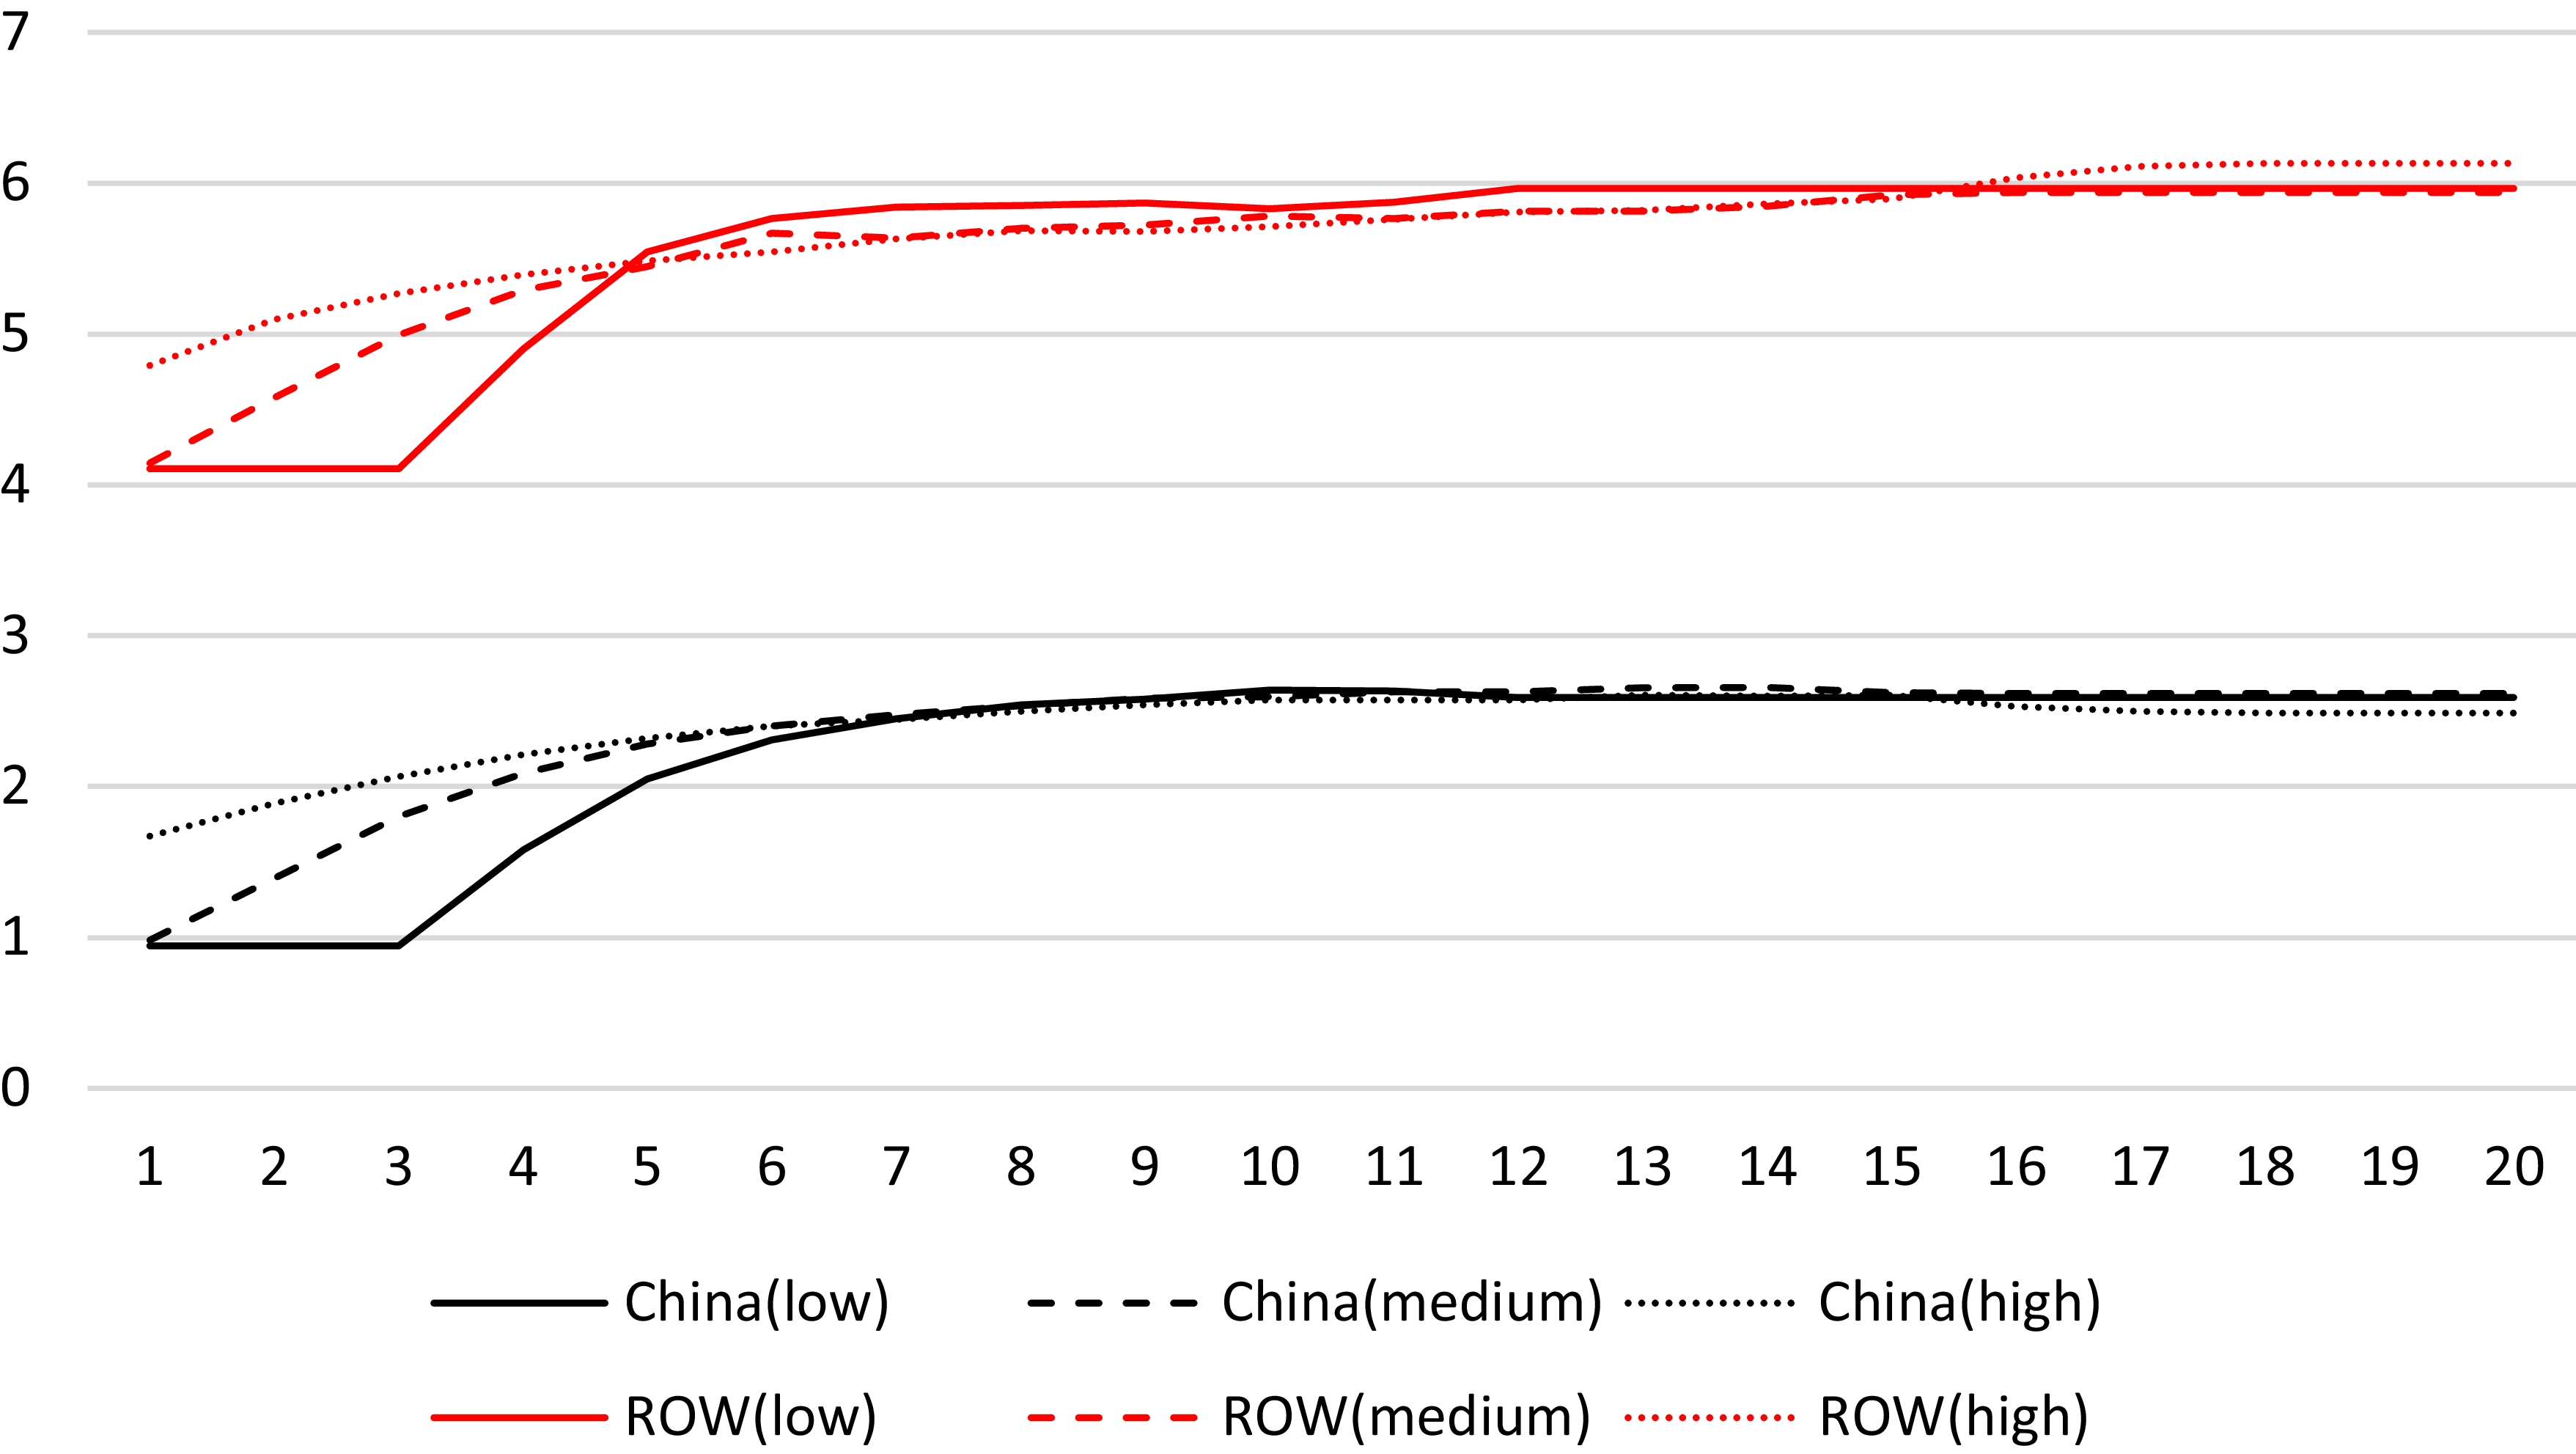
Figures 10 and 11 further illustrate that China’s extraction rate consistently remains higher than that of the ROW throughout the simulation period. The difference in decision horizons among policymakers also influences the timing of extraction reductions for both China and the ROW. Those with shorter decision horizons (high myopia) maintain higher extraction rates for a more extended period, only beginning to reduce when reserves approach critical levels. Conversely, policymakers with longer decision horizons, who are less myopic, initiate reductions in extraction rates earlier, anticipating future resource scarcity. This divergence in extraction strategies highlights the role of decision-making horizons in shaping the sustainability of resource use and the long-term market dynamics between China and the ROW.

Figure 10. China’s extraction of discovered reserves in a duopoly market without policy support. Line styles reflect levels of myopia: solid (high), dashed (medium), and dash-dotted (low).

Figure 11. ROW’s extraction of discovered reserves in a duopoly market without policy support. Line styles reflect levels of myopia: solid (high), dashed (medium), and dash-dotted (low).
The absence of supporting policies negates the dominance of extraction by the ROW. However, this significant reduction in the marginal cost of the ROW increases the ROW’s extraction rate relative to the first scenario, under the assumption of different policymakers’ myopia.
The results indicated that support policies could significantly improve ROW’s market share in the duopoly market. However, without such support, a mere reduction in ROW’s marginal costs would not significantly impact ROW’s market share.
Figure 12 shows that reductions in extraction rates for both China and ROW increase profitability for both parties. This outcome occurs because lower extraction levels help to stabilize the market by better aligning supply with demand, preventing oversupply and the associated price drops. The figure highlights the critical role of strategic extraction management in optimizing profits, as controlled extraction ensures that production is more closely attuned to market demand, ultimately enhancing the economic efficiency of both China and the ROW in the absence of supporting policies.

Figure 12. Profit trajectories for China and the ROW in a duopoly market without policy support. The figure illustrates how profit dynamics evolve in the absence of subsidies.
In the scenario without supporting policies, China retains its dominant position because its marginal extraction costs are lower than the ROW’s, which are 1.5 times higher. The removal of these policies reveals that policymakers with shorter decision horizons still deplete discovered reserves more rapidly. Although ROW benefits from lower marginal costs, its extraction rate remains lower than China’s. The absence of supporting policies limits the ROW’s ability to compete effectively, underscoring the importance of such policies in improving the ROW’s market share. Both China and ROW achieve higher profits with reduced extraction rates, as strategically balancing supply and demand boosts profitability.
The profit ratios observed in Figures 4, 8, and 12 reflect the interplay between policy support, extraction strategies, and market competition dynamics in the duopoly scenarios. In the first scenario, policymakers with shorter horizons gradually increase ROW’s extraction, while those with longer horizons start with higher extraction levels that decline over time due to resource depletion. Despite these variations, the ROW remains profitable, even with higher costs, resulting in a long-term profit ratio of 4, with China earning four times more. In the second scenario, policy support and lower marginal cost enable higher ROW extraction, strengthening its market presence but also accelerating resource depletion. While this aggressive approach increases short-term profitability, it leads to a lower profit ratio of approximately 2.4 (China’s profit ratio stands at 6, and the ROW’s at 2.5). Finally, in the third scenario, China retains its dominance due to lower marginal costs. The profit ratio stabilizes around 2.4, with China’s profit at 3.7 and the ROW’s at 1.5. This demonstrates that, despite still having relatively high costs, albeit lower than in the first scenario, the ROW can sustain profitability by optimizing its extraction strategy.
To summarize the key findings from the results section, Table 1 presents an overview of the main outcomes under each scenario. This table offers a concise comparison of how different policy scenarios influence the dynamics of the REE market.
Table 1. Summary of key outcomes across different policy scenarios

7. Conclusions
This study employs game theory and insights from the literature on natural resource monopolies to analyze the anticipated transition of the Chinese monopoly in the REEs market towards a duopoly. The study examines the potential duopoly market between China and the ROW, with particular emphasis on China’s dominant position, driven by its low marginal costs.
By applying a duopoly game model to a duopoly scenario, the market shares of China and the ROW are evaluated, accounting for extraction dynamics and resource stocks. This study aims to enhance our understanding of the REE markets by examining strategic interactions, considering the dynamics of known reserves, and investigating the impacts of technological advancements and policy support. The investigation employs a formal setup in which the policy decisions of two players are modeled and solved using a moving-horizon strategy that leverages the Nash equilibrium concept in the MPC methodology.
In our context, a Nash equilibrium is a state in which the players’ control decisions converge to stationary values. Another definition, perhaps even more appropriate, is that the profit margins converge to some constants. Our analysis supports this notion, as evidenced by the profit ratios observed across different scenarios. The consistency of these values suggests a tendency toward equilibrium in market competition. In either case, by conducting a thorough analysis, we sought to gain insights into the feasibility and implications of a duopoly scenario in the REE markets. This examination of the market structure enabled us to explore the potential impacts of competition and the distribution of market power among dominant players on REE extraction.
To achieve this, we analyzed the market structure under different assumptions and decision horizons. The analysis found that in a duopoly market structure, China maintained its dominant position as long as its marginal extraction cost remained lower than that of the rest of the world. The scenario of declining marginal extraction costs for the ROW due to technological improvements led to an increase in the ROW’s market share; however, the decline in the stock of discovered resources limited this growth.
Our results suggest that the ROW can maintain its presence in the REE market and even increase its extractions. However, its marginal cost remains higher than China’s, making it unlikely for the ROW to achieve China’s dominant position. A lower marginal cost would enhance the ROW’s market share; however, achieving a dominant position in the market depends on supportive policies. Therefore, given that such supportive policies cannot be sustained indefinitely, any transition towards a duopoly should be approached with caution, particularly from the perspective of the ROW.
The outcomes of our scenarios highlight the pivotal role of policy support in shaping the dynamics of the REE markets and the fate of the resources. In the initial scenario, China’s dominance is reinforced by its lower marginal extraction costs, while the ROW benefits from supportive policies, allowing it to maintain a competitive market presence. Policymakers with longer decision horizons (lower myopia) tend to deplete reserves more quickly; however, policy interventions enable ROW to remain a relevant player in the market. When ROW’s marginal extraction costs are reduced but some policy support remains, its market share improves. Supportive policies play a crucial role in mitigating the impact of extraction costs and enabling ROW to compete more effectively, particularly under varying levels of policymakers’ myopia. However, when all supporting policies are removed, the ROW’s ability to maintain competitive extraction levels diminishes significantly, even with reduced marginal costs.
Methodologically, our study highlights the effectiveness of using game theory to model the dynamics of resource extraction and resource depletion in competitive markets, particularly in the context of potential duopolies, such as the REE market. By incorporating MPC solution techniques, we can dynamically optimize decision-making processes over time, accounting for both immediate and future impacts of resource extraction strategies. This approach provides valuable insights into how various market actors adjust their behavior in response to changing market conditions, rising extraction costs, and policy interventions. Additionally, integrating reinforcement learning into the MPC framework enhances the model’s adaptability, enabling it to evolve in real time as new information becomes available or key parameters, such as marginal costs or policy incentives, change. This combination of game theory, MPC, and reinforcement learning offers a robust, flexible methodological approach that can simulate the complex interplay among market competition, resource depletion, and policy impacts, providing a comprehensive tool for both theoretical analysis and practical policymaking in resource management.
Overall, the results highlight the importance of considering the long-term implications of market transformation. It is also essential to consider whether such a duopoly will contribute to stability in the uncertain REE markets and prevent vulnerable situations and crises arising from unpredictable supply fluctuations. The findings of this study underscore the importance of integrating environmental and geopolitical considerations into policy design, particularly in the REE market. As observed, different scenarios may result in increased extraction activities, which could lead to significant environmental challenges, including habitat destruction, water contamination, and elevated carbon emissions, particularly in countries with weaker environmental regulations. Hence, policymakers should prioritize the development of environmentally sustainable mining practices, such as incentivizing the adoption of cleaner extraction technologies and improving resource processing efficiency. Moreover, investing in REE recycling technologies could reduce the demand for new mining operations and minimize environmental damage.
Geopolitically, while diversifying the REE supply chain away from China offers significant strategic benefits, it could also create new tensions and competitive pressures, leading to different market dynamics. Policymakers must take a proactive approach to mitigate potential risks by promoting multilateral agreements that ensure fair and equitable access to these resources, thus avoiding conflicts or market distortions. At the same time, policymakers should consider how global efforts to secure critical minerals, such as the European Union’s Raw Materials Initiative and U.S. government strategies to reduce reliance on foreign sources, can align with sustainable development goals. Supporting policies that strengthen international cooperation, encourage diversification, and invest in alternative materials and recycling technologies will be crucial to building a resilient and secure REE sustainable supply chain in the long term.
Future research could extend this analysis by moving beyond the two-player setup to incorporate multiple competing countries or regions with varying interests and resource endowments, offering a more realistic view of global REE dynamics. Incorporating environmental externalities and modeling the trade-offs between extraction and ecological costs would also enrich the framework. Furthermore, accounting for reserve discovery or learning-by-doing could better capture the dynamics of costs over time. Advancements in the reinforcement learning–MPC approach may also support more adaptive policy responses under increasing uncertainty, ultimately improving the model’s relevance for strategic and sustainable resource management.
Acknowledgements
A related paper was presented at the 8th International Workshop on FMND on May 30–31, 2024, in Paris. We want to thank the commentators and the audience for their helpful suggestions, as well as the editors and two anonymous referees for their constructive feedback.
Funding statement
There is no funding involved.
Competing interests
The authors declare none.
Appendix
Table A summarizes the fixed parameters and scenario-specific values employed in the simulations. These parameters are calibrated based on plausible economic assumptions and the outlined methodology
Table A. Parameter calibration across scenarios


 Open access