


Introduction
Across Europe and other advanced industrialised economies, longer life expectancies and lower fertility rates have created a population pyramid with an ever‐greater proportion of individuals of retirement age while fewer working‐age individuals pay taxes to support welfare spending (Bogetic et al., Reference Bogetic, Onder, Onal, Skrok, Schwartz and Winkler2015; Harper, Reference Harper2014). One of the most salient consequences of this dramatic demographic shift is its impact on fiscal policy (Pench, Reference Pench2020). The combination of growing fiscal demands from those receiving pensions and a shrinking number of productive workers – a rising dependency ratio – creates an enormous fiscal challenge. As retiring workers are replaced at a slower rate by new births or immigration, fewer and fewer prime‐age workers will be financing pay‐as‐you‐go pensions and social programmes. Economists predict that the underlying trend creating this financial challenge has and will continue to contribute to even higher government debt burdens and eventually force countries to make difficult choices over fiscal priorities (Yared, Reference Yared2019).
In addition to the unprecedented fiscal challenge, ageing populations present a political problem. Debt‐financed fiscal policy allows the inter‐temporal transfer of wealth from future to current generations. As such, it raises the prospect for inter‐generational conflict if the ageing process affects preferences for the composition of government fiscal policy and repayment of existing liabilities. Political economy models of fiscal deficits and growing debt burdens have long identified the risk of such conflict and often attribute growing debt burdens to these demographic shifts (e.g. Cukierman & Meltzer, Reference Cukierman and Meltzer1989; Tabellini, Reference Tabellini1991). In particular, scholars have argued that because ageing individuals will not bear the future costs of debt‐financed spending, they have a strong incentive to delay tax increases and spending cuts in old age. The implication is that, as societies age, governments will not have the political support to maintain healthy fiscal balances or reign in high debt burdens. Voter preferences play a key role in driving fiscal policy (Soroka & Wlezien, Reference Soroka and Wlezien2005). The elderly are becoming a larger proportion of the voters, and especially given that they tend to vote at higher rates than the young (Goerres & Tepe, Reference Goerres and Tepe2010), older generations are well‐positioned to dictate fiscal priorities (Munger, Reference Munger2022).
An ageing, active voter population lends urgency to testing the inter‐generational conflict assumption at the heart of prominent political economy models of debt (Cukierman & Meltzer, Reference Cukierman and Meltzer1989; Song et al., Reference Song, Storesletten and Zilibotti2012; Tabellini, Reference Tabellini1991; Yared, Reference Yared2019) that are often used to advocate for controversial policies like fiscal rules that can limit public investment (Acemoglu & Yared, Reference Acemoglu and Yared2010; Andersen, Reference Andersen2019). While inter‐generational conflict over debt is a widely used assumption in the debt literature, the assumption has not been widely tested. Furthermore, scepticism of a generational divide over fiscal policies is warranted as expectations of inter‐generational conflict over spending priorities are not borne out in the data. Differences in preferences for types of spending by different age groups (e.g., education and healthcare) are apparent. However, these differences are relatively small (Sørensen, Reference Sørensen2013) and do not reflect broader differences in support for political parties (Goerres, Reference Goerres2009). In fact, much of the existing research has found that generational issues are more pronounced with regard to social rather than economic issues (O'Grady, Reference O'Grady2020). This is consistent with existing research which emphasises that political attitudes are relatively stable over adulthood (Hatemi et al., Reference Hatemi, Funk, Medland, Maes, Silberg, Martin and Eaves2009; Prior, Reference Prior2010).
We aim to systematically test the relationship between age and political preferences over public debt but also theorise further about the relationship. Existing models often assume two generations – for the sake of tractability – that imply a linear relationship between age and support for debt reduction. We build on this by incorporating insights about economic incentives drawn from expectations of life‐cycle consumption smoothing (Modigliani & Brumberg, Reference Modigliani and Brumberg1954). We posit that age should have a non‐linear impact on preferences for government debt policy. Younger workers are more likely to experience atypical employment and exposure to labour market risks. Therefore, they should prefer more government spending for insurance reasons and oppose higher taxes, postponing consolidation to the future, when they expect higher wage growth. Next, as individuals begin to rely on pensions and social spending, they should prefer to delay debt consolidation until the burden falls disproportionately on the next generation. Those between these two groups should show the most concern over government debt. These middle‐aged citizens are less likely to be affected by forms of non‐standard employment, enjoying higher job security and higher wages, as well as better working conditions than younger workers (Emmenegger et al., Reference Emmenegger, Häusermann, Palier and Kaiser2012).
We draw on 20 waves of the Eurobarometer survey, administered twice per year between 2010 and 2019, to test the relationship between age and debt. Our aggregate findings are largely consistent with our life‐cycle hypothesis. Support for debt reduction is low among the young, increases through middle age and then begins to decrease as respondents age. Yet, the effect is modest and the relationship does not hold in all contexts as there is non‐trivial heterogeneity across countries and time. Further analysis reveals that the relationship appears strongest in countries that have the most generous public spending schemes. Lastly, we offer an important caveat. The length of our panel limits our ability to definitively disentangle the effects of age and cohort (Yang & Land, Reference Yang and Land2013). While we take several steps to address confounding by cohort effects, we statistically cannot rule out that the effect of age is a product of the attitudes of the current cohort of elderly Europeans and may not reflect the attitudes of the next generation as they age.
These results have important implications for economics and political science research on public debt. Voter preferences often serve as a foundational assumption of political economy models. However, untested assumptions make model validation and comparison difficult. This is especially problematic when the testing of model predictions is only possible with observational country‐year level data. Our results lend some support to models that depend on assumptions of inter‐generational conflict. However, our results suggest that theoretical models should be adapted to consider a non‐linear relationship between age and support for public debt reduction.
Our findings also speak more directly to the growing literature on the mass politics of public debt. Much of this work focuses on post‐crisis politics, with minimal focus on the events that cause those crises (Curtis et al., Reference Curtis, Jupille and Leblang2014; Nelson & Steinberg, Reference Nelson and Steinberg2018). As a result, the existing research on the accumulation of public debt and other pre‐crisis events is much more limited, leaving many unanswered questions about the conditions under which crises emerge. While others have shown that party politics and proposal characteristics play important roles in shaping non‐crisis debt preferences (Barnes & Hicks, Reference Barnes and Hicks2018; Bansak et al., Reference Bansak, Bechtel and Margalit2021; Bremer & Bürgisser, Reference Bremer and Bürgisser2021; Hübscher et al., Reference Hübscher, Sattler and Wagner2021), we demonstrate that structural factors are also important.
Lastly, our research engages with the growing literature on the consequences of a greying society and inter‐generational political conflict and seeks to provide a corrective to the parts of the literature that emphasise how inter‐generational conflicts in Europe escalate because of ageing populations (Sinn & Uebelmesser, Reference Sinn and Uebelmesser2003).
Ageing societies and public debt
The ‘greying’ of society is likely to impact the management of government debt in two ways. The first is through the composition of public spending and revenue, with less government revenue coming from workers and increased expenditure on social programmes designed to support the elderly, with important consequences for the fiscal positions of governments. Several factors contribute to the effect of ageing on fiscal stability: the tax base shrinks as workers retire, older citizens consume less than prime‐age workers and the cost of government health services for elderly patients increases (Yoshino et al., Reference Yoshino, Kim and Sirivunnabood2019). Moreover, given longer life expectancy, pension schemes must provide benefits for much longer than policymakers had originally anticipated (and budgeted for) (Sinn & Uebelmesser, Reference Sinn and Uebelmesser2003). An ageing society is also likely to lead to lower economic growth as there are fewer producers, consumers and innovators in the workforce (Lee, Reference Lee2016). While government spending driven by the demands of the elderly may offset some of this decline, the fiscal multiplier for spending on old‐age‐related programmes will likely be lower than the same amount of spending targeted towards younger voters (Basso & Rachedi, Reference Basso and Rachedi2018). This lower growth will make it harder for governments to roll over and repay existing debts (Fuest & Gros, Reference Fuest and Gros2019). Given the fiscal consequences of ageing populations, it is not surprising that there is a strong correlation between population age and government debt (Yared, Reference Yared2019).
The second way that ageing can impact public debt is via a shift in political preferences towards the interests of elderly voters. Several scholars, mainly within economics, have developed models to explain how the intertemporal nature of debt will influence inter‐generational conflict over repayment, including the associated combination of spending cuts and tax increases. There are three related causal mechanisms by which an ageing population might influence political preferences for debt reduction and policies to reduce deficit spending. Each has its origin in the Diamond–Samuelson overlapping generations model of fiscal policy in which debt enriches some generations at the expense of others (Diamond, Reference Diamond1965; Elmendorf & Mankiw, Reference Elmendorf and Mankiw1999).
First, Cukierman and Meltzer (Reference Cukierman and Meltzer1989) and Tabellini (Reference Tabellini1991) consider the straightforward proposition that generations might differ in their preferences for transferring income between generations through borrowing. Cukierman and Meltzer (Reference Cukierman and Meltzer1989) suggest that if a majority of individuals do not wish to bequeath wealth to later generations, they have an incentive to support policies that result in lower taxes today and the accumulation of government debt. Tabellini (Reference Tabellini1991) extends this scenario and suggests that the actions of the elderly, by saddling future generations with large debt burdens, actually contribute to intra‐generational future conflict between the wealthy and poor over the reduction of public debt.
Second, Song et al. (Reference Song, Storesletten and Zilibotti2012) assume that younger voters have a greater interest in the future provision of public goods, given that they are currently paying taxes and have a longer time horizon than the elderly. For example, within the context of the United States, younger voters may also wish to benefit from social security, social spending for the elderly or even the fiscal space to confront economic crises, wars, recessions and other unforeseen events. As such, they prefer to limit the size of the national debt to allow for future borrowing, prevent government spending from becoming constrained in the present and reduce the need for future austerity or tax increases. Sparing the complexities of the formal theoretical model, they predict that as the proportion of younger voters shrinks, fiscal policy will become more focused on contemporary public goods consumed by the elderly, leading to increases in public debt. This model has been used as a framework for a variety of work on ageing fiscal policy (Andersen, Reference Andersen2019; Magistretti, Reference Magistretti2022), with some extensions suggesting that market discipline, via creditor demand for higher interest rates, will dampen the impact of ageing on debt (Magistretti, Reference Magistretti2022). However, this will likely come with additional social costs and increased pressure to default when it becomes more difficult to roll over existing debt. As debt ceilings are reached, creditors lose faith, credit ratings fall and spending becomes constrained.
Third, other scholars have approached the question in a slightly different way, assuming that the rate at which households discount the future is heterogeneous (Yared, Reference Yared2019). Simply put, older voters exhibit a higher present bias and will therefore favour higher deficits in policy choices with future implications. As these ageing and impatient households become a greater share of the electorate, this theorising predicts that the government will become more shortsighted, deficits will grow and debt will accumulate.
Each of these theories makes assertions about the generational preferences for debt reduction that, if the theories are informative, provide a strong reason to believe ageing societies influence debt burdens not only through a dwindling workforce and need for social spending but also because ageing interests shape the politics of debt reduction. In fact, the electorate is “greying” not only due to the ageing population but also because of the linear relationship between political age and turnout. In Western countries, the share of young voters is curtailed by a declining youth turnout, which is about half of that of older generations (Stockemer & Rocher, Reference Stockemer and Rocher2017), empowering the elderly due to vote‐seeking politicians. While existing models make clear predictions about the political impact of a greying society, there is little empirical evidence to substantiate the claim that the elderly are more present‐biased in their policy preferences or are more concerned about their private goods than the public good of future fiscal space. Besides, literature outside of the study of public debt suggests that fears of generational conflict from an ageing society may be overstated.
Inter‐generational politics
The larger debate over the degree to which politics will be dictated by the elderly rests on the assumption that there are differences in political preferences between older and younger generations. Some studies claim that when old people are confronted with a trade‐off between spending on education or pensions and health, the age effect skews preferences in favour of the latter option (Busemeyer et al., Reference Busemeyer, Goerres and Weschle2009; Cattaneo & Wolter, Reference Cattaneo and Wolter2009). However, the literature that predicts generational conflicts often neglects cohort and period effects, assuming that such conflicts are driven by the ageing process itself, or centres the analysis on one country as a case study, making any finding hardly applicable to other countries (Sørensen, Reference Sørensen2013). In addition, O'Grady (Reference O'Grady2020) investigates whether Europe is likely to become a ‘gerontocracy’, concluding that the overall age cleavage in European politics has not increased over the past 30 years as Europe has aged. Indeed, there is only weak evidence to support the claim that increasing age differences among citizens supersedes traditional conflicts across social classes and political ideologies (Naumann, Reference Naumann2018).
Even scholars that conclude age is a relevant predictor of preferences towards educational spending, such as Busemeyer et al. (Reference Busemeyer, Goerres and Weschle2009), remark that the portrayal of generational conflict overstates its importance and that the salience of age for preferences varies significantly across countries. In addition, the preferences of elderly voters for health spending and pensions over education are not necessarily at odds with younger generations' preferences. While old people can no longer economically benefit from education, young people seem to acknowledge that they will be the future beneficiaries of policies designed to assist the elderly (Bonoli & Häusermann, Reference Bonoli and Häusermann2009). Young people may support pro‐elderly policies out of compassion for those who are currently old (Huddy et al., Reference Huddy, Jones and Chard2001), and the lack of a strong age‐based conflict over education spending suggests that there is substantial overlap in the preferences of young and old voters. Moreover, the elderly may also show inter‐generational solidarity by interacting with other generations in their family and internalise the well‐being of younger generations in their utility function (Goerres & Tepe, Reference Goerres and Tepe2010).
If demographic shifts do not intensify overall generational conflicts, then apparent differences in preferences could be explained in light of cohort and period effects (Grasso et al., Reference Grasso, Farrall, Gray, Hay and Jennings2019; O'Grady, Reference O'Grady2020). For example, in the case of climate and environmental policy, a field characterised by inter‐generational conflicts over the future burdens of environmental damage and short‐term costs of adjustment, it is unclear if conflicts are induced by a genuine age effect or by a cohort effect. Existing research shows that elderly voters are less concerned about tackling climate change and less likely to allocate public funds to environmentally friendly policies (Andor et al., Reference Andor, Schmidt and Sommer2018; Hersch & Viscusi, Reference Hersch and Viscusi2006), but it has not been demonstrated that this is an effect of ageing rather than a result unique to the cohort of elderly voters under investigation.
In summary, debt is not the only issue area where scholars have theorised about the possibility of inter‐generational conflict resulting from age‐based demographic shifts. In line with the standard assumption of political economy models that individuals are driven primarily by material self‐interest, several researchers have sought to find evidence that the young and old are likely to have diverging policy preferences and political behaviours as the population ages (Cattaneo & Wolter, Reference Cattaneo and Wolter2009; Sinn & Uebelmesser, Reference Sinn and Uebelmesser2003). Yet, much of this research finds that fears of a broad shift towards policies that reflect the interests of the elderly are overblown (Emery, Reference Emery2012; Naumann, Reference Naumann2018; O'Grady, Reference O'Grady2020; Sørensen, Reference Sørensen2013) and that interpreting political preferences as driven by pure age‐based self‐interest is oversimplified (Goerres & Tepe, Reference Goerres and Tepe2010). Before conclusive claims can be made about the effect of greying politics on policy, the relationship between age and preferences demands further investigation.
Testing how age influences debt preferences
We first test the assumption made in many prominent theories of sovereign debt politics that preferences towards debt policy are a function of age. The most straightforward claim apparent in the literature suggests a linear relationship with age, with older individuals being less concerned about debt given their shorter time horizons (Cukierman & Meltzer, Reference Cukierman and Meltzer1989; Song et al., Reference Song, Storesletten and Zilibotti2012; Tabellini, Reference Tabellini1991; Yared, Reference Yared2019).
-
Hypothesis 1: Individuals' support for reducing national debt and reducing deficit spending decreases with age.
Formal economic models often reduce populations to two overlapping generations and two periods for tractability. Yet, it is not clear that preferences for debt reduction are consistent with a binary or linear conception of age in practice; such models provide results that are oversimplified at best and distorted at worst.
Old and young voters have relatively high discount rates and might be more similar in their preferences for contemporary public goods than these models assume. Above, we have explained that the elderly have an incentive to shift the burden of consolidation onto future generations. The young also face similar incentives to delay for two related reasons.
First, an agreement between young and old on preferences for debt may be driven by higher reliance on public spending than those in middle age. Workers have always been most likely to experience unemployment early in their careers (D. N. Bell & Blanchflower, Reference Bell and Blanchflower2011), and youth unemployment has become a major concern in post‐crisis Europe. The past decades have been defined as ‘the age of dualisation’, witnessing an ever‐widening gap between workers who enjoy stable labour markets, the insiders, and those who are affected by volatile and unstable employment conditions, the outsiders (Emmenegger et al., Reference Emmenegger, Häusermann, Palier and Kaiser2012). A strong predictor of being an ‘outsider’ is age, with young workers being more likely to face unemployment or atypical employment, such as fixed‐term contracts and involuntary part‐time jobs (Schwander & Häusermann, Reference Schwander and Häusermann2013). At the same time, higher exposure to labour market risks should increase support among young people for government intervention through public spending as a form of insurance (see Iversen & Soskice, Reference Iversen and Soskice2001) and increase their current welfare.
Absent a stable current income source, the young are likely to be hesitant to support debt reduction for fear that unemployment or education benefits would be subject to cuts (Busemeyer et al., Reference Busemeyer, Goerres and Weschle2009). Instead, they would prefer additional government spending in the present both to drive job growth and to finance social programmes. In addition, those of university age will also be more reluctant to support debt consolidation given their dependence on educational subsidies in the late teens and early twenties. Those in middle age are more likely to have secure employment and benefit from seniority. As such, their livelihoods are not as likely to depend on government spending as the young or the old, and they are more likely to support efforts to reduce the debt and to tolerate the accompanying spending cuts.
Even without considering how dependence on government transfers varies by age, the life‐cycle consumption hypothesis suggests that individuals prefer to smooth consumption over their life span (Modigliani & Brumberg, Reference Modigliani and Brumberg1954). In regard to tax obligations to repay debts, the young should prefer to pay taxes later when they expect higher incomes, rather than incur contemporary taxes when they are not earning a seniority premium. Recent behavioural research provides evidence for this effect in the context of individual welfare. Falk et al. (Reference Falk, Becker, Dohmen, Enke, Huffman and Sunde2018) show in a cross‐national analysis that individuals' patience follows a non‐linear form across age, with the young and old demonstrating less elicited patience than the middle aged. Jacobs and Matthew (Reference Jacobs and Matthew2012) suggest a similar logic might be at play in attitudes towards government policy in long‐term investments, similar to debt, as the very young discount the future more than the middle aged. However, their study lacks sufficient power to conclusively test the relationship.
Considering the similar incentives of the young and old to discount the costs of future fiscal crises and associated austerity, we propose a non‐linear relationship between age and preferences for debt consolidation.
-
Hypothesis 2: Younger individuals' support for reducing national debt and deficit spending increases with age while, among older individuals, support decreases with age.
Research design
Our hypotheses posit a relationship between opposition to debt reduction policies and age. Testing this relationship is challenging. There are few existing public opinion surveys that explicitly ask citizens about their preferences for public debt. Fewer sources repeatedly ask about debt or ask an identical question in multiple countries to allow for the identification of age from cohort and period effects (we explain below). Even fewer rely on population‐based sampling that attracts a sufficient number of non‐digital older citizens and have a sample size large enough to capture sufficient variation among a (currently) small elderly population. For example, Bansak et al. (Reference Bansak, Bechtel and Margalit2021) find that age is not correlated with support for austerity. However, their data rely on quota sampling from online panels that are biased towards the young. Only 5 per cent of their respondents from Italy are over 65 compared with 23 per cent of the actual population.Footnote 1 Fortunately, the Eurobarometer survey has consistently asked hundreds of thousands of Europeans from 28 countries about their attitudes towards debt in their own country in the wake of the European Debt crisis from 2011 to 2019 (European Commission, Brussels, 2020).
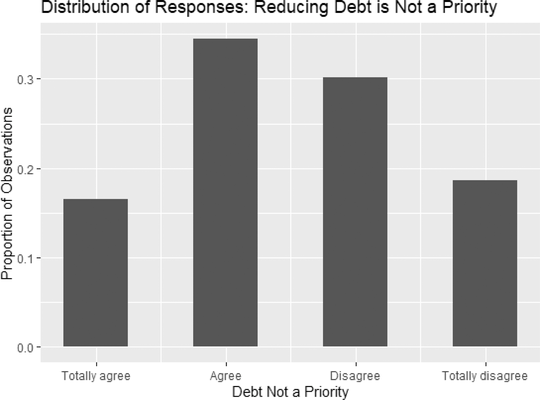
The dependent variable in our study is drawn from responses to the following Eurobarometer question: ‘Measures to reduce the public deficit and debt in (OUR COUNTRY) are not a priority for now’. Possible responses included ‘totally agree’, ‘tend to agree’, ‘tend to disagree’, ‘totally disagree’ or ‘don't know’. We collapse the dependent variable into a binary variable that indicates if the respondent agrees (totally or tends) with the statement in order to simplify the interpretation of the models.Footnote 2 Figure 1 shows the distribution of this variable in all countries included in the Eurobarometer survey (28 in total).

Figure 1. Distribution of responses to the Eurobarometer question: ‘Debt not a priority’. A response of ‘1’ indicates ‘totally agree’ whereas a response of ‘4’ indicates ‘totally disagree’. Note that responses are relatively normally distributed.
This question picks up two potential evaluations of a government's debt and deficit. The first is an objective assessment specific to each country. The second is each respondent's subjective assessment. We are interested in the latter as an objective assessment should not be influenced by individual characteristics like age. As we explain below, we account for this subjective assessment by including country‐fixed effects on the right‐hand side of our statistical models. This should capture the variance in outcomes caused by differences in fiscal health, credit access and debt burdens.Footnote 3 To account further for time‐variant factors, we also demonstrate the results are robust when including country‐wave fixed‐effects.
Age, period and cohort
Estimating the effect of age on a dependent variable has challenged researchers from a wide variety of disciplines. Age is perfectly correlated with two other potentially salient effects: a cohort effect and a period effect (referred to as the age‐period‐cohort effect, or APC). Given a snapshot in time, individuals of a particular age group share a common experience, such as a war, that shapes attitudes throughout their life. However, simply by comparing individuals across ages at a single point in time, it is impossible to distinguish cohort effects from the effect of ageing (Yang & Land, Reference Yang and Land2013).
Typically, scholars will address such confounding by introducing ‘controls’ for the other factors. As such, it would be intuitive to add controls for birth cohort (year of birth) and the period in which the survey was conducted (time of the survey). However, this approach is problematic as age is a function of both cohort and period. The combination of both the period and the cohort perfectly predicts age (age = period − cohort). As such, the variables are co‐linear but potentially driven by distinct causal processes. Further, any design to estimate all three is rank deficient (Fosse & Winship, Reference Fosse and Winship2019). Fortunately, the problem is less severe given we have 20 waves of data and can thus directly address confounding from period effects by adding survey‐wave fixed‐effects to our model. Our remaining problem then is addressing cohort and age confounding.
The natural solution is to include controls for multi‐year cohorts and thus examine the impact of age within those cohorts (Neundorf & Niemi, Reference Neundorf and Niemi2014). While the Eurobarometer does provide multiple years, it does not provide sufficient generational replacement with 10 years of data. As such, we are unable to directly isolate age effects from cohort effects.
Scholars have developed a variety of strategies to circumvent this identification problem. Each requires a trade‐off in the assumptions made in order to estimate any of the three variables (A. Bell, Reference Bell2020; Fosse & Winship, Reference Fosse and Winship2019; Stegmueller, Reference Stegmueller2014). We adopt two such strategies in order to demonstrate the robustness of our findings to alternative approaches. This is important because research suggests that results from APC analyses are especially prone to modelling choices to overcome the notorious identification problem (Fosse & Winship, Reference Fosse and Winship2019).
First, we make a strong assumption that the slope of cohort effects is zero. We defend this by pointing to the cross‐national diversity of our sample. Unlike many APC studies that focus on a single country, our sample includes many countries with varied histories. As such, it is unlikely that certain cohorts across countries will have experienced similar events that shape their attitudes towards government debt simultaneously in a similar way.Footnote 4
Second, we include theoretically informed controls that capture the mechanisms by which cohort experiences are likely to influence attitudes towards government debt (Sørensen, Reference Sørensen2013; Yang & Land, Reference Yang and Land2013). In our estimation, we control for an individual's left‐right political orientation, social class and education.Footnote 5 If a cohort experience affects preferences for debt policy, it will likely be through political ideology as political leadership during an individual's formative years has a strong impact on their life‐long partisan affiliation (Dinas, Reference Dinas2013). Second, if events experienced earlier in life, such as a war or an economic crisis, disrupt one's education and income, their impact on preferences is likely to be long‐lasting (Alesina & Giuliano, Reference Alesina and Giuliano2011; Giuliano & Spilimbergo, Reference Giuliano and Spilimbergo2014). This will have a strong effect on an individual's ability to weather debt consolidation.
Other covariates
Age is an exogenous variable in our analysis given that attitudes towards debt cannot impact the year in which an individual was born. However, we still might have threats to inference if our sample is biased because of differences in life expectancy. To account for this concern, we control for our respondent's gender to reflect the differences in life expectancy between men and women. Similarly, we control for self‐reported social classFootnote 6 and age of school completion (log transformed) to address concerns that life expectancy is a product of socioeconomic status in addition to addressing the age, period and cohort problem we discussed above.Footnote 7
To control for time‐invariant differences between countries and to separate age and period effects, we include both country and survey wave fixed effects.Footnote 8 Notably, this helps to address variation in government debt and perceived sustainability across countries in our diverse sample. An additional concern is that youth are highly mobile and are more likely to migrate towards urban centres given the greater employment and cultural opportunities there (Rodden, Reference Rodden2019). This suggests that statistical differences in age might reflect urban–rural political divides. As such, we control for this by including binary indicators for a respondent's residence in a rural area, small or mid‐sized town, or large town or city.
Lastly, we control for partisan identity for two reasons. First, partisan identity is one prominent way in which cohort effects may present themselves. Second, conventional wisdom suggests that individuals become more conservative as they age. There is little evidence to support this claim, and research suggests that people develop stable political attitudes early in life (Peterson et al., Reference Peterson, Smith and Hibbing2020), but we still control for the possibility that partisan identity affects debt preferences differently as people age. We include each respondent's self‐reported position on a left‐right continuum (with 1 representing far‐left and 10 representing far‐right) in our central analysis.
Estimation
We use a linear probability model (LPM) to produce our estimates. LPM is an optimal choice given that it generates minimal bias, relative to a non‐linear model, in this context where the predicted probabilities lie in the middle of the distribution (Horrace & Oaxaca, Reference Horrace and Oaxaca2006). The LPM specification also has the advantage, over non‐linear models, of easing the interpretation of effect while also including several sets of fixed effects that are necessary to address the age‐period‐cohort issue and the cross‐sectional composition of the data. To address concerns over our specification choice, we present several alternative specifications in the online Appendix including estimates using ordinary least squares with the original ordinal variable and a conditional‐logit specification. $\begin{equation} Y_{ilt} = Age\beta _1 + Age^2\beta _2 + \bm{W\beta _{ilt}} + \gamma _l + \theta _t + \epsilon _{ilt}. \end{equation}$
 We estimate the equation above in which $ Y_{ilt}$ is our binary outcome (1 = agree debt is not a priority) for respondent $i$, in country $l$, at time $t$.
$t$. $\bm{W\beta }$ indicates a matrix of control variables and their coefficients. $\gamma$ indicates the country fixed effect, and $\theta$ indicates the survey‐wave fixed effect; and we employ heteroskedasticity‐robust standard errors. There are two survey waves in each year, generally administered in May and November. Footnote 9
Results
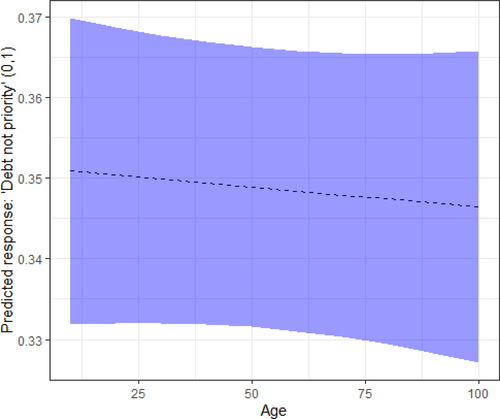
We first examine the linear relationship between age and support for debt reduction. Figure 2 presents the predicted $Y$ and 95 per cent confidence intervals across age when we exclude the squared term.Footnote 10 The figure demonstrates no support for the first hypothesis. As such, we move on to test the non‐linear relationship specified in Hypothesis 2.

Figure 2. Age and debt attitudes: Omitting the squared term and including control variables. The figure indicates the predicted dependent variable across values of age in a model excluding a squared term for age. The dependent variable is response to ‘Measures to reduce the public deficit and debt in (OUR COUNTRY) are not a priority for now’, re‐scaled between 0 (disagree) and 1 (agree). The blue‐shaded area indicates the 95 per cent confidence interval around the prediction. N = 112,689. [Colour figure can be viewed at wileyonlinelibrary.com]
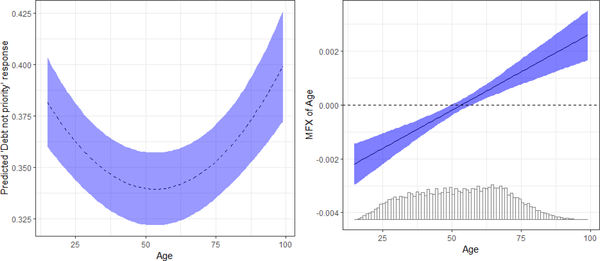
To properly assess the significance of the quadratic age term, Figure 3 illustrates the predicted values and marginal effects of age from a linear probability model including the controls described above and the maximum available sample provided by the Eurobarometer data (N = 112,689). Notably, some waves of the Eurobarometer are dropped from our analysis because the collection of the control variables was not consistent. Our main model includes 11 waves collected every 6 months between November 2014 and November 2019.

Figure 3. Age and debt attitudes including control variables. The left panel indicates the predicted dependent variable across values of age. The dependent variable is response to ‘Measures to reduce the public deficit and debt in (OUR COUNTRY) are not a priority for now’, re‐scaled between 0 (disagree) and 1 (agree). The right panel presents the marginal effect of age across age. In both panels, the blue‐shaded area indicates the 95 per cent confidence interval. N = 112,689. [Colour figure can be viewed at wileyonlinelibrary.com]
The model supports the non‐linear relationship proposed in Hypothesis 2.Footnote 11 As individuals approach middle age, they are less likely to agree that reducing the debt and the deficit is not a priority. As Europeans approach the end of their time in the workforce, they are more likely to agree. From the nadir of the prediction at 53 years old to 80 years old, the concern for the debt increases by 2 per cent. When a respondent is 90 and 100, concern decreases by 4 per cent and 6 per cent, respectively. While many individuals do not live to their 90s today, forecasts predict that average life expectancy will reach the 90s due to reductions in smoking and medical advances (Janssen et al., Reference Janssen, Bardoutsos, El Gewily and De Beer2021).
The right panel of Figure 3 also shows that the sample size decreases rapidly as individuals approach 100 years of age. This indicates the need for a very large sample with a representative population to examine the voting behaviour of the elderly that today remain a small percentage of the population. The results from our pooled model are thus relatively modest, substantively important but not as deterministic as has been portrayed by the canonical models we discussed above. The effect of age is more comparable to that of the respondent's residence in an urban or rural area; a one‐standard deviation increase in age decreases debt concern by 0.9 per cent, while living in an urban area decreases debt concern by 1.3 per cent compared to living in a rural area. Further, moving the entire range from left to right on a 10‐point scale of political orientation only increases support for debt reduction by approximately 5 per cent. Further analysisFootnote 12 reveals that the effect of moving from 55 to 85 years old is similar to the effect of moving one unit on a 1–4 scale of assessment of the domestic economy (from ‘very good’ to ‘very bad') as found in Barnes and Hicks (Reference Barnes and Hicks2021) who use the same outcome variable in a study of debt preferences in the United Kingdom which examines if debt attitudes reflect pro‐cyclical or counter‐cyclical thinking.
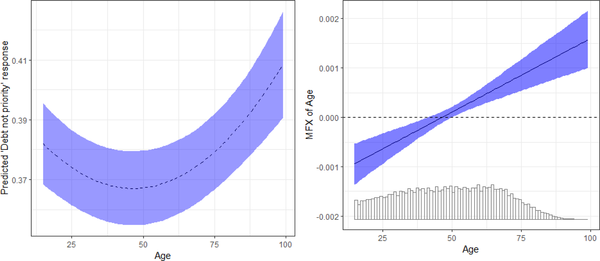
Figure 4 replicates the analysis presented in Figure 3 but excludes the control variables to make use of the entire Eurobarometer sample (N = 255,086). The relationship is similar though the effect of age among the young is somewhat diminished.

Figure 4. Age and debt attitudes excluding control variables. The left panel indicates the predicted dependent variable across values of age. The dependent variable is response to ‘Measures to reduce the public deficit and debt in (OUR COUNTRY) are not a priority for now’, re‐scaled between 0 (disagree) and 1 (agree). The right panel presents the marginal effect of age across age. In both panels, the blue‐shaded area indicates the 95 per cent confidence interval. N = 255,086. [Colour figure can be viewed at wileyonlinelibrary.com]
Disaggregating effects by wave and country
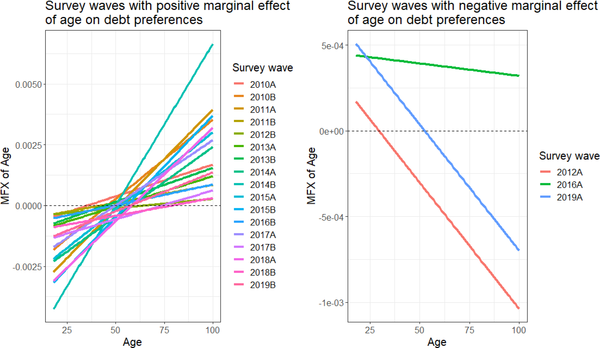
How universal is this non‐linear effect of age on debt preferences? We further investigate this result by estimating each survey wave and country individually. A difference in the effect of age across the waves of our sample might indicate that cohort effects, despite our best efforts to control for them, are responsible for the relationship we observe with age. Figure 5 presents the estimated marginal effect when we run our model on each survey wave (labelled A and B for each year) making use of the entire Eurobarometer sample (N = 255,086). The left panel presents waves in which the marginal effect of age is positive, while the right panel presents waves in which the marginal effect is negative. It is notable that there is significant variation in the marginal effect across different waves, but an overwhelming majority of models have the same non‐linear effect we present in the figures above. While there is variation, including negative marginal effects in three non‐consecutive waves (2012A, 2016A, and 2019A), this variation does not appear to follow a temporally consistent pattern. While the results suggest that we should temper our assessment of the effect of age, this lack of a pattern suggests that the conditional effect of age is not driven by cohort experiences during the 10‐year period. For example, marginal effects during the height of the Eurozone crisis vary substantially, including changing sign twice between 2011 and 2013. However, it is important to again point out that this is not a definitive test for the presence of cohort effects more broadly as there is little cohort replacement within the sample period.

Figure 5. Marginal effect of age by survey wave. Survey waves in which the marginal effect of age is positive are shown on the left; waves in which the marginal effect of age is negative are shown on the right. While there is significant variation in the marginal effect of different survey waves, they largely follow the same non‐linear effect and do not appear to demonstrate a temporally consistent pattern. (N = 255,086). [Colour figure can be viewed at wileyonlinelibrary.com]
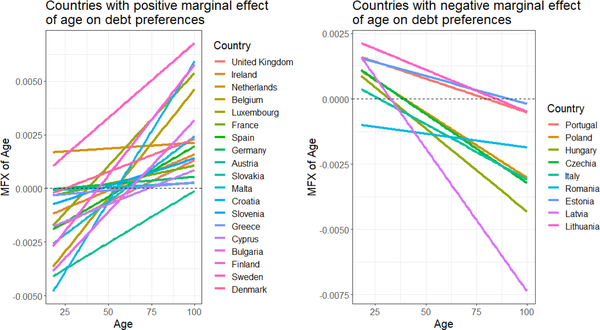
There is also significant heterogeneity in marginal effects between countries and less agreement in the direction of the effect of age. Figure 6 presents the estimated marginal effect of age by country, with countries split between panels by the sign of their marginal effect. Most countries have the convex non‐linear relationship shown in the pooled model, but a significant number have the opposite effect. Age clearly influences preferences very differently across European states, suggesting that other factors moderate this relationship.

Figure 6. Marginal effect of age by country. Countries where the marginal effect of age is positive are shown on the left; countries where the marginal effect of age is negative are shown on the right. (N = 255,086). [Colour figure can be viewed at wileyonlinelibrary.com]
What drives this cross‐national heterogeneity? We engage in an exploratory analysis in a first attempt to understand what is driving the differences across countries. Given the theoretical linkage between age and debt discussed above, several factors should increase the incentives of the young and old to deviate from the middle aged in their preferences for debt reduction. As mentioned above, the young and the old have a similar preference for contemporary public spending. We implicitly assumed that this reliance on public spending is constant across all countries in our sample. Yet, even within Europe, there is considerable variation in dependence on social spending. We posit that the differential preference for debt reduction across age, if driven by concerns about public spending reductions, will be a function of actual dependence on public spending. If respondents live in a low public spending state, with little funding for education or retirement, their livelihoods are less dependent on state fiscal policy than those in states with robust government intervention. Consequently, they have less to lose, relative to the middle aged, when governments take steps to reduce debts and deficits. It then stands to reason that the effect of age should be most prevalent where social spending is highest, indicating citizens’ greater dependence.
To test the moderating effect of welfare generosity, we interact age and its squared term first with average pension spending per pensioner and then with social spending per capita.Footnote 13 We use data from the Eurostat Employment and Social Inclusion Indicators database to measure these variables.Footnote 14
We estimate the following equation to capture the marginal effect of the quadratic form across these two moderating variables represented by Z in the equation: $\begin{equation} Y_{ilt} = Age\beta _1 + Age^2\beta _2 + Z\beta _3 + (Age*Z)\beta _4 + (Age^2*Z)\beta _5 + \bm{W\beta } + \gamma _l + \theta _t + \epsilon _{ilt.} \end{equation}$
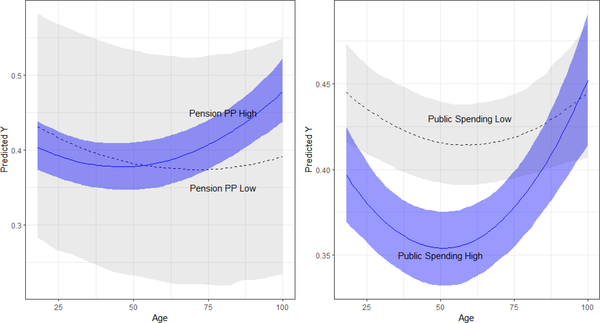
 Figure 7 graphs the predicted outcome of welfare system generosity. The left‐hand panel shows the predicted $Y$ when holding pension spending per pensioner at one standard deviation above the mean (blue) and one standard deviation below the mean (grey). Consistent with our expectations, we find that age is only relevant where pension spending is already generous. Assuming that people make plans for retirement given existing pension arrangements, this suggests that age has a salient effect on attitudes towards debt reduction when individuals are dependent on the state for their retirement. We also see that the substantive effect is higher in these states. A change from the nadir at age 40 to ages 80, 90 and 100, has a substantive change of 4 per cent, 7 per cent and 10 per cent, respectively.

Figure 7. Predicted Y across age by welfare system generosity. The left panel shows the predicted dependent variable in countries with high (blue) and low (grey) pension spending per pensioner. The right panel shows the predicted dependent variable in countries with high (blue) and low (grey) public spending. The dependent variable is response to ‘Measures to reduce the public deficit and debt in (OUR COUNTRY) are not a priority for now’, re‐scaled between 0 (disagree) and 1 (agree). In each case, ‘high’ and ‘low’ are defined as 1 standard deviation above and below the mean values for country‐years in our sample, respectively. The shaded areas indicate the 95 per cent confidence intervals around the predictions generated from simulations of variance and co‐variance matrices. [Colour figure can be viewed at wileyonlinelibrary.com]
Next, we replicate this analysis with broad social welfare spending (not solely that for pensioners) and find a similar relationship. The right‐hand panel of Figure 7 presents the predicted values when we hold public spending over GDP at one standard deviation above and below the mean. Again, we see the relationship with age is most prominent in those states with high public spending and less pronounced where social spending represents a smaller fraction of the economy. Again, the substantive effect is larger than those presented in our pooled models. Here, compared to the nadir of the prediction at 51 years old, a move to 80, 90 and 100 years old represents a substantive increase of 3 per cent, 6 per cent and 9 per cent, respectively.
The panels in Figure 7 indicate the substantive effect of age is larger among countries with more generous social and pension spending. Our models suggest that the conditioning effect of general public spending is relatively larger than pension spending alone, with a substantial difference between high and low public spending countries. Compared to the effect we presented above in the pooled model, the substantive effect of age has increased. The substantive effect of the difference from 53 to 100 years old increased to about 10 per cent, when public spending is held a standard deviation above the mean, compared to the 6 per cent effect we discussed above. We do note, however, that generous pension and public spending are potentially confounded by other variables. In particular, the legacy of communism might be influencing both spending levels and attitudes towards debt. We address this concern by providing additional models in the online Appendix that directly address confounding with and interaction between communist legacy and our age terms. The interactive effects of pension and social spending are diminished but still emerge as an important conditioning variable.
We offer an important caveat in our attempt to disentangle cross‐national differences. There are several national variables that potentially confound the interactive effect of social and pension spending that we cannot fully dismiss. As such, our analysis serves to demonstrate one theoretically motivated country‐level variable that explains differences in the non‐linear effect of age. However, we cannot definitively identify the conditional variable. Public spending is highly correlated with GDP per capita and historical legacies within Europe. As such, public spending might be a proxy for another variable.
Conclusion
This paper has investigated the role of age in shaping preferences for the management of public debt. Although age is assumed to be a central explanatory variable in theoretical models of sovereign debt accumulation and stabilisation delay, that assumption has not been systematically tested. Here, we theorise that age has a non‐linear relationship with preferences for public debt reduction and our analysis largely supports this argument. Support for debt reduction grows as respondents move out of young adulthood and into middle age, their prime earning years, and begins to decrease as they enter retirement. The results are robust to a variety of different model specifications and alternative measures to age (life expectancy).
While our findings appear to support existing theoretical models, the substantive effect of age is modest and the relationship varies across countries, suggesting the importance of the national context. We demonstrate that the non‐linear age effect is strongest in countries with more generous social programmes, suggesting that the old and young are most supportive of debt when they would stand to lose the most from debt reduction.
Our analysis has some limitations; first in the reliance on a single measure to capture attitudes towards government debt. While we used several strategies to address confounding by cohort effects, we cannot completely rule out the possibility that the effect of age will change under different cohorts. Furthermore, we use survey data collected after the European Debt crisis, which may have fundamentally shaped respondents' attitudes towards debt. As such, we cannot be certain that our results are generalisable outside of the post‐crisis European context.
Beyond addressing these concerns, future work should test the effects in non‐EU countries and, if possible, test a wider range of data in order to attempt to further disentangle the effect of age from period and cohort effects. Data limitations also prevent an examination of the effect of individual welfare dependence on fiscal preferences, which may be a valuable topic for further research.
Our findings shed new light on a core variable in the study of the management of public debt and indicate that conventional models misrepresent the effect of age with a linear relationship to fiscal preferences. The inter‐generational conflict narrative commonly discussed in the literature incorrectly pits the old against the young, when their preferences for public spending are in fact quite similar. We have addressed a question that will become increasingly important as debt burdens rise and public spending shifts towards growing elderly populations in the European Union and around the world. As voting populations age, the preferences of the elderly will become increasingly important for policy decisions. Our analysis shows that the future of fiscal politics is not one of inter‐generational conflict but rather pressure for growing debt burdens from young and old voters alike. We do note, however, that if the young continue to vote in lower numbers than older citizens, the non‐linear relationship between age and debt will be muted as a political influence. As such, models that assume a linear relationship between age and debt preferences may not be far off in their political implications. However, when examining preferences directly, our findings indicate that ignoring the non‐linear effect of age can lead to wrong conclusions about generational conflict in fiscal preferences.
Acknowledgements
Equal authorship is implied by the alphabetical order of the authors. We would like to thank Michael Becher, Jaroslaw Kantorowicz, Patrick Shea, and three anonymous reviewers for their comments and suggestions. This paper was presented at the 2021 Meeting of the European Political Science Association Meeting. We are also grateful to Alexandre Diogo and Nina Waals for their research assistance.
Online Appendix
Table A.1: Summary statistics
Table B.2: Full Results
Table C.3: Full Results: clustered standard errors
Table D.4: Results with alternative specifications
Figure D.1: The Effect of Age with Controls.
Figure D.2: The Effect of Age with False Discovery Rate‐robust confidence intervals. Number of observations: 112,689.
Figure D.3: The Effect of Age with Country‐wave Fixed Effects.
Figure E.4: Distribution of responses to Eurobarometer debt questions.
Figure F.5: Robustness check with ‘No Delay’ question (Controls included) The left panel indicates the predicted Y across values of Age.
Table F.5: Results with alternative outcome
Figure F.6: Robustness check with ‘No Delay’ question (Controls excluded) The left panel indicates the predicted Y across values of Age.
Table G.6: Results with and without children in home
Figure G.7: Age and Debt Attitudes Including Control Variables: Respondents with children in home
Figure G.8: Age and Debt Attitudes Including Control Variables: Respondents without children in home
Figure H.9: The Effect of ‘Remaining Life Expectancy’.
Table H.7: Results with alternate measure of age
Figure I.10: Marginal Effect of Age at Different Levels of Pensions Spending Per Capita.
Figure I.11: Marginal Effect of Age at Different Levels of Social Spending (% of GDP)
Table I.8: Classification of Countries
Table I.9: Results with Communism legacy
Figure J.12: Age and debt attitudes without left‐right partisanship control.
Table J.10: Results without left‐right control
Figure K.13: Non‐linear relationship between age and prioritisation of debt based on a generalized additive model.
Figure L.14: Average dependent variable, by country.
Figure M.15: Replication of Bremer and Burgisser (2022) by age quartile
Figure N.16: Age and Debt Attitudes Including Control Variables: Controlling for S&P rating
Figure N.17: Age and Debt Attitudes Including Control Variables: Controlling for debt/GDP
Table N.11: Results controlling for public debt context
Data S1


 Open access