


1. Introduction
In England,Footnote 1 help with long-term personal care is mostly provided by the private and voluntary sectors. Much of it is commissioned and paid for by the public sector, through local government authorities, working within national guidelines. Eligibility for state help with the cost of long-term care is determined by an assessment of the need for care and through a means test. In contrast, health care is mainly provided through the public sector and is largely free at the point of use.
Over the last 25 years, there have been many independent and government reports setting out options for reforming the long-term care means test in England, including Joseph Rowntree Foundation, 1996; Royal Commission on Long-Term Care, 1999; Wanless, Reference Wanless2006; Her Majesty’s Government (HMG), 2009, 2010; Commission on Funding Care and Support (CFCS), 2011; Independent Age and the Institute of Faculty and Actuaries, 2017; Bottery et al., Reference Bottery, Varrow, Thorlby and Wellings2018; Darzi, Reference Darzi2018. There have been multiple recent parliamentary inquiries on the issue (House of Commons (HoC) Communities and Local Government Committee, 2017; HoC Health and Social Care and Housing, 2018; HoC Health and Social Care Committee, 2020; House of Lords Economics Affairs Committee, 2017; HoC Levelling Up, Housing and Communities Committee 2022). The treatment of assets, and in particular housing wealth, in the means test has been much debated. A recent study (Hashiguchi and Llena-Nozal, Reference Hashiguchi and Llena-Nozal2020) identified England as 1 of 10 out of 26 jurisdictions taking both income and assets into account in the means test for care provided to people living in their own homes (community care) and 1 of 14 that took both into account for residential care (i.e. in communal care homes). In certain circumstances, housing wealth is included in the asset test in England. Recommendations for reforming the means test have included: the removal of all user charges for personal care (implemented in Scotland but not elsewhere in the UK), a ‘partnership model’ where everyone assessed as needing personal care would have a proportion of the cost met by the state without a means-test and a ceiling or ‘cap’ on the lifetime out-of-pocket expenses that individuals have to meet, the remainder being met from public funds without a means test. Such a cap, aimed largely at reducing asset depletion, was recommended by the CFCS but has not been introduced despite the necessary legislation being passed in 2014 and detailed implementation plans made by the Coalition Government of 2010–2015. In September 2021 the Conservative Government of the time announced that it planned to introduce a cap in October 2023 (HMG, 2021) but subsequently postponed implementation for two years.
Long-term forecasting of public expenditure is crucial for fiscal planning and sustainability. Our aim here is to present projections of the costs and impacts of the latest plans for reforming the English means test for entitlement to public support for care costs and draw out general lessons for the design of long-term care financing systems. The UK Department of Health and Social Care (DHSC) published some analysis of the planned reforms (DHSC, 2022) and there was some independent analysis of specific features of the reforms (Health Foundation, 2021; Sturrock and Tallack, Reference Sturrock and Tallack2022) or using hypothetical examples (Adams, Reference Adams2023). Our analysis provides complementary and additional analysis, including comparisons with the Coalition Government’s proposals, using independently developed simulation methods.
Public policy analysis increasingly relies on simulation models to evaluate the effects of proposed reforms. In this study, we combine macrosimulation and microsimulation modelling specifically designed to assess the economic consequences of changes to the long-term care system. We explore the public costs and likely distributional outcomes of two alternative versions of a proposed reform. Our findings offer valuable insights into the trade-offs between financial sustainability and access to publicly-funded care. They facilitate evidence-based debates about the public expenditure consequences and social justice dimensions of long-term care financing reforms. We focus on people aged 65+ who form a majority of users of long-term care in England. The next section outlines the current funding system in England and the planned reforms to it. This is followed by sections describing methods, results and then a discussion and conclusions section. Supplementary analysis is contained in the Appendix (supplementary material).
2. Long-term care funding for older people in England
2.1 Current system
In England a small proportion of older people with complex health needs have their care costs met in full by the National Health Service (NHS) under so-called ‘Continuing Health Care’ (CHC). For others who have been assessed as needing long-term care, their Local Authority (LA) applies a means test to establish how much they must pay towards the cost of that care. Means testing is a commonly used approach among European countries (e.g., Spain) to determine whether an individual is eligible for government support. Even in those countries (e.g., France) where a long-term care insurance scheme is in place, there is an element of means testing to decide service users’ level of co-payment (Incisive Health, 2018). The means test in England is set nationally. LAs have limited discretion to deviate from it. Those with capital above a modest upper limit must meet all their care costs. In care homes, the value of a person’s home is counted in their capital – virtually always taking them above the capital limit – unless a qualifying relative continues to live there. If capital is below this limit, income determines the person’s contribution to the care cost and includes a notional income from capital below the upper capital limit, but above a lower limit. Care home residents contributing to care homes’ fees from income must be left with a small weekly personal expenses allowance while those contributing to care at home must be left with a minimum weekly disposable income. People assessed as needing nursing care in a care home, but not entitled to CHC, receive a non means tested contribution from the NHS to their care home fees known as Funded Nursing Care (FNC). Box 1 details the current long-term care means tests in England, setting out parameter values in 2018,Footnote 3 which is the base year for our projections.
Box 1. Key features of the current long-term care means test
Capital test:
Anyone with capital above the upper capital limit (£23,250) is ineligible for financial help from their Local Authority (LA). Capital below a lower capital limit (£14,250) is completely ignored; capital between these limits is treated as generating a weekly income of £1 for each £250 of capital between the limits, which is counted in the income test (see below). Housing wealth is excluded from assessable capital for community care but included for permanent residential care after the first 12 weeks unless a qualifying relative (e.g. a spouse) continues to live in the property.
Income test:
For residential care, most* income except a small Personal Expenses Allowance (£24.90 pw in 2018) must be used towards the care home’s fee. The LA meets any shortfall between this income and the fee less, if applicable, the NHS non means-tested contribution to assessed nursing care needs (£158.16 pw in 2018).
For community care, most* disposable income (net of housing costs) above a Minimum Income Guarantee (£189 pw in 2018) must be used towards the cost, with any shortfall met by the LA. An allowance for disability related living expenses must be deducted from assessable income if the LA takes into account income from disability benefits (see below)
Disability Benefits:
People with care needs may also be eligible for one of two non means-tested cash disability benefits – Attendance Allowance (AA) or Disability Living Allowance (DLA)/Personal Independence Payment (PIP). Receipt of these benefits can also trigger increases in means-tested social security benefits through a Severe Disability Addition. If someone receives help with care home fees from their LA, payments of these disability-related benefits cease.
*Small disregards apply to some sources of income e.g. through a ‘savings disregard’. Any income from employment is ignored.
2.2 Reforms
The 2011 CFCS recommended a lifetime cap on an individual’s contribution to eligible care costs, but not to daily living costs in care homes (food, heating etc.) and a quadrupling in the residential care upper capital threshold for those whose housing wealth was included in the capital test (CFCS, 2011). A form of these recommendations was planned by the Coalition Government for introduction in 2016 (see Box 2), but not implemented. In September 2021 the Conservative Government announced plans (HMG, 2021), which we label as ‘Build Back Better’, to introduce in October 2023 a lifetime cap and raised capital limits as set out in Box 2. Notable differences between their plans and the previous plans are that the increased upper capital limit would be universal, applying to community and residential care, and not restricted to where a person’s housing wealth is included in the means test. Additionally, under the Coalition Government’s plans, individuals’ progress towards the cap (‘metering’) would be measured by the cost of the care they were receiving (subject to the maximum that the LA would normally meet) irrespective of how much they themselves paid towards their care. Under the Conservative Government reform plans, however, metering would be measured by a user’s contribution to their care costs. This could range from zero (care home residents who under the means test contribute only to the daily living costs component of their care home fees) to the full cost (self-funders). In November 2022, the then Government announced that it was postponing the implementation of the reforms until October 2025. A Labour Government was elected in July 2024 and indicated that it had no immediate plans to introduce the reforms but said that a cap on care costs would be ‘within the 10-year plan’.Footnote 4 It subsequently announced a new independent Commission to transform social care due to report in 2026 and 2028.Footnote 5
Box 2. Reform scenarios examined
Build Back Better lifetime cap (with/without increases in capital limits)
-
1. The equivalent in 2018 prices of a lifetime cap of £86,000 in 2023 prices and daily living costs of £10,400 a year in 2021 prices, progress towards the cap based on the minimum of eligible care costs and the user’s contribution towards them.
-
2. As 1. combined with universal upper and lower capital limits which are 2018 prices equivalents of £100,000 and £20,000, in 2023 prices.
Coalition Government lifetime cap (with/without raised capital limits), (see Jarett, Reference Jarrett2015)
-
3. The equivalents in 2018 prices, of a lifetime cap of £72,000 and daily living costs in residential care of £12,000 per year in 2016 prices, progress towards cap based on eligible care costs.
-
4. As 3. combined with 2018 equivalents of, in 2016 prices, upper capital limits of £118,000 for those whose housing wealth is taken into account in residential care, £27,000 for all others and a lower limit of £17,000.
Build Back Better care cost-based lifetime cap, (with/without raised capital limits)
-
5. As 1. above but progress towards cap based on eligible care costs.
-
6. As 2. above but progress towards cap based on eligible care costs.
For all scenarios we assume that all those newly eligible for LA funding take-up their entitlement and that as under the current system, care home residents who receive any funding from their LA towards their fees, cease to receive Attendance Allowance or Disability Living Allowance/Personal Independence Payment after four weeks. This generates savings in public expenditure to be offset against the cost of extended eligibility for LA funding.
Lifetime caps and daily living costs are converted to 2018 prices (the base year for our projections) according to movements in average earnings. The higher upper and lower capital limits, expressed in 2016 or 2023 prices, are converted to 2018 prices using the GDP deflator.
Two issues arise in implementing a lifetime cap on care costs. The first occurs because care home residents who are not entitled to any public funding under the current means test are typically charged higher fees than those receiving public funding (Competition and Markets Authority, 2017). By extending eligibility for LA help with care costs, the planned reforms could increase the proportion of care home residents for whom providers receive lower fees, with consequent effects on their revenues (and hence potentially the supply of care) unless fees paid by remaining self-funders rise, or LAs increase the fees they pay for users they fund (Hancock et al., Reference Hancock, Malley, Wittenberg, Morciano, Pickard, King and Comas-Herrera2013). Our modelling assumes that care homes are always paid the LA fee for residents who receive any means-tested support from their LA. By raising capital limits, the reforms would increase the number of such residents and care homes’ incomes would fall as a result. If care homes also receive the lower publicly funded fee for those who receive non means-tested public funding because they have reached the cap, care homes’ incomes could fall quite substantially. Previous analysis of proposals for a lifetime cap assumed that people who would otherwise self-fund would remain on the self-funder fee on reaching the cap, albeit with a non means-tested contribution to that fee from the state (Wittenberg et al., Reference Wittenberg, Hu, Hancock, Morciano, Comas-Herrera, Malley and King2011). We follow this approach in our main analysis but also present some analysis of the likely consequences if all those in receipt of any LA support move to the current LA fee rate. While this is an unrealistic long-term scenario, our analysis shows the immediate effect it would have on care homes’ incomes and how the benefits to care home residents of such a reduction in fees would be distributed across the income distribution. In fact, the previous Conservative government made funds available to LAs to enable them to move towards paying care homes a ‘fair cost of care’ (DHSC, 2023), so that in the long run fees paid by LAs may increase.Footnote 6 Secondly, for the planned reforms, care home fees would need to be split into daily living and care costs.Footnote 7 Under the Coalition Government plans, a national daily living costs allowance would be set and increased each year by the growth in average earnings. Eligible care costs counting towards the cap would then have been the difference between fees for publicly funded residents and this daily living allowance.Footnote 8 Our analysis assumes that this is how eligible care costs and the daily living allowance would be determined. The resulting decomposition of assumed care home fees is shown in Appendix Table A1. Under the Conservative Government’s plans, we assume that the costs that would have counted towards the cap for care home residents would be the minimum of eligible care costs and the resident’s contribution towards care costs. The latter would be the excess, if any, of their total contribution over the daily living allowance. We contrast this, however, with a scenario in which the costs that count towards the cap are calculated under the Coalition Government’s plans.
The 2018 values of key parameters of the previous Government’s plans, i.e., Build Back Better, and Coalition Government reforms presented in Table 1, show that the former are mainly more generous than the latter. The Build Back Better lifetime cap is lower, meaning it would be reached more quickly, than the Coalition Government’s planned cap. The care home daily living allowance is also lower so more of the fee counts towards the cap, so again the cap is reached sooner. The lower capital limit below which all capital is ignored in the means test is higher under the Build Back Better reforms and the upper capital limit for community care is considerably higher (over £90,000 compared with around £28,000) under the Build Back Better reforms. The upper capital limit in care homes is higher under the Coalition Government’s plans when housing wealth is taken into account in the means test. These comparisons are sensitive to the assumed level of earnings growth used to convert the 2023 parameters to 2018 prices. We have used the March 2020 Office for Budget Responsibility (OBR) economic data and assumptions (OBR, 2020a) for average earnings to convert to 2018 prices the proposed cap of £86,000 in October 2023 prices and the Coalition Government’s proposed cap of £72,000 in 2016 prices.Footnote 9 Using more recent OBR forecasts (OBR, 2023) the relative generosity of the Build Back Better cap would be a little greater.
Table 1. Comparison of key parameters across charging scenarios, expressed in 2018 prices

a In variants without increased capital limits, these limits are the same as in the current system.
b Higher value applicable only when housing wealth included in assessable capital.
d Metering based on user contributions to eligible care costs.
e Metering based on total eligible care costs.
3. Methods
We use two simulation models (Adams et al., Reference Adams, Curry, Espuny Pujol, Hancock, Hu, King, Luheshi, Morciano, Pike and Wittenberg2016; Hancock et al., Reference Hancock, Hu, Wittenberg, King and Morciano2022). The Care Policy and Evaluation Centre (CPEC) cell-based (macrosimulation) model makes projections of the future numbers of older disabled people, the associated likely level of demand for different long-term care services and disability benefits, and the private and public costs of meeting this demand. The projections are made for population subgroups (cells) defined by personal characteristics including age, gender, marital status, housing tenure, educational level and limitations in activities of daily living. A range of data is used to establish the number in each cell and bivariate probit regression models are estimated to derive conditional probabilities of receiving care needed to determine the size (number of people) of each cell. For the base year and current means test, users of each type of care are apportioned as privately or publicly funded based on latest available administrative and survey data. For future years, we apply to this base year apportionment the projected trend in the split between LA funded and privately funded service users from the CARESIM modelling described below. For reform scenarios, the difference in that trend and the projected trend under the reform is applied.
The second model, CARESIM, is a microsimulation model for assessing the distributional effects of reforms to the care means tests and estimating the private-public split of care costs. CARESIM is based on a representative sample of the English older population (aged 65+ in the base year) drawn from the UK Family Resources Survey (Department for Work and Pensions, 2021). Using information on the income, wealth and other relevant characteristics of sample members, CARESIM calculates what each sample member would be required to pay towards the cost of different types of care services, should they need such care, allowing for asset depletion during a randomly assigned time to date in receipt of care. In effect, this mimics the observation of a cross-section of care recipients, producing results which can be used with the CPEC model. Interactions between the care means tests and social security benefits (e.g. the effect of eligibility for public care funding on receipt of disability benefits and of asset depletion on entitlement to means-tested benefits) are modelled. For future years, survival probabilities from official population projections (ONS, 2019) by age and gender are used to determine via Monte Carlo simulation whether each sample member remains alive in the future year in question. CARESIM projects each surviving sample member’s income (other than means-tested social security benefits) and wealth to that year, according to assumed or (e.g. for state pension) national policy-determined inflation adjustments. Inheritance of pension income and wealth by surviving partners from sample members deemed to have died is allowed for before simulating care charges and means-tested benefit entitlements.
CARESIM does not predict which sample members will need care. Instead, it applies weights or grossing-up factors from the CPEC model such that the sample is made representative in terms of demographic characteristics, of the population projected by the CPEC model to be receiving different types of care. CARESIM’s projections of the private-public split of care costs by population subgroups are used in the CPEC model as described earlier. For each sample member, CARESIM also calculates weekly financial gains or losses from reforms. These are measured at the same point for which the public-private split is calculated. They are derived as the net effect of changes in liability for care charges and changes in income resulting from altered capital depletion including any effect on income from capital and on entitlement to means-tested benefits.
The models make projections, not forecasts, based on specific assumptions about trends in such variables as future mortality rates, disability rates and unit costs of care, and on how key monetary parameters within the long-term care and benefits system are adjusted for inflation over time. Details of such assumptions used in this paper are contained in Box 3. Since the base year for our projections is 2018, the numbers of service users and social care unit costs pre-date the COVID-19 pandemic. So too do the OBR’s economic medium and long-term forecasts that we use (OBR, 2020a, 2020b). This avoids the short-term transient effects of COVID-19 such as sharp movements in measured earnings growth and productivity but does not take account of the potentially important, but still uncertain, longer-term impacts of the pandemic. As we discuss later, more recent OBR forecasts are unlikely to change our main findings. Full details of the versions of the models used in this paper are given in Hancock et al. (Reference Hancock, Hu, Wittenberg, King and Morciano2022).
Box 3. Economic, demographic and uprating assumptions
-
The number of people by age and gender changes in line with the Office for National Statistics (ONS) 2018-based principal population projections.
-
Marital status rates change in line with the indicative 2011-based living arrangements projections for those aged 65 and over in England (ONS, 2018).
-
There is a constant ratio of single people living alone to single people living with their children or with others and of married people living with their partner only to married people living with their partner and others within each age, gender, and disability group.
-
Prevalence rates of disability in old age by age group (65–69, 70–74, 75–79, 80–84, 85+) and gender remain unchanged, as reported in the Health Survey for England 2011 to 2014.
-
The proportions of people receiving unpaid care, formal community care services, residential care services and disability benefits remain constant for each sub-group by age, disability and other needs-related characteristics.
-
The supply of formal care will adjust so that demand will be no more constrained by supply in the future than in the base year.
-
Monetary parameters within the long-term care and social security systems are assumed to maintain their values relative to known or forecast movements in the GDP deflator except:
-
– the new State Pension for those reaching state pension age from April 2016 and Basic State Pension for others are uprated by the ‘triple lock’ (the highest of price inflation, average earnings growth or 2.5%);
-
– the NHS contribution to nursing care in nursing homes is linked to earnings;
-
– parameters that were unchanged between 2015 and 2022 are held constant in nominal term until 2022 (e.g. capital thresholds in the care and benefits systems, the personal expenses allowance in residential care, the income threshold in the home care means test);
-
– the income threshold in the home care means test is linked to earnings from 2022;
-
– under reform scenarios, lifetime caps and daily living costs are uprated each year in line with average earnings as had been indicated would happen under the previously planned reforms;
-
– pensioners’ means-tested social security benefits are uprated by rises in average earnings.
-
-
Unit costs of care rise in real terms in line with the March (medium-term) and July (long-term) 2020 OBR assumptions for future trends in productivity (OBR, 2020a, 2020b), with an uplift for the years to 2020 to allow for rises in the national living wage (except that non-labour, non-capital costs remain constant in real terms).
The next section of the paper presents our projections of the number of older long-term care users by funding status under the current funding system and of changes in net public expenditure on long-term care for older people resulting from the reforms. We also present projections of average gains to individuals according to whether they receive community or residential care, home-ownership and position in the distribution of income for people aged 65+. Income is measured without deducting housing costs but excludes disability benefits, following previous practice when considering the targeting of public support for people with disabilities (Hancock et al., Reference Hancock, Morciano and Pudney2019). In the main text, these estimates are presented as charts showing average weekly amounts. The Appendix contains corresponding charts where weekly amounts are expressed as a proportion of net income.
Our analysis is of the reforms as originally planned for implementation in October 2023. Since the effects of the cap would not be felt immediately,Footnote 10 we start our projections of the effects of the reforms in 2028, by when the new system would have been largely mature, had it been implemented in October 2023.
While the focus of the models is on making projections for the future and examining potential reforms to the funding system, they also provide useful estimates, mostly not available elsewhere, of the base year composition of older recipients of long-term care, the associated public and private expenditure under the current funding system and the distribution of LA net public expenditure on long-term care according to characteristics such as partnership and home-ownership status and position in the distribution of income. These estimates are detailed in the Appendix and summarised in the next section. Further supplementary analysis in the Appendix also examines, for the base year, the association between income, housing and other wealth, the extent to which LA-funded care home residents’ contributions to the care home fee exceeds the daily living component, and also how far care home residents draw on their income, housing and other wealth to fund the daily living and care components of the care home fee.
4. Results: current policy
4.1 Base year (2018)
We estimate that a stock of nearly 700,000 older people received care in 2018, split roughly equally between those receiving care in a care home and those remaining in their own homes (community care users) (Figure 1). Of the 700,000, 55% received some funding from their LA, 4% were fully funded by the NHS in a care home, leaving 41% funding themselves in full. Two-thirds of community care recipients received some LA funding compared with 43% for care home residents. This difference partly reflects the inclusion of housing wealth in the means test for residential but not community care. Fifty-two per cent of care home residents receiving nursing care were self-funders compared with 46% of residents not receiving nursing care. Appendix Table A2 gives details.
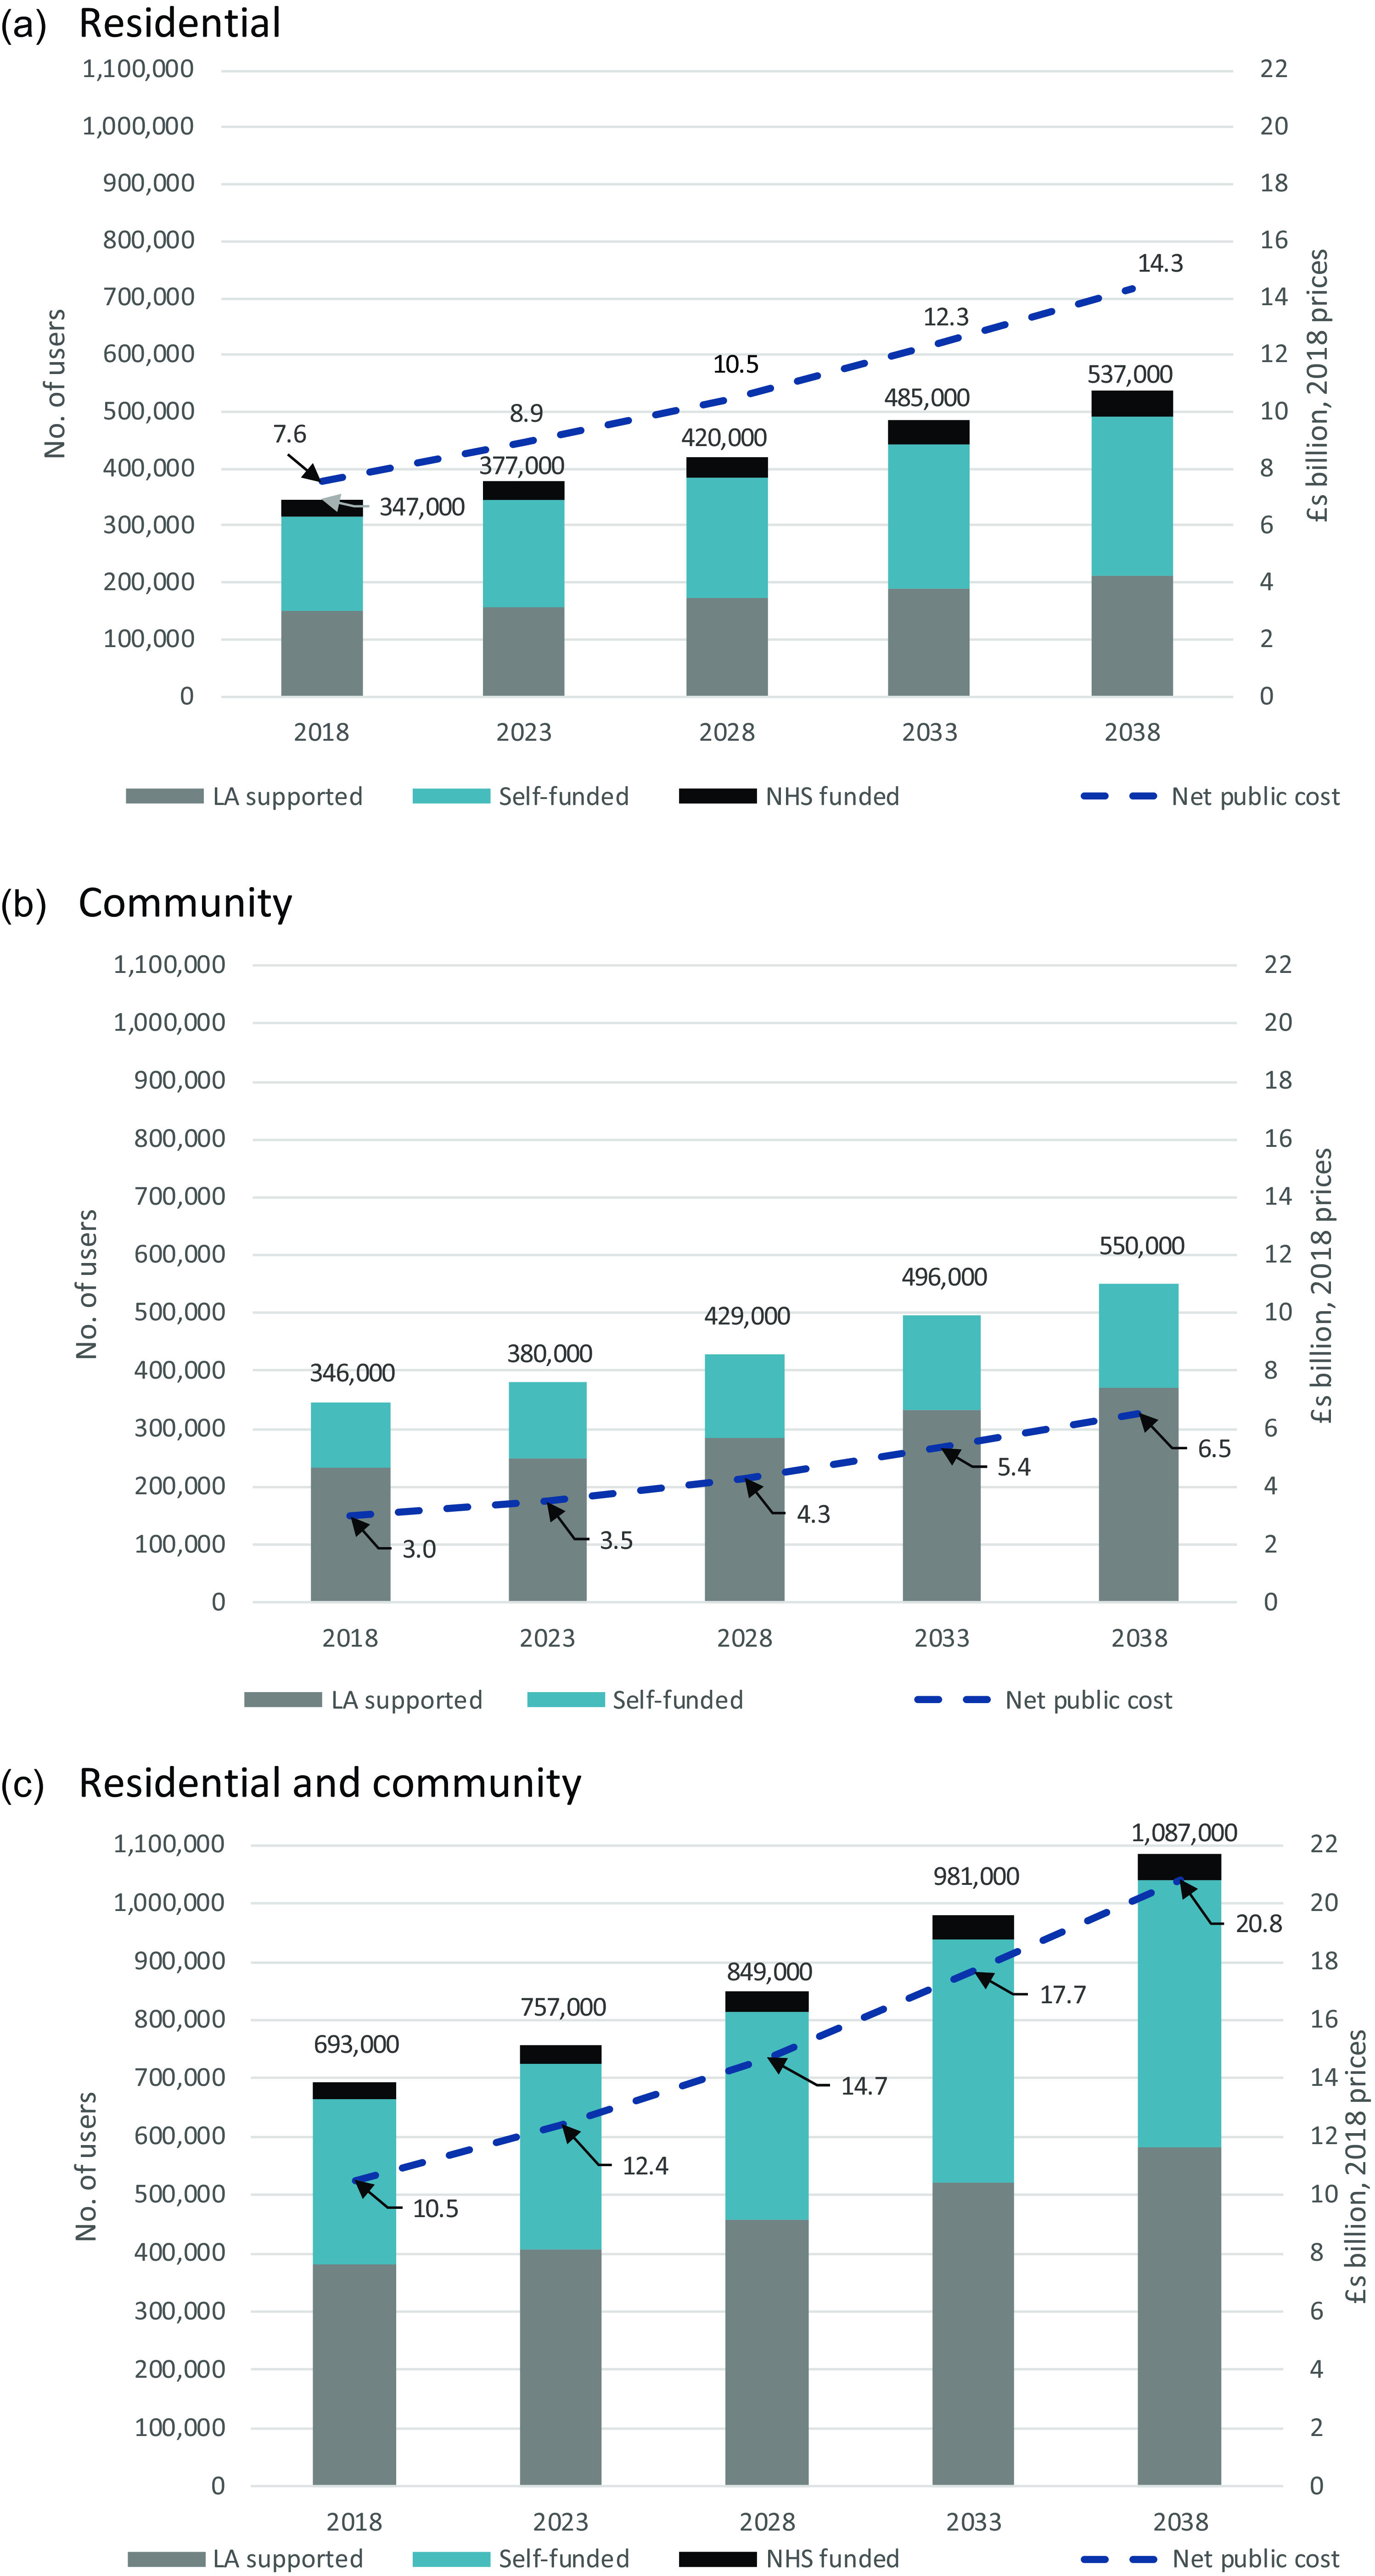
Figure 1. Projected number of older long-term care users, by funding source and associated net public expenditure, England, 2018–2038. (a) Residential. (b) Community. (c) Residential and community. Source: CPEC and CARESIM models. Note: Net public expenditure comprises LA expenditure on long-term care for older people net of user charges, NHS expenditure on CHC and FNC in care homes and disability benefits paid to self-funding care home residents.
Appendix Table A3 gives our estimates of 2018 expenditure on long-term care for older people in England. The combined total of private, Local Authority, NHS expenditure and disability benefits paid to self-funding care home residents amounted to just under £20 billion (around 1.1% of England’s GDP), of which around 36% was paid by people receiving no public funding, 12% came from charges paid by LA-funded users, 12% from the NHS (CHC and FNC in care homes), 4% from disability benefits paid to self-funding care home residents and the remainder, 37%, from LA budgets. Private expenditure including user charges represented a higher proportion of residential than community care spending (51% compared with 33%).
We estimate that in 2018 LA net expenditure on long-term care for older people was concentrated on single non homeowners who received 55% of net expenditure (Figure A1a) and on those with lower incomes. Thirty-eight per cent of net spending went to the lowest income quintile compared with just 4% received by the highest income quintile (Figure A1b). A strong correlation between income, home-ownership and whether savings are in excess of the (current) upper capital threshold (Tables A4–A7) underlies these patterns.
The majority (66%) of LA-funded care home residents are unpartnered and were not home-owners before care home entry. In contrast, 88% of self-funding care home residents were unpartnered and were home-owners prior to care home entry (Figure A2a). Although housing wealth is disregarded in the community care means test, the proportion of LA-funded community care users who are homeowners is considerably less (64% compared with 80%) than for self-funded community care users (Figure A2b). This is again consistent with the positive association between home-ownership, income and non housing wealth.
We estimate that 68% of LA-funded care home residents currently contribute nothing towards the care componentFootnote 11 of their fees, so cannot benefit from a cap on care costs (Figure A2a). How progress towards the cap is measured will affect the remaining 32%. On average, self-funding unpartnered care home residents pay around £795 a week (2018 prices) in care home fees and meet about 40% of the fee from their housing wealth (Figure A3). LA-supported residents make an average weekly contribution of £166 to £195 to their care home fee. The average contribution is £239 to £276 per week where LA-funded residents contribute towards their care as well as daily living costs – still less than half the cost met by self-funders. Single non-owners and partnered individuals who self-fund make substantial contributions from their savings but also make larger contributions from their income than LA-supported residents as a whole. Where an LA-supported resident contributes to their care as well as daily living costs, most of that contribution comes from income.
4.2 Projections
We project that the number of older care home residents will increase by 55%, from 347,000 in 2018 to 537,000 in 2038 (Figure 1a). The associated net public expenditure is projected to rise from £7.6 billion in 2018 to £14.3 billion in 2038. We project that the number of community care users will increase by 59%, from 346,000 in 2018 to 550,000 in 2038. The associated net public expenditure is projected to increase from £3.0 billion in 2018 to £6.5 billion in 2038 (Figure 1b). Thus a total of 1.1 million older people are projected to receive long-term care in 2038, with projected net public expenditure reaching £20.8 billion (Figure 1c).
5. Results: reform scenarios
5.1 Public expenditure effects
Public expenditure under the previous Conservative government’s plans is projected to be £2.1 billion and £2.9 billion higher (2018 prices) in 2028 and 2038, respectively, than under the current funding system (Figure 2a). The extra spending amounts to about 14% of what is projected under the current system. Without raised capital limits, public expenditure is projected to be about £0.1 billion less than with the higher capital limits.Footnote 12 We project that public expenditure cost in 2038 of the Coalition Government plans would be £2.3 billion or £0.7 billion less than the previous government plans (Figure 2b). The net public cost of the latest plans in 2038 would be £3.4 billion with a care cost-based cap, some 17% higher than when metering is based on user contributions (Figure 2c).
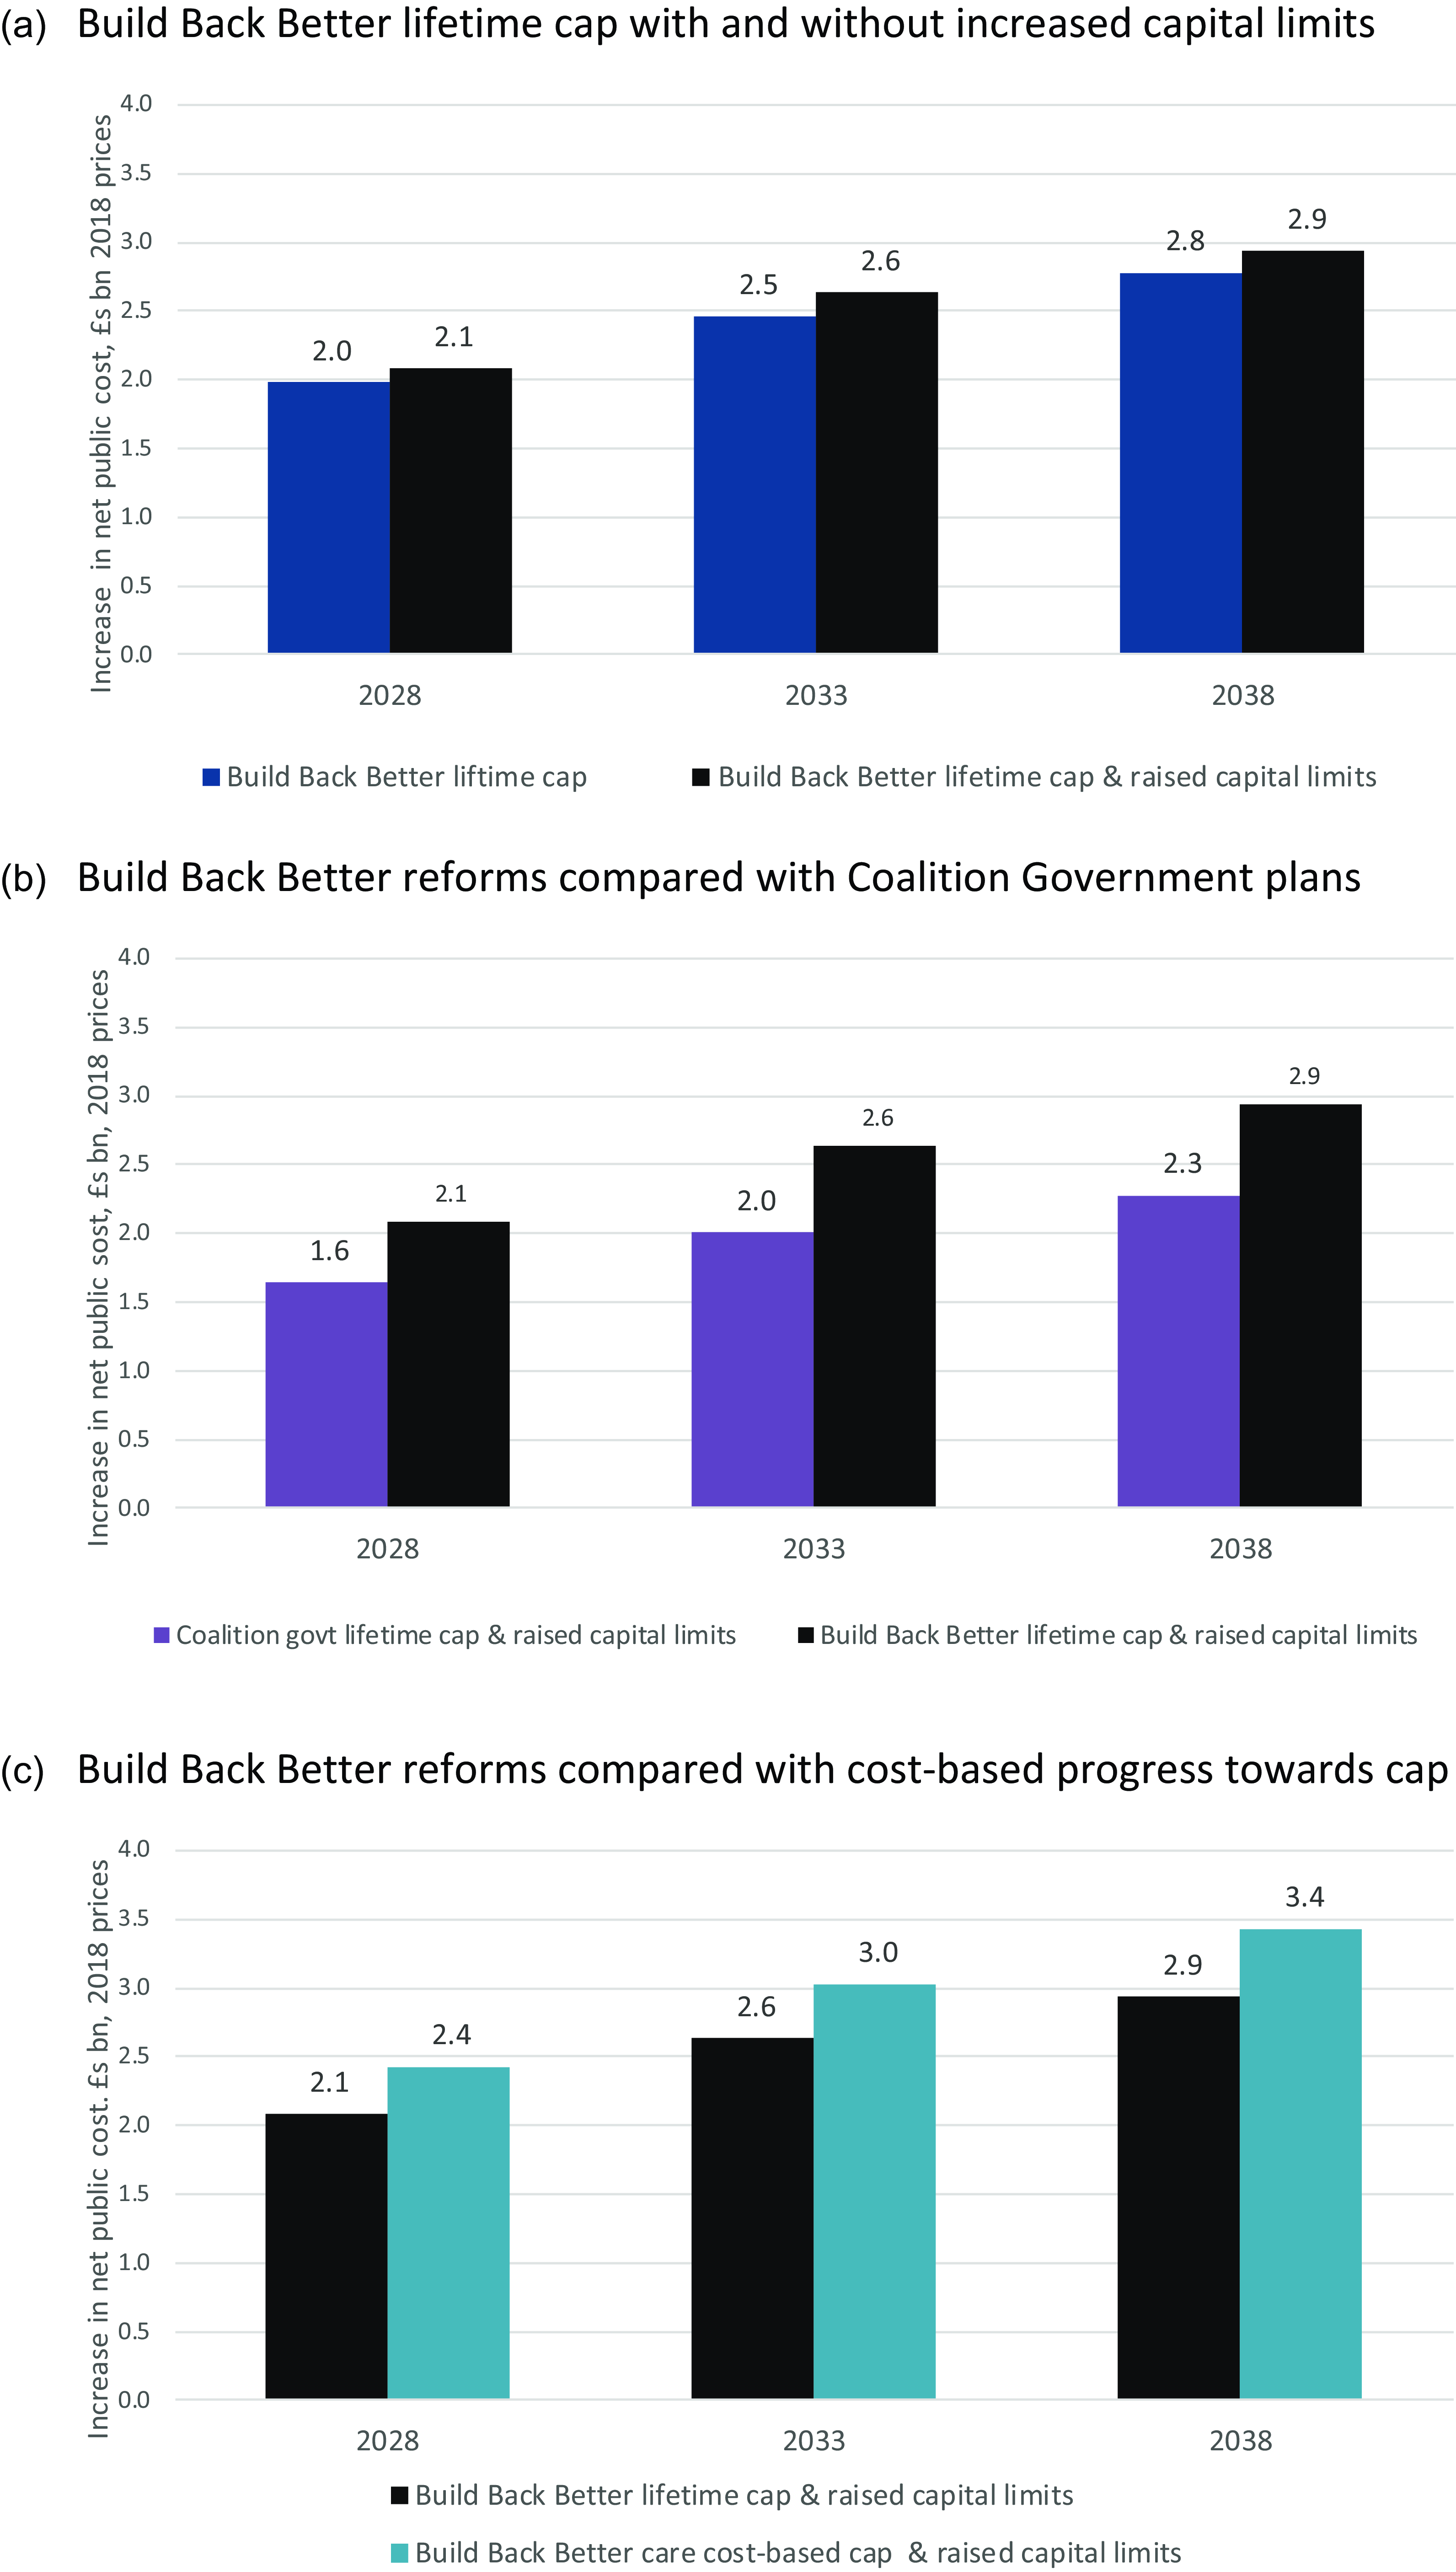
Figure 2. Projected increases from reforms in net public cost of long-term care for older people, 2028–2038, England. (a) Build Back Better lifetime cap with and without increased capital limits. (b) Build Back Better reforms compared with Coalition Government plans. (c) Build Back Better reforms compared with cost-based progress towards cap. Source: CPEC and CARESIM models. Note: Net public expenditure comprises LA expenditure on long-term care for older people (less user charges), NHS expenditure on CHC and FNC in care homes and disability benefits used to fund residential care.
5.2 Distributional effects of reform scenarios
We estimate that in 2028, care home residents will be £58 a week (2018 prices) better off on average because of the current plans, including the raised capital limits (Figure 3). Gains for community care users are lower (although some will go on to become care home residents) at around £20 a week. Home-owners stand to gain very much more than non home-owners – an average of £62 per week compared with just £5 for non owners (Figure 4).
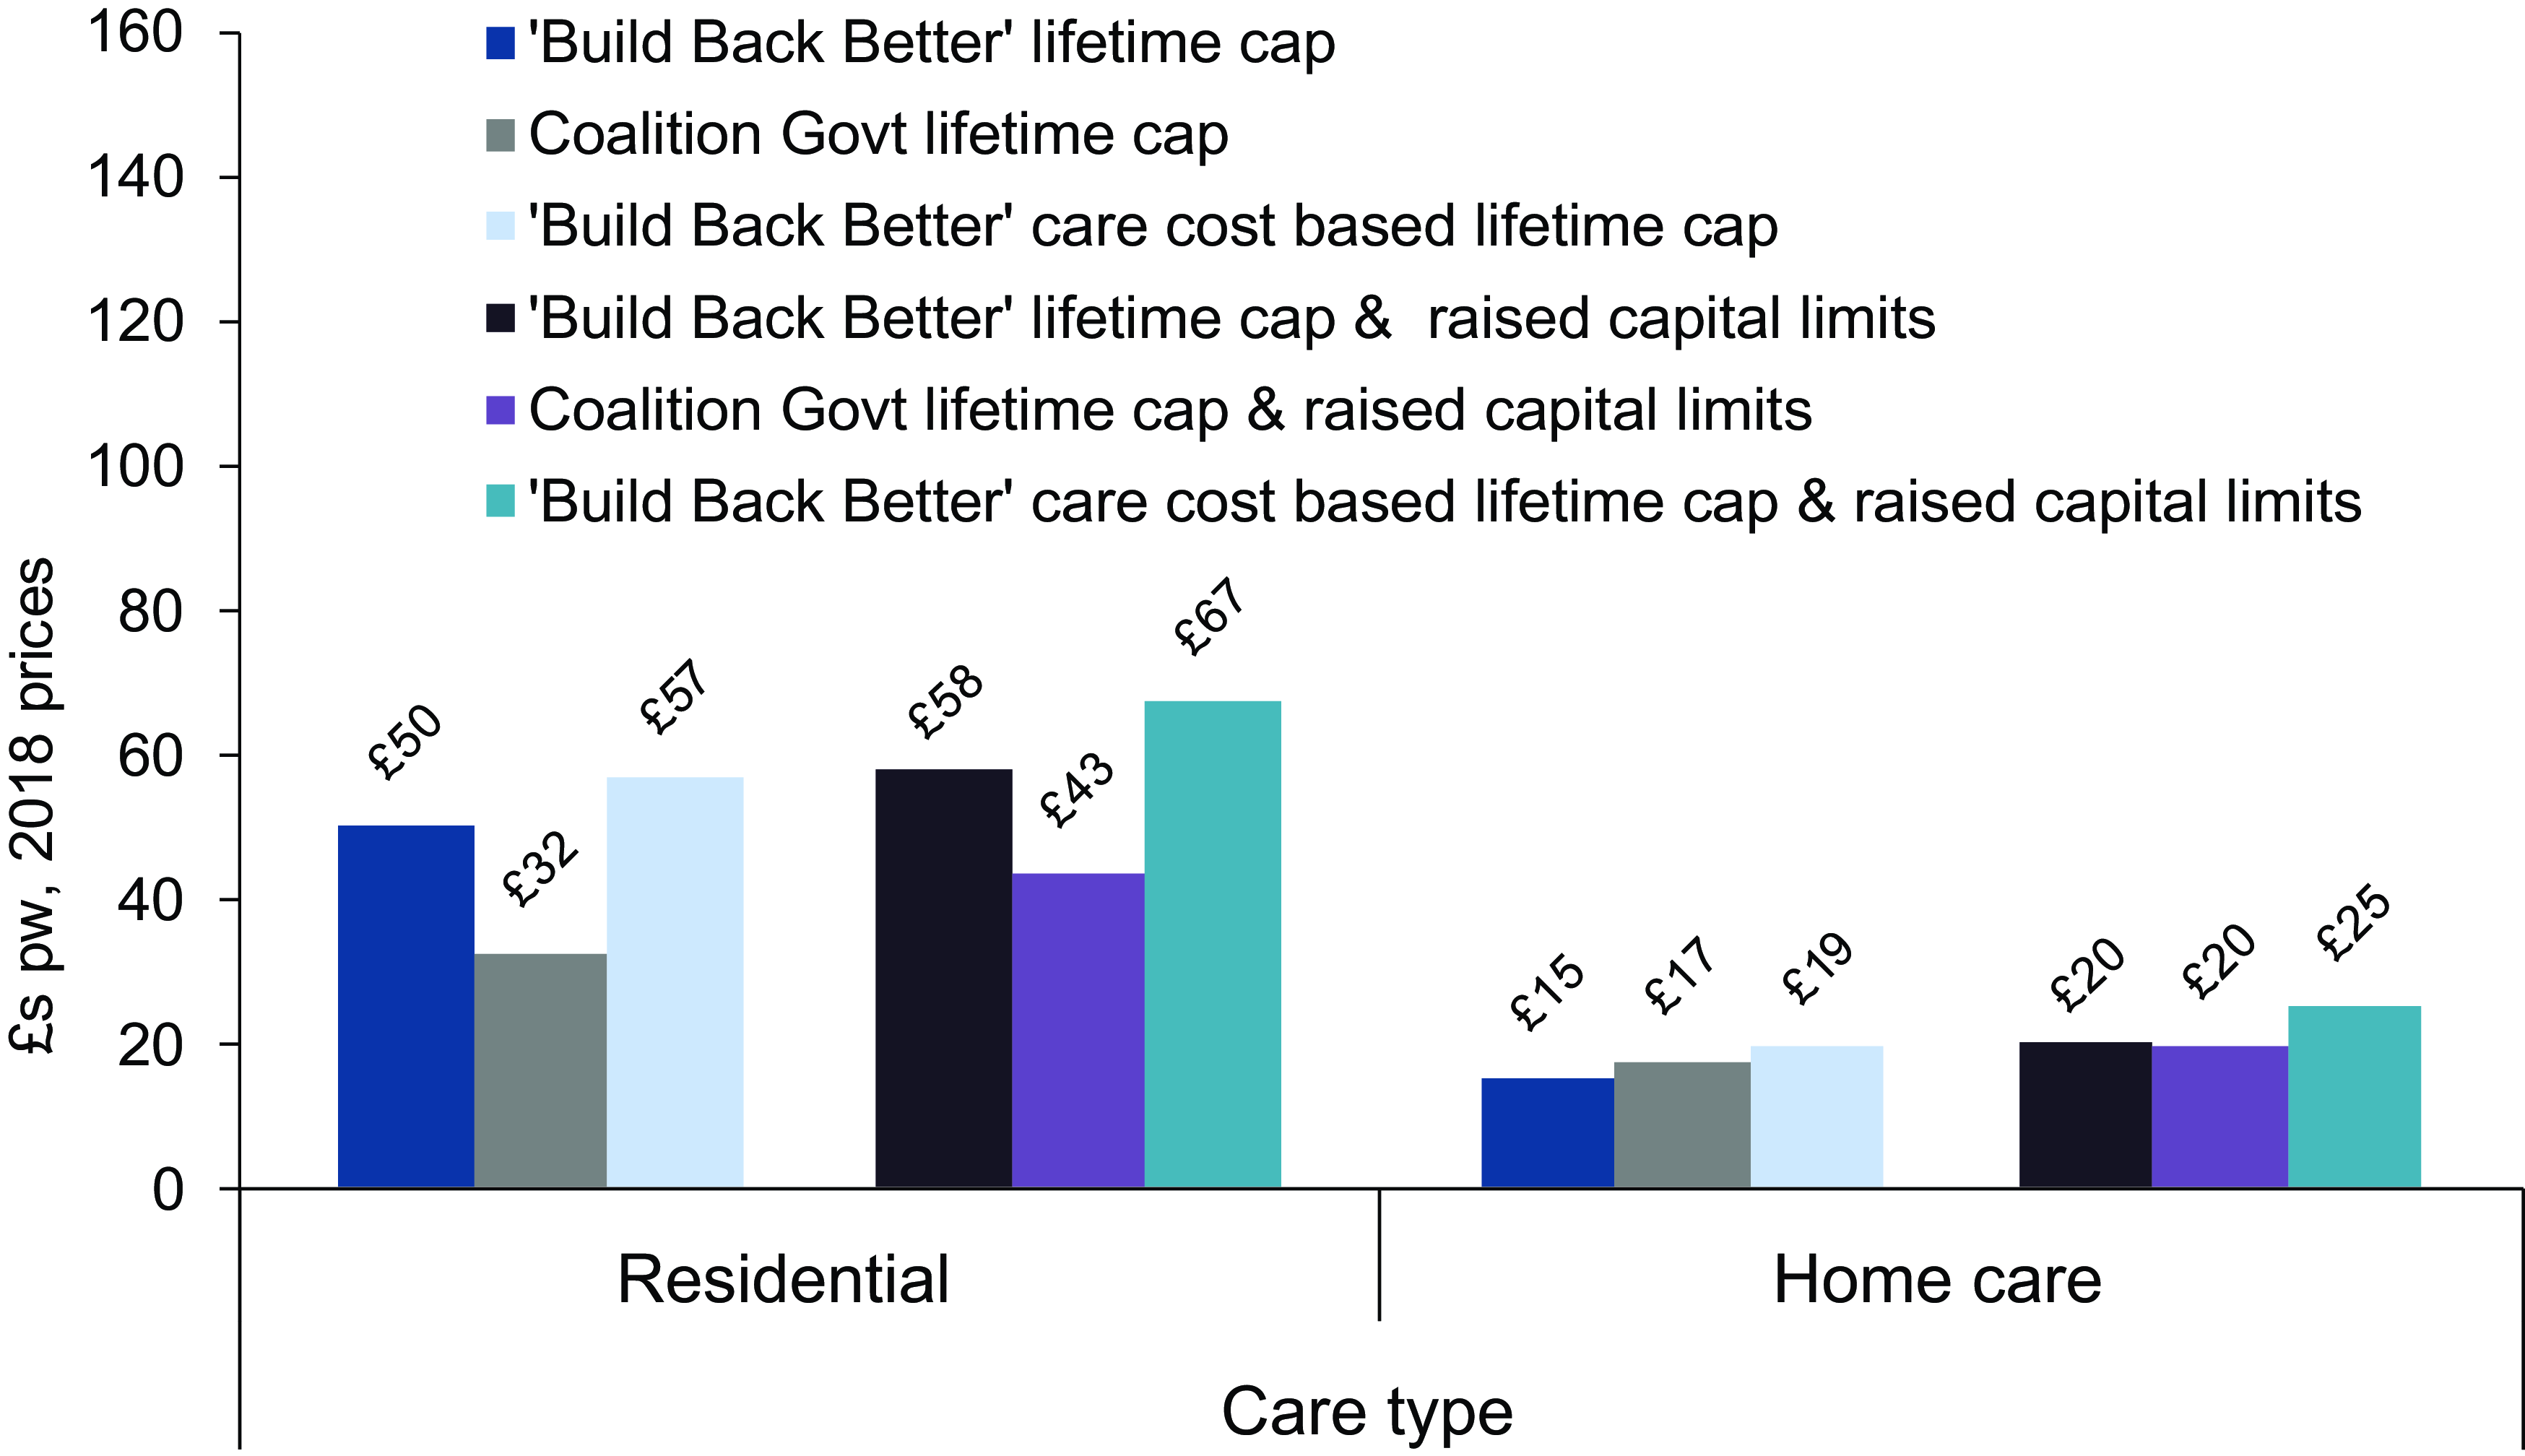
Figure 3. Average gains in 2028 from reform scenarios amongst care users aged 65+ by type of care, £s pw, 2018 prices. Source: CPEC and Caresim models.
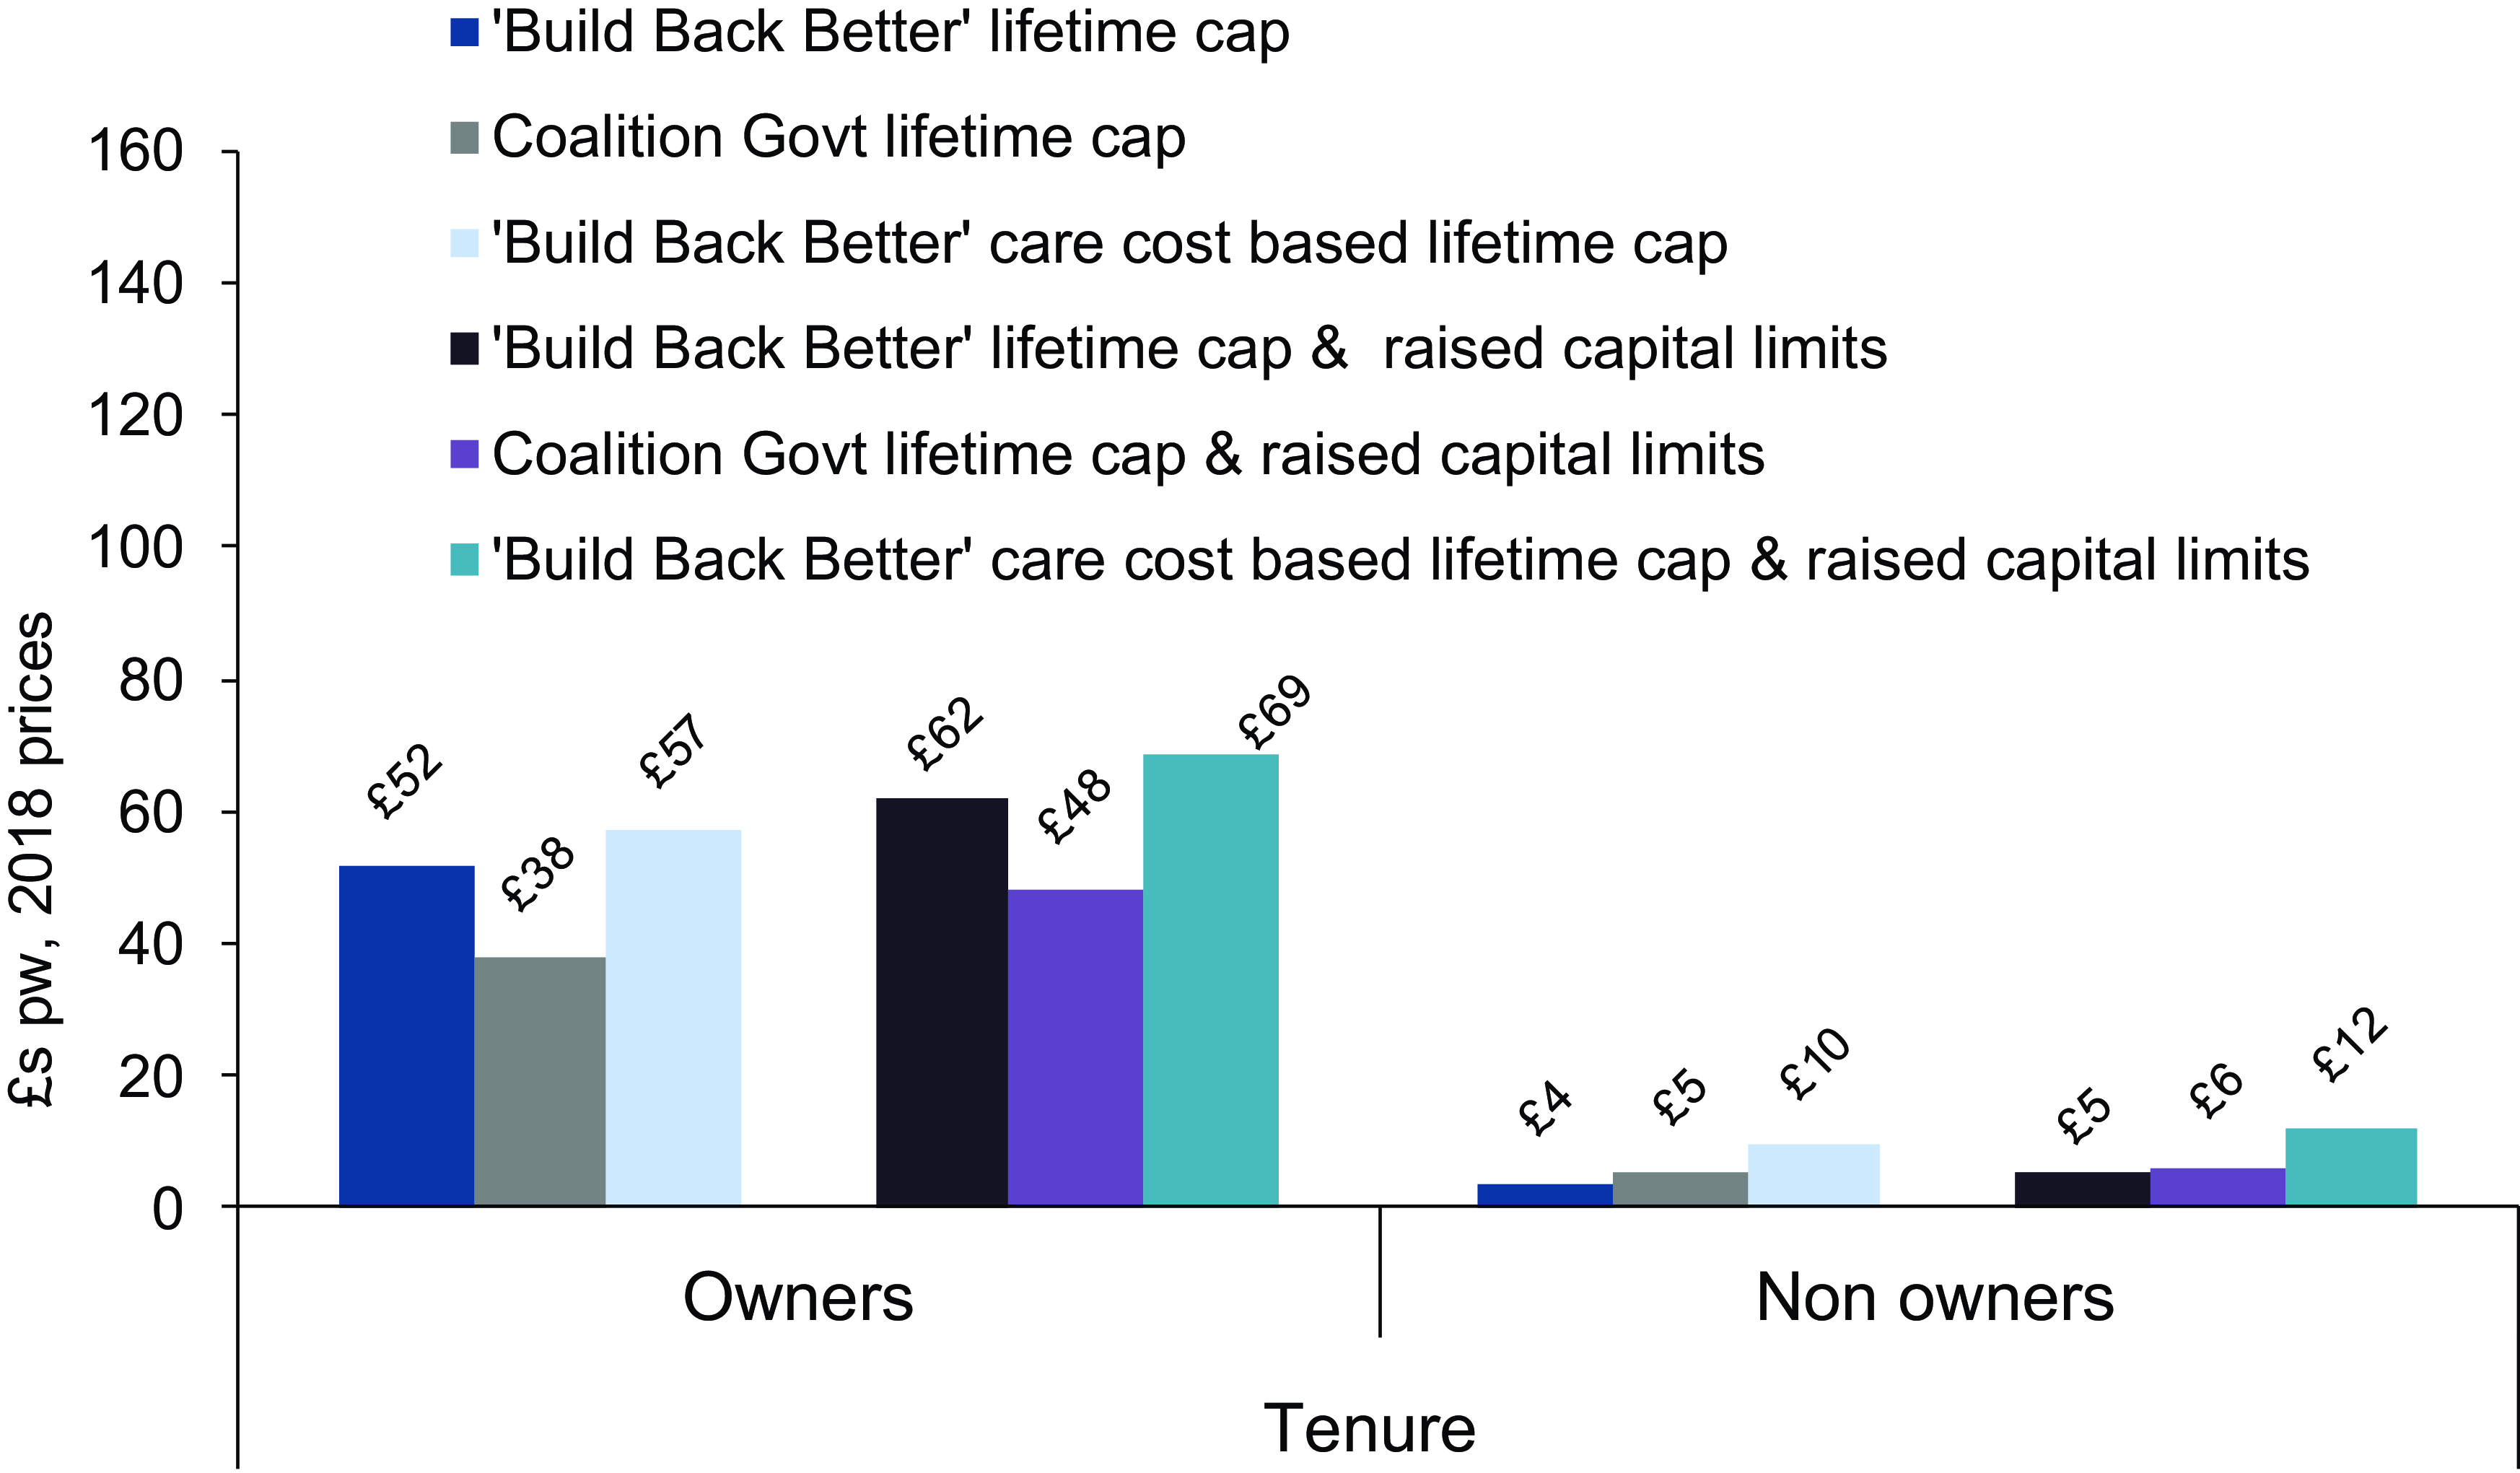
Figure 4. Average gains in 2028 from reform scenarios amongst care users aged 65+ by housing tenure, £s pw, 2018 prices. Source: CPEC and Caresim models.
The average gain of £58 a week for care home residents under the current government plans compares with £43 a week under the Coalition Government plans. The equivalent comparison for home-owners is £62 and £48 a week. For non home-owners and community care users, average gains are very similar under the two sets of reforms. For community care users, the larger increases in capital limits under current plans compensate for the less generous method of metering towards the cap.
We estimate that the average gain to non home-owners of the cap under current plans is just £4 per week, rising by £1 once the increases in capital limits are taken into account. The corresponding comparison for home-owners is £52 rising to £62.
If progress towards the cap were based on care costs rather than user contributions and combined with the current plans for a lifetime cap and raised capital limits, the impact would be proportionately greater for community care users than for care home residents. The average gain would be £25 per week rather than £20 for community care users; for residential care users, it would be £67 per week instead of £58. Although non-owners stand to gain much less than home-owners from both the current plans and those of the Coalition Government, the proportionate effect of basing metering on total care costs would be large for non-owners, more than doubling their average weekly gain to £12 per week from £5. The corresponding figures for home-owners are £69 and £62.
Figure 5 shows average weekly gains from the combined effects of lifetime caps and raised capital limits amongst care home residents and community care users according to their position in the 65+ income distribution. Equivalent charts separating the effects of the caps from the raised capital limits are given in Figure A4 in the Appendix. As has previously been shown (Adams et al., Reference Adams, Curry, Espuny Pujol, Hancock, Hu, King, Luheshi, Morciano, Pike and Wittenberg2018), lifetime caps tend to benefit those on relatively high incomes. Considering all care recipients (Figure 5a), those in the highest quintile of the income distribution will, on our estimates, be £71 per week (in 2018 prices) better off in 2028 under the reforms, than they would be if the current system continued, compared with £20 a week for those in the lowest income quintile. The difference between the gains for the highest income group and lowest income groups would be somewhat larger without the increased capital limits at £68 compared with £15 (Figure A4). The gradient across the income distribution is steeper for care home residents than for community care users.
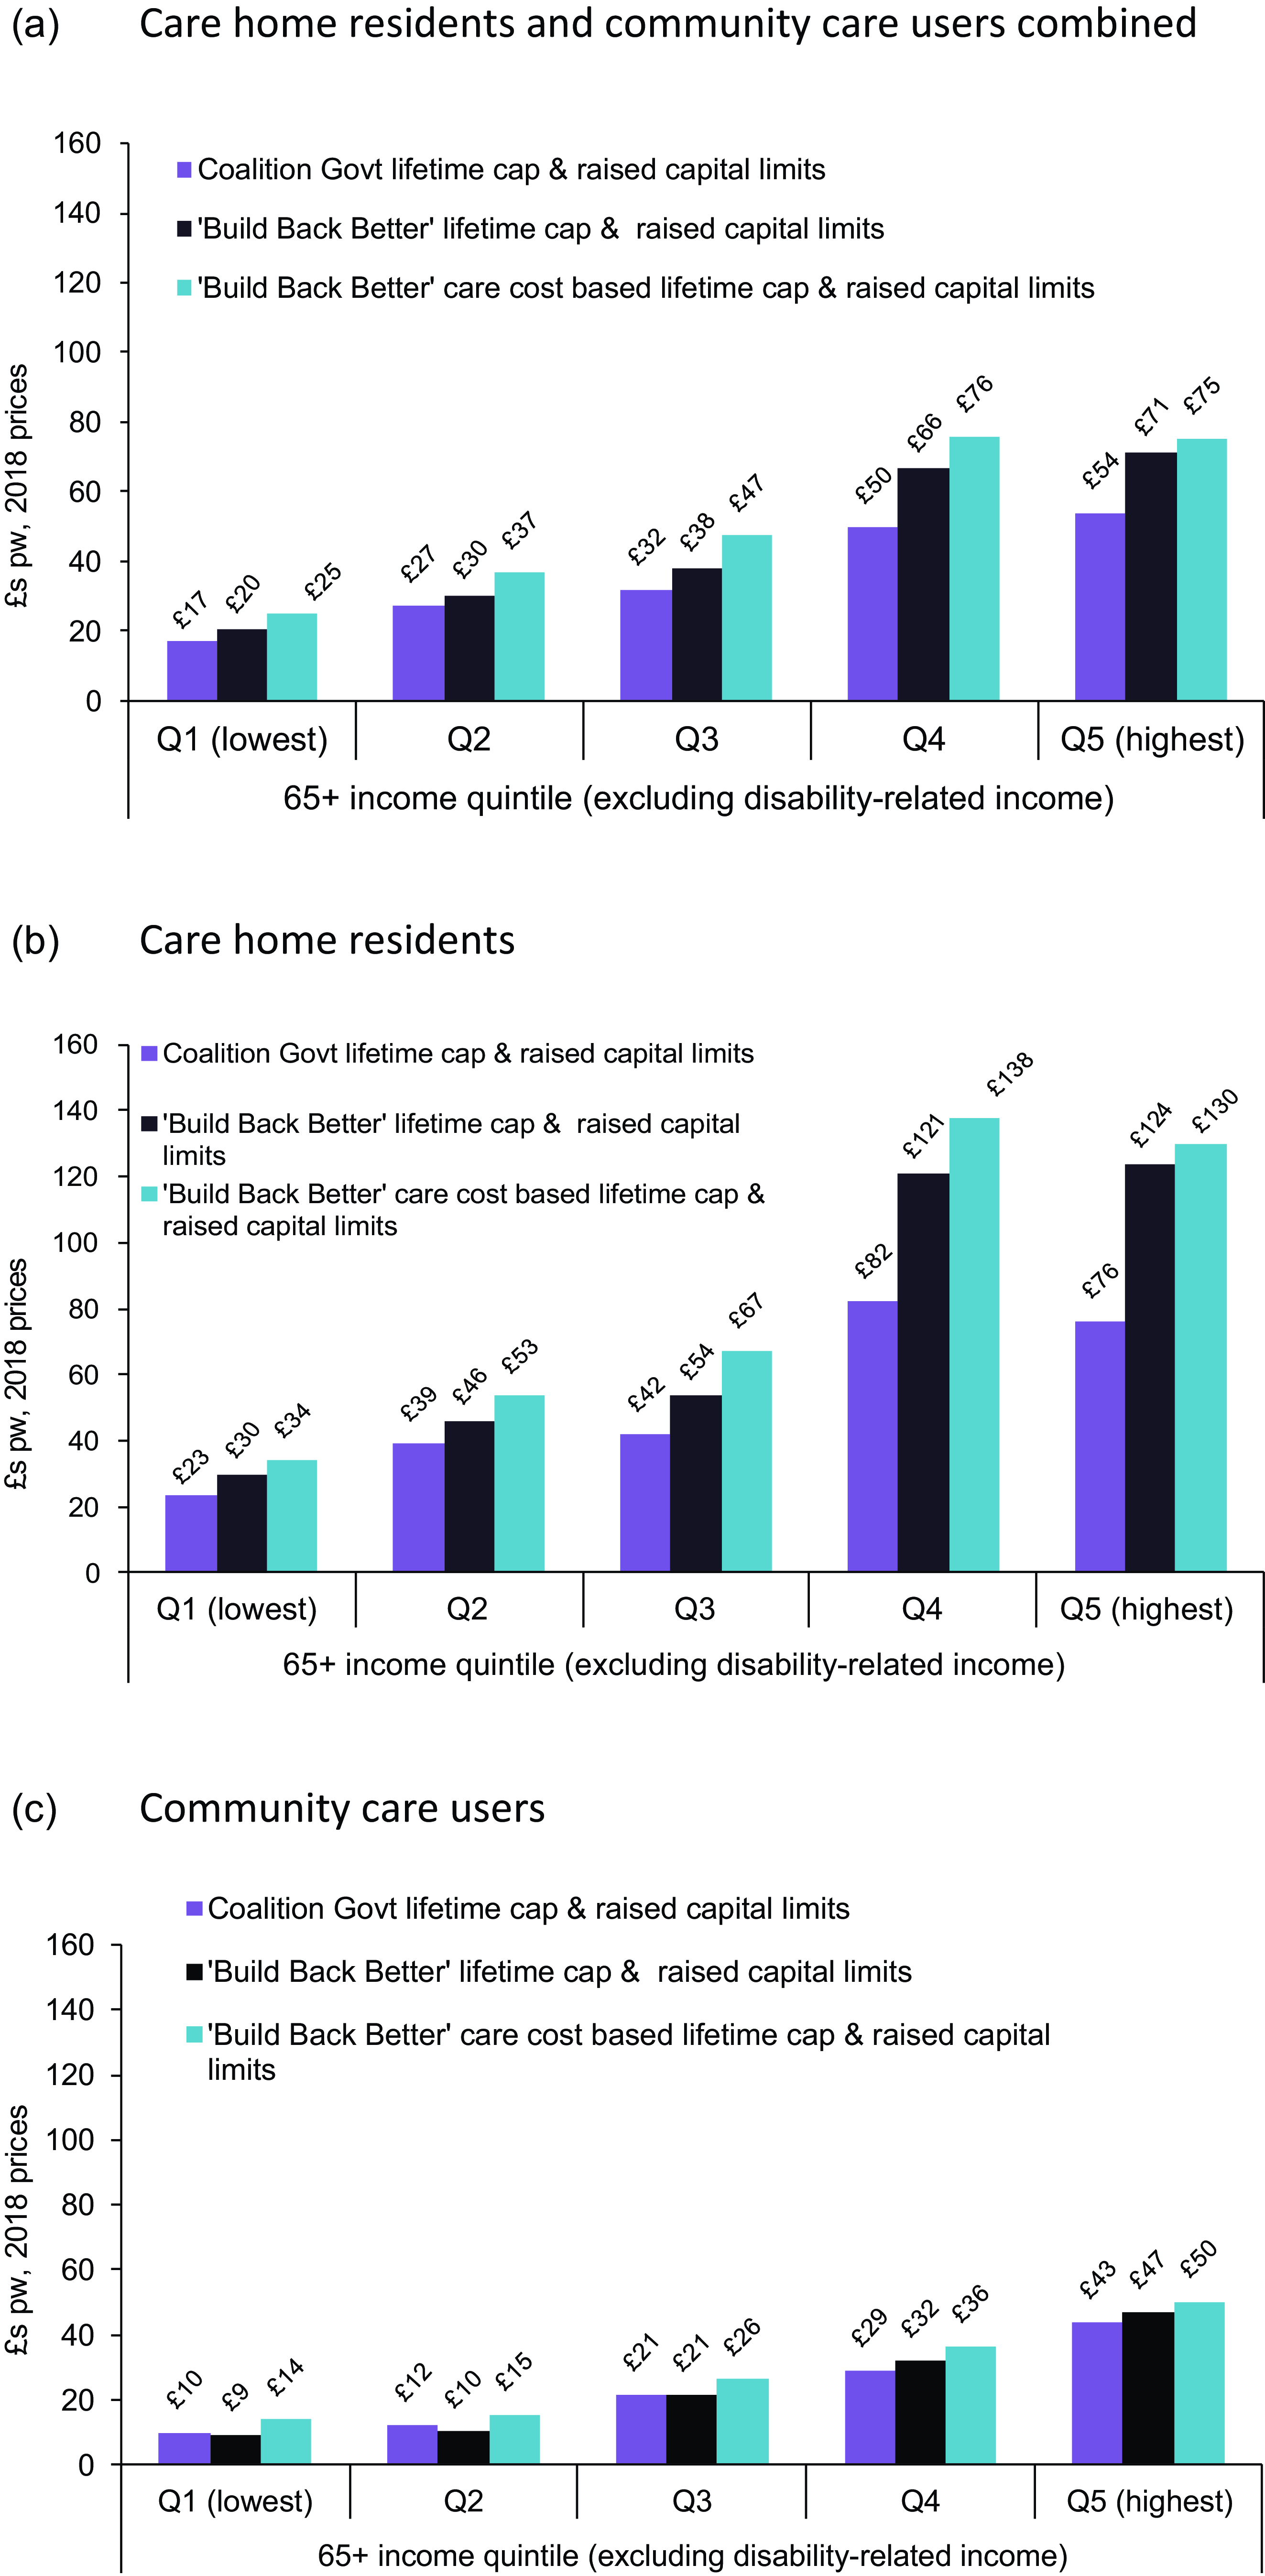
Figure 5. Average gains in 2028 from reform scenarios amongst care users aged 65+ by income, £s pw, 2018 prices. (a) Care home residents and community care users combined. (b) Care home residents. (c) Community care users. Source: CPEC and Caresim models.
If weekly gains from the scenarios are expressed as percentages of the user’s incomeFootnote 13 (Figure A5), the pattern across income groups is generally flatter. Average gains represent lower percentages of the income of higher-income care users and higher percentages of the incomes of lower-income users.
That absolute gains tend to be larger at higher income levels means that the reforms alter slightly the distribution by income level of net LA expenditure on long-term care for older people, with reduced shares being received by the lowest three income quintiles and higher shares being received by the highest two quintiles under each reform scenario (Figure A6). However, LA expenditure remains highly concentrated on the lowest income groups under each reform scenario.
5.3 Effects of the current LA fee rate applying to self-funders who reach the cap
So far we have assumed that under the latest planned reforms self-funding care home residents who reach the cap but are not eligible for any means-tested support with daily living costs would remain liable for the self-funder fee, albeit with their LA paying a contribution towards it. If instead, such self-funders move to the lower LA fee once they reach the cap, this would have minimal direct effectFootnote 14 on the LA expenditure but would reduce care homes’ incomes and benefit self-funders. We estimate that it would increase the proportion of non-NHS funded care home residents for whom care homes receive the LA fee rate from under a half under the current system to about two-thirds under the reformed system (Table 2). The result would be a drop in care homes’ income of about 5%. Given our assumed gap between LA and self-funder fees (Appendix Table A1), the increase in LA fee needed to avoid this drop would be about 10%. Such an increase would mean that average weekly care home income, excluding any FNC, from LA-funded residents would be about 85% of that from self-funders compared with 78% under the current system.
Table 2. Number of care home residents on LA fee rates and effect of reforms on care homes’ income, assuming LA fee rate applies to self-funders on reaching the cap, England, 2028–2038
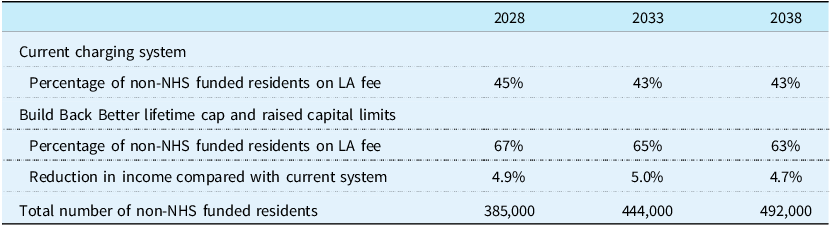
Source: CPEC and Caresim models.
Moving all self-funders who reach the cap onto current LA fee rates generates financial gains in all parts of the income distribution but they are largest at higher incomes where the concentration of self-funders is greatest (Figure 6).

Figure 6. Average gains in 2028 from Build Back Better reforms if LA fee rate applies to self-funders who reach the cap: care home residents aged 65+ by income, £s pw, 2018 prices. Source: CPEC and Caresim models.
6. Conclusion and discussion
We estimate that around 700,000 people aged 65 and over in England were receiving long-term care in 2018, of whom about half were living in care homes. At around 350,000 our estimate of the number of older people living in care homes in 2018 is a little higher than a recent ONS figure for 2019–20 of some 330,000 residents in care homes for older people or people with dementiaFootnote 15 (ONS, 2021, Table 7). We estimate that 55% of the 700,000 older long-term care users in 2018, received financial support from local authorities. We know of no external estimate with which to compare this figure. Drawing on data reported by Laing (Reference Laing2018), we estimate that 49% of care home residents aged 65+ were self-funding residents in 2018. This compares with the somewhat lower recently published ONS (2021) figure of 41% for residents in care homes for older people or people with dementia in 2019–20.
Our analysis indicates that public spending on older people’s long-term care would increase from £10.5 billion in 2018/19 to £20.8 billion in 2038/39 at 2018/19 prices under the current funding system but the latest planned reforms would generate a further £2.1 billion of spending in 2028/29 and £2.9 billion in 2038/39 (at 2018 prices), respectively. Official estimates put the 2028/29 cost for older adults of the charging reforms if implemented in October 2023 (expressed in 2021/22 prices) at £2.42 billion with savings on disability benefits of £0.24 billion (DHSC, 2022, Table 1). This produces a net cost of £2.18 billion which is very close to our estimate, although ours is in 2018/19 prices. Both estimates are smaller than that estimated by the County Councils Network (2022), which does not use microsimulation methods to model the means test reforms. We find that the Conservative government’s plans were more generous than those of the preceding Coalition Government, even though progress towards the cap would be slower for some.
A strong correlation between income, wealth and home-ownership among older people underlies our results on the distributional effects of the reforms. Our finding that older care recipients tend to have lower income and wealth than older people in general, is consistent with the picture that emerges from DHSC’s impact assessment of the reforms (DHSC, 2022). Our analyses indicate that the average gains for care recipients vary according to the care settings, home ownership, and levels of income. Average gains for care recipients in the highest income quintile are projected to be £71 per week in 2028, compared with £20 per week for the lowest income quintile. This matches official analysis which demonstrates that although state spending on long-term care for older people will remain concentrated on lower income groups, it will rise most amongst higher income groups (DHSC, 2022, Figures 19 and 20).
The plan to measure progress towards the cap based on user contributions has been criticised for reducing the cap’s benefits to people with modest amounts of wealth (Health Foundation, 2021; Sturrock and Tallack, Reference Sturrock and Tallack2022). We estimate that 32% of care home residents currently contribute only to the daily living cost component of their fees, so cannot benefit from a cap however progress towards it is measured (Figure A2a). Another 53% are self-funders. They will benefit from the cap to the same extent whichever method is used to metre towards it. It is only the remaining 15% who are affected by the choice of method. In contrast, all community care users who contribute anything towards their care costs are potential gainers from the cap. The majority (67%, Figure A2b) are LA funded, so not contributing to the full cost of their care and therefore affected by the method used to metre towards the cap. Our analysis suggests that the cost of adopting the Coalition Government’s method of metering as part of the current Build Back Better plans is likely to be around £0.4 billion in 2028 rising to £0.5 billion in 2038. There is clearly a trade-off between the method of metering and other aspects of the current plans which are more generous than the Coalition Government’s plans. These include the lower level of daily living costs component of care home fees which is itself a key determinant of the speed of progress towards the cap.
Despite the general correlation between income, home-ownership and non-housing wealth, of people in the lowest income quintile, as many as 40% are homeowners. Low-income care home residents who own their homes deplete their capital comparatively quickly because they have relatively little income to put towards care home fees while being excluded from any LA funding until they reach the upper capital limit. Both the cap and the increases in capital limits may benefit them. If they have relatively low-value homes, they may deplete their capital to the new higher upper capital limit before reaching the cap, at which point their progress towards the cap will become slower as their contribution becomes smaller and they may or may not ever reach the cap. This is an example of a more general issue of interactions between the two components of the reform and the need to consider their combined effect.
If all self-funding care home residents who reach the cap are, at that point, moved onto the lower fees paid for LA-funded residents, with no increase in those fees, we estimate that this would reduce care homes’ income by around 5%. To avoid this, an increase of some 10% in LA fees could be needed. However, even if all self-funders who reach the cap can access the lower LA fees, some may choose not to do so if that entails a change of room or care home.
Our findings are dependent on economic and other assumptions about the future. Differences between sets of official economic forecasts produced in recent years highlight the considerable uncertainty involved. We have previously shown that projected costs of long-term care for older people are sensitive to assumptions on the future path of social care costs (Hu et al., Reference Hu, Hancock and Wittenberg2020). Our analysis assumes that the unit costs of care, such as the costs of an hour’s community care, will rise in line with projections for average earnings, and a proportion (62.5%) of the care bill will be affected by planned rises in the national living wage (NLW) to 2024. Whether wages in the care sector will rise in line with average earnings is debatable. Arguably, a shortage of care staff could lead to increased competition among care providers, imposing upwards pressure on wages. As care demand continues to grow, as we have projected in this study, the gap between demand for and supply of care workers may widen, further accelerating wage increases. The impact of the increase in the NLW on wages in the sector is also uncertain.
In addition, the longer-term impacts of the Covid pandemic on the number of care users, availability of unpaid care, productivity, earnings, price inflation and unit costs remain very uncertain (Morciano et al., Reference Morciano, Stokes, Kontopantelis, Hall and Turner2021). Analyses have been conducted in the past to account for the uncertainties of projected expenditure associated with future disability prevalence (Hu et al., Reference Hu, Hancock and Wittenberg2020). Those analyses provide an indication of the precision of the estimates reported in this study. Increases in childlessness and decreases in the number of adult children in the older population will affect demand for informal and formal care (Broese van Groenou and De Boer, Reference Broese van Groenou and De Boer2016). These demographic changes are not the focus of the analyses because they impact care expenditure in both the base case and the reformed scenarios whereas our study has set out to examine the direct impacts of care reforms.
We have not modelled regional variations in the unit costs of care which will affect the regional distribution of benefits from the reforms (Wittenberg, Reference Wittenberg2016; Tallack and Sturrock, Reference Sturrock and Tallack2022). Nor have we modelled any increase in demand which might result from the fall in price of care that some would face as a result of the reforms. Any increase in demand for publicly-funded care would mean that the increase in public expenditure in the reformed scenarios would be higher than we have reported in this paper. This is a limitation of the study but we know of no UK data on which to estimate the price-elasticity of demand for care. Moreover, we expect that the behavioural effect for residential care would be small since there is evidence that older people generally want to remain in their own home as far as possible rather than move to a care home (Pani-Harreman et al., Reference Pani-Harreman, Bours, Zander, Kempen and van Duren2021). The impact on local authority costs would also be limited since LA support would still be dependent on an assessment of care needs under the LA’s eligibility criteria.
The previous government stated (HMG, 2021; DHSC, 2021) that its goal was a fairer long-term care system. Our distributional analyses provide some evidence on the extent to which the planned reforms would achieve a fairer system. However, debate is hampered by the absence of an agreed framework for assessing the equity of the care system. Basing progress towards the cap on user contributions rather than care costs has been criticised because it means those with lower capital have to use a higher proportion of it to pay for care than those with higher capital (Health Foundation, 2021; Sturrock and Tallack, Reference Sturrock and Tallack2022). And it has been suggested that a cap set at a proportion of someone’s capital would be fairer (Brown Reference Brown2022) (although there would be practical challenges (DHSC, 2022)). While the proportion of capital used to pay for care may be one consideration, there are many other potential dimensions to fairness in social care funding (Wanless, Reference Wanless2006) including income. While our models capture the cross-sectional effects of reforms on social care users, they are more limited in analysing lifetime effects on individuals. The degree to which lifetime gains are distributed differently from cross-sectional gains will depend in part on the associations between durations of care receipt and socio-economic characteristics. To our knowledge, no data exist on these associations for England.
The extent to which average gains for care recipients are unequal in our analysis depends also on how they are compared. Inequality may be larger when average gains are compared in absolute than relative (percentage of income) terms, or vice versa. In the absence of an agreed and explicit definition of equity in the long-term care funding system, it remains useful to provide evidence for a range of measures.
A lifetime cap on how much individuals must pay towards their long-term care costs is not, to our knowledge, a feature of many countries’ long-term care funding systems. An exception is Australia which since 2014 has had both a lifetime and annual cap as well as means-testing of contributions.Footnote 16 Other methods for avoiding catastrophic care costs include a time limit on the inclusion of housing wealth in the means test for residential care as in Ireland (Hashiguchi and Llena-Nozal, Reference Hashiguchi and Llena-Nozal2020) and of course, social insurance systems which severely limit out-of-pocket expenses. The lessons from our analysis are likely to be relevant beyond England, especially for countries which have substantial user charges. Consideration of interactions between lifetime caps and aspects of the means test are particularly important, especially if there are to be changes to the means test at the same time as a cap is introduced. Inevitably reforms which make a mean test less stringent tend to benefit those precluded from state support by the pre-existing means test. In general, they will be the better off. Our distributional analysis demonstrates the tension between protecting people with substantial capital who experience lengthy durations of care receipt from ‘catastrophic’ lifetime care costs and reducing the weekly costs faced by potentially many more people, including those on more modest means.
Homeownership varies greatly in among European countries. In England, where homeownership rates amongst older people are high and housing wealth typically accounts for the majority of an individual’s wealth, the inclusion of housing wealth in the capital test is controversial. The reforms we examined are particularly beneficial for homeowners. However, in countries where homeownership is lower, the treatment of housing wealth (and indeed of capital in general) in any means test may be less important than the treatment of income. A study of 16 European countries shows that the proportion of older people aged 50 and over living in rented housing (i.e. not owning their homes) varies considerably, from 39% in Switzerland to 19% in France (Herbers and Mulder, Reference Herbers and Mulder2017). A more recent study by Marcinkiewicz and Chybalski (Reference Marcinkiewicz and Chybalski2024) reported that the proportion is even higher in Austria (56%) and Germany (47%).
Which costs count for the purposes of a cap and for means-testing and how they, and other parameters of the system are adjusted for inflation is key and can have consequences for the public costs and benefits to individuals. Furthermore, if, as in England, the prices that care providers receive for self-funders and publicly supported users differ and a cap or change to the means tests alters the balance between the two groups, providers’ incomes will be affected unless prices change. At the very least, any analysis of reforms to complex means-testing arrangements and the introduction of a cap needs to be explicit on a wide range of assumptions on details of the reforms including how they will evolve over time.
Finally, our analyses have focused on the cash benefits of reforms amongst current and future users of care. A central objective of a lifetime cap on the amount individuals must contribute towards their care, is to provide ‘peace of mind’ from knowing that they will not need to meet in full the potentially ‘catastrophic’ costs of care. This benefits everyone who might have to pay for their care for a long period. However, placing a monetary value on this peace of mind is not straightforward.
Supplementary material
The supplementary material for this article can be found at https://doi.org/10.1017/S1744133125000088
Acknowledgements
The aggregate projections models were originally developed by the Personal Social Services Research Unit (PSSRU at the University of Kent and LSE) and the CARESIM microsimulation model was developed by Ruth Hancock while at the University of East Anglia and previous Universities. Material from the Family Resources Survey and the Health Survey for England is crown copyright and has been made available via the UK Data Archive.
The analysis set out in this report is the responsibility of the authors and the views expressed are those of the authors and not necessarily those of the Nuffield Foundation, National Institute for Health Research (NIHR) or the Department of Health and Social Care.
Financial support
The research on which this paper arises in part from a project (Care and State Pensions Reforms, CASPeR) funded by the Nuffield Foundation, an independent charitable trust with a mission to advance social well-being. Updating and maintenance of the models used in the paper has been part-funded by the NIHR Policy Research Programme through its core support to the Adult Social Care Research Unit.
Competing interests
None.


 Open access