


1. Introduction
Health technology assessment (HTA) processes provide evidence to support the supply of healthcare (Mirelman et al., Reference Mirelman, Goel and Edejer2025). Evidence of a healthcare technology’s value for money forms an input to the process, with cost-effectiveness analysis (CEA) being a commonly used approach to inform this. This evidence includes a summary of how the technology changes costs and health outcomes, typically utilising generic units of health such as quality-adjusted life years (QALYs) gained or disability-adjusted life years (DALYs) averted. The results of the CEA are often compared to a cost-effectiveness threshold (referred to hereafter as a ‘policy threshold’) as a basis for judging value for money.
The appropriate level and source for policy thresholds have been the subject of debate (Sampson et al., Reference Sampson, Zamora, Watson, Cairns, Chalkidou, Cubi-Molla, Devlin, García-Lorenzo, Hughes, Leech and Towse2022; Thokala et al., Reference Thokala, Ochalek, Leech and Tong2018; Vallejo-Torres et al., Reference Vallejo-Torres, García-Lorenzo, Castilla, Valcárcel-Nazco, García-Pérez, Linertová, Polentinos-Castro and Serrano-Aguilar2016). Two categories are broadly considered: demand-side thresholds and supply-side thresholds. The former represents the amount of private consumption individuals are willing to give up (or their ‘willingness-to-pay’) for health gains and the latter represents the healthcare cost of producing health gains at the margin in the healthcare system. Demand-side values are most relevant when the objective is to reflect societal preferences about how much should be spent on health. Supply-side estimates, by contrast, aim to capture the health opportunity costs of additional spending within the healthcare system. These opportunity costs arise whether new health technologies are funded by displacing existing activities or by drawing in new resources, since in both cases there are alternative uses of those resources that are forgone. Taken together with a supply-side estimate, a demand-side estimate can inform whether the public budget for healthcare should be expanded. Recent research has considered this in England, estimating the marginal productivity of existing spending (supply side) and the social value of additional expenditure (demand side) for England’s National Health System (Lomas et al., Reference Lomas, Longo, Salas-Ortiz and Claxton2025).
When HTA processes recommend the use of a technology, this induces changes in the allocation of healthcare resources, and the health consequences from the expansion or contraction of prior activity is referred to as the health opportunity cost. If a new technology generates more health for a given cost than the existing system would produce with that same money then it is considered cost-effective. Empirical estimates of the supply-side threshold have been reported in the literature for a number of countries (Edney et al., Reference Edney, Lomas, Karnon, Vallejo-Torres, Stadhouders, Siverskog, Paulden, Edoka and Ochalek2022; Pichon-Riviere et al., Reference Pichon-Riviere, Drummond, Palacios, Garcia-Marti and Augustovski2023). They are estimated by modelling the relationship between changes in healthcare expenditure and health outcomes and are alternatively referred to as the marginal productivity of healthcare expenditure. We refer to such estimates of the public payer costs of producing one additional unit of health as ‘k’.
There is a body of research empirically estimating k (Edney et al., Reference Edney, Lomas, Karnon, Vallejo-Torres, Stadhouders, Siverskog, Paulden, Edoka and Ochalek2022) but it is unclear if this is reflected in HTA guidelines. It is important for those developing HTA guidelines and those undertaking CEA to point to estimates of k to assess the health opportunity cost relative to the policy thresholds as there are real consequences for population health if they do not align. If the policy threshold is too high, then HTA decisions can reduce population health through the approval of new technologies whose health opportunity cost is greater than the health generated by the technology. If it is too low, then new healthcare technologies that could increase population health may be rejected.
Policy thresholds used in HTA processes may be implicit, based on precedent or heuristics such as the World Health Organisation’s (WHO) historic recommendation of 1-3 x gross domestic product (GDP) per capita, or they may be intended to reflect alternative considerations than health opportunity cost alone (Gafni and Birch, Reference Gafni and Birch2006; Rawlins et al., Reference Rawlins, Barnett and Stevens2010; Santos et al., Reference Santos, Guerra-Junior, Godman, Morton and Ruas2018; Schwarzer et al., Reference Schwarzer, Rochau, Saverno, Jahn, Bornschein, Muehlberger, Flatscher-Thoeni, Schnell-Inderst, Sroczynski, Lackner, Schall, Hebborn, Pugner, Fehervary, Brixner and Siebert2015; Thokala et al., Reference Thokala, Ochalek, Leech and Tong2018). HTA organisations may also accommodate the valuation of outcomes beyond health and/or costs outside of the healthcare system, in which case any appropriate empirical reference for a policy threshold would need to mirror this perspective (Walker et al., Reference Walker, Griffin, Asaria, Tsuchiya and Sculpher2019).
In the most common contexts, where health systems aim to maximise population health and HTA processes adopt a healthcare payer perspective (ie. considering only costs incurred by the healthcare payer, typically government), empirical estimates of k can provide the sole relevant information for establishing a value-for-money threshold (Brouwer et al., Reference Brouwer, van Baal, van Exel and Versteegh2019). By contrast for those taking a broader perspective, for example a societal perspective, the k estimate may be necessary to establish the net health impact but would not be sufficient to inform the policy threshold and value for money. Additional challenges arise in health systems where the costs are not borne entirely from public budgets and financing includes out-of-pocket (OOP) payments (such as co-payments) to access healthcare. These may represent a source of financing for healthcare but not be explicitly distinguished from other sources of finance in the HTA process. The source of financing can influence how the health opportunity cost is interpreted and have implications for whether k may be considered a suitable reference for a policy threshold.
Despite the potential important consequences of misalignments in policy thresholds and estimates of k, to date there is limited evidence comparing them. A review by Espinosa et al., (Reference Espinosa, Rodríguez-Lesmes, Romano, Orozco, Basto, Ávila, Mesa and Enríquez2024a) investigated the influence of thresholds in the HTA decision making of nine countries with either an explicit policy threshold or an estimate of k but did not compare the two. A scoping review and empirical analysis by Vallejo-Torres et al., (Reference Vallejo-Torres, Garcia-Lorenzo, Edney, Stadhouders, Edoka, Castilla-Rodriguez, Garcia-Perez, Linertova, Valcarcel-Nazco and Karnon2022) explored the use of published estimates of the health opportunity cost in CEA published in the scientific literature and limited their sample to two countries. Our aim is therefore to compare policy thresholds in HTA guidelines with published empirical estimates of k. To our knowledge this will be the first concise reference that maps, side-by-side, HTA policy thresholds and published k estimates.
2. Methods
We collated the evidence of explicit policy thresholds reported in HTA guidelines and the evidence of empirical estimates of k which we define as the public payer costs of producing one additional unit of health. HTA guideline documents were obtained from a review by Breslau et al., (Reference Breslau, Cohen, Diaz, Malcolm and Neumann2023) which identified 53 country and region-specific guidelines and technical manuals. We included HTA guidelines regardless of the official status of the HTA process, such as whether the recommendations are mandated within the national healthcare system, or whether they are legally binding in determining the provision of healthcare services. We excluded guidelines that could not be linked to a specific country because estimates of k focus on national level health care marginal productivity. We excluded those that did not relate to publicly financed healthcare. Where region-specific guidelines were included in the original Breslau study, we identified the respective countries in the regional guidelines and sought corresponding national level HTA guidelines. Guidelines which could not be retrieved were excluded. Where we were aware of additional guidelines or updated guidelines to those reported in Breslau et al. we included them.
From the HTA guidelines we extracted the country/region; HTA organisation; HTA guideline name; HTA guideline reference; recommended perspective for CEA; explicit policy threshold range referenced in the guidelines along with any justification reported in the guideline; inclusion of non-health care costs, including OOP payments; the description of included OOP payments in guidelines; and recommended health outcomes. As well as recording the described perspective, we categorised the perspective based on the definition provided by Kim et al., (Reference Kim, Silver, Kunst, Cohen, Ollendorf and Neumann2020). In summary, a health payer perspective includes costs incurred by a third-party health payer such as a government; a health sector perspective includes all health costs regardless of who bears the cost such as OOP payments; a limited societal perspective includes all costs such as transportation and productivity but excludes other public sectors such as education; and a societal perspective includes all costs. The full definitions are reported in the supplementary material.
Empirical estimates of k were identified from a review by Ochalek et al. this special issue, which identified 18 empirical estimates of k with 15 country-specific estimates and 3 studies that estimate across a wide range of countries. We included studies that represent a country or region and excluded global estimates. From the included studies we extracted the empirical estimate of k; the outcome metric (ie. QALY or DALY); the currency; and the year k is estimated for.
We undertook a narrative synthesis of the results as our primary interest lay in comparing the explicit policy threshold and estimates of k within-country. To facilitate comparisons, we converted estimates of k and policy thresholds to international dollars (I$) using purchasing power parity estimates from the World Bank (World Bank Group, 2025b). We report k with reference to the date the corresponding study was published, and nominal policy thresholds with reference to the date the corresponding HTA process document was published. Explicit thresholds of the form ‘multiples of GDP’ will by their nature be dynamic and update with GDP, whereas nominal thresholds would not update without amendment to the HTA process documents, and typically these are not frequently updated. We therefore report estimates of GDP in 2024 I$ (World Bank Group, 2025a).
To demonstrate the net health impacts of approving new technologies at the policy threshold, we report the health generated from spending $1mn on a health technology (or technologies) with an incremental cost-effectiveness ratio (ICER) at the policy threshold and compare this to the health that empirical estimates of k indicate a health system would get from spending $1mn within the current health system. We calculate this using the lower bound of the policy threshold as this shows the minimum health lost by approving a new technology that has an ICER at the policy threshold range. This assumes all health technologies are, on average, accepted at a cost per QALY equal to the explicit policy threshold and all health spending being displaced has, on average, a cost per QALY equal to the k estimate.
3. Results
Our results include 47 HTA guidelines across 46 countries, presented in Table 1. The studies excluded and the reasons for exclusion are reported in the supplementary material.
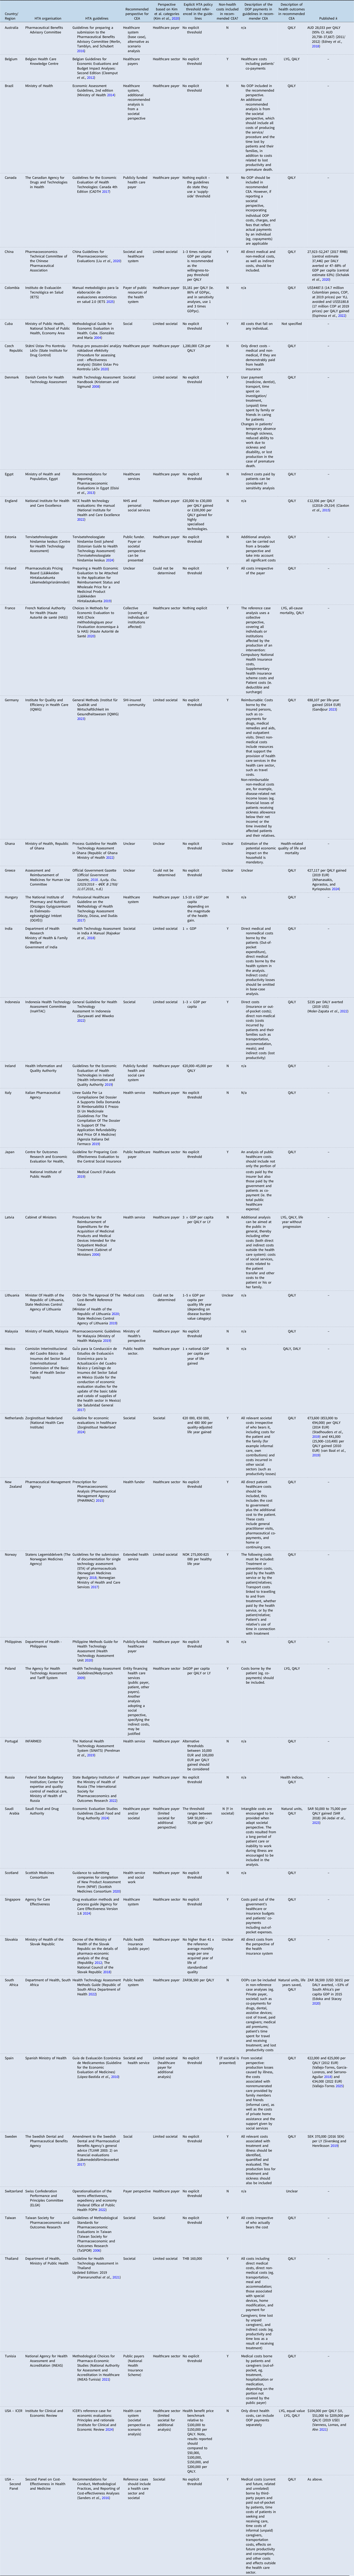
Table 1. HTA guidelines and published estimates of k

EUR, euros; GDP, gross domestic product; HTA, health technology assessment; NICE, National Institute for Health and Care Excellence; OOP, out-of-pocket; QALY, quality-adjusted life year; SHI, statutory health insurance.
Of the 46 included countries with HTA guidelines, 32 (70 percent) were high income countries, nine were upper-middle income (19 percent) and five were lower-middle income (11 percent).
In total, 20 countries had guidelines that stated an explicit policy threshold. Eight of these were based on multiples of GDP per capita in the country (China, Hungary, India, Indonesia, Latvia, Lithuania, Mexico and Poland); three have thresholds that align with published estimates of cost-effectiveness thresholds (Colombia, Saudi Arabia and South Africa); one policy threshold was based on a multiple of the average monthly wage (Slovakia); and for eight no clear justification was given (Czech Republic, England, Ireland, Netherlands, Norway, Portugal, Thailand and USA-ICER guidelines).
Empirical estimates of k were available for thirteen (30 percent) of the countries for which we reviewed HTA guideline documents (Australia, China, Colombia, England, Germany, Greece, Indonesia, Netherlands, Saudi Arabia, South Africa, Spain, Sweden and the United States). A summary table of the countries with explicit policy thresholds and estimates of k is provided in the supplementary material.
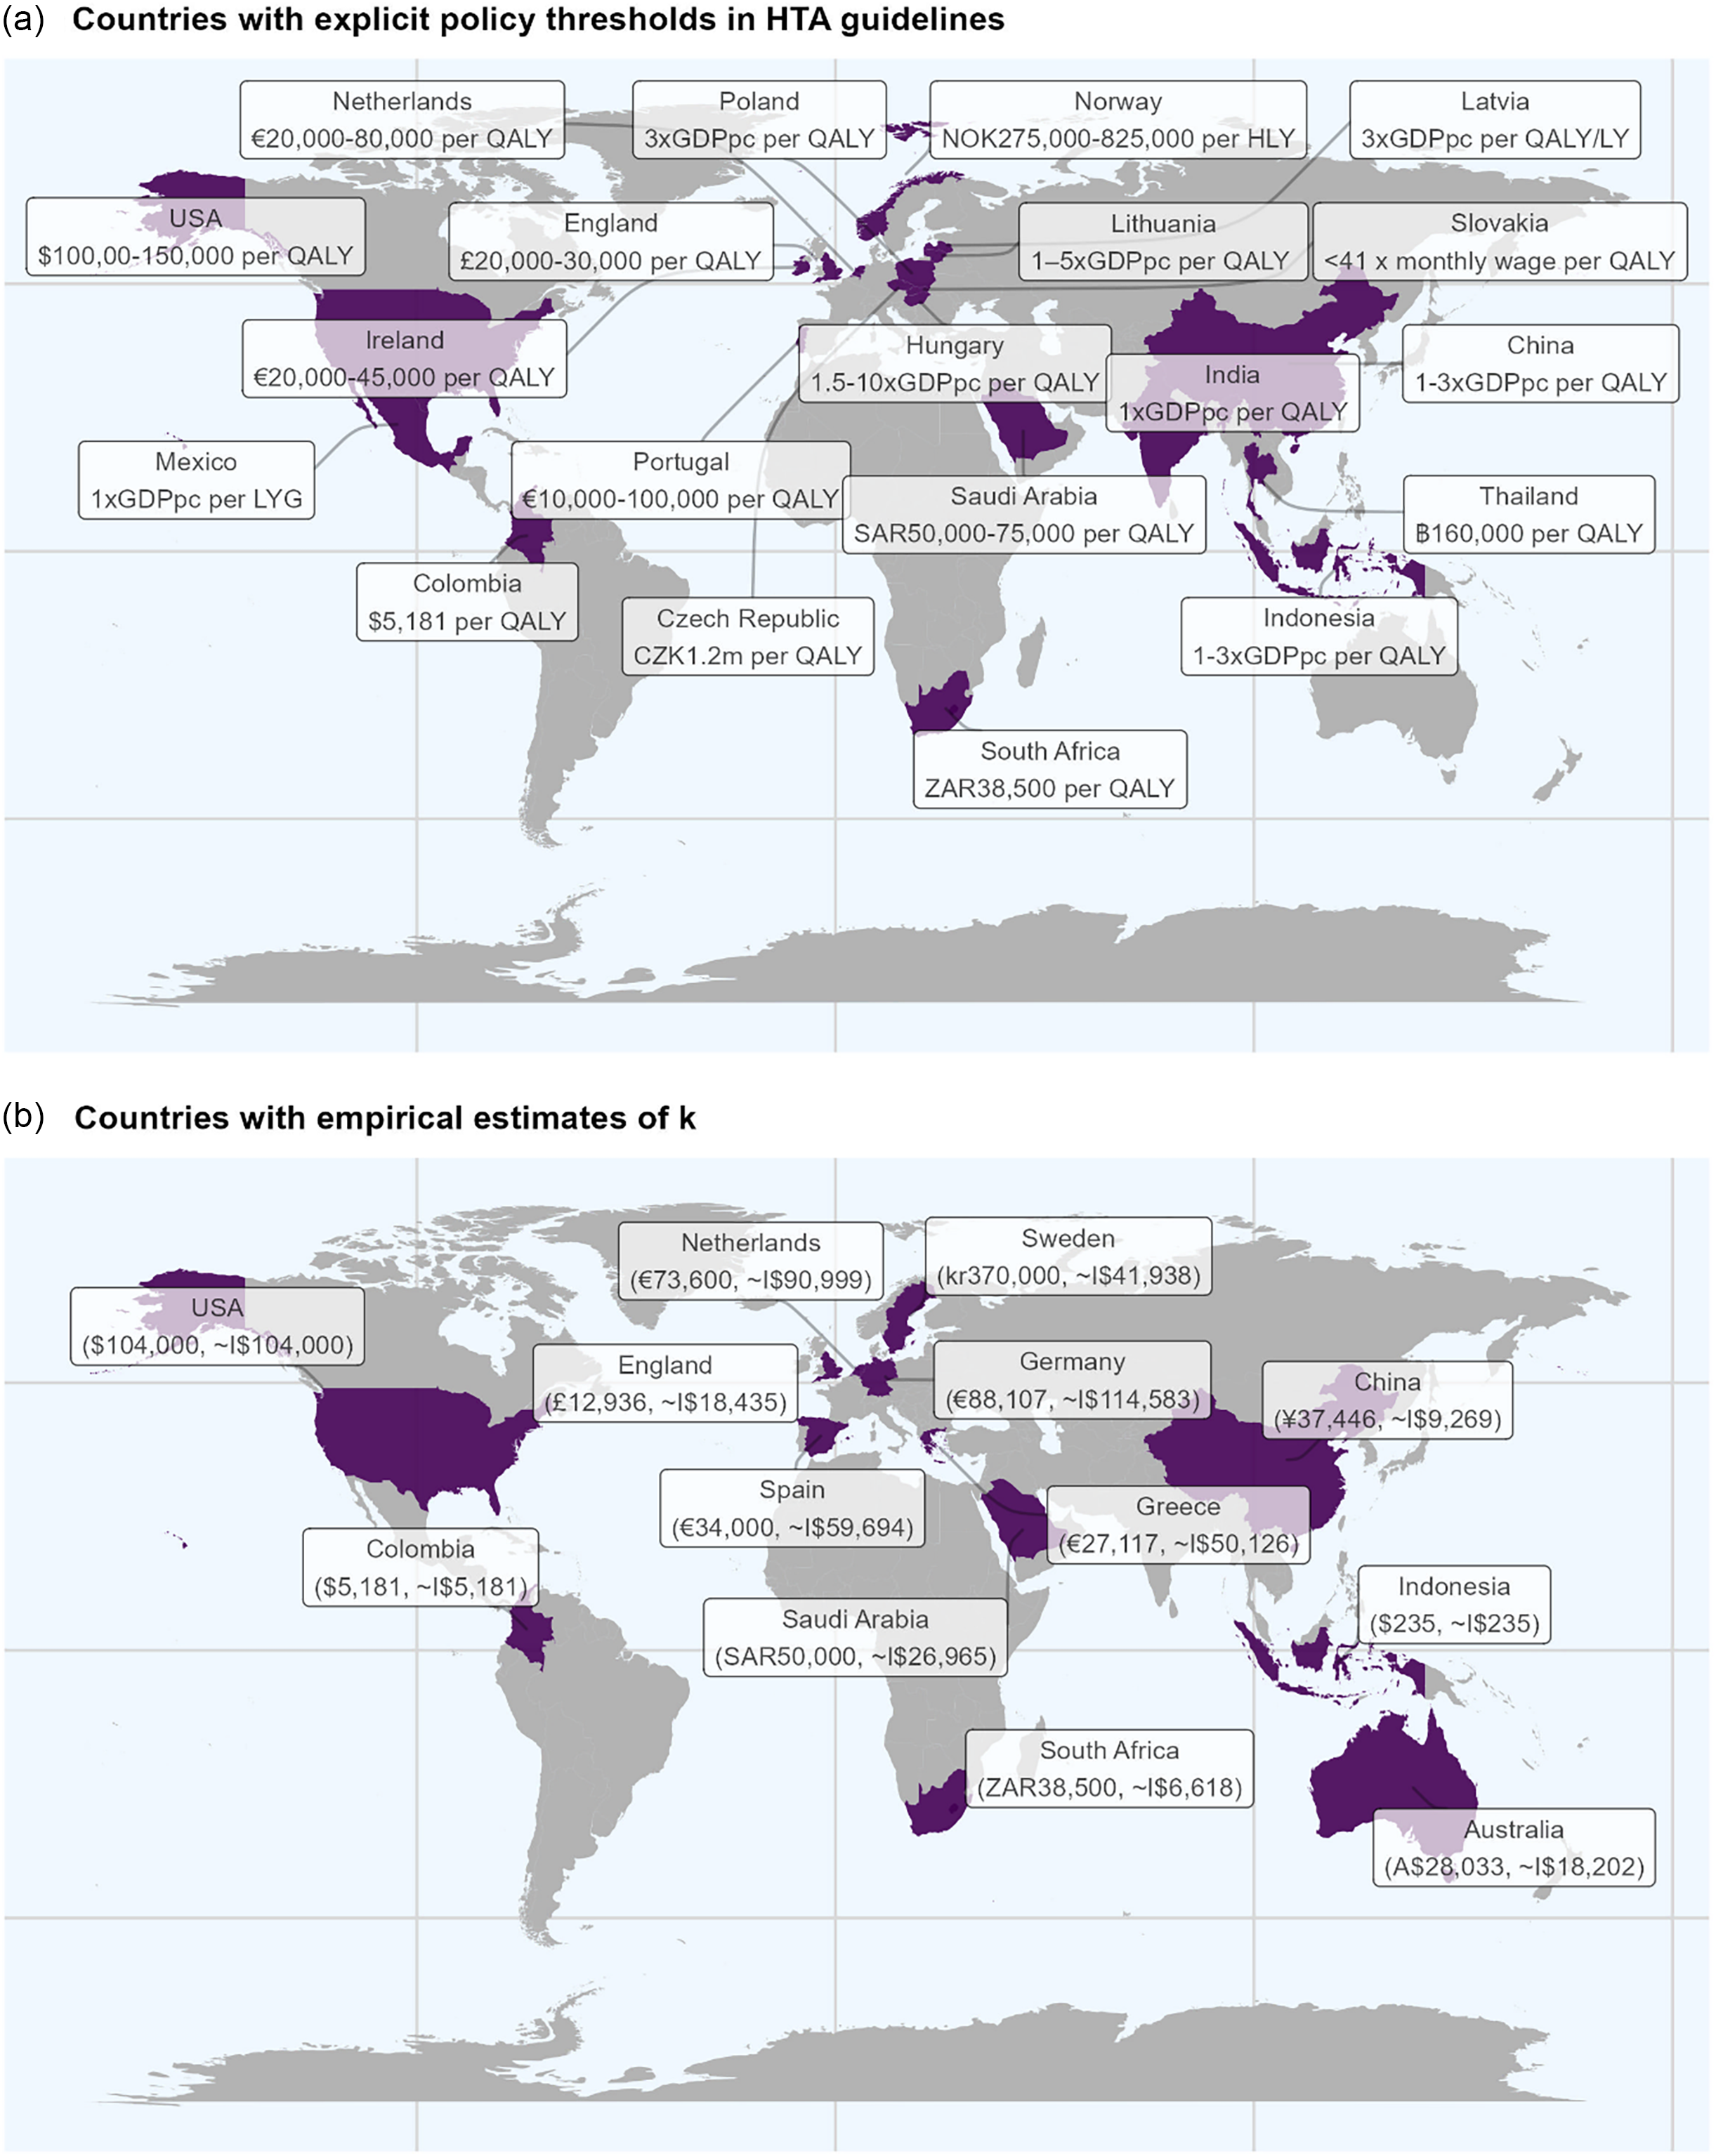
Figure 1 shows a map of the location of the countries with HTA guidelines that reference an explicit policy threshold and the countries with published estimates of k.

Figure 1. World map of countries with explicit policy thresholds and those with published k.
Of the 47 guidelines reviewed, 21 recommend a healthcare payer, 7 recommend a healthcare sector and 3 recommend a health payer or health sector perspective alongside a societal perspective. Of the 21 recommending a healthcare payer perspective 10 state an explicit policy threshold (Colombia, Czech Republic, England, Hungary, Ireland, Latvia, Mexico, Portugal, Slovakia, South Africa), four have an estimate of k (Australia, Colombia, England and South Africa) and three have both (Colombia, England and South Africa). The policy thresholds included in HTA guidelines for Colombia and South Africa align with the estimates of k ($5,181 per QALY and ZAR38,500 per QALY, respectively) whereas in England the policy threshold (£20,000–30,000 per QALY) is higher than the estimate of k (£12,936). The HTA guidelines for Saudi Arabia recommend a healthcare payer perspective alongside a societal perspective and include an explicit policy threshold that aligns with an estimate of k (SAR 50,000–75,000 per QALY). The HTA guidelines for Spain also recommend a limited societal and healthcare payer for additional analyses. No explicit policy threshold is provided but an empirical estimate of k is available (Vallejo-Torres, Reference Vallejo-Torres2025; Vallejo-Torres et al., Reference Vallejo-Torres, García-Lorenzo and Serrano-Aguilar2018). Of the seven HTA guidelines that recommend a healthcare sector perspective, only one includes an explicit policy threshold (Poland) and none have an associated estimate of k.
Twelve countries recommend a societal perspective, with nine being classified as limited societal and three as societal. Of the nine guidelines that recommend evaluations adopt a limited societal perspective, five specify an explicit policy threshold (China, Indonesia, Norway, India and Thailand), four have an estimate of k (China, Germany, Indonesia and Sweden) and two have both (China and Indonesia). In both China and Indonesia, the explicit policy threshold is 1–3 × GDP per capita whereas the estimate of k is ¥27,923–52,247 per QALY in China (Ochalek et al., Reference Ochalek, Wang, Gu, Lomas, Cutler and Jin2020) and $235 per DALY averted in Indonesia (Moler-Zapata et al., Reference Moler-Zapata, Kreif, Ochalek, Mirelman, Nadjib and Suhrcke2022). Of those that recommend a societal perspective, only one (The Netherlands) states an explicit policy threshold of €20,000–80,000 per QALY and has an empirical estimate of k (€73,600 per QALY from (Stadhouders et al., Reference Stadhouders, Koolman, van Dijk, Jeurissen and Adang2019) and €41,000 (25,900–110,400) per QALY from (van Baal et al., Reference van Baal, Perry-Duxbury, Bakx, Versteegh, Van Doorslaer and Brouwer2019).
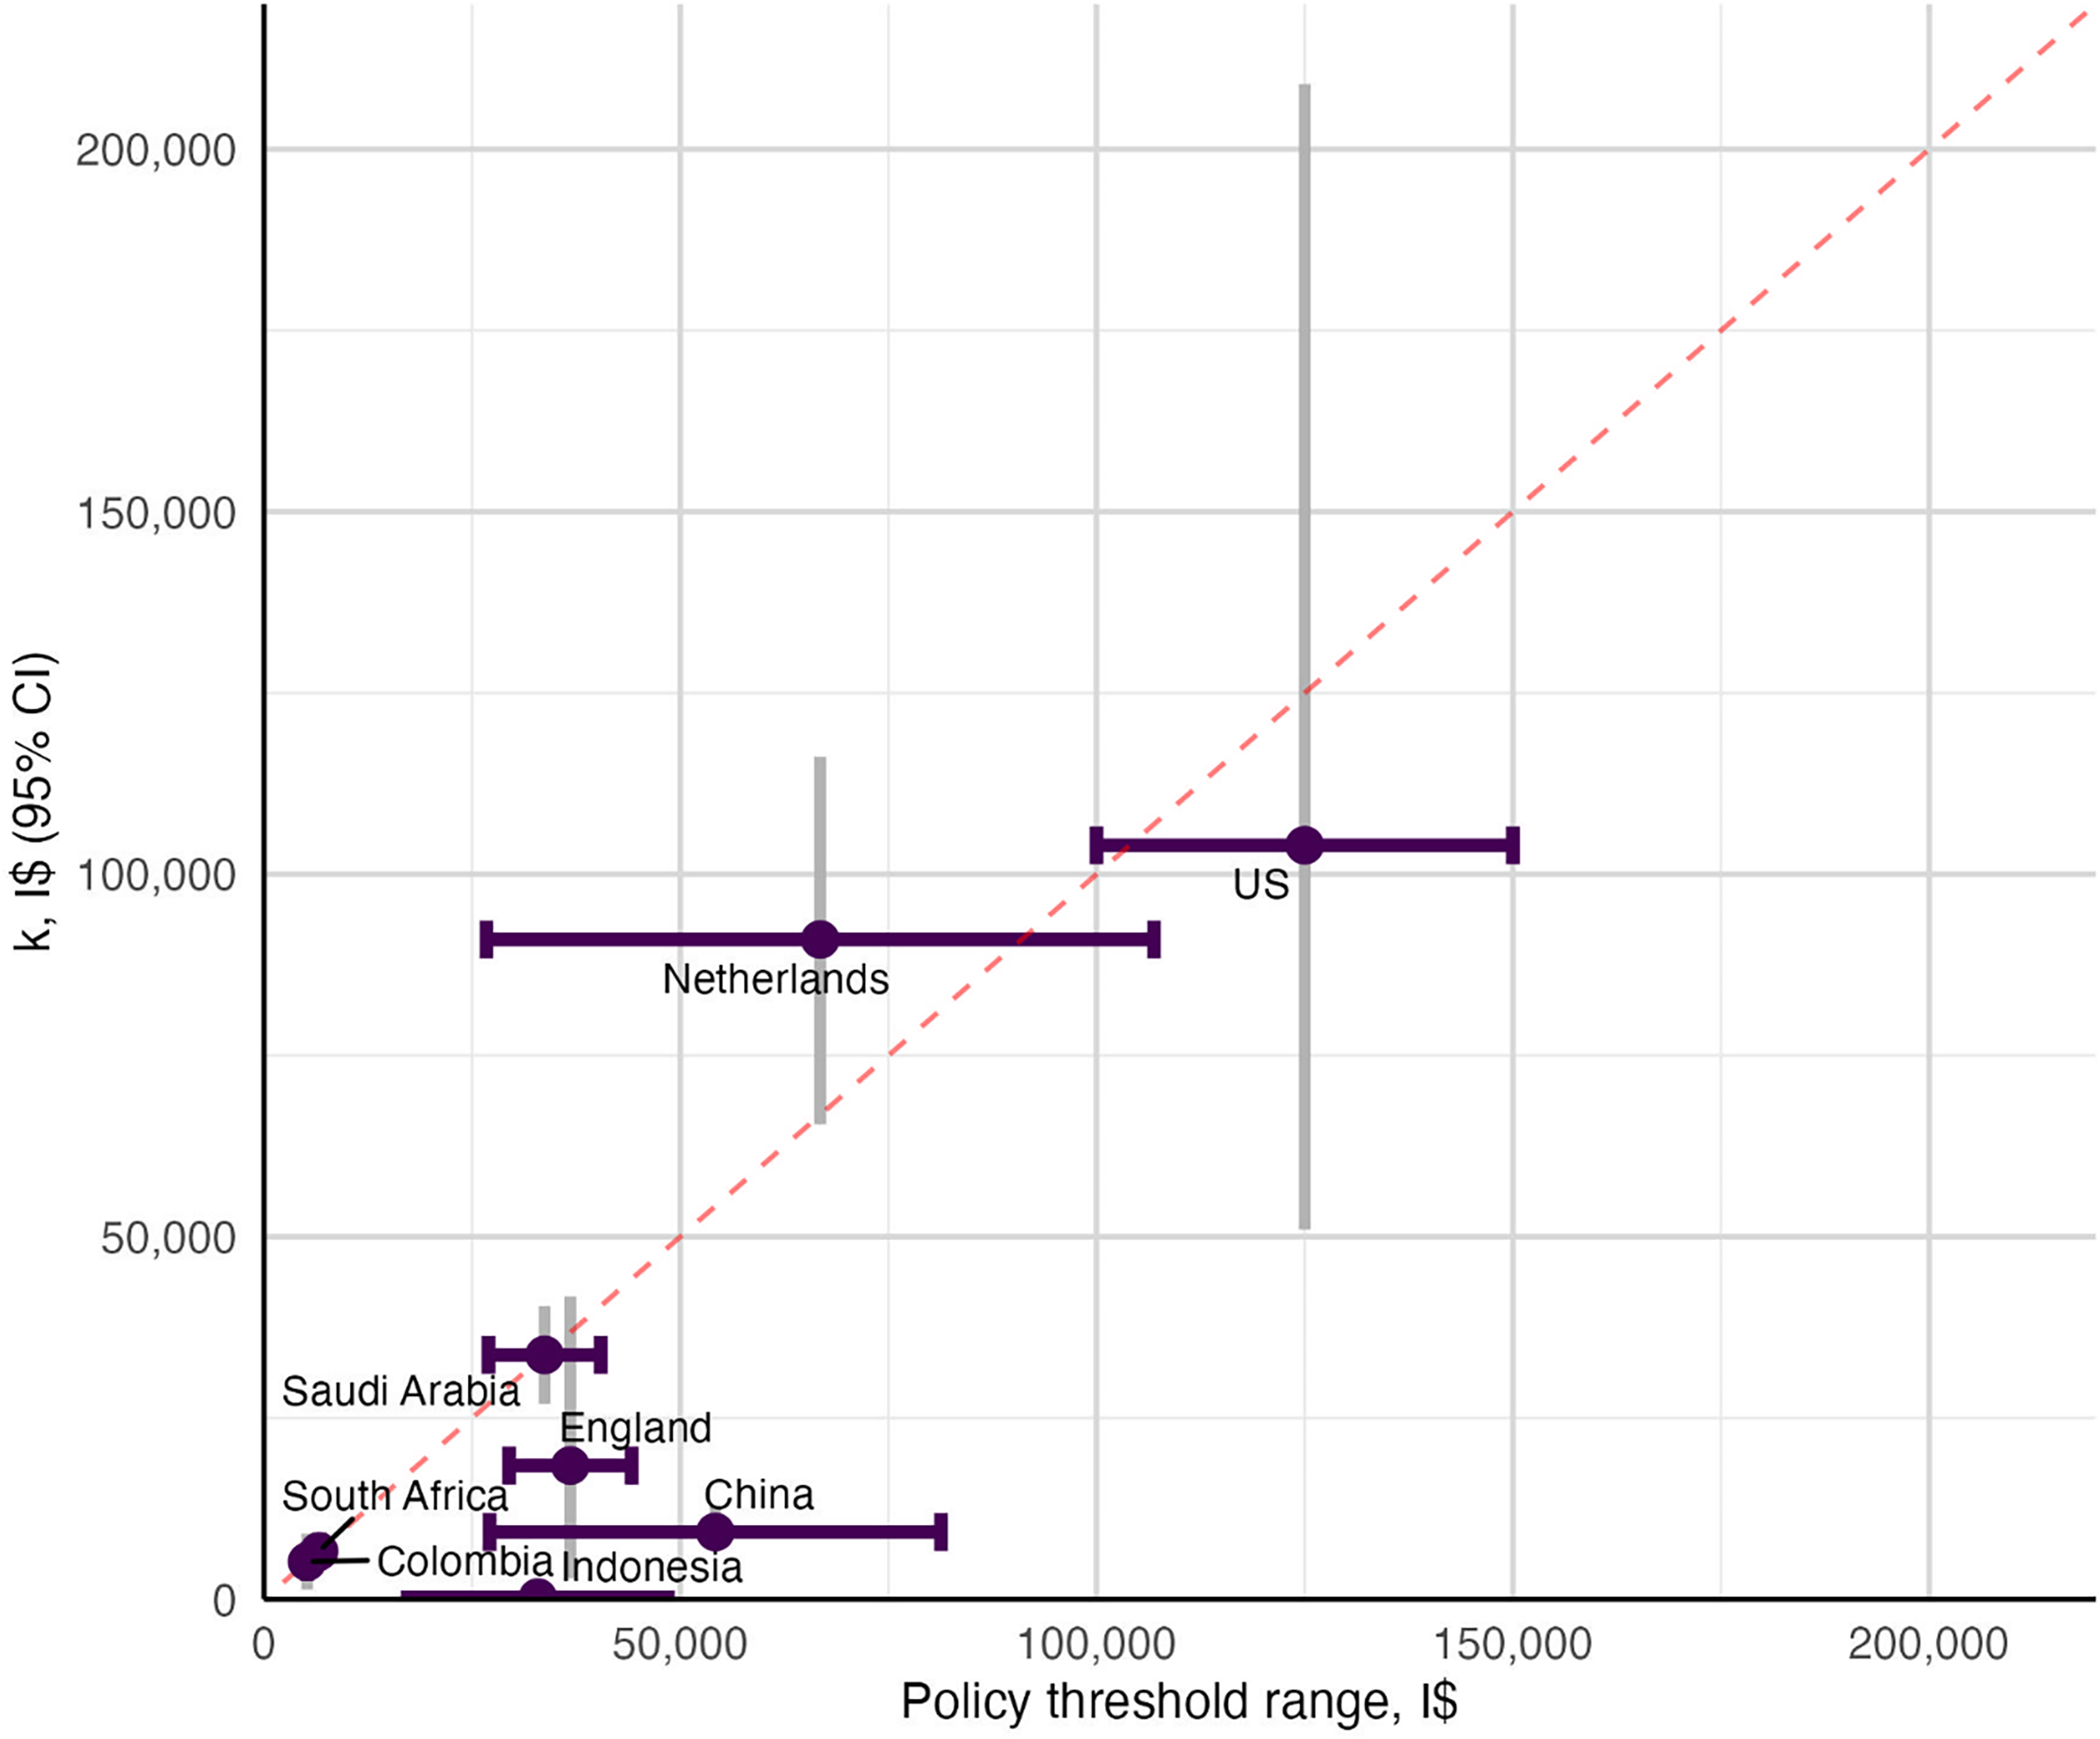
Figure 2 plots the policy threshold range and the empirical estimate of k in I$ for the eight countries with explicit estimates of both. England, Indonesia and China all have policy threshold ranges below the equivalence line (red-dashed line). Colombia, Saudi Arabia and South Africa have policy threshold estimates on the equivalence line showing the policy thresholds align with empirical estimates of k. The Netherlands and the US have ranges that cross the equivalence line indicating policy decisions can be made that are higher or lower than estimates of k.

Figure 2. Policy threshold vs. estimate of k.
Note: for GDP per capita-based thresholds ie. China and Indonesia, the GDP per capita in I$ was extracted from the World Bank I$ GDP per capita data (World Bank Group 2025a).
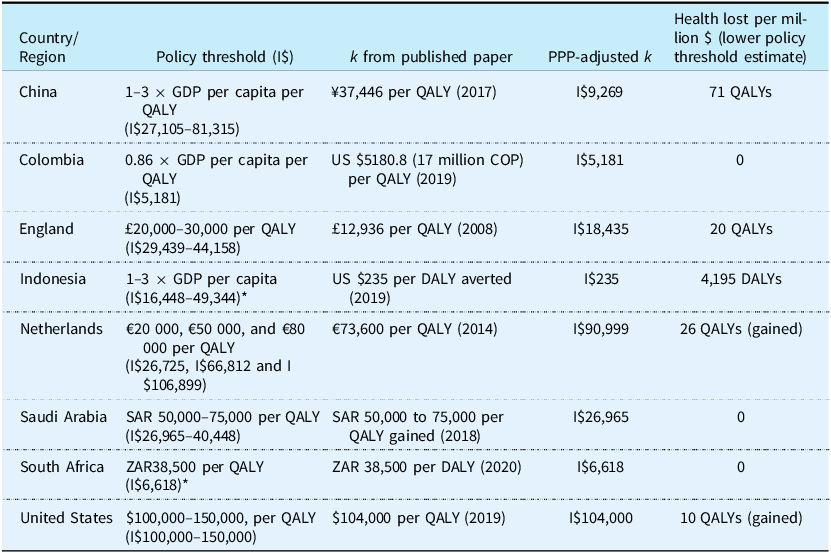
Table 2 displays the countries with an explicit policy threshold in the guidelines and an estimate of k reported in I$ to allow for comparison. In Colombia, Saudi Arabia and South Africa the policy threshold and the estimate of k are equivalent. In China, England and Indonesia the policy threshold is higher than k, with the largest relative and absolute discrepancy observed for Indonesia in which 1 × GDP per capita is equivalent to I$16,448 while the estimate of k is I$235. In guidelines for the Netherlands and the United States, the lower bound of the policy threshold range recommended is lower than k. The HTA guidelines in the Netherlands recommend applying a threshold of €20,000 (ie. I$26,725) whereas k is estimated to be I$90,999 (Stadhouders et al., Reference Stadhouders, Koolman, van Dijk, Jeurissen and Adang2019).
Table 2. Countries with an explicit HTA policy threshold in the guidelines and an estimate of k

Note: Australia, Germany, Greece, South Africa, Spain, and Sweden have k but no explicit threshold in guidelines.
Health lost per million was estimated as the number of units of health (eg. QALYs or DALYs) that could be achieved for the $1,000,000 using the CET less the health that could be achieved using the estimate of k. The estimate of k for the Netherlands was based on Stadhouders et al., Reference Stadhouders, Koolman, van Dijk, Jeurissen and Adang2019.
*The cost-effectiveness threshold uses QALYs as the unit of health and the estimate of k uses DALYs. We have assumed a QALY = DALY in the above calculation. For GDP per capita-based thresholds, the GDP per capita in I$ was extracted from the World Bank I$ GDP per capita data.
Abbreviations: DALY, disability-adjusted life year; CET, cost-effectiveness threshold; GDP, gross domestic product; I$, international dollars; k, empirical estimates of the Government cost of producing an additional unit of health; PPP, purchasing power parity; QALY, quality-adjusted life year; SAR, Saudi riyal; ZAR, South African Rand.
In Indonesia, spending $1million on a new technology with a cost per additional DALY of 1xGDP per capita increases DALYs lost by 4,195 compared to spending that million funding existing healthcare. On the other hand, in the Netherlands spending $1 million on a new technology that produces one QALY per €20,000 would produce 26 more QALYs compared to spending $1 million on existing services. The results of the health lost per million I$ using the mid-point of the policy threshold range and the upper bound can be seen in the supplementary material.
4. Discussion
Mapping policy thresholds to estimates of k has revealed an increasing number of countries have an explicit policy threshold recommended in HTA guidelines when compared to a similar review (Sharma et al., Reference Sharma, Aggarwal, Downey and Prinja2021). There is also increasing availability of empirical estimates of k. However, these are rarely aligned.
The majority of explicit policy thresholds used in HTA are not stated to be based on estimates of the health opportunity cost and where justification is provided, 40 percent are based on productivity, be that at a national or individual level. The use of GDP-based thresholds is particularly common in low- and middle-income countries (Kazibwe et al., Reference Kazibwe, Gheorghe, Wilson, Ruiz, Chalkidou and Chi2022; Leech et al., Reference Leech, Kim, Cohen and Neumann2018) despite the literature cautioning against their use for being disconnected from local budget constraints and not accounting for the health opportunity cost (Bertram et al., Reference Bertram, Lauer, De Joncheere, Edejer, Hutubessy, Kieny and Hill2016; Chi et al., Reference Chi, Blecher, Chalkidou, Culyer, Claxton, Edoka, Glassman, Kreif, Jones and Mirelman2020; Robinson et al., Reference Robinson, Hammitt, Chang and Resch2017). The use of policy thresholds that exceed the estimate of the health opportunity cost is not limited to low- and middle-income countries as we show the case of England which uses a policy threshold of £20,000–30,000 per QALY and has an estimate of k of £12,936 per QALY (Claxton et al., Reference Claxton, Martin, Soares, Rice, Spackman, Hinde, Devlin, Smith and Sculpher2015; Lomas et al., Reference Lomas, Martin and Claxton2019). Setting policy thresholds; however, is not always within the remit of the HTA agencies. Confidential price negotiations between manufacturers and payers (through, for example, national procurement bodies, managed entry agreements, or risk-sharing schemes) may result in discounts and rebates that bring the effective price below that implied by the cost-effectiveness analysis. There are health consequences to the adoption of policy thresholds that exceed the health opportunity cost. The approval of new technologies under such policy thresholds can displace more health than they create. Furthermore, as shown in Table 2 and previous literature (Ochalek et al., Reference Ochalek, Lomas and Claxton2018), the health losses may be greater in low- and middle-income countries.
Setting the policy threshold can be a highly political process. For example, in Canada efforts to align prices more closely with value informed by the opportunity cost provoked strong opposition from industry and patient groups (Amyotrophic Lateral Sclerosis Society of Canada, 2022) and was ultimately abandoned following legal challenges (Reguly et al., Reference Reguly, Bienenstock, McMahon and Shaughnessy2022) and political pressure.
At the time of writing, there is active debate in the UK around changing the policy threshold used by the National Institute for Health and Care Excellence as a result of industrial and economic policy (Gainsbury and Naci, Reference Gainsbury and Naci2025). In Thailand, decision-making bodies jointly released a policy statement recommending that the current policy threshold be maintained, and that future adjustments to the policy threshold be based on evidence of health opportunity cost (HITAP, 2025). In Indonesia, where HTA processes are relatively newer, the policy debate to set the policy threshold is ongoing (CHEPS, 2025; HFACT, 2025). In contrast to Canada, where the policy process and accompanying technical work on thresholds have been relatively well documented, such deliberations may be opaque and infrequently recorded in the public domain.
The majority of HTA guidelines in our sample recommend a healthcare payer perspective is adopted in the reference case meaning an empirical estimate of k would in theory represent a key piece of information to assess cost-effectiveness. Colombia, Saudi Arabia and South Africa offered the only examples of countries that recommend evaluations adopt a health system perspective and provide an explicit policy threshold that aligns with k ($5,181 per QALY, SAR50,000 per QALY and ZAR38,500 per QALY). Countries such as Spain adopt a healthcare perspective and have an estimate of k (€22,000–34,000) (Vallejo-Torres et al., Reference Vallejo-Torres, García-Lorenzo and Serrano-Aguilar2018; Vallejo-Torres, Reference Vallejo-Torres2025), but have no explicit policy threshold. While decisions in these contexts could be based on k, this is not known to the public. The presence of implied thresholds represents the largest group in our study as only 20 of 46 countries have an explicit threshold, consistent with previous research (Fasseeh et al., Reference Fasseeh, Korra, Elezbawy, Sedrak, Gamal, Eldessouki, Eldebeiky, George, Seyam, Abourawash, Khalifa, Shaheen, Abaza and Kaló2024). Implied thresholds allow flexibility of decision-making and may prevent gaming by manufacturers, amongst other benefits (Gafni and Birch, Reference Gafni and Birch2006; Thokala et al., Reference Thokala, Ochalek, Leech and Tong2018). However, ensuring transparency and aligning policy thresholds with empirical evidence to ensure decisions maximise population health is likely to offer greater benefits to society as opposed to the risks associated with arbitrariness or neglecting opportunity costs.
We identified a number of HTA guidelines that specify the inclusion of some OOP payments in the CEA to inform HTA decisions. Belgium, Japan, Poland and Singapore include patient co-payments as well as costs falling on the public healthcare funder. This conflates payers and the perspective does not align with who the opportunity cost falls upon ie. individuals and public funders. In such cases k may not represent a policy relevant estimate of the health opportunity cost as OOP is rarely addressed in empirical estimation (Ochalek et al. this special issue). Kim et al., (Reference Kim, Silver, Kunst, Cohen, Ollendorf and Neumann2020) made the distinction between a healthcare payer perspective and a healthcare sector perspective. The former includes only those monetary healthcare costs incurred by a (typically third party) healthcare payer, the latter is similar to the healthcare payer perspective but accounts for all monetary costs of healthcare, regardless of who bears the cost. Our results show in practice this is not reflected in HTA guidelines as some healthcare payer perspectives, as in the case of Belgium and Japan, include OOP payments in the form of patient co-payments. We recommend HTA guidelines follow the taxonomy described in Kim et al. to improve the interpretation of the policy relevance of empirical estimates of k.
The sole objective of the healthcare system may not, however, be to maximise health. Some justify policy-threshold ranges or allow for deliberative processes to reflect values beyond efficiency such as equity, severity or disease burden (Minister of Health of the Republic of Lithuania, 2020; National Institute for Health and Care Excellence, 2022; Zorginstituut Nederland, 2024). Similar arguments are made about the role the policy threshold plays in incentivising future innovation or attracting industry funding, yet it is important this approach does not overlook the opportunity cost and the health implications of decisions. In such cases estimates of the health opportunity cost, and thereby empirical estimates of k, are required in order to quantify the trade-offs being made between maximising net health and other aspects of value.
Similarly, 12 HTA guidelines in our study recommended evaluations adopt a societal perspective either solely or alongside a health perspective. These factor in labour market productivity or the reduction in OOP payments resulting from healthcare. In these contexts, the role of k remains important for determining the net impact on population health. However, it is important to note that the incremental cost per QALY calculated from a societal perspective cannot be directly compared with k to assess the net health effect of a technology; such comparisons must instead be based on estimates from the healthcare system perspective. The reason being that k (as defined in this paper) measures the changes in health outcomes due to changes in healthcare expenditure, and not due to changes in other broader non-healthcare costs. If costs fall on other budgets (including household OOP payments), then estimation of consequences would require an estimate of the health opportunity costs associated with those other budgets. Ensuring net health effects are measured based only on the analysis that takes the healthcare system perspective alone maintains consistency.
It is important to highlight that HTA guidelines change over time. We include the second edition of the South African HTA guidelines which states an explicit policy threshold of ZAR38,500 (Republic of South Africa Department of Health, 2022). Yet, the first edition did not make explicit the policy threshold (Republic of South Africa Department of Health, 2013). Cost-effectiveness thresholds are unlikely to remain constant over time with a growing number of determinants explaining the temporal changes (Paulden et al., Reference Paulden, O’Mahony and McCabe2016). As HTA processes mature, the basis for the choice of threshold may change, so consideration is needed when comparing nascent processes with those which are well established.
4.1. Limitations
This study is not an exhaustive list of HTA guidelines, but a pragmatic review based on HTA guidelines identified in a recent study (Breslau et al., Reference Breslau, Cohen, Diaz, Malcolm and Neumann2023). Several important features of the guidelines included in our study are worth noting. First, there are no HTA guidelines for low-income countries. Although there is growing evidence on health opportunity costs in these settings (Ochalek et al., Reference Ochalek, Lomas and Claxton2018; Woods et al., Reference Woods, Revill, Sculpher and Claxton2016), the absence of formal HTA guidelines makes it difficult to assess how such evidence is used in decision-making or to scrutinise the health implications of HTA decisions. Second, we excluded implicit policy thresholds, which may have important implications. Many countries do not have an explicitly stated threshold in guidance documents (for example, the Philippines), yet if decisions are being made, an implicit threshold is likely applied in practice. Third, we used HTA guidelines as a proxy for HTA processes; however, even when such thresholds are included in guidelines or technical manuals, they are not always binding in final decision-making. In some contexts, such as Colombia, they function primarily as technical or scientific inputs. Finally, approving new technologies at the policy threshold does not always equate to financing them at the price underpinning the cost-effectiveness estimate compared to that threshold. The approved ICER may not represent the actual incremental costs and effects in the health system if changes occur after appraisal, including following price negotiations or if the recipient patient population differ from that in the appraisal. We do consider that the HTA recommendation on cost-effectiveness compared to the stated threshold is of relevance to decision making, even if the potential impacts post-decision require consideration of the processes within each country.
4.2. Policy recommendations
This study highlights important implications for policy. For researchers and analysts, it is important to specify thresholds ex-ante in protocols, and we recommend citing both the policy threshold and the empirical estimate of k in economic evaluations to inform HTA (Lomas et al., Reference Lomas, Ochalek and Faria2022). Comparing against both (and ideally calculating net health effects using the empirical estimate of k) would present all available evidence to end users. Furthermore, the perspective of the analysis should align with that of the k estimate in order to compute net health effects.
For HTA organisations, we encourage guidelines to explicitly acknowledge k estimates, even if a higher/lower policy threshold is adopted for other reasons. There are health implications of failing to have a policy threshold related to k when the purpose of the analysis is to inform decisions about the allocation of publicly financed health care resources under a fixed or effectively constrained budget, as demonstrated in this study and previous literature (Naci et al., Reference Naci, Murphy, Woods, Lomas, Wei and Papanicolas2025). We also encourage clarity and transparency regarding what the policy threshold is and what it represents; the lack thereof can have consequences for millions of people.
At the global level, norm-setting bodies such as the WHO play a critical role in shaping priority setting processes across countries. Whilst cost-effectiveness analyses in LMICs have often referenced GDP per capita–based policy thresholds (Leech et al., Reference Leech, Kim, Cohen and Neumann2018), the WHO and others have made a clear case that multiples of GDP per capita should not form the basis of policy thresholds (Bertram et al., Reference Bertram, Lauer, De Joncheere, Edejer, Hutubessy, Kieny and Hill2016). Despite its role and aims in leading global norm-setting around evidence-informed priority-setting (EIPS) and universal health coverage (World Health Organization, 2025), WHO has, however, not issued clear guidance on what should be used instead (Chi et al., Reference Chi, Blecher, Chalkidou, Culyer, Claxton, Edoka, Glassman, Kreif, Jones and Mirelman2020). Instead, its guidance has increasingly emphasised that countries should develop context-specific approaches grounded in empirical evidence of health opportunity costs and aligned with national budget constraints and decision-making processes (World Health Organization, 2021). Moving forward, there is an important role for WHO and other norm-setting bodies to clarify the importance of empirical estimates of k for informing EIPS and strengthening the link between global methodological guidance and national implementation.
Finally, we advocate that policy thresholds be regularly reassessed, and any divergence between the policy threshold and estimate of opportunity cost be justified transparently. A standard periodicity for updating k could be proposed (eg. every 5 or 10 years). Several factors would need to be considered, including the availability of funding for estimating k (which requires a highly specialised team), the quality of underlying data sources and the lack of estimation of health state preference values, particularly for LMICs, among others (Espinosa et al., Reference Espinosa, Drummond, Orozco, Ordóñez, Sanmartín, Mora and Ochalek2024b).
5. Conclusion
This paper provides a go-to reference for the policy thresholds used in HTA processes across countries. Our comparative mapping shows that fewer than half of HTA guidelines assessed have explicit policy thresholds, and among these there is a lack of alignment between the policy threshold and empirical estimates of the health opportunity cost.
Supplementary material
The supplementary material for this article can be found at https://doi.org/10.1017/S1744133126100395
Acknowledgements
N/A.
Author contributions
P. M. planning, formal analysis, methodology, writing original draft, and writing review and editing. J.O. planning, supervision, conceptualisation, writing review and editing. S.W., S.G., planning, supervision, writing review and editing. O.E., M.A.J.G., L.V.T., planning, writing review and editing.
Financial support
Financial support for this study was provided entirely by a grant from UK National Institute for Health and Care Research (Grant Number NIHR133252) using UK aid from the UK Government to support global health research. The views expressed in this publication are those of the authors and not necessarily those of the National Institute for Health and Care Research or the UK Department of Health and Social Care. The funding agreement ensured the authors’ independence in designing the study, interpreting the data, and writing and publishing the report.
Competing interests
The authors have no competing interests to declare.


 Open access