


Introduction
The 2019 European Parliament (EP) elections saw a large proportion of Eurosceptic members of the EP (MEPs) elected. Over 28 per cent of MEPs winning seats in 2019 were Eurosceptics of one sort or another (Treib, Reference Treib2021). This was similar to the proportion elected in 2014, although higher than in 2009 when under 20 per cent of MEPs were Eurosceptic (Treib, Reference Treib2014). Also, the composition of these anti‐integrationist MEPs changed between 2014 and 2019 such that more of them came from the radical right than the left (Treib, Reference Treib2021). The Identity and Democracy group of hard right parties emerged as the fifth largest political group, gaining some parties from the ‘soft’ Eurosceptic (Szczerbiak & Taggart, Reference Szczerbiak, Taggart, Szczerbiak and Taggart2008) European Conservatives and Reformists (ECR) group. The latter dropped to sixth place having been heavily affected by the poor performance of the UK Conservative Party, which had been central to the group and whose MEPs, along with all other UK representatives, had left the EP by early 2020, when the United Kingdom departed the European Union (EU). While the proportion of Eurosceptic MEPs declined somewhat after Brexit, anti‐EU MEPs remained in considerable numbers in the Parliament.
These changes to the European Parliament's composition reflect a growing politicisation of European integration, in which conflicts between those opposing the process and those wanting it to go further, have become more pronounced (Grande & Hutter, Reference Grande, Hutter, Hutter, Grande and Kriesi2016). Scholars of European politics argue that this politicisation has affected the structure of political conflict in EU member states through the appearance of a new transnational cleavage (Hooghe & Marks, Reference Hooghe and Marks2018) and in changes to economic and socio‐cultural divides which reflect tensions between winners and losers of the globalisation process (Kriesi et al., Reference Kriesi, Grande, Lachat, Dolezal, Bornschier, Frey, Kriesi, Grande, Lachat, Dolezal, Bornschier and Frey2008). For others, social and economic changes over the past two or more decades have led to a re‐alignment of political conflict around new socio‐cultural divisions, such as age, education and cultural values, and attitudes towards European integration are one aspect of these new political alignments (Dalton, Reference Dalton2018). The aim of this paper is to establish how far changes in the political preferences of MEPs over time reflect these changing structures of conflict in European politics. To do this, we use a unique time series of surveys of MEPs to assess their changing policy preferences and to identify the preference structure of the only directly elected EU institution.Footnote 1
We first review some of the claims in the literature about the changing structure of the political space in EU politics. Using four survey waves (2000, 2006, 2010, and 2015), we then identify how MEPs' preferences have changed over time on the two main dimensions of EU politics: the left‐right dimension and the pro‐/anti‐EU integration dimension. Next, we investigate whether there has been a ‘rotation’ in the MEP preference space, away from the traditional economic left‐right dimension towards a socio‐cultural liberal‐conservative dimension that incorporates attitudes to EU integration and immigration. We find evidence that this is indeed the case: MEPs' preferences on a range of EU policy issues now correlate more with their preferences on a socio‐cultural dimension than on the traditional economic left‐right dimension.
The changing structure of political conflict in Europe
Attempts to understand the changing political space in Europe generally take globalisation as their starting point. The growing competences of the EU along with the free movement of people, goods, services and capital which underpin the EU's single market, can be seen as one part of this globalisation process. While the political space in European countries was previously defined largely by worker–owner, centre–periphery and rural–urban cleavages among others (Lipset & Rokkan, Reference Lipset, Rokkan, Lipset and Rokkan1967), European integration, particularly since the mid‐1990s, has led to increasing differences between those perceiving themselves as benefitting from globalisation and those who see themselves as losing out. There are several views as to exactly how this has affected the European political space.
Kriesi et al. (Reference Kriesi, Grande, Lachat, Dolezal, Bornschier, Frey, Kriesi, Grande, Lachat, Dolezal, Bornschier and Frey2008, pp. 12–13) argue that globalisation has led to the transformation of existing cleavages. Previously, the economic dimension saw conflict between managers and workers and the public versus private sectors, while a second, socio‐cultural dimension was based on liberal social values versus more traditional or authoritarian values. According to this approach, globalisation has transformed both of these dimensions. The economic dimension is still about state‐versus‐market divisions, but the pro‐state position is now more protectionist and the pro‐market position is more in favour of increasing national competitiveness in world markets. Divisions may nevertheless be present among those on the pro‐market end of this dimension, on the basis that some economic sectors are more open to international markets than others (Kriesi et al., Reference Kriesi, Grande, Lachat, Dolezal, Bornschier, Frey, Kriesi, Grande, Lachat, Dolezal, Bornschier and Frey2008, p. 13). On the socio‐cultural dimension, meanwhile, the authoritarian aspect increasingly includes an attachment to the nation‐state and opposition to ethnic and religious diversity and immigration. This dimension also incorporates views on European integration and immigration (Kriesi et al., Reference Kriesi, Grande, Lachat, Dolezal, Bornschier, Frey, Kriesi, Grande, Lachat, Dolezal, Bornschier and Frey2008). Both dimensions are said to be bounded by an integration pole (the pro‐market end of the economic dimension and the libertarian end of the socio‐cultural dimension) and a demarcation pole. Kriesi et al.'s (Reference Kriesi, Grande, Lachat, Dolezal, Bornschier, Frey, Kriesi, Grande, Lachat, Dolezal, Bornschier and Frey2008) expectation is that mainstream parties have adapted their approaches to this new political space. They base their policies largely around the winners of globalisation and so are found towards the integration end of the dimensions, although differences between left and right parties are present. These differences can be seen in the defence of the welfare state for mainstream left parties (pushing them away from the integration pole on the economic dimension) and attempts to reduce the size of government for parties on the mainstream right. Left‐ and right‐wing populist parties attempt to appeal to voters positioned towards the demarcation ends of these dimensions, that is, those ‘losing out’ from the processes of globalisation and European integration (Kriesi et al., Reference Kriesi, Grande, Lachat, Dolezal, Bornschier, Frey, Kriesi, Grande, Lachat, Dolezal, Bornschier and Frey2008, pp. 16–19). Kriesi et al. find evidence to support this theory by using content analysis of newspapers during elections in each of the countries in their study as a way of measuring parties' positions (Dolezal, Reference Dolezal, Kriesi, Grande, Lachat, Dolezal, Bornschier and Frey2008).
Hooghe and Marks (Reference Hooghe and Marks2018) similarly see European integration as re‐structuring the political space in Europe. Their focus is specifically on changes resulting from European integration and immigration. They argue that positions on these issues are linked to parties' location on a new‐politics dimension (Hooghe et al., Reference Hooghe, Marks and Wilson2002) which distinguishes traditional‐authoritarian‐nationalist (TAN) parties at one end, from green‐alternative‐liberal (GAL) parties at the other. GAL parties favour a cosmopolitan and social libertarian approach which fits with support for EU integration and immigration, while TAN parties oppose these developments (Hooghe & Marks, Reference Hooghe and Marks2018, p. 123). In line with cleavage theory, they argue that – due to the constraints placed on them by activists, leaders and party reputations – mainstream parties, on the whole, will find it hard to adapt to new cleavages. Their expert judgement data support this, showing that such parties have made at most minor changes to their positions on European integration and immigration in the 1999–2014 period (Hooghe & Marks, Reference Hooghe and Marks2018, p. 120). Prosser (Reference Prosser2016, pp. 744–745) comes to similar conclusions about how European integration fits into dimensions of conflict on the basis of Manifesto Research on Political Representation (MARPOR) data (Volkens et al., Reference Volkens, Lehmann, Mattheiß, Merz, Regel and Weßels2017) on national parties' positions. He assesses the relationship between support for European integration and general left‐right and social liberal‐conservative dimensions. Using data from 2008, he shows a close relationship between views on integration and the socio‐cultural liberal‐conservative dimension, with anti‐integration attitudes found at the conservative end of the scale and pro‐integration positions at the liberal end.
What are the implications of these perspectives on the European political space for the EP? Initial research on dimensions of politics in the EP found two orthogonal dimensions of conflict among transnational parties in the EU: a left‐right dimension (combining both economic and socio‐cultural issues) and an EU integration dimension. These results were based on expert judgement data on parties' left‐right positions and the positions on European integration of party identifiers in Eurobarometer surveys (Hix & Lord, Reference Hix and Lord1997). Descriptive analysis based on the content of transnational parties' European election manifestos indicated a consistent left‐right dimension over time but a considerable movement of parties on a European integration dimension, suggesting the two were unrelated. Factor analyses of these manifestos were partly consistent with this, indicating that although positions on economic integration in the EU were part of a left‐right dimension, EU political integration was separate from this (Gabel & Hix, Reference Gabel and Hix2002). More recent research has used spatial analysis of recorded (roll‐call) votes to determine the nature of the political space in the EP. Using this approach, Hix et al. (Reference Hix, Noury and Roland2006) find two main dimensions of conflict in the EP. A left‐right dimension, which explains most of the variance in roll‐call voting, is correlated with national parties' left‐right positions, whether these positions are measured using expert judgement data (Bakker et al., Reference Bakker, de Vries, Edwards, Hooghe, Jolly, Marks, Polk, Rovny, Steenbergen and Vachudova2015) or MARPOR data (Volkens et al., 2017). MEPs' locations on this dimension are explained by national parties' positions on socio‐cultural issues (such as gender equality, abortion and gay rights) as well as on economic issues (such as public spending, state intervention in the economy and employment policy). In the context of politics in the EP, Hix et al. (Reference Hix, Noury and Roland2007) suggest that this first ‘revealed’ dimension of voting is explained by MEPs' and parties' divisions on single market economic, social and environmental regulation, which are the main items of business in the EP. Meanwhile, Hix et al. (Reference Hix, Noury and Roland2006) also find a second dimension of voting, particularly after 1994, which correlates with MEPs' and parties' positions on EU integration and, to some degree, participation in government at the national level. However, this second dimension appears to decline in importance over the 1979–2004 period covered by the data in Hix et al.'s (Reference Hix, Noury and Roland2007) analysis.Footnote 2
More recent research has assessed the content of dimensions of conflict using national parties' European election manifestos. Schmitt et al. (Reference Schmitt, Wessels, van der Eijk, Banducci, Franklin, Giebler, Hobolt, Marsh, van der Brug and ven der Eijk2012) conduct principal components analyses of the content of 2009 EP election manifestos, separating Western and Eastern Europe. They find evidence consistent with Kriesi et al. (Reference Kriesi, Grande, Lachat, Dolezal, Bornschier, Frey, Kriesi, Grande, Lachat, Dolezal, Bornschier and Frey2008) in that the first component extracted for Western and Eastern European parties is similar to Kriesi et al.'s (Reference Kriesi, Grande, Lachat, Dolezal, Bornschier, Frey, Kriesi, Grande, Lachat, Dolezal, Bornschier and Frey2008) cultural dimension and is characterised by xenophobic Euroscepticism. However, three other factors are also discovered in their analyses, mainly based around an economic left‐right dimension and also including some elements of the social liberal‐conservative cleavage. Using Euromanifestos from parties in Germany, Greece, Portugal and the United Kingdom over time, Teperoglou and Tsatsanis (Reference Teperoglou and Tsatsanis2011) find evidence of how globalisation has affected the content of the cultural dimension with measures of nativism, economic integration and Euroscepticism tending to exist together, often orthogonal to parties' economic left‐right positions.
Others have used European election manifestos to explain party positions on EU integration. Schäfer et al. (Reference Schäfer, Popa, Braun and Schmitt2021) find, overall, that economics is less important than a cultural dimension to the structuring of party positions on European integration in the period since the Maastricht Treaty. They also find no clear evidence that this changed after the Eurozone crisis. Braun et al. (Reference Braun, Popa and Schmitt2019) attempt to explain party positions on EU polity and policy issues separately. They find that mainstream parties have become somewhat more critical on EU polity issues and economic policy (although not immigration policy) over time but that these changes are small in comparison to the movement of radical left and right parties. Specifically, far‐right parties have become more negative about polity, economic and immigration policy issues over time (comparing 2009–2014) while far‐left parties have become more negative only on EU polity issues. This fits broadly with Kriesi et al.'s (Reference Kriesi, Grande, Lachat, Dolezal, Bornschier, Frey, Kriesi, Grande, Lachat, Dolezal, Bornschier and Frey2008) and Hooghe and Marks' (Reference Hooghe and Marks2018) expectations about party positioning.
Closer to the aims of this paper, some work has considered how best to explain MEPs' voting decisions, showing that – compared with an economic left‐right dimension – attitudes to European integration better explain MEPs' voting choices in the period since the beginning of the financial crisis in 2008. Otjes and van der Veer (Reference Otjes and van der Veer2016) argue the economic crisis means that EU integration attitudes should be more important in explaining outcomes in roll‐call votes than they were previously. This is because, prior to the Eurozone crisis, EU involvement in economic issues was primarily based on a left‐right dimension in which conflict centred on the degree to which markets should be regulated. The Eurozone crisis, and the sovereign debt elements of it in particular, mean that EU decision‐making has increasingly been about adding to the EU's powers, such as budgetary surveillance and rules on national budget deficits. On this basis, we expect views on European integration to be more important in explaining MEPs' decisions after 2008. Otjes and van der Veer's (Reference Otjes and van der Veer2016) evidence shows that, particularly for votes on economic issues, MEPs' positions on EU integration have become better predictors of their roll‐call votes. Using different theories and methods, Blumenau and Lauderdale (Reference Blumenau and Lauderdale2018) find broadly consistent results. They compare MEPs' votes on crisis‐related issues (such as public finances, the European Central Bank and the Eurozone) before and after the beginning of the financial crisis in the EU. They find that crisis‐related votes in the post‐crisis period divided MEPs more along an EU integration dimension than on a left‐right dimension compared with the period before the Eurozone crisis.
In short, research on changing European party politics in general, as well as research on party positions in EU politics and voting in the EP, has identified three (exogenous) political dimensions: an economic left‐right dimension, a socio‐cultural liberal‐conservative dimension and an EU integration dimension. European parties were traditionally mainly aligned around the economic left‐right dimension, but the importance of the socio‐cultural dimension has grown over time, and national party positions on European integration have gradually become subsumed into this second dimension. Similarly, most existing research on EU‐level politics has identified the economic left‐right dimension as distinct from the European integration dimension. At this level, the socio‐cultural dimension has gradually shifted from correlating with the economic left‐right dimension to now increasingly correlating with the European integration dimension. We, hence, have two hypotheses to test:
H1: The preference space of the MEPs is two‐dimensional, with preferences on an economic left‐right dimension distinct from preferences on a socio‐cultural liberal‐conservative dimension.
H2: Within this two‐dimensional space, we expect preferences on EU integration to shift from being correlated with an economic left‐right dimension to being correlated with a socio‐cultural liberal‐conservative dimension.
To test these hypotheses, we need to test both the dimensionality of the space (whether it is one or two‐dimensional) as well as the substantive policy content of the dimensions. Before directly assessing the dimensionality of the political space in the EP, we look, in the next section, at the distribution of MEPs on left‐right and EU integration dimensions.
MEPs' left‐right and EU integration positions
As a first step in assessing the changing dimensions of MEPs' preferences, we look at how far the EP's political groups have moved on the left‐right and EU integration dimensions over time. For example, do we see evidence consistent with Hooghe and Marks' (Reference Hooghe and Marks2018) findings that mainstream parties have moved little on the issue of European integration amid the rise of the transnational cleavage? To explore this, we employ data from the 2000, 2006, 2010, and 2015 European Parliament Research Group (EPRG) surveys of MEPs (Hix et al., Reference Hix, Farrell, Scully, Whitaker and Zapryanova2016; Whitaker et al., Reference Whitaker, Hix and Zapryanova2017). Details of the samples and a comparison with population values can be found in Table S1 in the online Supporting Information. The 2015 survey had a response rate of 30 per cent (n = 227). This response rate is comparable with that for other recent surveys of parliamentarians such as Deschouwer et al.'s (Reference Deschouwer, Depauw, André, Deschouwer and Depauw2014) survey conducted in 15 European countries, with an overall response rate of 25 per cent. We calculated the Duncan index (Duncan & Duncan, Reference Duncan and Duncan1955) as well as chi‐squared tests of representativeness for the member state and political group samples in the MEP surveys. These tests indicate that the samples are representative of the EP.
As well as assessing the representativeness of the samples, we also test how far movements in the position of national parties in the EP reflect those of their parties as a whole. We did this by running correlations between the mean left‐right positions of national parties as measured in MEP surveys and the positions of these parties in the Chapel Hill expert judgement data (Bakker et al., Reference Bakker, de Vries, Edwards, Hooghe, Jolly, Marks, Polk, Rovny, Steenbergen and Vachudova2015) for time points relating to each of the four MEP surveys. We did the same for the EU integration dimension. All the left‐right correlations are at 0.77 or higher, while the lowest correlation for the EU integration position is 0.59. The correlations are shown in Table S2 of the Supporting Information. This strong positive relationship between the two measures indicates that the positions of MEPs are reflective of their national parties' positions.
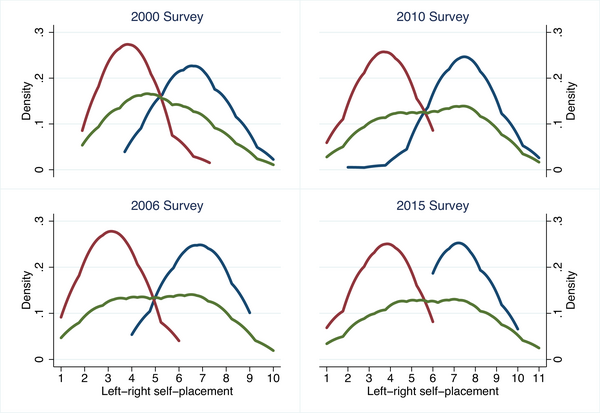
We assess movements of MEPs on the left‐right dimension in Figure 1, which shows kernel density plots of MEPs' left‐right self‐placements across the four surveys. Higher values indicate more right‐wing positions. If we look at the results based on all MEPs (shown by the green lines), we see that the 2014–2019 EP is a slightly more right‐leaning parliament than its three predecessors. This is as we would expect given the 2014 European Parliament election results. Specifically, while many MEPs are still clustered around the centre of the scale, the 2015 survey has the highest percentage of respondents placing their views at the far‐right of the spectrum (at 10 or 11 on the scale) compared to previous survey waves. To assess the extent to which this change is a result of movements in the two largest party groups, each graph shows the distribution of the respondents from the European People's Party (EPP) – the blue lines – and the S&D – the red lines. There appears to be little change over time in the central tendency of the EPP and S&D MEPs' left‐right distributions. Mean values on this scale are almost the same in 2015 (7.4) as in 2010 (7.5). Similarly for the S&D group, the 2010 value of 3.6 is very close to the mean of 3.5 in 2015. In other words, the higher proportions of MEPs towards the right in the 2015 graph are mainly explained by responses from the MEPs in the ECR, Europe of Freedom and Direct Democracy (EFDD) and Europe of Nations and Freedom (ENF) groups.

Figure 1. Left‐right self‐placement of MEPs: Kernal density plots. [Colour figure can be viewed at wileyonlinelibrary.com]
Figure 1 shows how the overlap between the EPP and S&D has declined, particularly in the 2015 survey, which shows the absence of a left‐wing tail in the EPP's distribution. This fits with what we know about the waning of the grand coalition in the EP during the 2014–2019 term and suggests mainstream party groups' positions have moved little on the left‐right scale. Nevertheless, we also see more separation between the EPP and S&D, in line with Kriesi et al.'s (Reference Kriesi, Grande, Lachat, Dolezal, Bornschier, Frey, Kriesi, Grande, Lachat, Dolezal, Bornschier and Frey2008) suggestion that mainstream parties have attempted to distinguish themselves from each other amid competition from parties appealing to those losing out from globalisation.
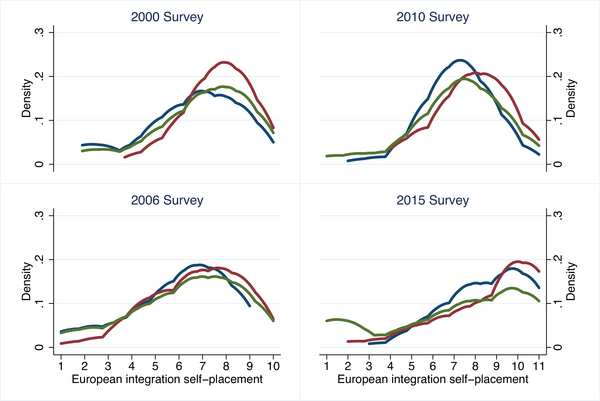
To explore party positions on EU issues, Figure 2 shows MEPs' self‐placement on an EU integration scale. Here the most recent data show some continuity with previous parliaments but there are also some important differences. If we consider the distribution of all MEPs, depicted by the green lines, we see a sizeable majority of 2014–2019 MEPs are supportive of further European integration, as in previous parliaments (placing themselves at 6 or higher on the support for European integration scale). The 2015 wave, however, also reveals a more polarized parliament. Both the pro‐ and anti‐ ends of the spectrum in the 2015 survey are at their highest levels – by some distance – of all four survey waves. The proportion of strongly Eurosceptic MEPsFootnote 3 more than tripled from 2010 to 2015. At the same time, the strongest supporters of further European integrationFootnote 4 seem to have increased in number to an even larger extent compared to previous waves. With respect to the record number of extreme supporters of integration, a caveat needs to be added about the slightly changed wording of the EU integration question in the 2015 compared with earlier surveys. In order to increase comparability with European Election Studies data, the upper end was re‐worded as ‘European integration should be pushed further’, having previously been ‘the EU should become a federal state immediately’. The 2015 wording represents a slightly softer expression of support for integration; hence, some of the very high number of EU supporters on the extreme end may be explained by this change. However, since the 2015 polarization pattern is not only present at the extreme ends of the scale, it is also unlikely that the question wording is responsible for all of the differences.

Figure 2. EU integration self‐placement of MEPs: Kernal density plots. [Colour figure can be viewed at wileyonlinelibrary.com]
The blue and red lines in Figure 2 show the distributions of the EPP and S&D MEPs on the EU integration scale. Both parties have shifted to some degree in a pro‐integration direction if we compare the 2010 and 2015 results. Of the two groups, the S&D has a higher proportion of respondents placing themselves at the most pro‐integration end compared with the EPP. This suggests that – consistent with Hooghe and Marks' (Reference Hooghe and Marks2018) findings for national parties – neither the EPP nor the S&D have become a less integrationist party group in response to party competition from Eurosceptics. Rather, higher proportions of MEPs in the ECR and EFDD (consisting largely of TAN parties) place themselves at the anti‐integrationist end of the scale in 2015 compared with 2010. This suggests that the influx of Eurosceptic MEPs may have caused an intensification of preferences for the more pro‐integration members as they react to the hard Eurosceptic message coming from some MEPs. Additionally, external factors, such as the Eurozone crisis, put questions of European integration in the spotlight. While the crisis generated much Eurosceptic sentiment, it also resulted in further integration especially within the Euro area (Hodson, Reference Hodson, Wallace, Pollack, Roederer‐Rynning and Young2020). Support for these changes may account for some mainstream MEPs strongly preferring that European integration ‘be pushed further’. These pro‐EU positions for mainstream parties are consistent with Kriesi et al.'s (Reference Kriesi, Grande, Lachat, Dolezal, Bornschier, Frey, Kriesi, Grande, Lachat, Dolezal, Bornschier and Frey2008, pp. 16–19) suggestion that such parties will place themselves towards the integration end of the two dimensions.
The changing political space in the European Parliament
Building on this initial analysis, we next investigate the dimensions of MEPs' preferences and how these have changed over time. Are MEPs' preferences best described by a two‐dimensional space, with a main (economic) left‐right dimension and a second dimension that correlates with socio‐cultural attitudes (e.g. on immigration) as well as attitudes towards European integration? Alternatively, are MEPs' preferences now aligned along a single dimension that encompasses all major areas of political conflict? In this analysis, we focus on waves 2, 3 and 4 of the survey, as these waves have a larger battery of questions in common – see the Supporting Information for a description of the survey questions we use.
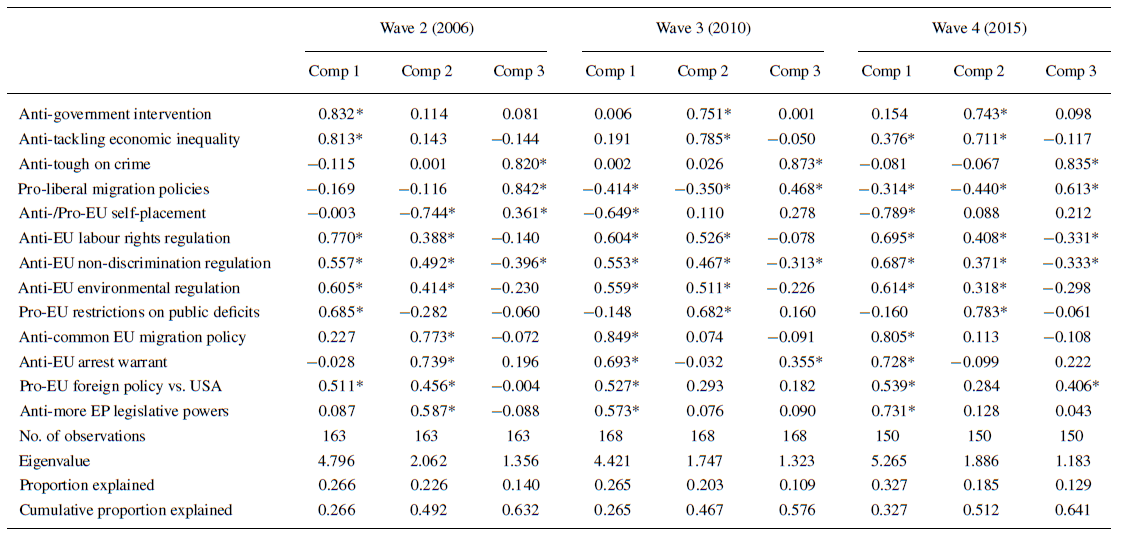
First, we look inductively at the structure of the MEPs' preference space by estimating exploratory (principal component) factor analyses for waves 2 to 4 of their responses to a series of questions about their positions on several EU and non‐EU policy issues. The results, in Table 1, show three factors with an eigenvalue of greater than 1 for each wave, but an evolution of the preference space over time. Wave 2 (2006) is the most clearly multidimensional. The first factor in this wave captures an economic dimension (such as attitudes towards government intervention and economic inequality and EU labour rights regulation), while the second factor captures EU integration issues (such as self‐placement on an anti/pro‐EU dimension), and the third factor captures a socio‐cultural dimension (such as attitudes towards crime and immigration and EU policies on migration and the arrest warrant). The space starts to shift in wave 3 (2010), as the first factor now captures socio‐cultural issues (migration) as well as EU attitudes (EU self‐placement) and EU policies across a range of issues, while the second dimension in this wave relates more to economics. Finally, in wave 4 (2015), the first factor now captures all three underlying dimensions: socio‐cultural attitudes, economic attitudes and EU self‐placement. In addition, looking at the proportions of variance explained by each factor in each wave, we see that the first factor explains an increasing proportion of the variance across the three waves, with over 40 per cent of the variance in attitudes explained by the first dimension in wave 4. In other words, these results suggest the evolution of a political space at the EU level from a multi‐dimensional space, initially based around economic issues distinct from socio‐cultural issues and EU integration, into a single dimensional space, with MEPs' preferences on economic left‐right issues, socio‐cultural liberal‐conservative issues and EU integration starting to line‐up along a single dimension. If these three dimensions are indeed beginning to merge into a single dimension, this would be a new finding.
Table 1. Principal component factor analysis of MEPs' preferences, with varimax rotation

Note: Estimation: Principal‐component factor analysis with varimax rotation. * indicates factor loadings higher than 0.3 or lower than ‐0.3.
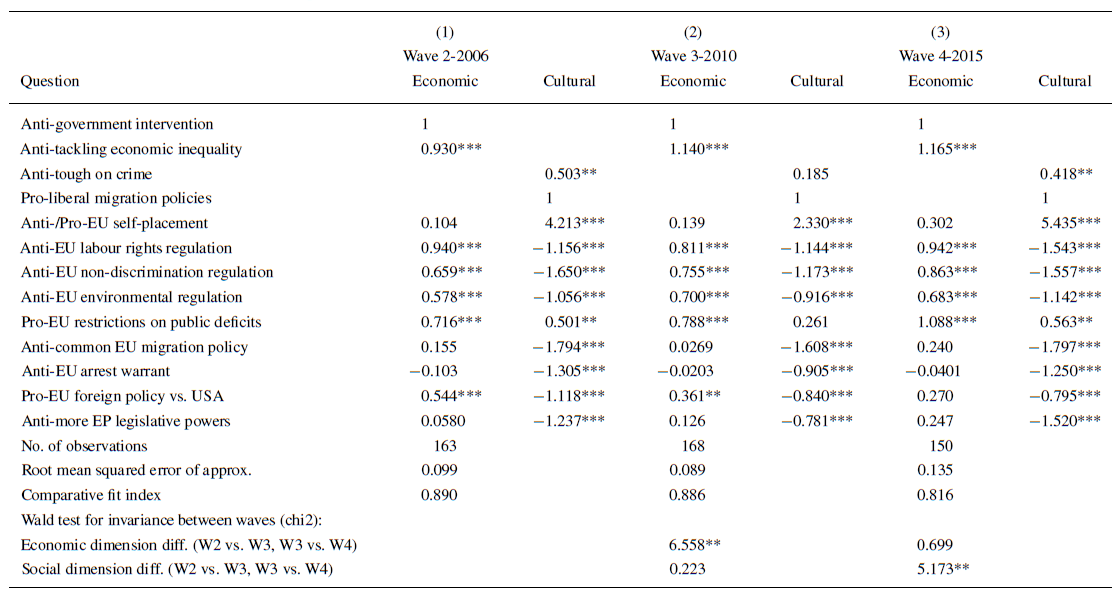
Having looked at the political space without imposing any structure, we now take a different approach: to test whether EU integration issues load more strongly with an economic left‐right dimension or a socio‐cultural liberal‐conservative dimension. We do this by estimating a confirmatory factor analysis. We anchor the economic left‐right with MEP preferences on government intervention in general and find that this also highly correlates with MEP attitudes to income inequality. We anchor the second dimension with MEP preferences on immigration in general (with pro‐immigration preferences on the positive pole) and find that this also correlates with attitudes towards crime (except for the 2010 wave). We then allow MEP preferences on the battery of questions relating to EU integration in general, as well as specific EU policies, to load on either the economic left‐right or the cultural liberal‐conservative dimension. The results are presented in Table 2.
Table 2. Two‐dimensional analysis of MEPs' preferences

Note: Estimation: confirmatory factor analysis, using maximum‐likelihood in a structural equation model to estimate a two‐dimensional space, with the first dimension constrained to fit “pro‐government intervention” preferences and the second dimension constrained to fit “pro‐liberal migration policies” preferences. * $p<0.1$, ** $p<0.05$, *** $p<0.01$.
Several findings from this analysis are worth highlighting. First, MEPs' self‐placements on the EU integration scale load strongly with the socio‐cultural (liberal‐conservative) dimension in all three waves (with pro‐EU positions correlating with socially liberal preferences) and do not seem to relate to the economic (left‐right) dimension in any of the waves. Second, MEPs' preferences on specific policies tend to load on both dimensions: with more anti‐EU attitudes correlating with economic right positions (positive coefficients for the economic dimension) and socially conservative positions (negative coefficients for the social dimension here). This is true for MEPs' attitudes to EU labour rights, EU non‐discrimination policies, EU environmental regulation and EU foreign policy. However, MEPs' preferences on EU migration policies, the EU arrest warrant, and the powers of the EP only load on the socio‐cultural dimension. Third, the explanatory power of the two dimensions individually, changes over time, as the Wald tests of invariance between the waves show. The economic left‐right dimension is more strongly correlated with MEPs' policy preferences in the 2010 wave than in the 2006 wave, while the socio‐cultural liberal‐conservative dimension is more strongly correlated with MEPs' policy preferences in the 2015 wave than in the 2010 wave.
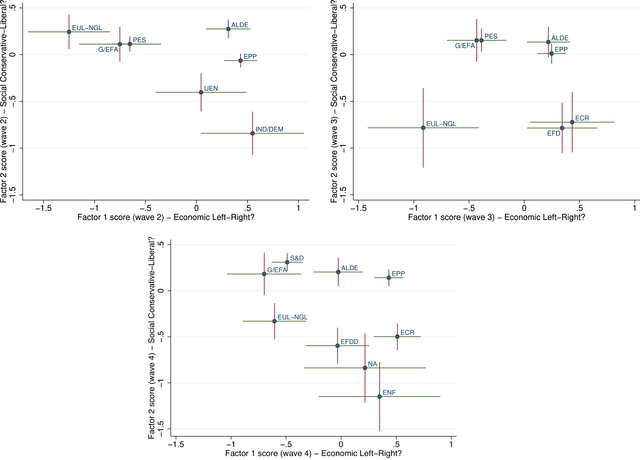
To understand better the meaning of these dimensions for party group positions, in Figure 3 we plot the mean factor scores for each EP political group on these dimensions in each of the three survey waves we analysed. The lines through the points indicate 95 per cent confidence intervals with green horizontal lines for factor 1 (economic left‐right) and red vertical lines for factor 2 (socio‐cultural liberal‐conservative). The graphs show that the three largest party groups (EPP, S&D and ALDE) along with the Greens‐European Free Alliance (G/EFA) are in similar places at the liberal end of the socio‐cultural dimension and that these positions on this dimension do not change across the three time points (although the EPP does appear to be moving in a slightly more liberal direction over time, despite the increasingly conservative position of Fidesz within the EPP).Footnote 5 The ordering of these groups on factor 1 (economic left‐right) is as we would expect: with the S&D group towards the ‘left’, the EPP further right, and ALDE between the two.

Figure 3. Mean party group factor scores on two factors. [Colour figure can be viewed at wileyonlinelibrary.com]
Note: This figure plots the mean factor scores for the MEPs in each party group across the three survey waves, from the two dimensions in models 1, 2 and 3 in Table 2. The lines through the points indicate 95 per cent confidence intervals with green horizontal lines for factor 1 (economic left‐right) and red vertical lines for factor 2 (socio‐cultural liberal‐conservative).
Those groups we know to be the most Eurosceptic have lower scores on the revealed socio‐cultural (liberal‐conservative) dimension, with the ENF scoring lowest of all on this factor, in line with what we might expect if this dimension taps into attitudes to migration as well as European integration. Indeed, the ordering of party groups on this dimension seems to have face validity. However, one group that stands out is EUL/NGL in wave 3 (2010). This group's position towards the left on factor 1 is as expected. However, EUL/NGL also shifted to a more socially conservative (and more anti‐migration, anti‐EP powers) position in wave 3 (2006), although this is largely but not completely reversed in wave 4 (2015). These changes reflect a move to a more Eurosceptic position by EUL/NGL MEPs over time, perhaps in an attempt to capitalise on shifting voter preferences among those traditionally on the left. We cannot test that proposition with these data, so this requires further investigation. Furthermore, we should treat this move with caution given the large confidence intervals around the EUL/NGL group's position on both factors in 2010.
Together, these findings suggest that the political space in the EP includes a distinct economic dimension and a socio‐cultural dimension, on which MEPs' EU integration self‐placements load strongly, as do their attitudes to EU migration policies, the EU arrest warrant, and powers of the European Parliament. While the socio‐cultural dimension is present at all three time points studied here, this dimension has a stronger effect on MEPs' attitudes in 2015 compared with 2010. Nevertheless, the declining explanatory power over time of these two dimensions collectively leads us to ask whether a one‐dimensional model of the political space in the EP might offer a better fit. In fact, the two‐dimensional plot of the political group positions in wave 4 suggests that MEPs may actually be lined up along a single dimension: from a socially liberal and economically left position (in the top‐left of the figure) to a socially conservative and economically right position (in the bottom‐right).
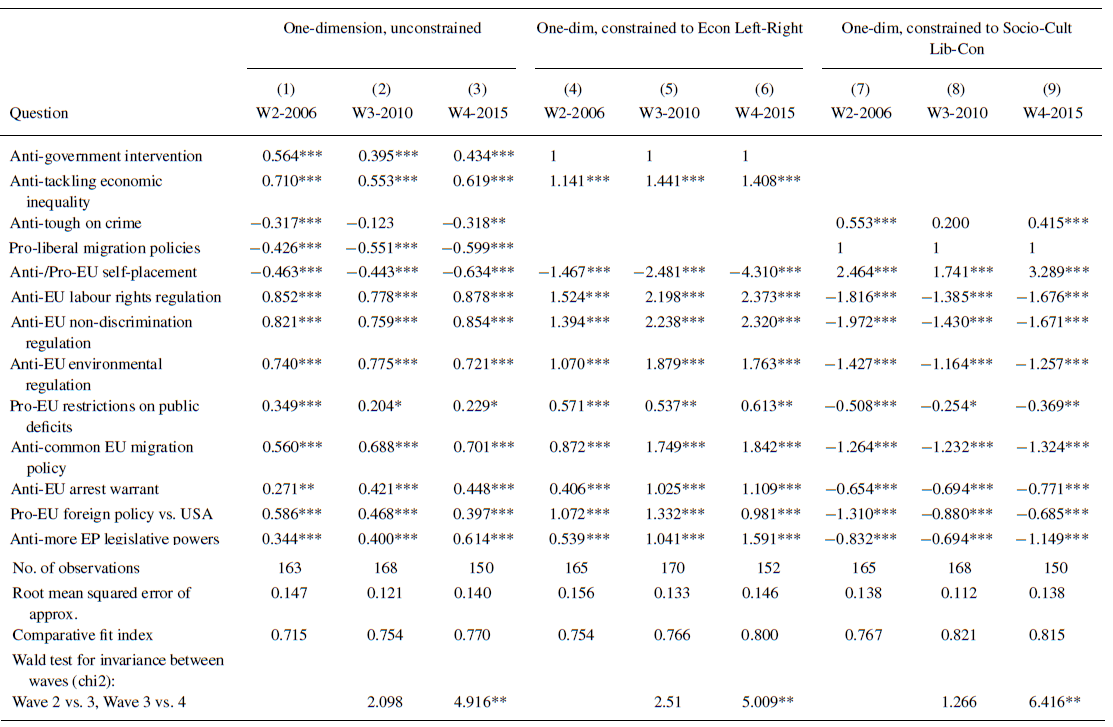
To address this, we test how far preferences can be explained by one underlying ideological dimension. We first estimate an unconstrained one‐dimensional model (models 1, 2 and 3 in Table 3), allowing the error variance to be minimised across all the issues. We then estimate two ‘constrained’ one‐dimensional models: first estimating how far an economic left‐right dimension fits MEP policy preferences overall, using MEP preferences on government intervention as the anchor (models 4, 5 and 6); and then estimating how far a socio‐cultural liberal‐conservative dimension fits MEP policy preferences, using MEP preferences on immigration in general as the anchor (models 7, 8 and 9). As before, these models are estimated using the MEP survey responses from waves 2 (2006), 3 (2010) and 4 (2015).
Table 3. One‐dimensional analysis of MEPs' preferences

Note: Estimation: Factor analysis, using maximum‐likelihood in a structural equation model. Models 1,2 and 3 are estimated as an unconstrained one‐dimensional space. Models 4–6 are estimated as a one‐dimensional space constrained to fit “pro‐government intervention” preferences. Models 7–9 are estimated as a one‐dimensional space constrained to fit “pro‐liberal migration policies” preferences.
* $p<0.1$, ** $p<0.05$, *** $p<0.01$.
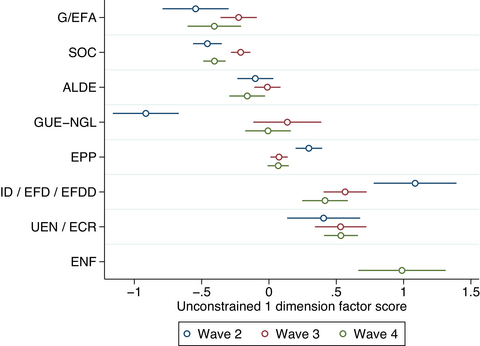
These results, in Table 3, suggest that the overall structure of MEPs' policy preferences has in fact become more one‐dimensional over time, as the increasing comparative fit indices reveal (at least when comparing 2006 with 2015). In particular, there was a marked jump in the correlations between the single underlying dimension and MEPs' policy preferences between 2010 and 2015, as the Wald tests of invariance between the waves show. We plot the mean scores for party groups on the unconstrained factor (models 1–3 in Table 3) in Figure 4, ordered by the wave 4 scores. We bring three different groups together (IND‐DEM, EFD and EFDD) for ease of presentation but note they have changed in national party membership over time (see, e.g., Hanley, Reference Hanley2008, for an overview of this). The resultant ordering of the party groups is largely in line with what we would expect with the Greens at the left‐wing and pro‐integration end of the dimension and the ENF at the opposite end. We see the movement of the GUE/NGL group, between 2006 and 2015, in a more anti‐EU and more socially conservative direction, which fits to some degree with the movement we saw on factor 2 for this group in our two‐dimensional analysis in Figure 3. Meanwhile, the EPP group moves in a more pro‐EU and more liberal direction between 2006 and 2015. The movement of the IND‐DEM/EFD/EFDD group towards the centre may partly reflect the arrival of MEPs from the 5 Star Movement who placed themselves, on average, in more integrationist and more left‐wing positions (on the left‐right dimension) than the mean members of their group in the 2015 survey.

Figure 4. Mean scores for party groups in 2006, 2010 and 2015 on a single factor. [Colour figure can be viewed at wileyonlinelibrary.com]
Note: This figure plots the mean factor scores for the MEPs in each party group across the three survey waves, from the results of models 1–3 in Table 3. The lines show the 95 per cent confidence intervals.
Returning to the results in Table 3, the comparative fit index and root mean squared error values for our wave 4 socio‐cultural factor are similar to those reported in Table 2 (final column) for the wave 4 two‐dimensional model. Put differently, the two‐dimensional model provides a better fit than the one‐dimensional approaches in all cases except for the wave 4 socio‐cultural liberal‐conservative one‐dimensional model. This indicates that the two‐dimensional model, as suggested by Kriesi et al. (Reference Kriesi, Grande, Lachat, Dolezal, Bornschier, Frey, Kriesi, Grande, Lachat, Dolezal, Bornschier and Frey2008), does not perform better in our 2015 data than a one‐dimensional model.
As a robustness test, we replicate the analyses in Tables 2 and 3 with only those national parties who appear in all three survey waves. In other words, this further analysis takes account of potential compositional effects, where the changing structure of representation in the European Parliament influences the MEPs' preferences. The results of this analysis are presented in Tables S3 and S4 in the Supporting Information. Broadly, the results are consistent with the results in Tables 2 and 3, although overall the explanatory power of the dimensions is lower because of the smaller sample of MEPs in each wave once national parties who are represented in fewer than three waves are dropped.
Conclusion: towards a one‐dimensional space of EU politics
The political space in the EP has changed as a result of the arrival of a higher proportion of Eurosceptic MEPs. Using a unique time series of surveys of the MEPs, we are able to look at EP members' preferences exogenously from the roll‐call voting process. Our analysis of the survey data reveals that the two largest political groups in the parliament have not shifted positions dramatically on EU integration. If anything, they have become more pro‐integration over time, in response to competition from Eurosceptic challenger parties who are attracting voters positioned towards the demarcation ends of Kriesi et al.'s (Reference Kriesi, Grande, Lachat, Dolezal, Bornschier, Frey, Kriesi, Grande, Lachat, Dolezal, Bornschier and Frey2008) dimensions of politics.
We expected the political space to shift, with MEPs' attitudes on EU integration to correlate increasingly with socio‐cultural issues rather than with economic left‐right attitudes. As we expected, we found that the preference space in the European Parliament is multi‐dimensional, with MEPs' preferences on the economic dimension distinct from their preferences on a socio‐cultural dimension, and with their preferences on EU integration loading more on the socio‐cultural dimension than the economic dimension. Second, however, and different from our initial expectations, we found that the preference space in the EP is increasingly one‐dimensional, where MEPs' and political groups' positions on economic, socio‐cultural, and EU integration increasingly line up. In other words, MEPs and political groups on the ‘left’ now support market interventionist economic policies, liberal socio‐cultural policies, and support EU integration, while MEPs and political groups on the ‘right’ now support free market economic policies, conservative socio‐cultural policies, and are less supportive of EU integration – the EPP find themselves towards the middle of this new dimension, as the most pro‐European of the political families on the right. Nonetheless, if indeed EU politics is becoming one dimensional, as we suggest, this will need further investigation, such as by looking at national party positions, MEP voting behaviour and public opinion.
For example, it could be argued that the political space in the EP has evolved in parallel to changes in public opinion and national‐level politics in Europe. While mainstream parties in the EP are positioning themselves towards the ‘integration’ end of the economic and cultural dimensions of conflict, there are more MEPs – in the form of populist and Eurosceptic challenger parties – positioning themselves at the demarcation poles on these two dimensions. As in national party systems, attitudes to immigration and EU integration are becoming more important in understanding preference structures in the EP. These developments will surely continue and most likely at a faster rate in the 2019–2024 EP, where a similar proportion of members are from Eurosceptic national parties. Indeed, analysis of the 2019 EP elections points to conflict among EU citizens over the growing powers of the EU (Treib, Reference Treib2021) and its association with progressive values (Galpin & Trenz, Reference Galpin and Trenz2019).
Acknowledgments
This article draws on research funded by a Leverhulme Research Project Grant, RPG‐2014‐277.
Conflicts of interest
There are no conflicts of interest to report.
Data availability statement
Data on which this paper is based are available at https://mepsurvey.eu.
Online Appendix
Additional supporting information may be found in the Online Appendix section at the end of the article:
Table S1: MEP survey samples compared with populations
Table S2: Correlations between MEP survey data and Chapel Hill measures of party position
Table S3: Principal component factor analysis of MEPs' preferences, with varimax rotation, subset composed of national parties in all waves
Table S4: One dimensional analysis of MEPs' preferences, subset composed of national parties in all waves
Data S1


 Open access