


Introduction
There is now a vast literature that examines discrepancies between female and male labor market outcomes under a variety of settings. Footnote 1 A general sentiment, at least in the developed world, is that though these differences have lessened in recent years, there are important gaps that remain (Fortin et al., Reference Fortin, Bell and Böhm2017; Goldin, Reference Goldin2023). One such gap is the noticeable lack of women in leadership positions (Pande and Ford, Reference Pande and Ford2012). This has led to the adoption of gender quota laws concerning the appointment of women on corporate boards across a number of countries. Footnote 2 While these laws have increased the number of women on corporate boards, they have not been successful in increasing female representation more generally (Bertrand et al., Reference Bertrand, Black, Jensen and Lleras-Muney2019; Maida and Weber, Reference Maida and Weber2022). Footnote 3 Thus, understanding the barriers that inhibit female participation in leadership positions remains an important area of research.
We study the effect of political corruption on the presence of women in leadership positions in Brazil. While there is a small but growing literature suggesting harmful effects of corruption on female-led firms (e.g., Breen et al., Reference Breen, Gillanders, McNulty and Suzuki2017; Hanousek et al., Reference Hanousek, Shamshur and Tresl2019; Bastos and Bologna Pavlik, Reference Bastos and Bologna Pavlik2025), the focus of this literature is on the firm rather than the individual. Footnote 4 We believe this is an important omission in the study of gender inequality not only because it could improve the income potential of aspiring female leaders but also because it has been shown that women are more likely to hire other women (Sekkat et al., Reference Sekkat, Szafarz and Tojerow2015; Bossler et al., Reference Bossler, Mosthaf and Schank2020). If corruption is a deterrent to female leadership, this suggests that fighting corruption could be effective in reducing gender inequality overall.
Corruption tends to be nepotistic, with a reliance on networks of patronage and clientelism as a means of distributing scarce resources. Footnote 5 Historically, these networks have favored men (Niven, Reference Niven1998; Beck, Reference Beck2003; Krook, Reference Krook2010; Bjarnegård and Kenny, Reference Bjarnegård and Kenny2015; Stockemer and Sundström, Reference Stockemer and Sundström2019; Lalanne and Seabright, Reference Lalanne and Seabright2022). Corruption is also a risky endeavor, and, as such, it is hypothesized that women are less likely to participate in corrupt transactions than men (Serra and Wantchekon, Reference Serra and Wantchekon2012). It has also been shown that in some corrupt environments, bribery is required to obtain certain jobs (Weaver, Reference Weaver2021). Taken together, this could imply that corruption is an important deterrent to women aiming to acquire leadership positions.
However, that corruption reduces female leadership is not a foregone conclusion. There is evidence that risk tolerance is similar in subgroups of the population with an interest in business (Johnson and Powell, Reference Johnson and Powell1994; Dwyer et al., Reference Dwyer, Gilkeson and List2002). Business leaders self-select into leadership and may be relatively risk-tolerant regardless of gender. Moreover, while many studies find that corruption is more harmful for female- versus male-led firms, this finding is notably absent for firms in Latin America (Wellalage et al., Reference Wellalage, Fernandez and Thrikawala2020; Bastos and Bologna Pavlik, Reference Bastos and Bologna Pavlik2025). Wellalage et al. (Reference Wellalage, Fernandez and Thrikawala2020) even find some evidence that women receive a higher payoff from corruption in their sample. Thus, the question of whether corruption reduces female presence in leadership positions is very much an open one in Brazil.
We test whether higher levels of corruption impact female leadership across Brazilian municipalities. We investigate whether higher corruption levels affect female leadership in Brazilian municipalities. These municipalities exhibit remarkable diversity, with GDP per capita ranging from R$2261 to R$298,919, urbanization rates spanning less than 1% to 99%, and informality accounting for 13% to 97% of employment. Corruption also varies significantly, with Ferraz and Finan (Reference Ferraz and Finan2011) estimating that the share of resources tied to corrupt activities ranges from 0% to nearly 80%. This substantial variation in both corruption and economic indicators makes Brazil an ideal setting for studying our research question.
Our corruption data is derived from the public release of reports concerning results from random audits of municipal expenditures and includes 935 (of 5570) municipalities. Specifically, we use the corruption measures developed in Avis et al. (Reference Avis, Ferraz and Finan2018), defined as the (log) number of corruption instances uncovered in the audit program (per capita). Municipal leadership measures come from the 2010 Census and can be grouped into two categories: (1) female leaders as a percentage of all leadership positions and (2) female leaders as a percentage of all working women. Regarding category (2), we also look at female labor force participation (the percent of working-age women that are employed and/or own a business). The first set of outcomes should be interpreted relative to men – of all leaders in a municipality, these outcomes represent the percentage that are women. We refer to this set as the ‘glass-ceiling’ outcomes, and they tend to be our focus. The second set of outcomes examines only the female labor force and the types of jobs that women hold. That is, this second set of outcomes should not be interpreted relative to men. Corruption may reduce the availability of jobs and leadership positions in particular, regardless of gender. This is still an important deterrent to consider.
We believe both sets of outcomes are necessary to understand the nature of the corruption–female leadership relationship. For example, if corruption is a deterrent to working women, we may find that it reduces female labor force participation. If this effect is specific to women (i.e., does not impact male labor force participation), we should see a decrease in the share of leadership positions held by women. However, if corruption also induces a selection effect such that the women that remain in the labor force are the ones that are more likely to hold positions of power, corruption’s effect on female presence among leadership (relative to men) could be positive. Alternatively, if the selection effect discourages working women from obtaining positions of leadership, we might see all outcomes moving in the same direction. These are all empirical questions.
We find that the percentage of leadership positions held by women tends to be lower in municipalities with more corruption. Given that this measure focuses on female leadership relative to men, this result suggests that corruption could induce a ‘glass-ceiling’ effect. We also find that corruption decreases the percentage of working women that hold positions of leadership. There is no evidence that corruption impacts female labor force participation. Taken together, this implies that if there is a ‘glass-ceiling’ effect, it is stemming from a differential selection among leaders. It does not imply that corruption is driving away female workers in general.
Our results are similar when we consider female participation and leadership presence in sectors that are prone to corruption. We follow Bologna and Ross (Reference Bologna and Ross2015) and recalculate our main outcome measures using the following sectors: extractive industries, manufacturing, construction, and transportation and communication. These four sectors accounted for nearly 70% of corruption cases studied in an OECD Foreign Bribery Report (2014). We find even less evidence that corruption reduces female leadership presence (relative to men) in these sectors – all results are insignificant, less one. We similarly find that the percentage of working women holding positions of leadership is lower in highly corrupt municipalities.
A key difference between the full sample and the corruption-prone subsample is that we now find a negative effect of municipal corruption on female participation in these sectors. In other words, working women are avoiding these sectors more so in highly corrupt municipalities. Moreover, less than 20% of leadership positions in corrupt sectors are held by women, whereas this number increases to 33% when considering all sectors. Thus, while municipal corruption might not reduce female leadership presence relative to men, it does seem that the vulnerability of these industries is keeping women out of leadership, implying a glass-ceiling effect at a more macro scale. This implies, further, that there are fewer sectors in which women can rise to leadership.
Section 2 provides a thorough review of the literature concerning corruption and gender. Section 3 describes the data and empirical strategy. Section 4 discusses the results. Concluding comments are given in Section 5.
Gender and corruption
Corruption as a barrier to political advancement
Research surrounding the relationship between gender and corruption is voluminous. Much of this research is focused on gender and corruption in politics. Swamy et al. (Reference Swamy, Knack, Lee and Azfar2001) and Dollar et al. (Reference Dollar, Fisman and Gatti2001) were among the first to document the negative relationship between corruption and female representation in government using cross-country data. More recently, Decarolis et al. (Reference Decarolis, Fisman, Pinotti, Vannutelli and Wang2023) find evidence that women are less likely to engage in corruption using two separate micro-level datasets from Italy and China. While there are exceptions and debates surrounding causality, the idea that women in politics are less corrupt than men is standard.Footnote 6
This finding has led researchers to question how to increase female representation in corrupt environments and, in doing so, has yielded two key reasons as to why these environments might be the most difficult for women to achieve political advancement. First, corruption is fueled by social networks and clientelistic practices. This can result in a gatekeeping effect for women on the outside of this network (Niven, Reference Niven1998; Stockemer and Sundström, Reference Stockemer and Sundström2019). Second, because women tend to be viewed as more honest than men in politics (Fridkin et al., Reference Fridkin, Kenney and Woodall2009; Dolan, Reference Dolan2014; Armstrong et al., 2022), they may face a harsher punishment by voters when caught engaging in corrupt acts. Evidence of voters punishing female candidates more for corrupt behavior has been found in both an experimental setting (Eggers et al., Reference Eggers, Vivyan and Wagner2018) and as a result of corruption exposure from audits (Brollo and Troiano, Reference Brollo and Troiano2016). If corruption is required for political advancement, both effects work as effective barriers for female candidates.
Thus, it is likely that corrupt environments make it more difficult for women to be in positions of political power. Moreover, the fact that women are less inclined to engage in corruption could amplify these existing barriers. Of most importance to this paper, if these behaviors and barriers exist in the political world, it is likely that they are present in industry. We discuss the literature surrounding this possibility next.
Corruption as a barrier in industry
The topic of corruption and gender in industry is a growing area of interest. Like politics, this research focuses mainly on whether female-led firms are less corrupt than their male-led counterparts in the business world (Breen et al., Reference Breen, Gillanders, McNulty and Suzuki2017; Clarke, Reference Clarke2022; Bastos and Bologna Pavlik, Reference Bastos and Bologna Pavlik2025). This is a particularly relevant question, despite the existing research on gender representation in politics, because the idea that women are less corrupt than men is based on theories surrounding risk aversion (Byrnes et al., Reference Byrnes, Miller and Schafer1999; Eckel and Grossman, Reference Eckel and Grossman2008). Specifically, women tend to be more risk-averse than men. However, the subgroup of the population that includes business leaders is comparatively risk-tolerant, and there is evidence that risk preference in this subgroup is similar across gender (Johnson and Powell, Reference Johnson and Powell1994; Dwyer et al., Reference Dwyer, Gilkeson and List2002). Thus, it is not clear that women would be less corrupt than men in the business world. Indeed, the results of this literature are extremely mixed. They also yield some nuance to the simple idea that women are more or less likely to engage in corruption.
Breen et al. (Reference Breen, Gillanders, McNulty and Suzuki2017) use survey-level firm data and find a strong negative association between bribery and female-led firms. However, using a subset of the same dataset, Clarke (Reference Clarke2022) finds no association once the gender of the respondent is controlled for. Bastos and Bologna Pavlik (Reference Bastos and Bologna Pavlik2025) take a different approach and study how this relationship changes when looking at different regions of the world. They find that though female-led firms sometimes bribe more than their male-led counterparts, these same firms also report corruption as being a larger obstacle to the operations of their business. Furthermore, this latter finding is strongest in areas of the world with substantial gender inequality.
Thus, this research is quite mixed and far from settled. However, a key takeaway (particularly from the Bastos and Bologna Pavlik (Reference Bastos and Bologna Pavlik2025) study) is that even if women do engage more with corruption, it is unlikely that this corruption is efficiency-enhancing. Along these lines, there is also a small literature concerning the differential effects of corruption on male- versus female-led firm outcomes and entrepreneurs. Hanousek et al. (Reference Hanousek, Shamshur and Tresl2019) find that corruption reduces firm efficiency and that this effect is more pronounced in firms with female CEOs. Similarly, Statnik et al. (Reference Statnik, Vu and Weill2023) find that corruption increases the gender gap in access to finance.
Despite the partial consensus that corruption is particularly harmful for women in the business world, it is important to highlight two exceptions. First, Latin America – and potentially Brazil – might be different. In a sample of Latin American firms, Wellalage et al. (Reference Wellalage, Fernandez and Thrikawala2020) find that, if anything, female-led firms receive a higher payoff from bribery (in terms of innovation). Similarly, Bastos and Bologna Pavlik (Reference Bastos and Bologna Pavlik2025) find no evidence that corruption differs across female- versus male-led firms in Latin America. Second, Fang et al. (Reference Fang, Goh, Roberts, Xu and Zeufack2022) find no evidence that corruption increases what they call the ‘women-led firms disadvantage’ in productivity and growth. However, they do find that the prevalence of female-led firms is higher in less corrupt countries.
Our focus is on how corruption impacts a woman’s ability to acquire a leadership position within the industry. While the aforementioned research is relevant because of its focus on female-led firms, this literature mostly ignores corruption’s impact on the presence of women in leadership positions. Footnote 7 The evidence found in Fang et al. (Reference Fang, Goh, Roberts, Xu and Zeufack2022), for example, suggests that the prevalence of women-led firms is smaller in highly corrupt countries, but this finding is not causal. They do not present an empirical test of this hypothesis, as their focus is on the productivity gap between female- and male-led firms. We aim to fill this gap here.
Empirical strategy and data
Empirical strategy
We use cross-sectional, municipal-level data to test whether corruption has an effect on female presence in leadership positions in Brazil. All outcome and control variables come from the 2010 Census, except municipal GDP per capita and population density, collected from IPEAData. The corruption data comes from Avis et al. (Reference Avis, Ferraz and Finan2018), who construct a municipal corruption measure stemming from a random audit program. While this measure considers any corrupt activity occurring between 2003 and 2013, we treat it as cross-sectional, as (1) we do not know the precise timing of the corrupt activity, and (2) corruption is a highly persistent activity (Mishra, 2006). However, we note that there could be some variation in corruption levels depending on when the municipality was audited, and we therefore always include audit number fixed effects. (These audits occur according to national lotteries where a subset is selected at a given time.) Our cross-sectional sample is limited to the 935 municipalities that were audited and have corruption data available. We give more details pertaining to the audit program, the construction of the corruption measurement, and the sample in Section 3.2.
We aim to estimate the effect of corruption on two sets of female leadership variables, described in detail below, after controlling for a number of municipal-level characteristics. In other words, we estimate the following equation:
 $${{\rm{y}}_{{\rm{ms}}}} = \beta \times {\rm{Corruptio}}{{\rm{n}}_{{\rm{msl}}}} + \theta \times {{\rm{X}}_{{\rm{ms}}}} + {\alpha _{\rm{s}}}{\rm{ + }}{\delta _{\rm{l}}} + {\varepsilon _{\rm{s}}}$$
where m, s, and l index the municipality, state, and audit number (lottery) of the program; y is one of our several outcomes of interest, detailed in Section 3.3; corruption is a measure of corruption per capita; X is a matrix of municipal-level controls; δ is an audit/lottery fixed effect; α is a state fixed effect; and ε is the error term. Standard errors are clustered by state. Though the corruption data is cross-sectional, we use the m, s, and l subscripts to emphasize that these corruption scores come from different audits. We estimate Equation (1) using Ordinary Least Squares (OLS).Footnote 8
Corruption
We use Avis et al. (Reference Avis, Ferraz and Finan2018)’s measure of corruption, defined as the (log) number of corruption instances uncovered in a random audit of the municipality. We scale this number by population to account for the large variation in municipal size. We explain the details of the random audit program, the corruption measure, and the sample in this section.
In Brazil, a significant portion of municipal funding comes in the form of constitutionally mandated transfers from the federal government. Discretion concerning how to use these funds is largely left to the municipality, which invites misuse and corruption at the local level. To combat this corruption, Brazil implemented a random audit program (Programa de Fiscalização por Sorteios Públicos) commencing in 2003 where municipalities were selected via national lottery and subsequently audited for corruption. Footnote 9 Each lottery includes a subset of municipalities, ranging anywhere from 5 to 60, and the frequency of the lotteries has varied throughout the program. The goal of the audits is to uncover malfeasance in the use of public funds. Teams of auditors are sent to investigate any irregularities in the application of the federal transfers, and the results of the audits are made public. Avis et al. (Reference Avis, Ferraz and Finan2018) use these reports to construct their measure of corruption. They define any irregularity that the Corregedoria Geral da União (CGU) defines as moderate to severe as an act of corruption; the sum of these acts is their measure of the municipal level of corruption.10 Similar measures derived from these audits are now commonly employed in the literature (e.g., Ferraz and Finan, Reference Ferraz and Finan2008, Reference Ferraz and Finan2011; Bologna and Ross, Reference Bologna and Ross2015; Brollo and Troiano, Reference Brollo and Troiano2016; Bologna and Pavlik, Reference Bologna Pavlik2018; Colonnelli and Prem, Reference Colonnelli and Prem2022).
Brazil has a total of 5570 municipalities. From 2003 through 2015, 1949 of these municipalities experienced at least one audit, with 2241 audits in total (Avis et al., Reference Avis, Ferraz and Finan2018). Because Avis et al. (Reference Avis, Ferraz and Finan2018) focus on two electoral terms (namely, 2004–2008 and 2008–2012) and because audits ceased the random component in 2015, their dataset focuses on corruption uncovered in audits that occurred anytime between July of 2006 and March of 2013; i.e., lotteries 22 through 38. Since these audits uncover corrupt activity occurring anytime in the 3–4 years prior to the audit, they expose corruption ex post. In principle, then, this corruption measure contains corruption occurring anytime in the 2003 through 2013 period. We cannot obtain information on the exact timing of the corrupt activity.
The fact that these audits expose corruption ex post is particularly important for our analysis. First, even audits occurring in 2013 are likely to contain corrupt activities from 2010 or earlier. Thus, given our focus on 2010 outcomes, these later audits are relevant for our analysis. Footnote 10 Second, we are interested in the cross-sectional variation of corruption. Because corruption is extremely persistent, corrupt activity occurring at any point in this ten-year period is likely reflective of the corrupt environment that exists within the municipality. For example, taking the sub-sample of municipalities in Avis et al. (Reference Avis, Ferraz and Finan2018) that were audited multiple times and have corruption measurements available in each audit (48), Footnote 11 we find that the average change in their corruption scores (log number of corruption instances) is approximately zero. Footnote 12 More importantly for this paper, the relative ranking of corruption scores moves little over time for these municipalities. Though, as cautioned in Avis et al. (Reference Avis, Ferraz and Finan2018), audit protocol differed across lotteries, making corruption levels difficult to compare through time. This is why all regressions include lottery fixed effects, and our focus is on cross-sectional, within-lottery effects.
Avis et al. (Reference Avis, Ferraz and Finan2018)’s sample contains 1020 audits across 967 municipalities. For the 53 municipalities that were audited multiple times in this period, we average their corruption scores across the multiple audits (when possible). Footnote 13 We also drop municipalities where corruption scores were missing in the Avis et al. (Reference Avis, Ferraz and Finan2018) dataset. There were only 37 instances of this, 5 of which were municipalities that were audited twice, and thus we have a corruption score from the other audit. Footnote 14 This leaves us with 935 municipalities for which we can study the corruption–female leadership relationship. This sample is limited to only those eligible and selected for audit; large municipalities are excluded.Footnote 15
Measures of female leadership
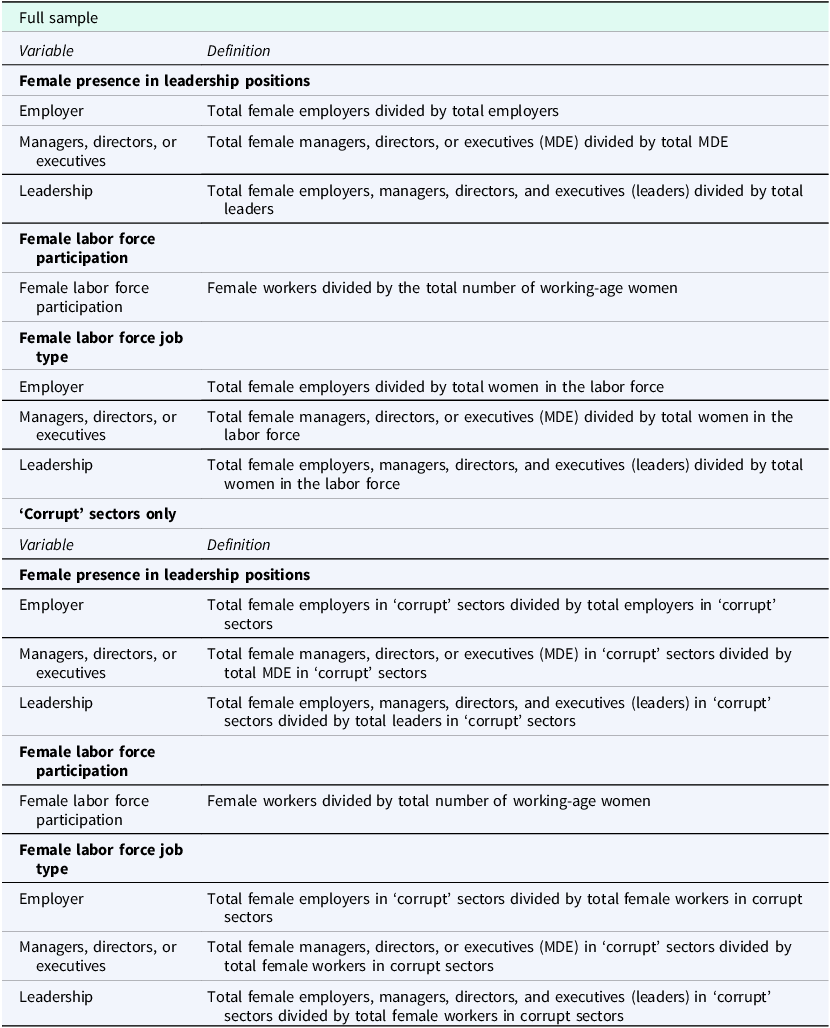
Our measures of the presence of women in leadership positions come from the 2010 Census. For each working individual in the sample, we identify their worker type (employee or employer). For those that are ‘employees,’ we further classify their occupation type using 3-digit occupational codes. We define employees to be leaders if they are coded as a general director, executive, or manager. Employers are leaders by definition. All outcome definitions are summarized in Table 1.
Table 1. Outcome variable definitions

Notes: All outcome variables are calculated using the 2010 Census.
Before describing the details of our measures, we note the importance of the employer versus employee with a leadership role (e.g., manager) distinction. Employers exhibit more individual choice and are likely exposed to more corruption. Employers are business owners and are explicitly in charge of their business. They are not chosen or assigned by other individuals with higher levels of power within the firm and are more likely to interact with local administration directly. Management, however, could be more reflective of how women – relative to men – acquire different levels of employment in high corruption areas. Both are important aspects of the female leadership-corruption relationship, and thus we combine them as our main measure of ‘leadership’. However, it is plausible that they exhibit slightly different associations with corruption and thus are also always analyzed separately.
Female leadership presence – the ‘glass-ceiling’ effect
Our main measure is the share of all leadership positions – i.e., employees that are in a manager, general director, or executive role and employers – that are occupied by women.
To avoid ambiguity, this measure is calculated as:
 $${Y_{ms}} = \;{{\sum\nolimits_{i = 1}^I W omen\;in\;Leadership\;Role} \over {\sum\nolimits_{i = 1}^I L eadership\;Roles}}\;$$
where i indexes the individual and I represents the last individual in the sample. We also consider the share of positions in each category held by women: employees in management roles (managers, directors, or executives) and employers. Note that in these latter two cases, the denominator focuses only on total leadership positions in the respective category. For example, for employers, our measure is the total female employers divided by all employers in the municipality. This also helps explain why the observation numbers drop for these separate categories: some municipalities are very small and have no employers and/or positions of leadership. On average, around 33% of all leadership positions are held by women in our sample (see Table 2). This number is lower when looking at shares of employers (26.3%) and higher when looking at employees in management roles (35%).
Table 2. Summary statistics for outcome measures
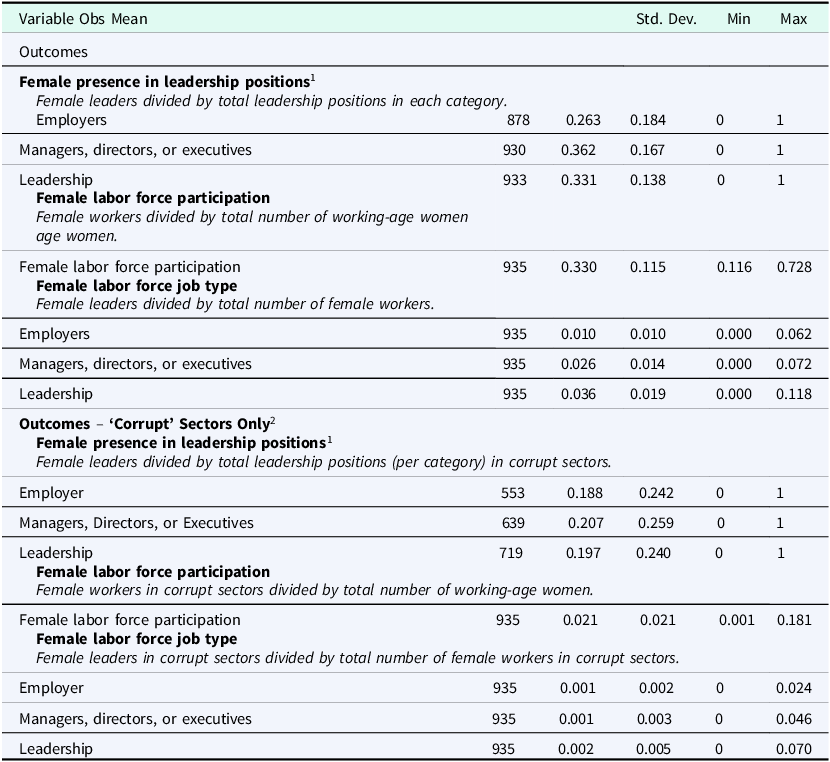
Notes: 1The observation numbers in this group are lower because some municipalities are small and have no leadership positions, making the denominator zero, as the denominator is different for each category of leadership (i.e., total employers, total managers, directors, or executives, and total leaders). The denominator is constant across all other categories of leaderships for the other outcome measures. All municipalities have women and working women, and thus, there are no undefined observations when using the other measures. It is likely that these small municipalities also comprise the minimum (0% of leadership positions held by women) and maximum (100% of leadership positions held by women) of these measures. 2 ‘Corrupt’ sectors are extractive industries, manufacturing, construction, and transportation and communication, following Bologna and Ross (Reference Bologna and Ross2015).
Female labor force participation and leadership
Additionally, we examine the share of working-age women that are in the labor force. We then further narrow in on these working women and calculate the share that hold a leadership position. As above, ‘leadership’ is defined as an employer or an employee that is either a manager, general director, or executive. On average, 33% of working-age women are in the labor force, and only 3.6% of working women hold a leadership position.
Again, for clarity, we calculate these measures as follows:
 $${Y_{ms}} = \;{{\sum\nolimits_{i = 1}^I W omen\;in\;Labor\;Force} \over {\sum\nolimits_{i = 1}^I W orking - Age\;Woman\;Census\;Respondent}}$$
 $${Y_{ms}} = \;{{\sum\nolimits_{i = 1}^I W omen\;in\;Leadership\;Role} \over {\sum\nolimits_{i = 1}^I W omen\;in\;Labor\;Force}}$$
The first set of outcomes that examines the share of women in specific categories of leadership aims to capture leadership presence. The second set of outcomes, however, focuses on labor force participation and the types of jobs that women hold if they are working – thus implicitly controlling for labor force participation. Corruption may reduce female leadership presence because it decreases female labor force participation or because it inhibits female career advancement, or both.
Control variables
Following Bologna and Ross (Reference Bologna and Ross2015) and Bologna (Reference Bologna2016), our control variables aim to capture the general economic environment of the municipality, with an emphasis on the level of overall development. These variables include (logged) GDP per capita, (logged) population density, the size of the informal sector (measured as a share of employment), the percent of the adult (25 years or older) population with a college degree, the percent of the population that is male, the percent of the population that is of a standard working age (18–65), and the share of the population that lives in an urban area. These are referred to as our baseline controls.
Most of these controls are relatively standard in development, but the size of the informal economy perhaps warrants further discussion. Bologna (Reference Bologna2016) emphasizes the importance of controlling for the size of the informal sector in any analysis of corruption and income, as corruption and informality are likely correlated. Footnote 16 Indeed, Bologna (Reference Bologna2016) finds that informality is a stronger predictor of income than corruption in their sample of Brazilian municipalities. Moreover, given the independent importance of informality in explaining gender gaps (Malta et al., Reference Malta, Kolovich, Martinez and Tavares2019), this is an important control in our analysis.
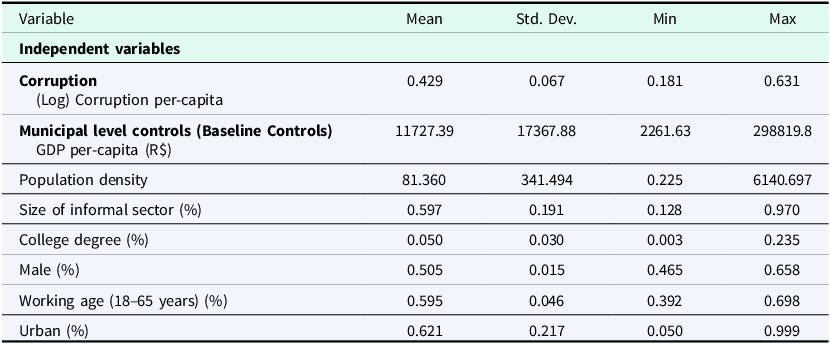
Summary statistics are presented for these baseline controls in Table 3 using the largest sample of municipalities (935) in our study. Footnote 17 Note that these municipalities are diverse, and some municipalities are very small (as low as 1409 in population). This striking diversity is also reflected in the informality and urban measures. For example, while informality is common in Brazil (approximately 60% of employment is informal on average), some municipalities rely almost exclusively on informal employment (97%). The share of the population that lives in an urban area ranges from only 5% to nearly 100% across the included municipalities.
Table 3. Summary statistics for the main independent variable (corruption) and controls

Notes: GDP per capita and population density enter regression in logged form. Summary statistics are given for the full sample of 935 municipalities. 1For instrumental variables, they refer to 929 municipalities; data is unavailable for 6 municipalities emancipated in the early 2000s, after the creation of the Management Capacity Index (IQIM – Indicador de Qualidade Institucional Municipal). 2 In the context of Brazil, municipal councils (conselhos municipais) are commissions established by law to propose or advise on policy initiatives in a specific area (e.g., health, education) and oversee their implementation. These councils typically include representatives from the local public administration and civil society organizations. Notably, they differ from city councils (câmaras municipais), which serve as the local legislative branch. The measures report indexes on the number of councils and number of active councils, scaled from 1 (least councils) to 6 (most councils). A council is coded as active if they have individuals appointed in positions.
In Online Appendix B, we also include industry employment shares as controls. Regressions are at the municipality level (as opposed to individual level), and municipalities have different sectoral compositions. However, our focus is on the estimates without these measures, as they are likely ‘bad’ controls à la Angrist and Pischke (Reference Angrist and Pischke2009). The effect of corruption on female leadership is likely to work (in part) through industry choice, and, therefore, by including sector composition as a control, we could be eliminating one of the main channels through which corruption can impact female leadership. Our results in Online Appendix B confirm this suspicion. Once we control for sectoral composition, much of the effect of corruption disappears. This does not suggest that corruption is irrelevant; however, it simply implies that much of corruption’s effect works through sectoral composition and that the two are highly correlated. We believe studying the effect of corruption on sector choice for women would be beneficial for future research, but it is beyond the scope of this paper to do so.
‘Corrupt’ sector sub-sample
Our main set of results uses all individual-level Census data to create female leadership presence and labor force measures for each municipality. As such, we get an estimate of how municipal corruption impacts female leadership overall. However, this average effect includes corruption’s impact on female leadership across all sectors and may not be reflective of corruption’s impact on leadership in sectors that are more or less prone to corruption. Traditionally, the corrupt sectors could have lower female presence in general, making it particularly difficult for women to advance their careers. On the other hand, the women that are willing to work in these sectors within a relatively corrupt country could be more risk-tolerant and willing to engage in corruption, which could increase female representation among leaders in this group. A highly corrupt municipality could signal a stronger corruption ‘treatment’ in these sectors, relative to others, and thus may have a different effect on leadership in corruption-prone sectors than the average.
We follow Bologna and Ross (Reference Bologna and Ross2015) and consider the following four sectors as corruption prone: (1) extractive (e.g., mining), (2) manufacturing, (3) construction, and (4) transportation/communication sectors. Bologna and Ross (Reference Bologna and Ross2015) identify these four sectors as ‘corrupt’ using the Organization for Economic Cooperation and Development (OECD) Foreign Bribery Report (2014). Within this report, these four sectors accounted for nearly 70% of all corruption cases studied. While corruption can and likely does exist in any industry, Footnote 18 we define these four sectors as ‘corrupt’ sectors and focus our analysis on this sub-sample. However, in Online Appendix D, we also present data and results for the ‘non-corrupt’ sub-sample, defined as all remaining industries, as a comparison.
Table 2 presents summary statistics for this sub-sample along with the full sample discussed above. Female labor force participation in these ‘corrupt’ sectors is much lower than the overall average. Only 2.1% of working-age women are employed in these sectors, though 33% of women in this group are working in general (across any sector). Thus, these industries comprise only 6.36% (2.1/33) of total female workers in the economy; this is compared to the 19.72% of total employment that these industries constitute overall. Perhaps more importantly, women are less likely to be leaders within these industries. Female leaders as a share of total leadership positions across all industries averages 33.1%, whereas female leaders within these four sectors are less than 20%. Moreover, female leadership shares in the other (non-corrupt) sectors are much higher at 35.2% (Online Appendix, Table D1). These statistics highlight potential differences in female representation in corruption-prone industries and thus motivate the idea that the effect of corruption could be different in this more susceptible group. However, they are unconditional averages, and differences should not be interpreted as a marginal effect of municipal corruption. We must estimate this effect using OLS regressions, and we do so in the following section.
Results
Female presence in leadership positions
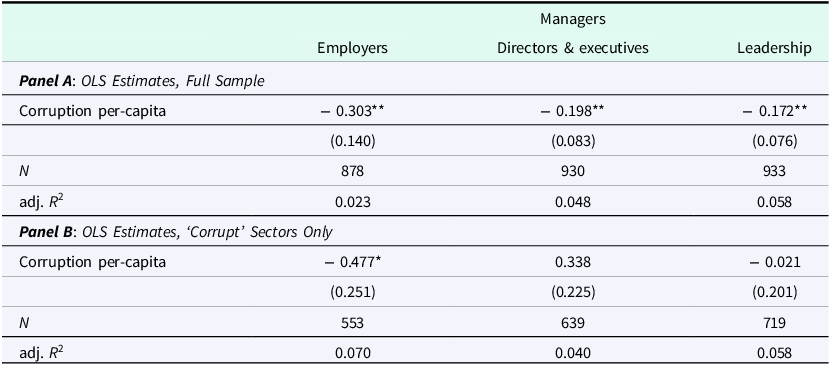
We begin the discussion of our results with the first set of outcomes: the share of leadership positions held by women. The focus of these results is on uncovering a potential ‘glass-ceiling’ effect. The main results are summarized in Table 4. Panel A estimates results using the full sample of data, and Panel B uses data from ‘corrupt’ sectors only.Footnote 19
Table 4. The effect of corruption on the share of leadership positions held by women

Notes: *** p-value < 0.01, ** p-value < 0.05, * p-value < 0.1. See Table 3 for a list of the baseline controls. Standard errors clustered by state in parentheses.
Starting with the full sample OLS results ( Panel A ), the effect of corruption per capita on female leadership presence is negative and statistically significant (5% level) for employers, managementFootnote 20 , and leadership. However, the effect sizes are relatively modest. A one standard deviation increase in corruption (0.067) corresponds to a 2 percentage point decrease in the share of employers that are female. This amounts to approximately 5.6% of a standard deviation change in this category. Similarly, for management, a standard deviation increase in corruption reduces female presence by 1.3 percentage points (or 8% of a standard deviation). And, for all categories, this effect reduces female leadership by 1.2 percentage points (8% of a standard deviation).
The results change slightly when looking at the corrupt sample. The effect of corruption on the share of employers that are female is quantitatively larger – a standard deviation increase in corruption explains approximately 16% of a standard deviation change in this category Panel B . Another difference is that the share of management positions held by women is now positively correlated with municipal corruption. Although this effect is not statistically significant, it is an important difference from the full sample results and warrants further discussion.
Corrupt sectors have a far lower representation in leadership than the overall average. Women account for only 18.8% of employers, 20.7% of management, and 19.7% of leaders in corruption-prone sectors relative to 26.3%, 36.2%, and 33.1% overall. Therefore, while the gender composition of leadership does not vary with municipal corruption, it does seem that women are avoiding these sectors in general. The women that are willing and able to obtain leadership positions within corruption-prone sectors could have similar levels of risk tolerance (or some other unobservable characteristic) as men and, therefore, are similarly affected by municipal corruption. Female employers, however, have more flexibility in avoiding these corruption-prone sectors altogether. This is likely why the singular statistically significant coefficient we find for the corrupt sectors in Table 4 is for employers alone.
Thus, while the two samples yield mixed results, a similar theme remains. If anything, corruption seems to be a deterrent to female leadership presence. For the full sample, municipal corruption has a negative association with the share of leadership positions held by women. For the corrupt sample, it seems that this glass-ceiling effect might exist more at the macro than the municipal level.
Female labor force participation & job type
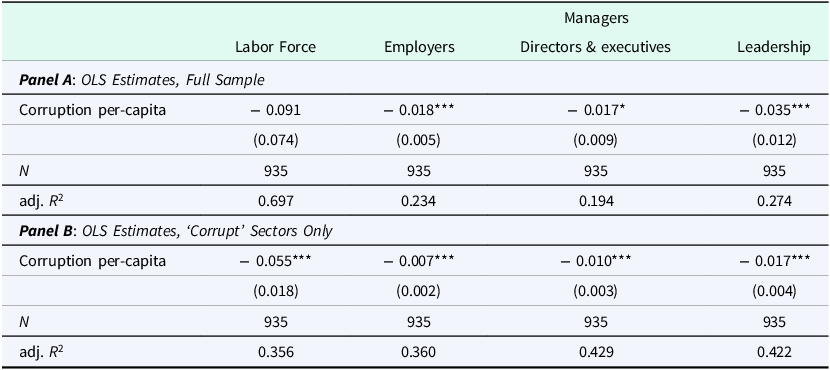
Table 5 presents results for female labor force participation and the share of the female labor force that holds leadership positions. The structure of this table is the same as in Table 4. As above, we detail the full sample results first – Panel A . The share of the female labor force that are employers, managers, or in leadership positions is lower in more corrupt municipalities. These results are significant at the 10% level or better in all cases. However, they are relatively modest – explaining approximately 8–12% of a standard deviation in the outcomes. What is interesting, however, is that despite the robust effect of corruption on the share of women working leadership roles, there is no (significant) association between female labor force participation and municipal corruption in the full sample. One way to interpret these results – in conjunction with the results concerning female leadership presence (Table 4) – is that municipal corruption changes the types of jobs that women obtain but does not necessarily keep them out of the labor force.
Table 5. The effect of corruption on the share of women that are in the labor force and the share of the female labor force that hold leadership positions

Notes: *** p-value < 0.01, ** p-value < 0.05, * p-value < 0.1. See Table 3 for a list of the baseline controls. Standard errors clustered by state in parentheses.
The corrupt sample results largely resemble the full sample, with one exception. Municipal corruption tends to lower female labor force participation in corrupt sectors. The remaining results are similar. The share of working women that hold leadership positions is substantially smaller in corrupt municipalities. Note that this can be true despite the lack of an effect on female presence among leadership uncovered in Table 4. It may be that corruption reduces the number of leadership positions for both men and women, thereby reducing the share of working women that are in leadership but leaving the gender composition of leaders unchanged. Footnote 21 Regardless, it is clear that municipal corruption changes the types of jobs that women obtain – a smaller percentage of working women are obtaining positions of leadership.
Concluding discussion
We study the effect of corruption on female leadership presence in Brazil. We use cross-sectional municipal-level data to test whether municipal corruption impacts (1) female presence among all leadership positions (relative to men) in the municipality and/or (2) female labor force participation and the share of working women that obtain leadership roles.
Our results suggest that corruption is a deterrent to female leadership. There is clear evidence that municipal corruption reduces the share of working women that obtain positions of leadership. Thus, it influences the types of jobs women obtain, but this effect should not be interpreted relative to men. There is less evidence that corruption changes the gender composition of leadership roles (glass-ceiling effect). We do find a general negative association between municipal corruption and the proportion of leadership positions held by women.
In addition to the full sample of results, including all sectors of the economy, we also follow Bologna and Ross (Reference Bologna and Ross2015) and study sectors that are prone to corruption separately. These sectors have far lower female representation in general but, given the known potential for corrupt activity, may induce a selection effect that is masked when examining all sectors together. In these sectors, we see that municipal corruption reduces the share of employers that are women, like in the full sample. However, we now find that municipal corruption has a positive, though insignificant, association with the share of management positions held by women. Employers have much more flexibility in avoiding certain sectors; thus, we believe this highlights the importance of examining the leadership categories separately.
We also find stronger evidence (relative to the full sample) in the corruption-prone sample that municipal corruption reduces female labor force participation. This implies a sorting effect in that perhaps corruption drives sector choice. We believe an interesting area of future research would be to examine the effect of corruption on female participation across different sectors. If corruption is driving women to work in less corruption-prone sectors and these sectors have less opportunity for career advancement, this could help explain how corruption may act as a barrier to women.
We also believe that examining potential spillover effects of corruption on female labor market outcomes would be an interesting future analysis. It could be that women are escaping corrupt environments and moving to nearby, presumably less-corrupt municipalities. Thus, while corruption might reduce female leadership presence in one municipality, it increases it in others. Understanding the spatial dynamics of corruption would help shed light on the full effect of corruption on female leadership.
Supplementary material
For supplementary material accompanying this paper visit https://doi.org/10.1017/S1744137425100301


 Open access