


I. Introduction
Private capital markets have contributed significantly to capital formation in the U.S. economy, particularly for small businesses that are considered an engine for job creation and economic growth (see, e.g., Zhao, Harris, and Lam (Reference Zhao, Harris and Lam2019)). Capital raised in private markets has outpaced that raised in public markets during recent years. For example, in 2022, public markets raised about $1 trillion in the United States, whereas private markets raised over $3.7 trillion (Kiernan (Reference Kiernan2023)). However, despite the huge inflows of capital into private markets, this market is still nontransparent to investors, market participants, policymakers, and the public.Footnote 1
On Apr. 5, 2012, the United States adopted the Jumpstart Our Business Startups (JOBS) Act, which allows startups to raise capital from a broader investor pool. Under Title II of the JOBS Act, which became effective on Sept. 23, 2013, small businesses can advertise and sell securities in private placements via general solicitation (GS), such as advertising in newspapers or on the Internet, as long as the sales are made only to accredited investors, verified using a detailed process. Empirical evidence on Title II’s effect on small business funding is quite limited. This article aims to fill this gap by examining how Title II of the JOBS Act affects the financing of small businesses by allowing them to publicly advertise their securities offerings. To the best of our knowledge, this is the first article to empirically analyze the efficacy of Title II in enabling small businesses to raise capital. This topic is also of interest to market participants in these offerings (investors, entrepreneurs, or brokers), regulators, and policymakers.
Specifically, a firm that needs to raise capital can offer and sell securities without registering the offering with the U.S. Securities and Exchange Commission (SEC) under rule 506 of a Regulation D exemption. Under Title II, this exemption provides two alternate ways to structure securities offerings: rule 506(c) and rule 506(b). Title II added the new rule 506(c) to the traditional rule 506, now called rule 506(b). Rule 506(c) allows issuers to contact investors through advertising and social media but requires issuers to ensure that each of its investors is accredited, using an elaborate verification process. An offering under rule 506(b) cannot use GS or advertising to market the securities, but investors can self-certify that they are accredited simply by checking a box on an issuer-provided questionnaire. Moreover, rule 506(b) allows issuers to sell to 35 or fewer unaccredited (but financially sophisticated)Footnote 2 investors, whereas rule 506(c) does not allow sales to any unaccredited investors.
Although the market for private placements has grown in size and importance, its full extent and functioning and the role of financial intermediaries in this market have not been systematically investigated. Most of the literature on private firms’ equity fundraising focuses on venture capital (VC; see, e.g., Metrick and Yasuda (Reference Metrick and Yasuda2011) for a recent review), which is available to only the most promising startups (see Chen, Hshieh, and Zhang (Reference Chen, Hshieh and Zhang2021)). Using a comprehensive set of Form D private placements of equity, this article investigates the impact of the JOBS Act on equity financings by a much broader set of startups. Our study complements Yimfor (Reference Yimfor2025), which focuses on the role of brokers and finders in Form D financings.
Our analysis yields three sets of results. First, we identify the characteristics of firms and offerings that choose GS (i.e., 506(c)) offerings over non-GS (i.e., 506(b)) offerings. We find that firms that choose GS offerings are riskier: They tend to have lower revenue and fewer investors and are more likely to make offerings that last for over a year.
Second, we find that GS offerings are substantially more likely than non-GS offerings to employ a broker or a finder (20% vs. 6%). However, GS offerings have to pay larger percentage brokerage fees, likely to cover the costs of advertising and verifying investor accreditation.
Third, GS offerings have a lower funding success rate (i.e., they raise a lower fraction of the target amount of capital) and raise less capital than non-GS offerings. The net proceeds raised (= Amount sold − Brokerage commissions − Proceeds paid to insiders) are also substantially lower in GS offerings than in non-GS offerings. However, new entrants that use GS have a greater success rate, although they raise less money. This finding supports the notion that GS increases access to capital for new entrants. Perhaps they raise less money simply because they need less capital. Finally, GS offerings that employ registered brokers have a higher success rate and raise more capital than those using unregistered brokers (i.e., finders). Thus, although Title II appears to have an adverse overall effect on small business financing, it appears to have a positive effect on new entrants and issuers who use registered brokers.
Beyond the outcomes of the financing itself, we next consider outcomes at the firm level: receipt of VC financing, which typically goes only to the most promising and innovative startups, and successful exit via IPO or mergers and acquisitions (M&A). We find that GS offerings are less likely to receive VC funding by the end of 2024 and receive fewer rounds of funding when they do. They are also less likely to exit successfully via IPO or acquisition by the end of 2024. The success of Form D financing improves future VC financing outcomes as well as the likelihood of successful exit, although there is no differential improvement for GS offerings.
If Title II of the JOBS Act is successful, then we might expect a new set of issuers to take advantage of the new GS method to raise capital in private placements from the public. These new issuers may differ from non-GS issuers, who rely only on their and their brokers’ professional networks to place securities. These potential differences can create a challenge for empirically testing whether the Act broadened access to capital to a new set of firms that could not access this market earlier, because of the lack of a counterfactual. However, we find that there is little difference between the two offering methods in the proportion of new entrants to the securities market. The second, usual, identification concern is that there may be omitted characteristics of the firm, offering, or project that are related both to the likelihood of using the GS method and the likelihood of financing success.
While selection concerns are generally difficult to rule out completely, we try to mitigate them by using four different approaches. First, in our baseline tests, we control for several firm and offering characteristics, such as firm age, revenue, number of investors, and longer offering, and include fixed effects for year, as well as for either firm or industry and state of firm location. Second, we compare issuers that switch their offering method from non-GS to GS (“switchers”) for their subsequent offering matched to issuers that stay with the non-GS method (“stayers”) using propensity score matching (PSM). Third, we separately analyze the subsample of firms that raise capital using both methods in the same year and include firm fixed effects in these regressions to remove the effect of firm characteristics that might affect both the choice of GS and the success rate of financing and to differentiate across project-specific effects within a given firm. This approach further mitigates selection concerns arising from different types of firms choosing different offering methods because we examine the same firm that chooses both offering methods at roughly the same time. We further analyze partitions of this subsample based on whether the first offering by a firm is GS or non-GS. Finally, we conduct a variety of robustness checks of our main results. Although each of these approaches has its own strengths and weaknesses, our main findings are remarkably consistent: GS offerings have lower success rates and raise less capital than non-GS offerings.
Title I of the JOBS Act, which reduces disclosure requirements for IPOs of emerging growth companies, has been widely investigated in the literature (see, e.g., Barth, Landsman, and Taylor (Reference Barth, Landsman and Taylor2017), Chaplinsky, Hanley, and Moon (Reference Chaplinsky, Hanley and Moon2017), and Dambra, Field, and Gustafson (Reference Dambra, Field and Gustafson2015)). An SEC white paper discusses the regulatory framework and aggregate statistics of private placements (see Bauguess, Gullapalli, and Ivanov (Reference Bauguess, Gullapalli and Ivanov2018)). We contribute to this line of research by providing a systematic empirical analysis of the effectiveness of Title II of the Act that provides small businesses with broader access to capital prior to IPO.
Our article also contributes to the literature on entrepreneurial finance (see Ewens and Farre-Mensa (Reference Ewens and Farre-Mensa2022) for a review), angel investing (e.g., Hellmann and Thiele (Reference Hellmann and Thiele2015)), crowdfunding (e.g., Agrawal, Catalini, and Goldfarb (Reference Agrawal, Catalini and Goldfarb2015), Estrin, Gozman, and Khavul (Reference Estrin, Gozman and Khavul2018), and Mochkabadi, Kazem, and Volkmann (Reference Mochkabadi and Volkmann2018)), and private placements of public equity (e.g., Chakraborty and Gantchev (Reference Chakraborty and Gantchev2013)).
This article proceeds as follows: Section II discusses the related literature. Section III details the data and sample. Section IV presents our baseline results. Section V presents the identification tests, and Section VI concludes.
II. Background, Literature Review, and Hypothesis Development
A. The JOBS Act
This study analyzes unregistered securities offerings pursuant to Regulation D of the Securities Act. Before the JOBS Act, rule 502 of Regulation D of the Securities Act of 1933 prohibited the GS or advertising of securities in rule 506 offerings.Footnote 3 Section 201 of Title II of the JOBS Act removes this prohibition, allowing issuers to approach a wide pool of investors, potentially raising more capital. The new rule 506(c) under Title II of the JOBS Act allows companies to engage in GS or advertising of unregistered securities offerings, provided the securities are sold only to accredited investors.Footnote 4 We report a few examples of GS in such offerings in Appendix C.
To participate in a GS offering, the issuer must take “reasonable steps” to confirm that each participating investor is accredited. Typically, this involves obtaining a letter from a financial professional who knows the investor, such as an accountant, lawyer, or investment or tax advisor. The SEC also indicates that issuers may verify an investor’s income for eligibility purposes by reviewing IRS documents and may review their bank and brokerage statements and credit reports to determine net worth. Although accreditation need not take place for every investment, the SEC mandates that accreditation should be recertified every 3 months. The rule requires issuers or their brokers to follow these high standards in the selection of each accredited investor, which is an involved and time-consuming process.
B. Literature Review and Hypothesis Development
This section presents the conceptual framework behind this article. There are two competing, nonmutually exclusive hypotheses about the efficacy of GS for issuers: Adverse selection and search costs. On the one hand, GS can increase adverse selection costs by helping low-type issuers reach beyond the pool of “smart” investors previously available in an only non-GS world. However, by permitting more liberal communication with potential investors, GS can decrease search costs, which should benefit issuers. Thus, the net effect of GS on issuers is an empirical issue that has not been examined, to the best of our knowledge.
If Title II of the JOBS Act is effective, firms with fewer connections to potential investors would be able to raise capital successfully using GS. Prior literature offers conflicting predictions on whether the JOBS Act would be effective in providing access to public capital to small, unconnected firms. Jeng (Reference Jeng2012) argues that the JOBS Act can have a positive impact on capital formation and investor protection by allowing firms to publicly solicit and advertise. An entrepreneur’s professional connections have been found to reduce information asymmetry between the entrepreneur and investors in the crowdfunding market (see, e.g., Vismara (Reference Vismara2016a), (Reference Vismara2018), Ahlers, Cumming, Günther, and Schweizer (Reference Ahlers, Cumming, Günther and Schweizer2015)). If the law reduces small businesses’ cost of accessing private capital via advertising, that should also improve their future access to capital by broadening their investor base.
However, other studies suggest that adverse selection due to information asymmetry can lead to the law having unanticipated negative consequences for small firms. For example, GS offerings may raise less capital because GS attracts lower quality offerings. Because of the Act, a new set of firms may come to the market to raise capital that could not raise capital as easily before. These firms may be less attractive to investors, so they are more likely to fail to raise capital and to raise less capital when they do succeed. This can happen for at least three reasons. First, a large theoretical literature shows that small firms have difficulty in raising capital due to greater information asymmetry with potential investors (see, e.g., Amit, Glosten, and Muller (Reference Amit, Glosten and Muller1990), Chan, Siegel, and Thakor (Reference Chan, Siegel and Thakor1990), and Gompers (Reference Gompers1995)). In other words, potential investors are reluctant to invest in startups because they have less information about the issuer’s prospects than the issuer (see, e.g., Sufi (Reference Sufi2007)). Similarly, Hildebrand, Puri, and Rocholl (Reference Hildebrand, Puri and Rocholl2017) show that without financial intermediaries to reduce information asymmetry, lead investors can wrongly place higher bids on low-quality issues.Footnote 5 Chen (Reference Chen2018) also shows that adverse selection is a first-order barrier to crowdfunding and can lead to market failure. He calls for new market mechanisms to solve the adverse selection problem in this market. Dorff (Reference Dorff2014) finds that promising startups that can raise capital from professional investors, such as VCs, do not use crowdfunding, leaving this market to less promising ventures.Footnote 6
Second, advertising may not help small businesses raise more capital due to investors’ local bias. Investors prefer making early-stage investments in local firms (see, e.g., Lin and Viswanathan (Reference Lin and Viswanathan2016)) for at least two reasons. First, GS exposes startup firms to distant investors through online platforms, such as AngelList. However, early-stage investments often involve distance-sensitive costs, such as identifying opportunities, conducting due diligence, and monitoring progress (see, e.g., Lerner (Reference Lerner1995), Nieuwerburgh and Veldkamp (Reference Nieuwerburgh and Veldkamp2009), and Seasholes and Zhu (Reference Seasholes and Zhu2005)). These costs deter distant investors from investing in response to GS. Second, in the absence of regulatory disclosures and monitoring, investors in startups seek reputation and trust, which are built through social interactions mostly between co-located individuals (see, e.g., Agrawal et al. (Reference Agrawal, Catalini and Goldfarb2015)). Thus, distant investors are unlikely to invest in these firms due to a lack of reputation and trust.
Third, riskier startups may try to raise larger amounts than they can raise because less talented entrepreneurs often tend to be overconfident about their abilities (see Cooper, Woo, and Dunkelberg (Reference Cooper, Woo and Dunkelberg1988)). Given entrepreneurs’ optimism, we predict lower funding success for riskier firms. Motivated by this literature, we hypothesize the following:
Hypothesis 1. Riskier firms choose GS offerings, whereas less risky firms choose non-GS offerings.
Hypothesis 2a. GS offerings have higher success in financing than non-GS offerings.
Hypothesis 2b. GS offerings have lower success in financing than non-GS offerings.
Firms without social or professional ties to investors must rely on GS to raise capital. These types of firms must choose to issue under GS and rely on third parties, such as financial intermediaries, to find potential investors, resulting in higher fees to brokers and dealers. Investors benefit from brokers via lower search costs (see Bergstresser, Chalmers, and Tufano (Reference Bergstresser, Chalmers and Tufano2008) for a review). However, prior studies find that brokers do not deliver substantial benefits for investors who pay higher fees to them (see, e.g., Bolton, Freixas, and Shapiro (Reference Bolton, Freixas and Shapiro2007), Inderst and Ottaviani (Reference Inderst and Ottaviani2011)). Thus, GS offerings may fail to raise the target amount despite paying larger brokerage fees. This hypothesis implies that the JOBS Act has unintended consequences due to excessive broker commissions for private placement. Therefore, we hypothesize the following:
Hypothesis 3. GS offerings require larger brokerage commissions than non-GS offerings.
Hypothesis 4a. GS offerings that pay larger brokerage commissions have higher success rates than non-GS offerings.
Hypothesis 4b. GS offerings that pay larger brokerage commissions have lower success rates than non-GS offerings.
Finally, we examine the potential marginal effects of GS relative to existing solutions to adverse selection and search costs in private offerings, such as registered brokers and finders, analyzed recently by Yimfor (Reference Yimfor2025). Brokers and finders have legally distinct roles that affect behavior.Footnote 7 Brokers offer advice and are legally bound to suitability and now best interest requirements.Footnote 8 They are more likely to have long-term clients (i.e., play a repeated game) and can be viewed as potential solutions to adverse selection. Finders are “human advertisers” who are prohibited from earning commissions and advising on a deal. They can potentially mitigate search costs but not adverse selection. If GS offerings mitigate search costs but not adverse selection, GS complements brokers who mitigate adverse selection, and GS substitutes for finders who reduce search costs. Thus, we hypothesize the following:
Hypothesis 5a. If GS complements brokers, GS with brokers should have higher success in financing than GS without brokers.
Hypothesis 5b. If GS substitutes for finders, GS with finders should not have higher success in financing than GS without finders.
III. Data and Key Variables
A. Institutional Background
Firms can offer and sell securities without registering them with the SEC through a Regulation D exemption under the Securities Act of 1933 by filing Form D. Although rule 504 (505) allows offerings of up to $1 million ($5 million) within a 12-month period, rule 506, which has two parts (506(b) and 506(c)) allows offerings of unlimited amounts.
An issuer must file a new Form D with the SEC for each new security offering within 15 calendar days after the date of first sale, which is the date on which the first investor commits to invest. Depending on the contract’s terms and conditions, this can be the date on which the issuer receives the investor’s subscription agreement or check. If there is any change or material mistake or error in the previously filed Form D, the issuer must file an amendment (Form D/A) to correct the problem as soon as practicable after the change, and annually, on or before the first anniversary of the most recent previous filing, if the offering is still continuing at that time.
B. Sample Selection
To evaluate the effect of Title II, we examine all the issuers of equity offerings covered by a Regulation D exemption via rule 506 that are required to file a Form D with the SEC over the 2008–2021 period. We focus on equity offerings, instead of all security offerings, to avoid the potential heterogeneity induced by the type of security being issued. We consider both the existing 506(b) exemption and the new 506(c) exemption. Rule 506(c) allows GS or advertising to the public as long as the securities are sold only to accredited investors, whereas rule 506(b) does not allow GS or advertising to the public but allows the securities to be sold to accredited investors and up to 35 unaccredited investors.Footnote 9 Beginning Mar. 16, 2009, Form D must be filed with the SEC electronically. We obtain data on Form D filings from the Audit Analytics Private Placement Database.
Panel A of Table 1 describes our sample selection process. We start with all electronic Form D and D/A filings under rule 506 of Regulation D, excluding pooled investment funds, over the period of 2008–2021 because electronic Form D filing became mandatory starting only in March 2009. We drop i) offerings by firms located outside the United States, ii) offerings by financial and investment firms (i.e., firms in banking, financial services, and real estate),Footnote 10 iii) offerings by publicly traded and unlisted firms that report a 10-K or 8-K filing on or before the offering year, iv) all prior filings for a given offering,Footnote 11 v) all except the primary issuer when issuers jointly file a Form D, vi) offerings that do not include equity securities,Footnote 12 and vii) offerings of zero or unspecified offering amount.
Table 1 Private Offerings Conducted Under Rule 506 of Regulation D

Our final sample consists of a firm-funding round panel data set of 87,551 filings made by 54,419 unique firms over the period of 2008–2021. The number of firms that filed before (after) Title II is 18,684 (39,891).Footnote 13 Of the firms that filed after Title II, 3,114 (37,314) firms issued under GS (non-GS). We obtain an unbalanced panel where the individual dimension is a firm, and the time dimension is a funding round. For a given funding round, firms raise capital through either GS or non-GS. Thus, our unit of analysis is firm-funding round level.Footnote 14
Panel B of Table 1 reports the number of private offerings conducted under different parts of rule 506 of Regulation D by year over our entire 2008–2021 sample period. The last column in Panel B reports the percentage of GS offerings out of all offerings under Title II. GS offerings represent 5.9% of all offerings over the entire post-Title II sample period (2013–2021), fluctuating between 5.36% and 8.16% over the years. Panel C of Table 1 reports the number of GS and non-GS offerings under Title II by industry, as reported in Item 4 of Form D. Besides the group of Other Industries, firms in Other Technology and Other Health Care industries made the largest number of both types of offerings.
Panel D of Table 1 reports the distribution of the number of separate offerings by firms during our 2008–2021 sample period. Approximately 70% of the 54,419 sample firms make just one offering, 16% make two offerings, 7% make three offerings, and the remaining 7% make four or more offerings. Collectively, these firms make a total of 87,551 offerings reported in Panel B.
Finally, Panel E of Table 1 reports the distribution of offerings by the type of securities issued. These offerings satisfy all Panel A requirements except they include all types of securities. Offerings that include equity comprise approximately 76% (= 87,551/115,880) of all offerings, with debt offerings comprising most of the rest. Approximately 80% (= 70,366/87,551) of the offerings that include equity consist of pure equity offerings,
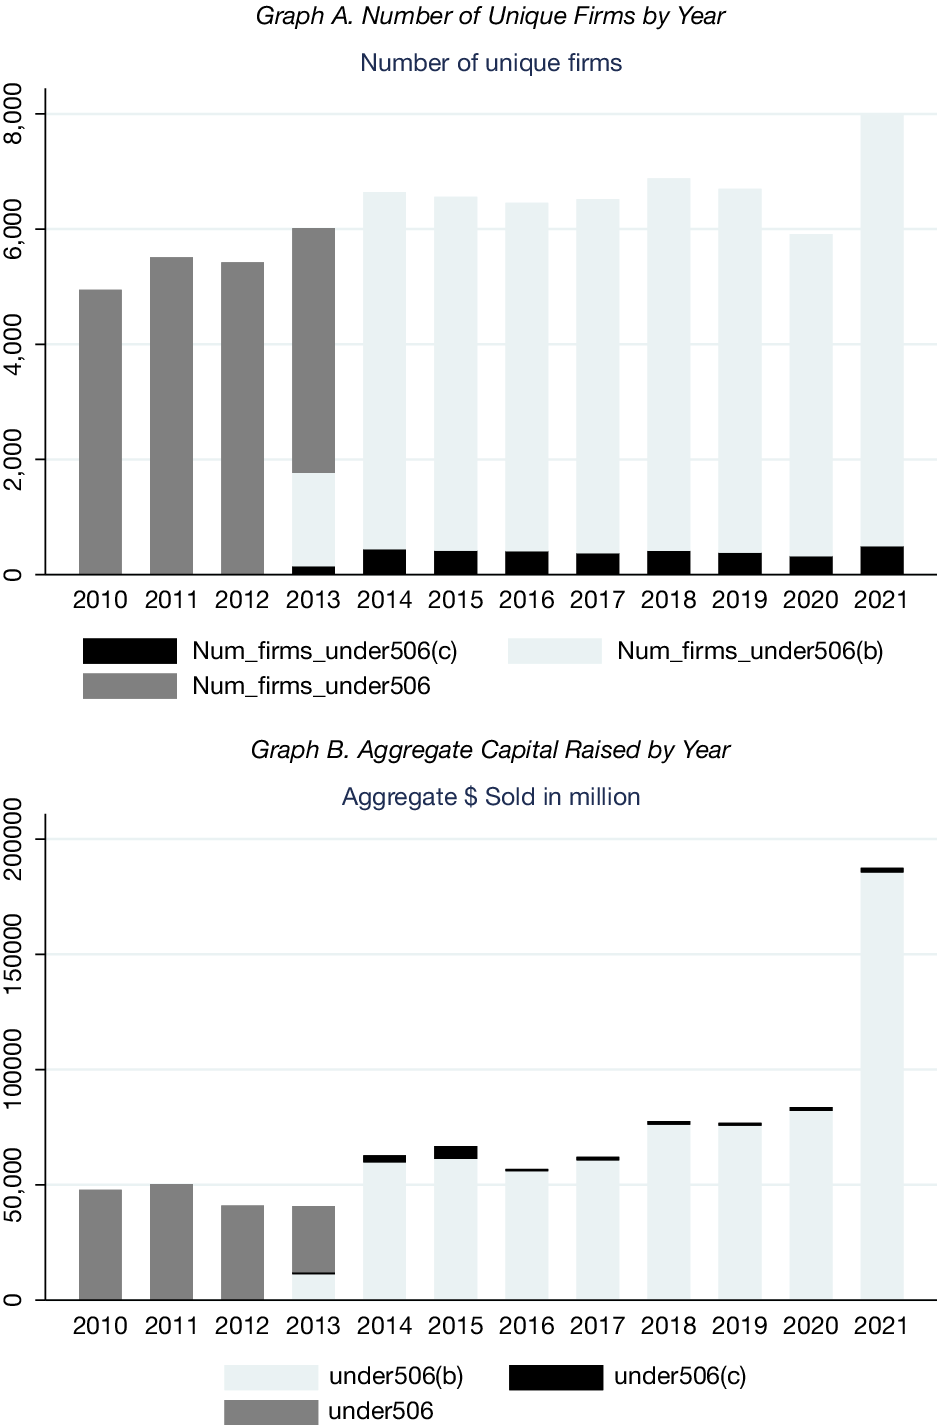
Figure 1 shows that the number of firms making private placements under rule 506 over our sample period has been fairly stable over time starting in 2013. Most small firms continue to issue under the original rule 506(b) that prohibits GS, even though they can use GS under the new rule 506(c). This may be due to non-GS issuers wanting to signal their lower risk than GS issuers. Graph B shows aggregate $Sold (i.e., total capital raised) annually from 2010 to 2021 under the two offering methods.Footnote 15 We find that a small portion of total capital raised via private placements was raised under 506c.

Figure 1 Number of Issuers Doing Private Offerings
Figure 1 shows the number of unique issuers in our sample that raise capital in private markets in a transaction exempt from registration under rule 506 pre-Title II and rule 506(c) or 506(b) post-Title II (effective on Sept. 23, 2013). For each year during 2010 to 2021, Panel A shows the number of unique issuers and Panel B shows the total capital raised by them in millions of dollars.
Figure 2 shows the geographic distribution of offerings sold under GS (Graph A) and non-GS (Graph B). There are large concentrations of both types of offerings in certain states, such as California, Texas, Florida, and New York, particularly in certain metro areas, such as Silicon Valley, New York City, Houston, Dallas, and Atlanta.

Figure 2 Geographic Distribution of General Solicitation (GS) and Non-GS Private Offering
Panel A (B) show the distribution of our sample of private placements of equity by GS (Non-GS) method during 2010 to 2021 on the US map.
C. Variable Construction
We use two dependent variables to measure the success of a private offering: i) offering Success Rate = $Sold/$Offered and ii) Ln(1 + $Sold) = ln (1 + total amount sold). Success rate is a novel measure of financing success. Unlike in many other types of financings, the success rate in a Form D private placement financing is a publicly observable variable that takes continuous values from 0 to 1.Footnote 16 Success rate and total capital raised (i.e., $Sold) are the final outcomes for each offering, based on the last amended filing for an offering. In addition, we examine the two main exit outcomes for investors in young firms: IPOs and being acquired in an M&A (Acquired). We identify the incidence of IPO or acquisition of the firms in our sample as of the end of 2024 after their private offering using the IPO and M&A databases of Audit Analytics, SDC, and Professor Jay Ritter’s IPO database. We use exact matching on issuers’ CIK codes or fuzzy matching on issuer name and require at least a 97% match rate, after first matching on state or zip code (if state or zip code information is available in a database). Finally, we also examine an intermediate outcome: VC funding. VCs are professional investors who make highly risky equity investments in startup firms (see, e.g., Gompers and Lerner (Reference Gompers and Lerner2006)). However, VCs provide financing to only the most promising startups (see, e.g., Chen et al. (Reference Chen, Hshieh and Zhang2021)). Therefore, the receipt of VC funding is a mark of distinction for a startup that increases its access to equity capital. We obtain VC financing data from VentureXpert as of the end of 2024. We match Form D issuers to companies in VentureXpert that received funding from a VC firm on company name, state, and year of deal.
We control for offering and firm characteristics motivated by the prior literature. Accordingly, our control variables include the following: #Investors, the number of existing investors; Ln($Offered), the natural logarithm of offering amount; Firm age; Long offering, an indicator for an offering intended to last more than 1 year; Business transaction, an indicator of an offering made as part of a merger, acquisition, or exchange offer; Entrant, an indicator for the first-time offering by a firm; and indicators for zero revenue, 0 < Revenue ≤ 1m ($millions), 1m < Revenue ≤ 5m, 5m < Revenue ≤ 25m, 25m < Revenue ≤ 100m, Revenue > 100m, and undisclosed revenue.Footnote 17 The regressions include fixed effects for industry and offering year.Footnote 18 In addition, prior studies find that successful fundraising in startups tends to concentrate in certain states such as California and New York (see, e.g., Nanda and Rhodes-Kropf (Reference Nanda and Rhodes-Kropf2013), Stangler, Tareque, and Morelix (Reference Stangler, Tareque and Morelix2016)). Thus, our regressions also include fixed effects for the state of firm location.
IV. Results
A. Determinants of General Solicitation
We start by considering the possibility that firms doing GS offerings differ from those doing non-GS offerings. For example, if GS allows issuance by firms that were previously too small to access these private markets, then we would expect their issue size to be smaller. A similar story might explain the relation between fees and outcomes. Smaller, less experienced, and less connected firms may pay higher fees, raise less capital, and be less successful because they are riskier firms that would otherwise have been unable to issue. To test this hypothesis, we use the offering amount to measure firm size and use an indicator for the firm’s earliest filing to measure firm experience in the capital market. We control for firm age to account for younger firms being less connected. Finally, Hypothesis 1 posits that less risky firms choose to issue under non-GS, whereas riskier firms issue under GS. The ability to sell their products in the market profitably is the biggest source of uncertainty for firms. Among young, startup firms, those with more revenue are considered less risky. Therefore, we use revenue as an inverse measure of firm risk and uncertainty.
1. Univariate Comparisons
Panel A of Table 2 presents univariate comparisons between the two types of offerings. GS offerings have a substantially lower mean success rate than non-GS offerings both post-JOBS Act and pre-JOBS Act (37% vs. 69% or 66%). The median capital raised (i.e., $Sold) under GS is also substantially lower than that under non-GS ($150,000 vs. $1,770,000 or $1,040,000). The mean percentage brokerage fee (i.e., actual or estimated broker sales commission and finders’ fees/$Offered) is somewhat higher in GS offerings than in non-GS offerings (5.34% vs. 5.02% or 5.09%).Footnote 19 The median net proceeds are substantially lower in GS offerings than in non-GS offerings ($126,000 vs. $1,751,000 or $1,025,000). Approximately 6% of firms that made a GS offering eventually did an IPO or were acquired, substantially less than 12% for non-GS issuers post-Act and 17% pre-Act. In terms of firm risk, GS offerings i) have a higher probability of lasting more than a year, ii) pay larger brokerage fees, and iii) their issuers are more likely to have zero revenue than non-GS issuers.Footnote 20 These results suggest that GS issuers are riskier firms, consistent with the idea that riskier startups have lower revenue, take longer time to raise capital, and have to pay higher brokerage fees to do so.
Table 2 Descriptive Statistics

Are worse outcomes for GS offerings due to new entrants with high risk? The answer is mixed. In Table 2, although the proportion of new entrants to the securities market (Entrant) in GS offerings (59%) is significantly larger than non-GS offerings post Act (47%), it is about the same as in non-GS offerings pre-Act (58%). GS offerings are smaller than non-GS offerings. The mean dollar amount of securities offered under GS is approximately $11.3 million, whereas it is $12.6 million in non-GS offerings post-JOBS Act.
Although 80% of GS offerings are done without a finder or broker, the proportion of offerings that hire a registered broker is higher for GS offerings than non-GS offerings (12% vs. 5%) in our sample.Footnote 21 GS offerings are also much more likely than non-GS offerings to hire unregistered brokers, also known as finders (8% vs. 1%), who have been linked to a variety of misconduct (Eaglesham and Jones (Reference Eaglesham and Jones2018a), (Reference Eaglesham and Jones2018b)). Overall, we find that GS offerings make greater use of intermediaries, either a registered broker or finder, than non-GS offerings post-Act (20% vs. 6%), consistent with the greater difficulty of raising capital for the former group of firms, which are less established. The Regd broker, if Use Broker or Finder variable indicates that among the offerings that hire a broker or finder, while only 60% of the GS offerings choose registered (rather than unregistered) brokers, as many as 78% of the non-GS offerings choose registered brokers after the Act. GS issuers also have fewer officers and directors (NOD), file their final Form D somewhat earlier after the first sale of securities (Days to filing), and solicit in more states than non-GS issuers. The median NOD, Days to filing, and #States_solicited in GS (non-GS) offerings are 2 (4), 11 (14), and 52 (1), respectively.
Finally, after Title II, approximately 5% (15%) of the GS (non-GS) issuers receive VC funding by the end of 2024 in an average of 0.14 (0.50) financing rounds. And approximately 10% (16%) of GS (non-GS) issuers eventually exit successfully via an IPO or acquisition by the end of 2024. These comparisons generally mirror those when we compare GS offerings with non-GS offerings before Title II.
2. Multivariate Regression Results
We next consider what firm or offering characteristics are associated with the choice of GS in a regression framework. Table 3 presents estimates of marginal effects from logit regressions of firms’ choice of the method of private offerings made after the adoption of Title II. The dependent variable equals 1 (0) for GS (non-GS) offerings. GS issuers appear to be riskier: They have lower revenue, are more likely to have long offerings (i.e., expected to last for >1 year), are younger, and are more likely to be new entrants to the market. GS offerings also have fewer current investors. Columns 1 and 2 report that GS offerings are substantially more likely to hire brokers, either registered or unregistered (i.e., finders). In terms of economic magnitude, brokered offerings are 10% more likely to be GS offerings (see column 1). Column 3 reports that among the subset of offerings that use a broker, GS offerings are more likely to use an unregistered broker (i.e., a finder) than a registered broker.
Table 3 Determinants of the Choice of General Solicitation Method

B. Cost of General Solicitation
Our results so far suggest that firms pursuing GS are riskier, which implies that brokers assisting such firms would have to work harder and therefore charge higher commissions. Higher brokerage costs for GS offerings may also be due to the requirement of verifying investor accreditation as well as advertising costs. Therefore, we next examine whether GS offerings incur higher brokerage fees.
We obtain data on the cost of GS from Item 15 of Form D filings, which separately reports the amounts of sales commission and finders’ fees. We compute the total dollar amount paid to brokers as sales commission$ plus finders’ fee$. Using the post-JOBS Act sample of GS or non-GS issuers, we estimate the following regression of brokerage commissions for the subset of offerings that use a broker:
 $$ {y}_{i,t}={\alpha}_0+{\alpha}_1{GS}_{i,t}+{\alpha}_2{Control}_{i,t}+{\alpha}_3{FEs}_{i,t,k}+{\varepsilon}_{i,t}. $$
The dependent variables are i) Ln($Fee) = Ln($Commissions + $Finders’ Fees) and ii) %Fee = ($Commissions + $Finders’ fees)/$Offered. GS equals 1 (0) if firm i issues using GS (non-GS). Control is a set of control variables for firm and offering characteristics that consist of Revenue FE, I_FirmAge>5, #Investors, Ln($Offered), Long offering, Business transaction, and Entrant. Appendix A defines the variables. The regressions also include state, industry, and year fixed effects. Standard errors are clustered at the firm level. Our main interest is in the coefficient $ {\alpha}_1 $
, which compares the cost of offering under GS versus non-GS.
$ {\alpha}_1 $
, which compares the cost of offering under GS versus non-GS.
Table 4 reports ordinary least squares (OLS) estimates of this model.Footnote 22 Within the subsample of offerings that use a broker, GS offerings have considerably larger brokerage costs and finders’ fees than non-GS offerings, in both dollar and percentage terms (see columns 1 and 2). In terms of economic magnitude, GS offerings incur a 0.76 percentage point (pp) larger brokerage fee than non-GS offerings. These findings suggest that GS via GS offerings incurs substantially higher brokerage costs than non-GS offerings, likely because of advertising costs and the need to verify that investors are accredited.
Table 4 Subsample Analysis of the Cost of General Solicitation: Brokerage Fees

To examine the marginal contribution of GS to the fees by whether the firm uses a broker or a finder, we create an interaction term between GS and Regd broker. On average, a registered broker charges a higher fee. In column 2, the coefficient of Regd broker is 0.69, indicating that brokerage fees for registered brokers are 0.69 pp higher than for finders. However, the coefficient of the interaction GS × Regd broker in column 2 implies that registered broker fees in GS offerings are 0.88 pp lower than fees for unregistered brokers (i.e., finders). Our finding that GS offerings with a registered broker pay lower fees than GS with a finder suggests that GS complements the use of a registered broker.
C. GS and Outcomes of Form D Financing
In this section, we examine the effects of GS on small business financing. Using a sample of offerings that use GS or non-GS, we estimate the regression in equation (1), where the dependent variables measure the success rate of solicitation (Success Rate) or the total amount sold (Ln(1 + Sold)) of offering $ i $
. The control variables are the same as in Table 4. The regressions include fixed effects for revenue, year, industry, and state of firm location.
$ i $
. The control variables are the same as in Table 4. The regressions include fixed effects for revenue, year, industry, and state of firm location.
Table 5 presents our baseline estimates from pooled OLS regressions of small business financing. We find that GS offerings, newly enabled by the law, have a 21% lower funding success rate than non-GS offerings. Moreover, GS offerings raise substantially less capital. The total amount sold is approximately 90% (= e−2.26 −1) lower in GS offerings than non-GS offerings. These findings are striking because GS was created to allow small businesses to raise more capital by allowing entrepreneurs to solicit from a wider pool of investors. Instead, we find that GS is associated with negative outcomes. More importantly, success rates for GS offerings with a registered broker are 9 (= 13 − 4) pp higher than for GS offerings with an unregistered broker (i.e., a finder), suggesting that the marginal contribution of GS relative to existing solutions to adverse selection (i.e., registered brokers) and search costs (i.e., finders) in private offerings is to help offerings with brokers more than those with finders. This result is consistent with our previous finding that GS complements the use of brokers. However, these initial results do not account for firms’ endogenous choice of offering method (GS vs. non-GS), based on differences in firm risk and other characteristics. That is a task we tackle in Section V.
Table 5 Effects of the Jumpstart Our Business Startups Act on Small Business Financing

We next examine how first-time issuers, who tend to be riskier due to their greater information asymmetry with potential investors, fare in raising capital under GS and non-GS. Therefore, we add an indicator for new entrants (Entrant) and an interaction term between Entrant and GS offerings. The coefficient of Entrant is negative and statistically significant in both columns 1 and 2. Compared with repeat issuers, new entrants experience a 3% lower success rate and raise −37% less (= e−0.46 −1) capital in non-GS offerings. The coefficient estimate of the interaction term shows that although the success rate of financing is higher for new entrants that choose GS in column 1, they raise less capital in column 2. The former result supports the notion that GS benefits new entrants raise capital. The latter result may reflect the fact that new entrants tend to be smaller firms, which may need less capital. Of course, if GS has enabled new firms that could not access the private placement market before Title II to tap this market and raise any amount of capital, that can be viewed as success for Title II. We deal with the question of an issuer’s selection of a GS offering and the appropriate counterfactual in Section V. The average effect of GS continues to be negative on the outcomes of fundraising for small businesses.Footnote 23 We cannot control for firm fixed effects in this analysis because the Entrant variable is unique for a given firm.Footnote 24
So far, we find that riskier firms indeed choose to offer under more lenient rules, and the cost of this choice is higher fees paid to information brokers. We next examine whether GS increases issuers’ net proceeds after paying the solicitation fees to brokers and the proceeds due to insiders. We start by estimating regressions of Ln(1 + Net proceeds), defined as Ln(1 + Total amount sold − Sales commissions − Finders’ fees − Proceeds paid to insiders). In column 1 of Table 6, the net proceeds are 94% (= e−2.87 −1) lower in GS offerings than in non-GS offerings. However, net proceeds are higher in GS offerings that use a broker or a finder than in direct offerings, which suggests that GS complements the use of brokers or finders.
Table 6 Success and Cost of General Solicitation

We next test Hypothesis 5 about the success of GS offerings that pay higher brokerage commissions compared with non-GS offerings. Columns 2–5 of Table 6 report regressions of our two measures of offering success for the subsample of offerings that hire a broker. In columns 2 and 3, the main explanatory variables are GS, %Fee, and their interaction. Consistent with our baseline results in Table 5, the coefficient of GS is significantly negative in both these columns, which implies that GS offerings are less successful than non-GS offerings.
The coefficient of %Fee is negative, indicating that higher %Fee is associated with lower financing success for non-GS offerings. However, there is essentially no such relation for GS offerings in column 2, since the coefficient of GS×%Fee is significantly positive, and the coefficients of %Fee and GS×%Fee roughly offset each other.
Yimfor (Reference Yimfor2025) finds that private offerings that use registered brokers have better outcomes than offerings that employ unregistered brokers (i.e., finders). Therefore, we next examine how this result interacts with the method of offering (i.e., GS vs. non-GS). We include indicators for a finder (= Unregd broker) as well as registered broker. In column 4, the coefficient of GS × Regd broker × %Fee is significantly positive, which implies that when more money is spent on broker commissions rather than finder fees, the effect of GS on success rate is higher. This result is consistent with the finding that GS and a registered broker are complements. Our finding in column 2 that broker commissions and finder fees are better spent if an offer is generally solicited is consistent with a potential benefit of GS, recognizing that the benefit largely offsets the negative association with fees spent generally.
D. GS and Subsequent VC Funding and Firm Exit Outcomes
So far, we have examined the efficacy of GS using outcomes of the Form D financing itself. We next examine two types of outcomes at the firm-level: VC funding and successful exits via IPO or acquisition. We consider VC funding as an intermediate outcome, because VC financing typically goes only to the most successful and innovative startups (see, e.g., Chen et al. (Reference Chen, Hshieh and Zhang2021)). We use two measures of VC funding: VC funding equals 1 for a Form D issuer that receives VC financing by the end of 2024 and equals 0 otherwise; and # VC funding rounds, which is the largest number of VC funding rounds a firm secures by the end of 2024.
The first 2 columns in Table 7 report the marginal effects of logit regressions where we replace the dependent variable in Table 5 with an indicator for VC funding. The main explanatory variables in column 1 are GS, Regd Broker, and Unregd Broker; in column 2, we add interactions of GS with the latter two variables. The other control variables are the same as in Table 5. The regressions include year, industry, and state fixed effects. In both models, GS offerings negatively predict the probability of VC funding. The marginal effects indicate that GS offerings are approximately 6 pp less likely to receive VC financing. This effect is quite large compared with a sample firm’s average probability of getting VC funding of 15% reported in the last row of the table.Footnote 25 In column 1, offerings that employ registered (unregistered) brokers are also 4 (7) pp less likely to receive VC funding.
Table 7 Venture Capital (VC) Funding and Exit via IPO or Acquisition

Columns 3 and 4 report marginal effects from Poisson regression models that investigate the determinants of the number of VC funding rounds a firm secures. GS offerings receive significantly fewer VC funding rounds. The magnitude of this effect is economically large. After controlling for other things, GS offerings have approximately 0.23 fewer VC funding rounds, or approximately 45% fewer rounds compared with the sample average of 0.51 rounds reported in the last row of the table.
Finally, we examine successful firm exits via IPO or acquisition. IPO or Acquired equals 1 if an issuer goes public or is acquired by the end of 2024 and equals 0 otherwise. In columns 5 and 6 of Table 7, we find that GS offerings are less likely to exit via an IPO or acquisition compared with non-GS offerings. The magnitude of this effect is approximately 2 pp on the probability of an exit or approximately 13% unconditional probability of an exit by a sample firm of 16%. Using an unregistered broker decreases the probability of a successful exit by approximately 3–4 pp.
In Panel B of Table 7, we examine whether the success of Form D financing is related to receipt of VC funding or successful exit via IPO or acquisition. In regressions similar to Panel A, we now replace the explanatory variables Regd broker, Unregd broker, and their interactions with GS by our two measures of the success of the Form D financing, Success rate and Ln(+$Sold), and their interactions with GS. The probability of VC funding and the number of rounds of VC financing are significantly lower in GS offerings, as in Panel A. The success of Form D financing improves future VC financing outcomes as well as the likelihood of successful exit, although there is no differential improvement for GS offerings.
V. Identification: Accounting for Selection Effects
We find that firms that choose GS offerings differ from those that choose non-GS offerings in that, for example, the former have lower revenues. This causes problems in empirically testing whether the Act helps small firms raise capital under GS because it becomes difficult to compare them with a counterfactual. This is especially problematic if there are unobservable characteristics of the firm, issue, or project that are related both to the likelihood of using GS and the likelihood of financing success. We mitigate these concerns in several different ways. First, in our baseline tests, we control for a number of measures of firm risk, such as firm age, revenue, the number of investors, and long offering. Moreover, both in our baseline tests and in the approaches described in the following text, we include fixed effects for year, industry, and state. Second, we employ a PSM approach to compare issuers that switch from using non-GS for a prior offering to using GS for the current offering (i.e., Switchers) with Stayers, who use non-GS for both offerings. Third, we separately analyze a subsample of firms that raise capital under both GS and non-GS in the same year. This approach compares the outcomes of GS and non-GS offerings by the same firm at about the same time. Finally, we conduct a variety of robustness checks of our main results.
A. Switchers Versus Stayers
We next use a PSM approach to compare outcomes for non-GS issuers who switch to GS (“Switchers”) to a control group of similar non-GS issuers who decide to stay with non-GS (“Stayers”) after Title II of the JOBS Act gives them a choice. There are two main issues to consider. First, before Title II, firms have only one method of fundraising, non-GS. After Title II, firms have two choices: GS or non-GS. Second, it is impossible to know which firms would have issued under GS before Title II. We address the first issue by focusing on issuers that make multiple offerings during the post-Title II period, when they can choose between GS and non-GS offering methods. Here, we compare firms that complete a non-GS offering, then switch to GS for the subsequent offering (i.e., Switchers) to matched firms that complete a non-GS offering and stay with non-GS for the subsequent offering (i.e., Stayers), and report the results in Panel A of Table 8. The switch to GS is an entirely new offering by the same issuer because we keep only the latest filing for a given offering, as discussed in Section III.B and reported in Panel A of Table 1. To address the second issue, we examine the subset of firms that complete an offering before the Act and make another offering after the Act. Here, we redefine Switchers as firms that make an offering under non-GS pre-Title II and switch to GS for a different offering post-Title II, and Stayers as their matched firms that make an offering under non-GS pre-Title II and continue to use non-GS for a different offering post-Title II, and present the results in Panel B of the table.
Table 8 Propensity Score Matching (PSM) Analysis

Table 2 reports that firm and offering characteristics differ between offerings under GS and non-GS. To control for these differences, we match each treated offering (i.e., a Switcher) to a control offering (i.e., a Stayer) from the same industry in the same offering year using the PSM method. We match each Switcher firm to its nearest neighbor in the sample of Stayers that has the closest propensity score obtained from logit regressions with replacement.Footnote 26 Matching is based on the following variables: Revenue fixed effects, I_FirmAge>5, the number of current investors, offering amount, and indicators for offerings that last more than a year, offerings made as part of a business transaction, Entrant, successful completion of past offering, use of different type of broker (registered, unregistered, both, or neither) as in the past offering, and fixed effects for year and state of firm location. The standard errors are robust. We use two different matched samples in the 2 panels in Table 8. Panel A presents a post-JOBS Act analysis, whereas Panel B presents a pre- and post-Act analysis.
The first part of Panel A of Table 8 reports descriptive statistics of the matched sample of switchers (i.e., treated offering) and stayers (i.e., control offering) post-Act. We report the mean values for the later offering by each group of issuers (i.e., GS offering by Switchers and non-GS offering by Stayers) and the significance levels based on t-statistics of the differences. The treated and control samples are quite similar after matching, with no significant differences between the two groups, except for the indicator for older firms (age > 5 years). In addition, we control for all these firm and offering characteristics in the regressions. In regressions similar to those in Table 5 in the next part of Panel A, switchers to GS offerings have a 22% lower financing success rate and raise a whopping 93% less (= e−2.71 − 1) capital than similar non-GS stayers after Title II took effect.
Next, in Panel B of Table 8, we compare each switcher (i.e., an issuer who made a non-GS offering before Title II and made a GS offering after Title II) with a matched stayer (i.e., an issuer who made a non-GS offering before Title II and made a non-GS offering after Title II). The first part of Panel B reports descriptive statistics of this matched sample of the later offering by each group of issuers (i.e., GS offering by Switchers and non-GS offering by Stayers). The treatment and control groups are quite similar after matching, with no significant differences between them. The estimate of Switcher to GS in the regression in the second half of Panel B reports that switchers to GS offerings post-Act have a 13% lower financing success rate and raise 80% less (= e−1.59 − 1) capital than its matched non-GS stayers. We conclude that firms that choose to issue under GS are worse off than non-GS issuers.
B. Subsample Analysis
We next try to mitigate the identification problem further by analyzing an interesting, though more limited, subsample. Specifically, we limit the sample to firms that raise capital using both methods in the same year. This approach largely overcomes selection concerns from different types of firms choosing different methods of raising capital, GS or non-GS. This approach has the advantage that the issuer’s financial profile that may affect fund raising outcomes is unlikely to change significantly within the same year.
However, even though the two types of offerings are made by the same firm in the same year, maybe they are aimed at financing different projects in the firm, which can still lead to different outcomes for the fundraising effort. To address this issue, we use three specifications. The first specification, reported in the first 2 columns in Panel A of Table 9, uses the full sample of such offerings. The second specification, reported in the next 2 columns, uses a subsample of firms that switch from GS to non-GS in a given year. The third specification, reported in the last 2 columns in the panel, uses a subsample of firms that switch from non-GS to GS. Because project information is not publicly available, we include controls for offering information reported in Form D. All the specifications include fixed effects for industry, state of firm location, and year. Panel B performs a similar analysis, except that we now replace industry and state fixed effects by firm fixed effects to remove any time-invariant firm characteristics that might affect both the choice of offering method and financing success rate.
Table 9 Identification: Subsample Analysis

In our sample, 162 firms make one or more GS offerings and one or more non-GS offerings in the same year, for a total of 192 and 208 offerings of the two types, respectively. We conduct OLS regressions similar to those in Table 5 on this subsample of 400 offerings. Panel A of Table 9 reports the results. We find that GS offerings still lead to a considerably lower success rate for a firm than non-GS offerings, even after controlling for selection effects and firm characteristics. In column 1, GS offerings have a 12% lower success rate than non-GS offerings. GS offerings also raise substantially less capital than non-GS offerings. In column 2, the magnitude of this effect is as much as −83% (= e−1.78 −1).
Is a GS offering more likely to succeed if it is the first offering, instead of the second offering, during the year in such cases? That does not appear to be the case. In Panel A of Table 9, we report the results of regressions for partitions of this subsample by whether the first offering during the year is made under GS or non-GS. The success rate of the offering as well as the amount sold are consistently lower in GS offerings than in non-GS offerings in the subgroup of issuers switching from non-GS to GS in columns 5 and 6. This result suggests that when an issuer switches from non-GS to GS in the same year, the GS offering has a lower success rate and raises less capital. The significantly negative coefficient of Unregd broker in columns 5 and 6 suggests that non-GS offerings that use a finder are met with a lower success rate and raise less capital, which may have led to their decision to switch to GS. To examine within-firm differences in success rates, we replace industry and state fixed effects in the analysis of Panel A by firm fixed effects and show the results in Panel B. We find a robust result that shows that the GS method lowers success rate and raises less capital.
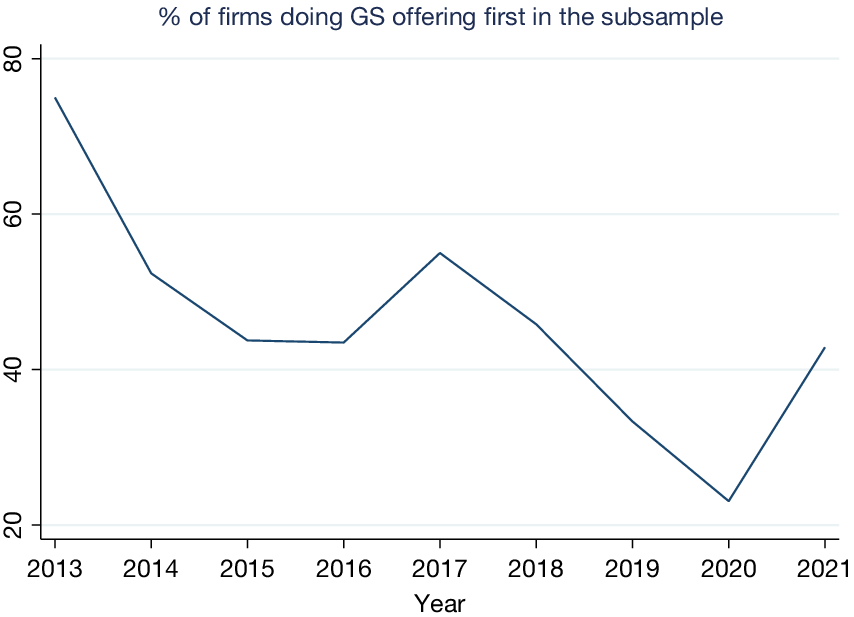
Do firms make a GS offering first, and if it fails to raise enough money, follow it up with a non-GS offering? In Figure 3, the proportion of firms doing a GS offering first in this subsample (of Table 9) starts out at its peak in 2013 and declines substantially after that. Firms appear to start out with a preference for using the new GS offering method first once it became available but gradually lose interest once they realize that it does not seem to help in raising capital successfully. This pattern is consistent with firms learning from financial markets, as has been found in other contexts in finance (e.g., shareholder rights and stock returns (Bebchuk, Cohen, and Wang (Reference Bebchuk, Cohen and Wang2013)), and the use of common M&A advisers by acquiring and target firms (Agrawal, Cooper, Lian, and Wang (Reference Agrawal, Cooper, Lian and Wang2013)).

Figure 3 Learning
Figure 3 shows the percentage of general solicitation (GS) offerings going first by year in the subsample of firms that make both GS and non-GS offerings in the same year.
C. Robustness Checks
1. Subsample of Positive Amount Sold
Do our main results lose statistical or economic significance if we omit the worst offerings, that is, those that raise no capital? To address this issue, we redo the Table 5 regressions in the subsample of offerings with positive dollar amounts raised. In Panel A of Table 10, we find that even in this sample, GS offerings are significantly less successful in fundraising than corresponding non-GS offerings.
Table 10 Robustness Checks

2. Firm Fixed Effect Regression
Panel B of Table 10 reports that our main results continue to hold when we replace industry and state fixed effects in the regressions of Table 5 by firm fixed effects.
3. Composition of Brokers and Finders
Does the relative number and composition of brokers and finders affect the success of financing? To test this, we replace the indicators for brokers and finders with the percentage of brokers. The percentage of brokers is defined as the number of brokers relative to the total number of brokers and finders in an offering. The results, reported in Panel C of Table 10, are qualitatively and quantitatively similar to those in Table 5.
4. Regressions Controlling for NOD and Days to Filing for Offerings of All Types of Securities
We next examine three potential issues. First, our main firm size measure, Revenue, is not disclosed in approximately 49% of GS and 81% of non-GS offerings. Therefore, we use the number of executive officers (including promoters) and directors (NOD) listed in Item 3 of Form D as another measure of firm size and add it as an explanatory variable in the regressions. Larger firms usually have more officers and directors. Second, the lower success rate of GS offerings may be partly due to GS issuers filing the Form D earlier than non-GS issuers, which would lead to the amount sold reported in Form D being lower than the amount raised when the offering is completed. Given that there is no requirement to file a Form D after the offering is completed, the last filing may not capture the amount finally raised. To address this issue, we add a control variable, Days to filing, defined as the number of days between the date of the first sale of the securities being offered to the filing date of the last Form D filing for the offering. Finally, all of our results so far are for equity offerings or offerings that include equity securities. We now examine whether our main results hold regardless of the type of security issued by including all offerings that satisfy all the other data requirements of Panel A of Table 1.
Panel D of Table 10 reports regressions controlling for the number of officers and directors (NOD) and Days to Filing. Because the sample includes offerings of all types of securities, we also include a binary variable, Debt_offering, that equals 1 if the offering includes any debt securities, and 0 otherwise.Footnote 27 Column 1 reports marginal effects from a logit regression of the choice of GS (vs. non-GS) offering similar to column 2 of Table 3. Smaller firms (i.e., firms with fewer officers and directors) and firms making debt offerings are more likely to choose a GS offering. Compared with non-GS offerings, GS offerings also file their last Form D sooner after their first sale of securities.
Columns 2–6 report regressions of our main outcome variables: success rate and amount sold similar to columns 1 and 2 of Table 5, and VC funding, the number of VC funding rounds and IPO or Acquired similar to columns 2, 4, and 6 of Table 7. As expected, later filings have a higher success rate and raise more capital; however, they neither get more VC funding nor are they more likely to exit via IPO or acquisition. The number of officers and directors positively predicts all five outcome variables, suggesting that larger firms among Form D filers have better outcomes in Form D fundraising, VC funding, and ultimate exit via IPO or acquisition, perhaps because they are less risky. Although debt offerings have less success in the Form D fundraising market, they subsequently receive more rounds of VC funding. But more importantly, consistent with our baseline results in Tables 5 and 7, all five outcome variables are worse for GS than for non-GS offerings.
5. Regressions Controlling for #States_solicited and Foreign_solicited
One advantage of GS is that it enables issuers to reach a wider pool of investors. Therefore, we next examine the possibility that GS offerings solicit investors in more states as well as other countries. We obtain data on the number of states solicited (#States_solicited) and whether foreign countries are solicited in the offering (Foreign_solicited) from Item 12, which provides information on compensation to brokers and finders. Unfortunately, this information is only available for a small subset of the offerings, mostly those that employ brokers or finders. Therefore, we analyze this sample separately and present the results in Panel E in a format similar to Panel D, except with the addition of #States_solicited and Foreign_solicited as explanatory variables. We find that GS offerings indeed solicit investors in more states as well as other countries. However, controlling for these variables does not affect our main conclusions: GS offerings continue to have lower success in Form D financing, getting VC funding, and eventual exit via IPO or acquisition.
6. Separate Regressions for Debt and Equity Offerings
Our baseline results in Tables 5 and 7 are for offerings that include equity (i.e., equity only or equity and other securities). Although we analyze offerings of all types of securities in Sections V.C.4 and V.C.5 previously and in Panels D and E of Table 10, we now separately examine equity and debt offerings in more detail. Accordingly, we analyze offerings of equity only in Panel F, debt only in Panel G, and debt only or debt and other securities except equity in Panel H in a format similar to Panel D, except that we now exclude the Debt_offering indicator variable.
In Panels F and G of Table 10, GS offerings have a lower success rate and raise less capital in Form D financing for both equity only and debt only offerings, although the success rate is considerably lower in pure equity offerings than in pure debt offerings, perhaps due to greater potential for adverse selection in GS equity offerings. The untabulated t-statistic for the difference in the coefficient of GS in column 1 between Panels F and G is 4.16. GS offerings are less likely to get VC funding subsequently for both pure equity and pure debt offerings, with similar magnitudes. Notably, although pure equity GS offerings receive significantly less rounds of VC funding and are less likely to successfully exit via IPO or acquisition than pure equity non-GS offerings, neither effect is statistically significant for pure debt offerings, further pointing to greater adverse selection with GS in equity over debt offerings. Finally, the results in Panel H on offerings of debt only or debt and other securities largely mirror those in Panel G for debt only offerings.
7. What If Some Issuers Do Not File Form D?
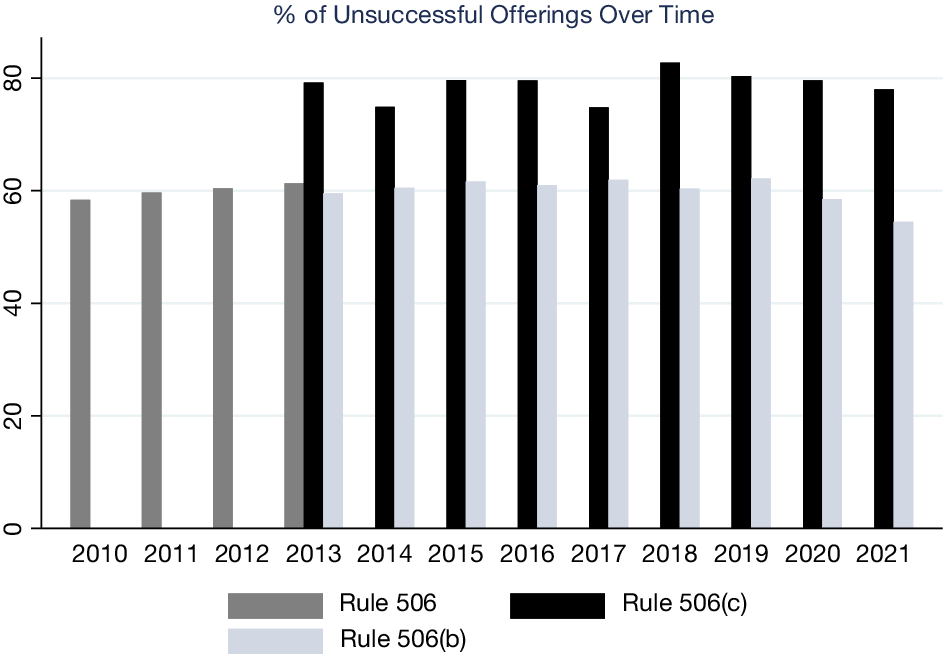
Due to the lack of strict SEC enforcement, some startups, especially in Silicon Valley, appear to violate the requirement to file a Form D.Footnote 28 Although there is no way to reliably assess the magnitude of this noncompliance,Footnote 29 we next examine whether this possibility creates a bias in our approach. First, we include fixed effects for the state of firm location in all the regressions, which should reduce the bias arising from certain geographic areas. Second, we include industry fixed effects to deal with a bias arising from some industries. Third, we examine the distribution of Form Ds that are unsuccessful in fundraising. If this distribution is somewhat stable over time, that would suggest that selection into filing a Form D is less of an issue, given press reports that suggest that noncompliance is a recent phenomenon. Figure 4 shows the annual percentage of unsuccessful non-GS offerings pre-Title II and GS and non-GS offerings during the post-Title II period. The percentage of unsuccessful offerings under each category is the number of Form Ds that are unsuccessful in fundraising divided by the total number of Form Ds filed in the category in a given year. We define an offering as unsuccessful if its most recent Form D or Form D/A indicates that the amount sold is less than the offering amount. In Figure 4, the annual proportion of unsuccessful offerings is fairly stable during the 2010–2021 period.

Figure 4 Time Series of Private Offerings
Figure 4 shows the annual percentage of unsuccessful private offerings attempted under rule 506 before Title II since 2010 and rules 506(c) and 506(b) after Title II (effective on Sept. 23, 2013). The percentage of unsuccessful offerings under each category is calculated as the number of Form Ds that are unsuccessful in fundraising divided by the total number of Form Ds in a given year. An offering is defined as unsuccessful if its most recent Form D or Form D/A indicates that the amount sold is less than the offering amount.
VI. Conclusion
On Sept. 23, 2013, Title II of the JOBS Act became effective. Previously, small firms could avoid registering private placement securities with the SEC but were not allowed to advertise, which limited their potential investor pool. On the other hand, they could sell to a small number of unaccredited investors. Moreover, the burden of proving accreditation status was on the investor, rather than the issuer. And the burden was rather light: Investors could satisfy it by simply checking a box indicating that they are accredited on a pre-qualification form provided by the issuer. After the passage of Title II, firms can issue securities with or without GS, which includes advertising.
This article investigates the impact of Title II of the JOBS Act on firm financing. We find that issuers that choose the newly introduced GS method for private placement under Title II are riskier: They have less revenue, fewer investors, and make more long-duration (>1 year) offerings. After accounting for this selection effect using several different approaches, we find that GS offerings have a lower funding success rate and raise less capital than non-GS offerings. GS offerings incur higher percentage brokerage commissions than non-GS offerings, likely due to the cost of advertising and verifying investor accreditation. Moreover, by the end of 2024, GS issuers are also less likely to receive VC funding or to successfully exit via IPO or acquisition. However, GS appears to help new entrants to the market for private equity offerings and issuers that use registered brokers. The success of Form D financing improves future VC financing and exit outcomes, although there is no differential improvement for GS offerings.
Our findings thus provide mixed support to the notion that Title II provides greater access to capital markets for small firms that lack prior connections to investors. This article also points to possible reasons why small businesses still prefer to raise capital through the traditional non-GS offering, and why investment platforms that facilitate matching entrepreneurs to investors appear to dread GS (see, e.g., Clark (Reference Clark2020)). This is because Title II places severe restrictions on who can purchase the securities offered under GS, and brokers charge substantial fees for advertising private placement securities and verifying using an elaborate process that each investor is accredited (i.e., qualified to invest). Our results imply the need to craft policies that induce better ways of signaling offering quality or more transparent approaches to reducing information asymmetry to improve access to capital for small businesses.
Finally, our article highlights the marginal impact of GS on small firm financing, after controlling for the use of intermediaries to help reduce adverse selection and search costs (see, e.g., Yimfor (Reference Yimfor2025)). By reducing search costs through advertising, GS appears to complement registered brokers who help reduce adverse selection in the market for private placements.
Funding Statement
Agrawal acknowledges financial support from the William A. Powell, Jr. Chair in Finance and Banking.
Appendix A. Variable Definitions
- Revenue
-
This indicates Revenue Range disclosed. Item 5 of Form D.
- Revenue=0
-
0 if revenue range is “No Revenues”.
- 0 < Revenue ≤ 1m
-
1 if revenue range is “$1–$1,000,000”.
- 1m < Revenue ≤ 5m
-
2 if revenue range is “$1,000,001–$5,000,000”.
- 5m < Revenue ≤ 25m
-
3 if revenue range is “$5,000,001–$25,000,000”.
- 5m < Revenue ≤ 100m
-
4 if revenue range is “$25,000,001–$100,000,000”.
- Revenue>100m
-
5 if revenue range is “Over $100,000,000”.
- NotDisloseRevenue
-
1 if revenue range is “Decline to Disclose” or “Not Applicable,” and 0 otherwise.
- $Offered
-
The dollar amount of securities being offered. Item 13 of Form D.
- #Investors
-
The total number of investors who have already invested in the offering. Item 14 of Form D.
- Long offering
-
1 if the issuer intends the offering to last more than 1 year, and 0 otherwise. Item 8 of Form D.
- GS
-
1 if an offering uses GS, and 0 otherwise.
- Post
-
1 post-Title II, 0 pre-Title II of the JOBS Act.
- Business transaction
-
1if the offering is in made in connection with a business combination transaction, and 0 otherwise. Item 10 of Form D.
- Entrant
-
1 for the earliest Form D filing by a given firm in the database, and 0 otherwise.
- Success Rate
-
(Total amount sold/Total offering amount).
- $Sold
-
The dollar amount of securities sold. Item 13 of Form D.
- $Commissions
-
The dollar amount of Sales Commission expenses, including estimates. Item 15 of Form D.
- $Finders’ fees
-
The dollar amount of Finders’ Fee expenses, including estimates. Item 15 of Form D.
- $Fee
-
$Commissions + $Finders’ fees. Item 15 of Form D; in the subsample of offerings that use a broker.
- Use Broker or Finder
-
1 if issuer has positive fee, and 0 otherwise.
- %Fee
-
$Fee/$Offered; in the subsample of offerings that use a broker.
- $Proceeds paid
-
Proceeds paid to executive officers, directors, or promoters in dollars. Item 16 of Form D.
- I_FirmAge > 5
-
1 if issuer age is over 5 years, and 0 otherwise.
- $Net proceeds
-
$Sold − $Fee.
- VC funding
-
1 for an issuer that receives VC financing by the end of 2024, and 0 otherwise.
- # VC funding rounds
-
the largest number of VC funding rounds a firm secures by the end of 2024.
- IPO or Acquired
-
1 if a Form D issuer goes public or is acquired by the end of 2024, and 0 otherwise. We use exact matching on issuers’ CIK codes or fuzzy matching on issuer name and require at least a 97% match rate, after first matching on state or zip code (if state or zip code information is available in a database).
- Regd broker
-
1 if the filing has a broker with a CRD number (i.e., a registered broker), and 0 otherwise.
- Unregd broker
-
1 if the filing has an unregistered broker (i.e., finder), and 0 otherwise.
- #Regd Brokers
-
The number of brokers with a CRD (Central Registration Depository) number, a unique identifier assigned by FINRA to individuals and firms in the financial industry.
- #UnRegd Brokers
-
The number of brokers without CRD numbers.
- %Regd brokers
-
#Regd brokers/(#Regd Brokers + #Unregd Brokers).
- NOD
-
The number of executive officers (including promoters) and directors. Item 3 of Form D.
- #States_solicited
-
The number of states solicited in the offering. Item 12 of Form D.
- Foreign_solicited
-
1 if foreign countries are solicited in the offering, and 0 otherwise. Item 12 of Form D.
- Days to Filing
-
ln (Number of days from the date of first sale to the filing date).
- Debt_offering
-
1 if Form D includes any debt offerings, and 0 otherwise.
- State Fixed Effects
-
Dummy variable for issuer state, as disclosed in Item 2 of Form D.
- Industry Fixed Effects
-
Dummy variable for industry, as disclosed in Item 4 of Form D.
Appendix B. Top 10 Brokers
The table that follows lists top 10 sales compensation recipient company names in GS and non-GS offerings in our sample by $Sold.

Appendix C. Examples of Advertising in General Solicitation Offerings
Here are a few examples of advertising in GS offerings, identified via Internet searches.
1. A press release by the issuer, reported by PRnewswireFootnote 30: “Entoro Capital, LLC (Entoro) announces the first non-fungible tokens (NFT) issued as a security under the Reg. D 506(c) offering exemption. The offer to Accredited Investors will conclude on Friday, October 8, 2021, in Austin Texas at the Texas Blockchain Summit VIP dinner. NFTs will be sold online through Entoro’s proprietary securities offering platform, OfferBoard.”
2. News coverage of the offering by an online industry newsletter for the legal profession.Footnote 31 It reports that “on September 21, 2022, Reynen Court, the so-called app store for legal technology, launched a general solicitation stock offering in order to bring on individual lawyers and “legal technology enthusiasts” as investors in the company. The offering, which is described at invest.reynencourt.com, is being made under Rule 506(c) of the federal securities laws, …. Reynen Court said this online offering “is groundbreaking in its use of social media and other forms of general solicitation to attract individual shareholders to a mission to help define, adopt, and support technology standards designed to drive down costs for both the buyers and sellers of technology.”
Appendix D. Additional Figures
The first four figures below show the proportion of the total number of offerings of different type in each financing round. The first two figures are for offerings that use a broker, finder, both, or neither (i.e., direct offering); the third figure is for GS offerings; and the fourth figure is for offerings that use a broker among GS or non-GS offerings. The last figure shows the proportion of offerings that use a broker in the subsample of intermediated offerings (i.e., that use a broker or finder) in GS or non-GS offerings in each financing round.


 Open access