


Introduction
In the late 19th century, Horace Franklin Atwood of Rochester, New York, United States of America, encountered an unusual insect in his yard. In a letter sent to entomologist M.V. Slingerland of Cornell University (Ithaca, New York) in 1899, Atwood reported the sudden appearance of multiple large praying mantises (Mantodea) in his garden and the nearby towns of Charlotte and Summerville, north of Rochester. Initially, Slingerland suspected that the finding represented a northwards range expansion of Stagmomantis carolina (Linnaeus, 1763) and reported it as such without examining any specimens (Slingerland Reference Slingerland1899). Shortly afterwards, however, Atwood submitted both egg cases and adult specimens, enabling Slingerland to rear and examine multiple individuals. It was on this basis that the insect was correctly identified as the European praying mantis, Mantis religiosa (Linnaeus, 1758). This marked the first confirmed observation of the species on the American continent (Slingerland Reference Slingerland1900).
Mantis religiosa is a generalist predatory insect and one of the most emblematic and widespread members of the order Mantodea. It is native to Europe, parts of northern and central Asia, and North Africa and is broadly distributed across northern temperate regions (Liana Reference Liana2007; Battiston and Fontana Reference Battiston and Fontana2010, Fig. 1A, B). It produces egg cases, or oothecae (Fig. 1C), capable of surviving winter temperatures as low as –20 °C without significant injury (Salt and James Reference Salt and James1947), demonstrating the species’ ability to overwinter in cold climates, a rare adaptation among praying mantises. The species typically inhabits dry, open habitats such as sunny grasslands, field margins, and agricultural and urban landscapes (Linn and Griebeler Reference Linn and Griebeler2016). This tolerance for seasonal conditions, combined with its ecological flexibility and affinity for human-altered environments, has facilitated the establishment of M. religiosa in North America, where it has experienced a rapid and extensive expansion (Fig. 1D).
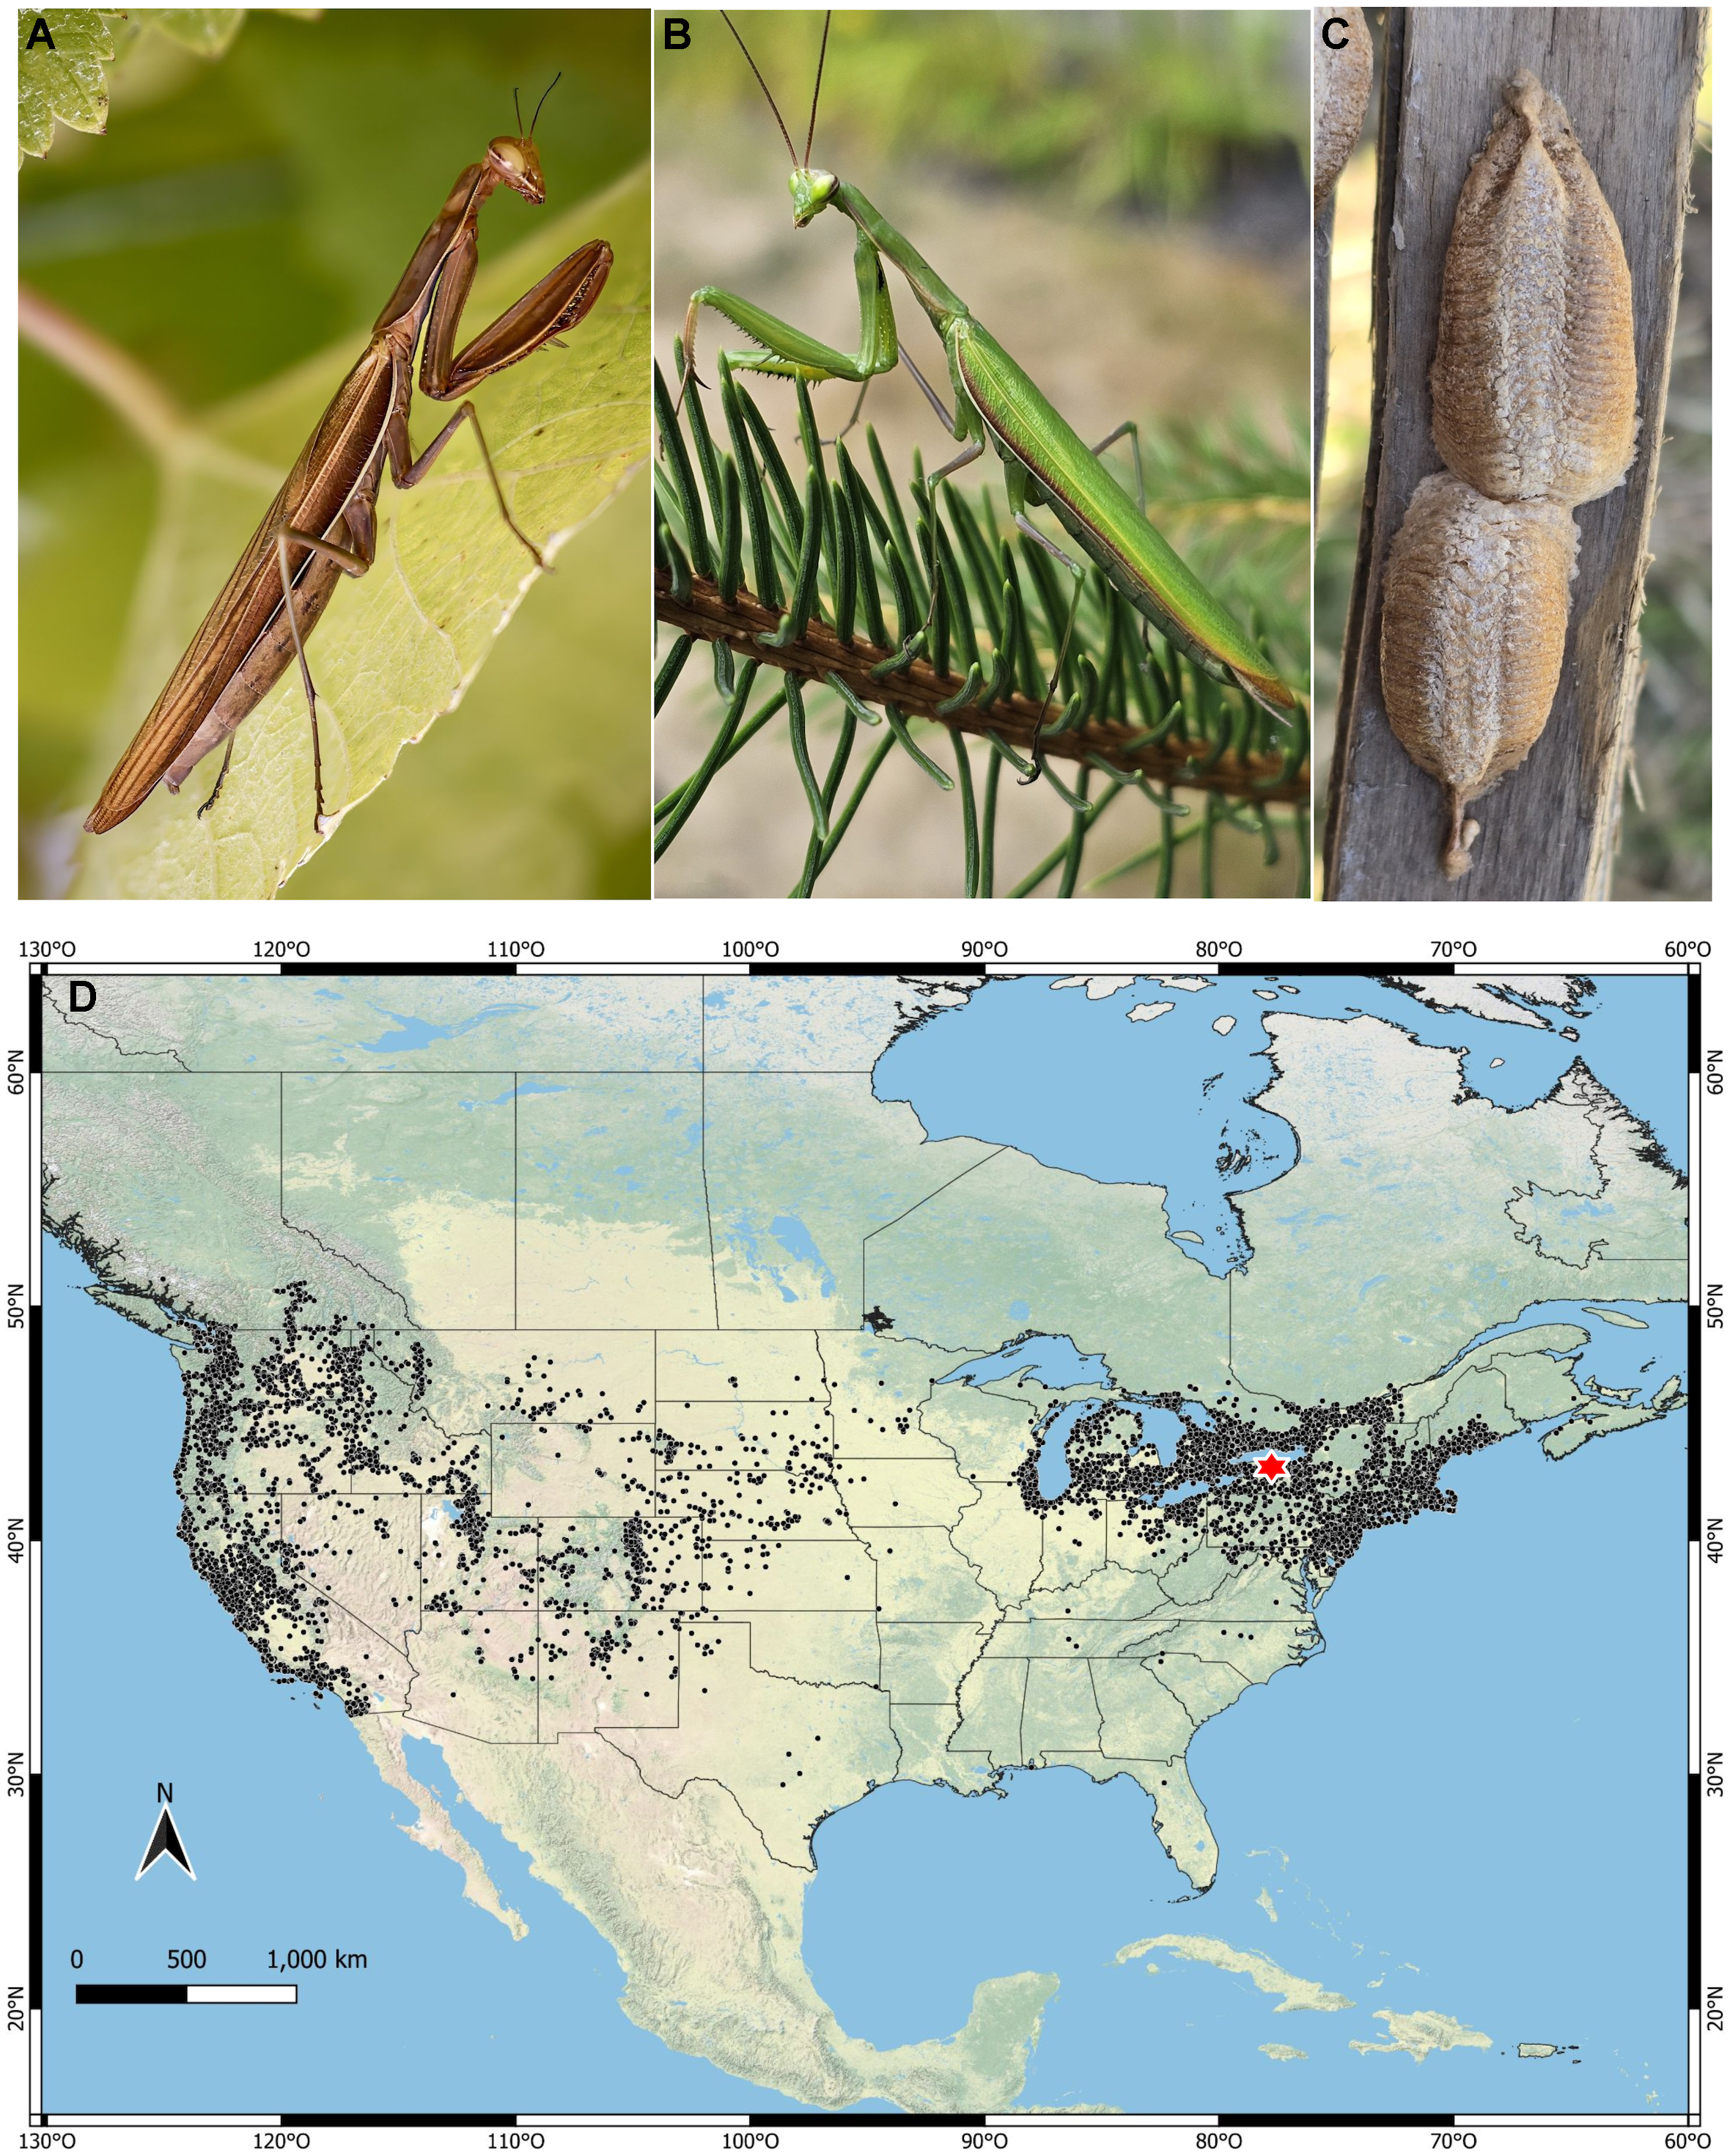
Figure 1. Mantis religiosa, habitus and distribution in Canada and the United States of America: A, female (brown phase) from British Columbia, Canada (photo: sandyii 2024, CC-BY-NC); B, male (green phase) from Ontario, Canada (photo: bluehawkins 2023, CC-BY-NC); C, oothecae on a wooden fence in British Columbia (photo: leannestacy 2025, CC0); and D, distribution map of M. religiosa based on iNaturalist research-grade records (black circles); the red star marks Rochester, New York, United States of America, the site of the first North American observation. The map was created using the ESRI physical map feature in QGIS (QGIS Development Team 2024), the official shapefiles are from the United States Census Bureau (2023) and the Government of Canada (2023). iNaturalist images may have been modified to enhance visualisation (not to scale).
Following its initial discovery in Rochester, M. religiosa was soon reported in Canada. It was first collected along the shores of Lake Ontario in 1913 (Norfolk and Prince Edward Counties, Ontario, Canada; Gibson Reference Gibson and Walker1915) and in eastern Quebec, Canada, in as early as 1940 (Urquhart and Corfe Reference Urquhart and Corfe1940; James Reference James and Baker1949). Additional introductions occurred in the 1930s, when specimens from Ontario were released in British Columbia, Canada, as a biological control agent; however, the species did not become well documented there until the 1970s (Cannings Reference Cannings2007). It has also been recorded in the Canadian Maritimes, with confirmed collections from Nova Scotia and New Brunswick dating to at least 1979 (Klymko et al. Reference Klymko, Catling, Ogden, Harding, McAlpine and Robinson2018). Despite these observations, a key question remains unresolved: From where did the introduced populations of Mantis religiosa originate?
An early hypothesis, proposed by Slingerland (Reference Slingerland1900), was that M. religiosa was accidentally introduced from France. At the time, Rochester was a major hub of the North American horticultural industry and imported large volumes of live plants from Europe, particularly from France (Lyon-Jenness Reference Lyon-Jenness2004a; Burd Reference Burd2019). Slingerland (Reference Slingerland1900) hypothesised that egg cases affixed to dried grasses or plant stems used in nursery shipments were the most likely pathway of introduction. Although plausible, the French origin hypothesis has not been tested empirically and remains historical speculation. More than a century passed before the question of the geographic origin of introduced M. religiosa populations was addressed again, when Jia et al. (Reference Jia, Zhang, Xu, Dai, Yu, Storey and Zhang2019) and Luchetti et al. (Reference Luchetti, Ometto and Rota-Stabelli2021), using mitochondrial genome data, suggested that introduced populations from Ontario had a connection to China and Italy, respectively. However, both Jia et al. (Reference Jia, Zhang, Xu, Dai, Yu, Storey and Zhang2019) and Luchetti et al. (Reference Luchetti, Ometto and Rota-Stabelli2021) examined an insufficient number of specimens for effective cross-population comparisons (one individual each from China and Italy and one from Ontario), and neither a Chinese nor an Italian origin for Ontario’s introduced populations was substantiated.
The present study aimed to clarify the geographic origin of Mantis religiosa populations established in southern Quebec and Ontario using an 807-bp fragment of the mitochondrial cytochrome c oxidase subunit 1 (CO1) gene as a molecular marker. Sequences obtained from Canadian specimens were compared to a geographically diverse dataset of publicly available European sequences. Based on this data, we conducted a phylogeographic analysis to assess whether these populations can be traced back to France, as suggested by historical records, or to another region in Europe or Asia. For M. religiosa, identifying the specific source population is particularly important because such information defines the ecologically relevant baseline for calibrating species distribution models, thereby improving predictions of the potential spread of this climate-sensitive predatory insect in eastern Canada.
Materials and methods
Sampling
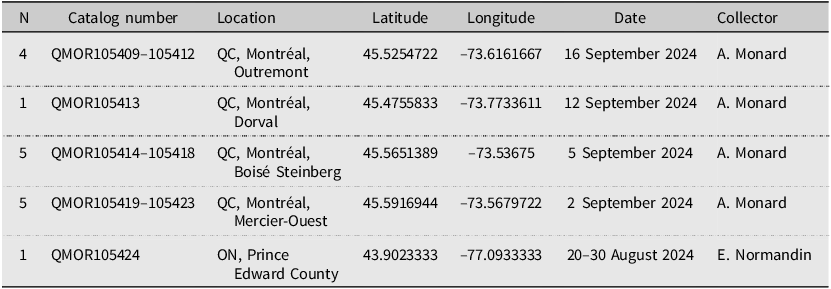
Using iNaturalist records to target collecting sites for M. religiosa, we obtained 16 specimens for tissue extraction and molecular analysis: 15 from Montréal, Quebec and one from Prince Edward County, Ontario (Table 1). All specimens were preserved in 90% ethanol at –4 °C immediately after collection. All voucher specimens are deposited in the Ouellet–Robert Entomological Collection, Université de Montréal, Montréal, Quebec, Canada. In addition, we assembled a dataset of 177 publicly available CO1 sequences of M. religiosa, primarily from Linn and Griebeler (Reference Linn and Griebeler2015), with additional samples obtained from Jia et al. (Reference Jia, Zhang, Xu, Dai, Yu, Storey and Zhang2019), Luchetti et al. (Reference Luchetti, Ometto and Rota-Stabelli2021), and Song et al. (Reference Song, Béthoux, Shin, Donath, Letsch and Liu2020). These sequences represent the following geographic regions: southern Ontario, Canada (n = 1), China (n = 1), and nine countries across three major European regions: western Europe – France (n = 59), Germany (n = 55), and Austria (n = 5); eastern Europe – Czech Republic (n = 19), Hungary (n = 9), Ukraine (n = 4), Slovakia (n = 3), and Russia (n = 1); and southern Europe – Italy (n = 20). See Supplementary materials, Table S1 for repositories, accession numbers, and reference sources for all used sequences.
Table 1. Voucher specimens of Mantis religiosa deposited at the Ouellet-Robert Entomological Collection (QMOR) used for tissue extraction and genetic analysis. ON, Ontario; QC, Quebec; N, number of specimens

Tissue collection and DNA extraction
Muscle tissue samples were dissected from the pleural region of the insect’s metathorax using sterile microscissors and forceps. All instruments were sterilised between specimens using a 0.5% bleach solution, followed by rinsing with 90% ethanol. Tissue samples were preserved at –20 °C in Eppendorf tubes containing 1 mL of 96% ethanol. QuickExtract™ DNA Extraction Solution (catalog no. QE0905T, QE09050; Lucigen, New York, United States of America) was used to extract the DNA. For each sample, 100 µL of extraction solution was added to the tissue inside 0.2-mL polymerase chain reaction strip tubes. The tubes were centrifuged briefly, incubated at 65 °C for 6 minutes, vortexed for 15 seconds, incubated at 98 °C for 2 minutes, and then cooled to 4 °C. The DNA extractions were stored at –20 °C.
Polymerase chain reaction amplification and sequencing
We amplified an 807-bp fragment of the mitochondrial CO1 gene. The choice of CO1 for population-level inference offers several analytical advantages (Guo et al. Reference Guo, Yuan, Tao, Cai and Zhang2022) that enable the tracing of geographic-connectivity patterns among populations: (1) mitochondrial DNA is maternally inherited and lacks recombination, simplifying analyses of population structure and lineage; (2) the CO1 gene is highly conserved within species, making it suitable for intraspecific variation studies; and (3) the gene evolves rapidly in insects, facilitating the detection of recent evolutionary events and broad population structure. These properties underpin the gene’s use in invasion pathway studies (e.g., Cesari et al. Reference Cesari, Maistrello, Piemontese, Bonini, Dioli, Lee and Park2018; Sun et al. Reference Sun, Tao, Roques and Luo2020; Xia Reference Xia2024; Contreras-Negrete et al. Reference Contreras-Negrete, Meza-Lázaro, Benites, Becerra-Lira, Sakata and Ohgushi2025). To isolate the target sequence, we used the primer set described by Linn and Griebeler (Reference Linn and Griebeler2015): MT-C1-N2568 (forward, 5′-GCTACAACATAATAAGTATCATG-3′) and MT-C1-J1718 (reverse, 5′-GGATTTGGAAATTGATTAGTTCC-3′). Each polymerase chain reaction contained 7 µL of nuclease-free water, 10 µL of 2× Phire Hot Start II Master Mix (Thermo Scientific, Waltham, Massachusetts, United States of America), 1 µL of forward primer (10 pmol/µL), 1 µL of reverse primer (10 pmol/µL), and 1 µL of DNA extract, for a total volume of 20 µL. Polymerase chain reaction was performed using a hot start at 94 °C for 2 minutes, followed by 35 cycles of denaturation at 94 °C for 30 seconds, annealing at 47 °C for 30 seconds, and extension at 72 °C for 90 seconds (Linn and Griebeler Reference Linn and Griebeler2015). Polymerase chain reaction products were submitted to Genome Québec for Sanger sequencing. All sequences generated in this study have been deposited in GenBank under accession numbers PX620282–PX620297.
Sequence assembly and alignment
We assembled the published sequences from Linn and Griebeler (Reference Linn and Griebeler2015) to form an 807-bp reference alignment using MEGA11 (Tamura et al. Reference Tamura, Stecher and Kumar2021) with the MUSCLE algorithm. The newly generated sequences, along with those obtained from Jia et al. (Reference Jia, Zhang, Xu, Dai, Yu, Storey and Zhang2019), Luchetti et al. (Reference Luchetti, Ometto and Rota-Stabelli2021), and Song et al. (Reference Song, Béthoux, Shin, Donath, Letsch and Liu2020), were manually aligned to this reference. Alignments were visually inspected and corrected using electropherograms to ensure the accuracy of base calls. All sequences were trimmed to match the 807-bp reference length
Phylogeographic and population differentiation analyses
To infer phylogenetic relationships among haplotypes, we constructed a neighbour-joining tree using MEGA11 (Tamura et al. Reference Tamura, Stecher and Kumar2021) with the Kimura two-parameter model of nucleotide substitution. This model, widely applied to DNA barcoding data, accounts for unequal rates of transitions and transversions and is well suited to short CO1 fragments with low levels of divergence and negligible substitutional saturation, providing a standardised and reliable framework for estimating intraspecific variation (Ratnasingham and Hebert Reference Ratnasingham and Hebert2007). Node support was assessed with 5000 bootstrap replicates to ensure robust estimation of branch confidence. A sequence of Sphodromantis lineola (Burmeister, 1838) was included as an outgroup. The resulting tree was edited using FigTree (Rambaut Reference Rambaut2018). Aligned sequences were exported to PopART (Leigh and Bryant Reference Leigh and Bryant2015) to identify unique haplotypes and build haplotype networks. Such networks illustrate how different haplotypes are connected by shared ancestry. To better understand the genetic relationships among M. religiosa haplotypes, we constructed networks using three distinct methods: the minimum spanning and the median-joining networks (Bandelt et al. Reference Bandelt, Forster and Röhl1999) and the Templeton et al. network (Clement et al. Reference Clement, Posada and Crandall2000). Each method applies a different algorithmic logic, and using them in parallel allows for cross-validation of observed patterns. The minimum spanning network method provides a straightforward visualisation of haplotype relationships based on mutational steps but does not infer unsampled haplotypes (Bandelt et al. Reference Bandelt, Forster and Röhl1999). The median-joining network method extends this approach by incorporating median vectors that represent hypothetical ancestral sequences, which can reveal potential unsampled or extinct intermediate haplotypes (Bandelt et al. Reference Bandelt, Forster and Röhl1999). The Templeton et al. network method applies a statistical parsimony criterion to limit connections based on mutational probability, providing a conservative representation of genealogical structure (Templeton et al. Reference Templeton, Crandall and Sing1992; Clement et al. Reference Clement, Posada and Crandall2000). Together, these complementary approaches enhance the robustness of network interpretation and help identify consistent signals of population structure and divergence (Posada and Crandall Reference Posada and Crandall2001).
Pairwise genetic distances between haplotypes were calculated using MEGA11 with the same parameters as the neighbour-joining tree. Nucleotide and haplotype diversity were computed for the full M. religiosa dataset using DnaSP, version 6 (Rozas et al. Reference Rozas, Ferrer-Mata, Sánchez-DelBarrio, Guirao-Rico, Librado, Ramos-Onsins and Sánchez-Gracia2017). Guided by the results of the neighbour-joining tree, the dataset was then divided into two subgroups: Haplogroup A (haplotypes A1 to A15, n = 83) and Haplogroup B (haplotypes B1 to B25, n = 106). Fixation index (F ST) values were calculated to assess genetic differences between haplogroups (Weir and Cockerham Reference Weir and Cockerham1984).
Results
Overview
An 807-bp fragment of the CO1 gene was successfully sequenced for each of the 16 M. religiosa individuals we had collected from Quebec and Ontario. The complete dataset, comprising both newly generated and publicly available sequences, revealed 40 unique haplotypes (Supplementary material, Table S1; Fig. 2A). Haplotype diversity was high (Hd = 0.940), indicating substantial genetic variability across the dataset. A total of 45 segregating sites were detected. In contrast, nucleotide diversity was low (π = 0.00953), as was the mean pairwise genetic distance (0.00994), suggesting relatively low overall sequence divergence among haplotypes. The Italian sequence retrieved from Luchetti et al. (Reference Luchetti, Ometto and Rota-Stabelli2021; haplotype B13) was nested with European populations; however, the sequence from China (Jia et al. Reference Jia, Zhang, Xu, Dai, Yu, Storey and Zhang2019) was recovered outside the European cluster, indicating that it represents a genetically distinct lineage (results not shown). Accordingly, we retained the Italian sequence but excluded the Chinese one from more detailed analyses. The final M. religiosa dataset included 192 sequences from 10 countries.
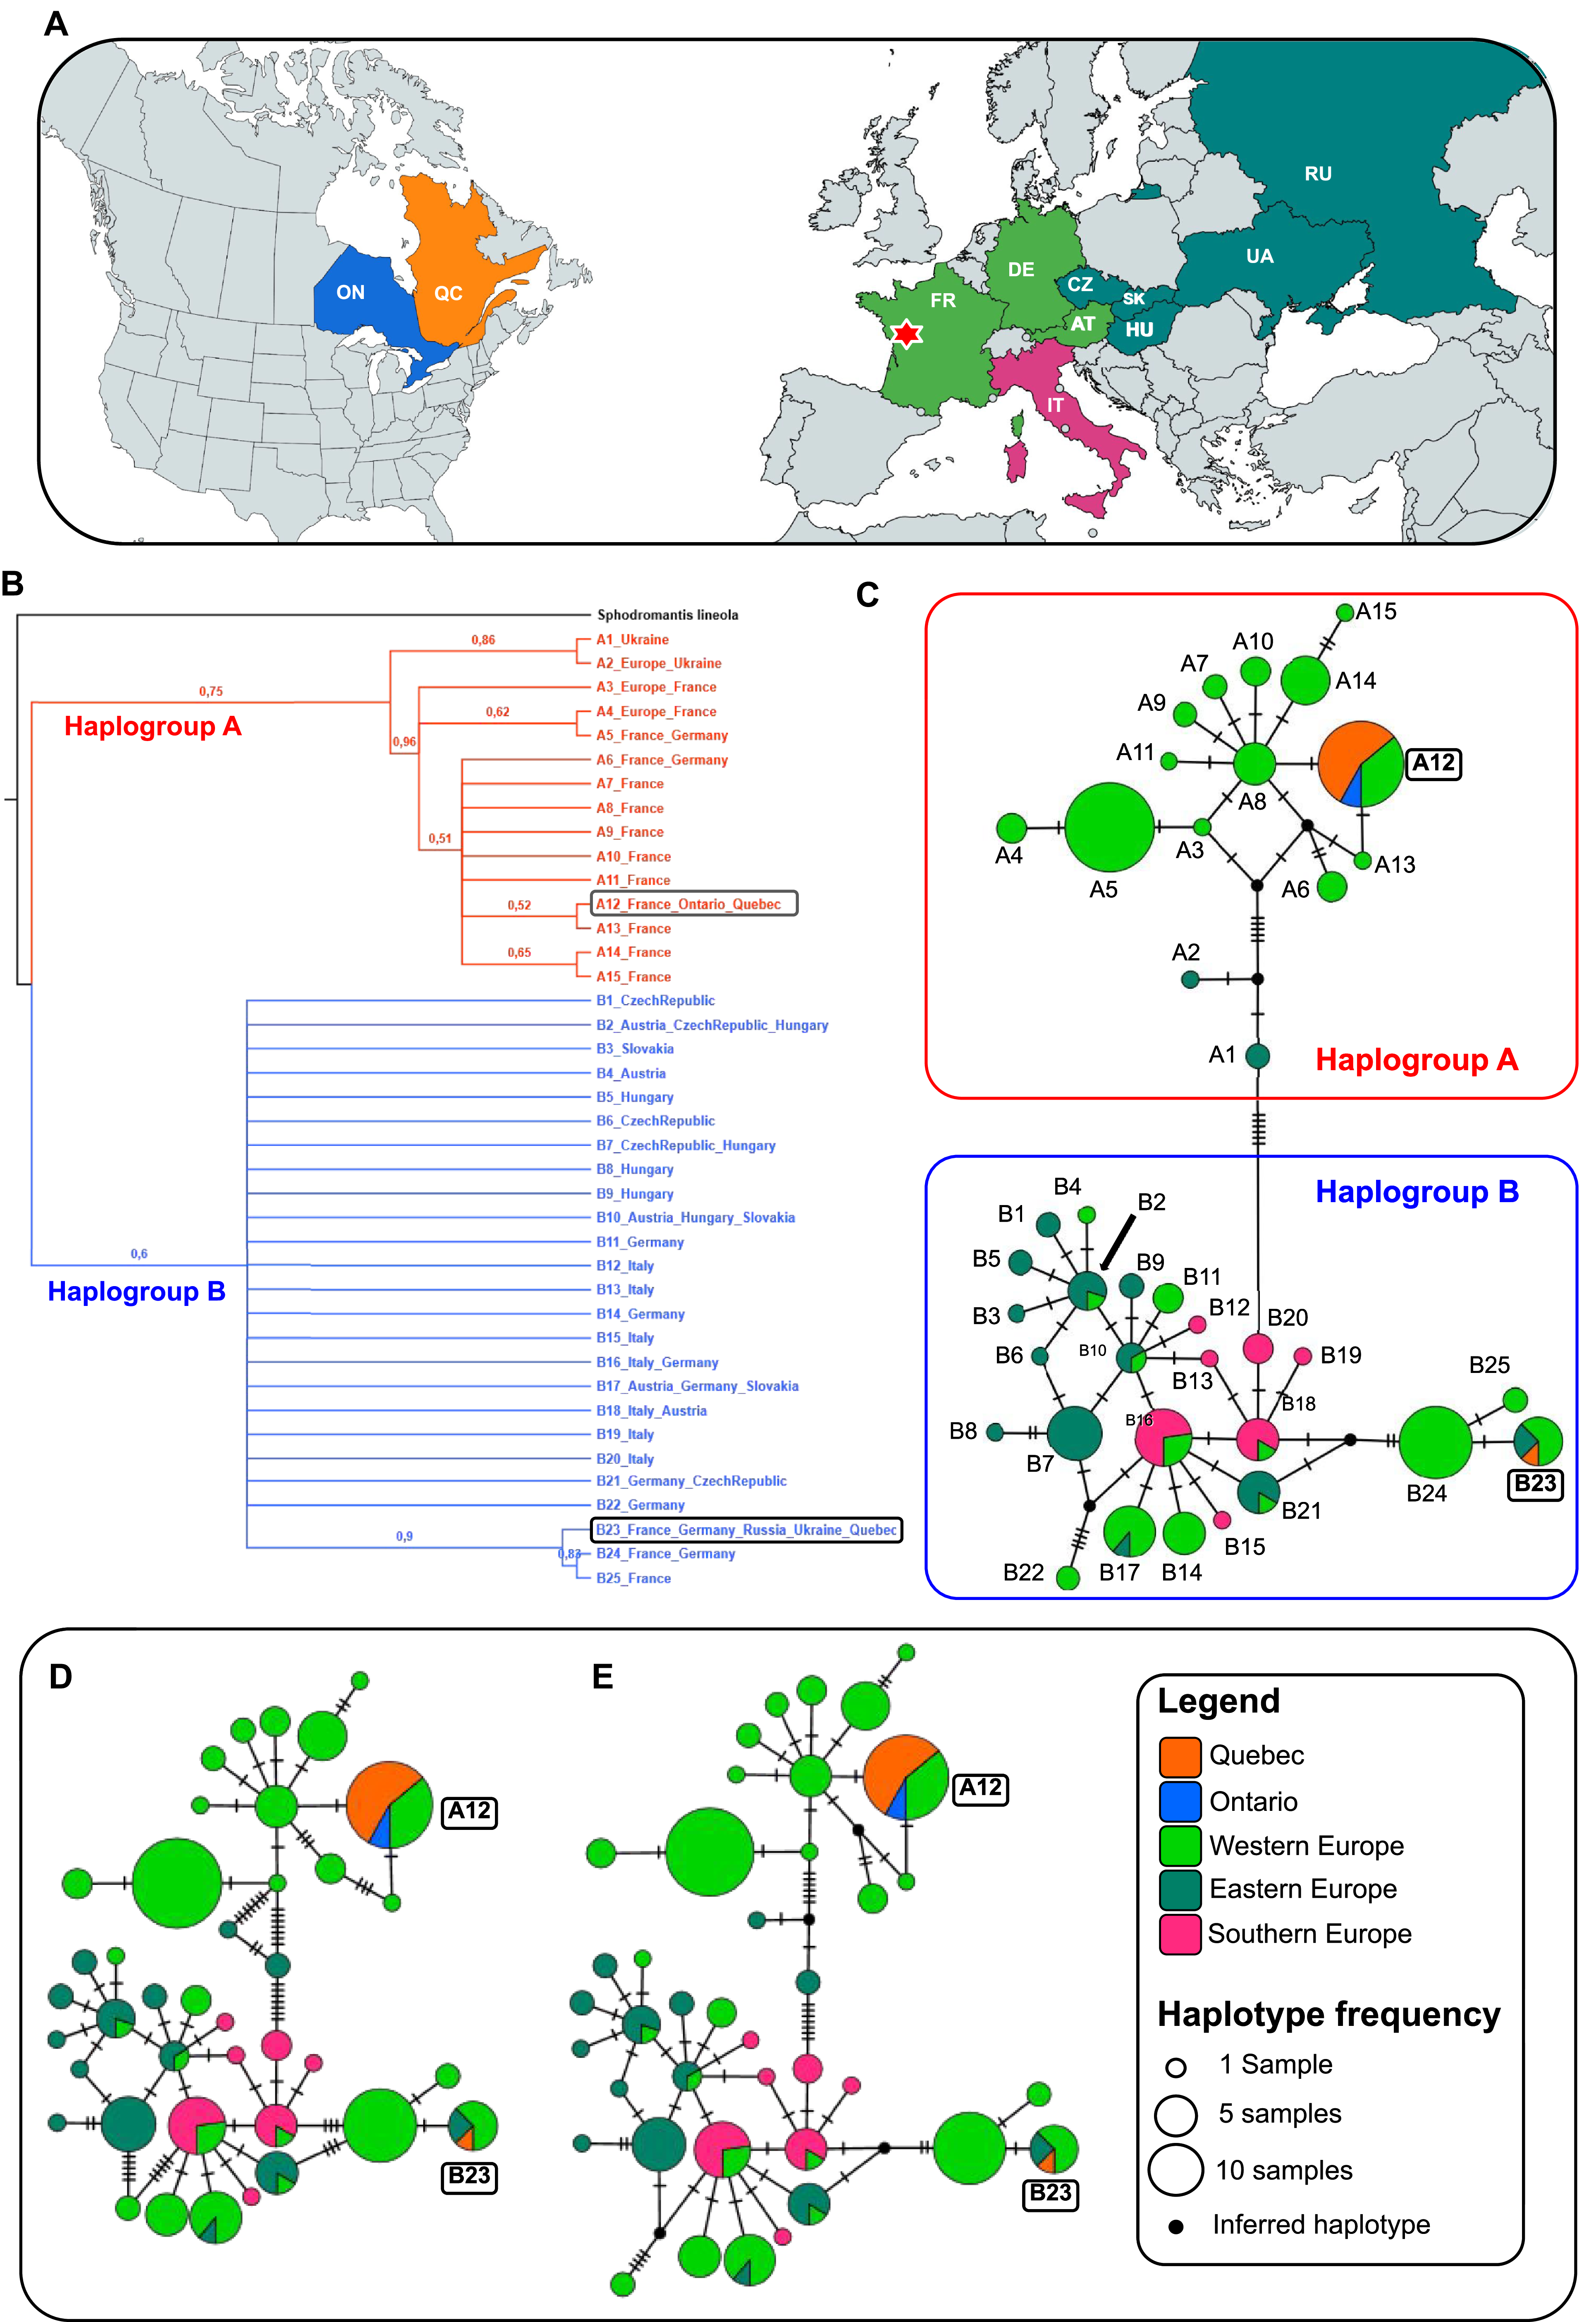
Figure 2. Intraspecific genetic affinities among Mantis religiosa populations: A, map of CO1 sampling coverage; countries are colour-coded per the legend (continents not to scale); the red star marks the only locality in western France where haplotypes A12 and B23 co-occur; B, bootstrapped neighbour-joining tree illustrating relationships among 40 unique haplotypes examined – terminals represent haplotypes with country occurrence (sample counts are in Supplementary material, Table S1), bootstrap values (maximum = 1) are shown on branches; and C–E, haplotype networks – each circle represents a haplotype (size reflects frequency) and is colour-coded by region; black lines connect related haplotypes, and dashes represent mutational steps (one dash = one substitution; lengths not to scale); small black nodes indicate inferred unsampled or extinct intermediates in the median-joining network and Templeton et al. network: C, median-joining network; D, minimum spanning network; and E, Templeton et al. network. Haplogroup A (western Europe–dominant) shows a star-like pattern, indicating recent expansion. Haplogroup B (western, eastern, and southern Europe) displays a reticulate structure, suggesting long-term persistence, ancestral lineage sharing, and historical gene flow across multiple refugia. Haplotypes common to both Canada and Europe are highlighted in boxes for clarity. Abbreviations: AT, Austria; CZ, Czech Republic; DE, Germany; FR, France; HU, Hungary; IT, Italy; ON, Ontario; QC, Quebec; RU, Russia; UA, Ukraine; SK (Slovakia).
Phylogeographic analysis
The neighbour-joining tree identified two well-supported genetic lineages, which we named Haplogroup A and B (Fig. 2B). These lineages were recovered with bootstrap support (BS) values exceeding 50%. Within Haplogroup A, haplotype A12 clustered closely with A13, also from France, with moderate support (BS = 52%). A broader branch including haplotypes A3 to A15, primarily composed of sequences from French specimens, was strongly supported (BS = 96%). In Haplogroup B, haplotype B23 grouped with B24 and B25, sampled from France and Germany, with high support (BS = 90%).
All three haplotype network reconstruction methods consistently identified two distinct and divergent clusters, Haplogroup A and B, with the latter showing greater genetic diversity (Fig. 2C, D). Haplogroup A includes haplotypes A1 to A15 and is primarily distributed in western Europe, particularly in France and Germany. In contrast, Haplogroup B, comprising haplotypes B1 to B25, has a broader geographic distribution, occurring not only in western Europe but also extending into eastern and southern regions of the continent (Fig. 2). These results are consistent with those of Linn and Griebeler (Reference Linn and Griebeler2015). The sequences from Ontario and Quebec were identical to either haplotype A12 or B23. In Europe, haplotype A12 is found exclusively in France, whereas haplotype B23 is also found in France but has a broader distribution, including Germany, Ukraine, and central Russia. Notably, haplotype A12 differs from A13 and A8, both also found in France, by only a single-nucleotide substitution. In turn, A8 is connected by one substitution to haplotypes A9, A10, A11, and A14, all of which exclusively occur in France. Within Haplogroup B, haplotype B23 differs from haplotypes B24 and B25, present in France and Germany, by a single nucleotide substitution.
Population differentiation analyses
Pairwise genetic distance analyses further support the distinction between Haplogroups A and B (Supplementary material, Table S2). This metric, which quantifies the average percentage of nucleotide differences between sequences, revealed low within-group divergence and higher between-group differentiation. Specifically, sequences within Haplogroups A and B showed low mean pairwise distances (0.55 and 0.48%, respectively), indicating limited genetic variation among haplotypes within each lineage. In contrast, the mean pairwise distance between the two haplogroups was markedly higher (1.53%), reflecting clear genetic differentiation at the CO1 locus. The very high (Fst > 0.25) estimated fixation index (Fst = 0.75478), which quantifies genetic divergence between the two populations, further reinforces this differentiation. Haplotypes A12 and B23 exhibited the smallest genetic distance to other haplotypes from western Europe, particularly those from France.
Discussion
Our findings support a French origin for the M. religiosa populations established in southern Quebec and Ontario. Two distinct CO1 haplotypes were detected among all Canadian individuals (A12 and B23), both of which also occur in France, with their co-occurrence uniquely recorded in the locality of Quinçay, western France (46.6° N, 0.2° E; Fig. 2A). This geographic coincidence, combined with the genetic proximity of each haplotype to other French variants within its respective lineage, implies that haplotypes A12 and B23 likely originated from the same general area. In other words, despite belonging to two distinct lineages, the haplotypes found in Canada appear to share a common geographic origin in western Europe, rather than resulting from separate introductions from unrelated regions. This pattern is reinforced by both the phylogenetic tree and the haplotype network, as well as by genetic metrics: although overall sequence divergence is low, the separation between the two haplogroups is clear, indicating that at least one haplotype representative of each of the two major CO1 lineages of M. religiosa in Europe is now established in Canada. Taken together, these results provide consistent genetic evidence that introduced populations of M. religiosa in southern Quebec and Ontario most likely descended from individuals transported from western France to North America, effectively ruling out the Italian origin hypothesis proposed by Luchetti et al. (Reference Luchetti, Ometto and Rota-Stabelli2021).
This genetic evidence aligns well with historical accounts. In 1900, Slingerland documented the first North American record of M. religiosa near Rochester, New York, and hypothesised that the species had been introduced via the horticultural trade. At the time, Rochester was widely known as “America’s Flower City” and served as a major centre for plant imports from Europe, particularly from France (Lyon-Jenness Reference Lyon-Jenness2004b; Burd Reference Burd2019). The city’s position along major shipping and railway routes made it a key hub in the transatlantic nursery industry. Many insect species were transported across these long distances. For example, the Japanese beetle, Popillia japonica Newman, 1841 (Coleoptera: Scarabaeidae), was introduced into North America through an ornamental nursery in New Jersey, United States of America (Althoff and Rice Reference Althoff and Rice2022). Because M. religiosa oothecae (egg cases) can firmly adhere to plant material and human-made objects while effectively protecting eggs and embryos from harsh environmental conditions, they are particularly well-suited for unintentional transport (Liana Reference Liana2007). These factors make it highly plausible that, after its initial arrival from western France via imported nursery stock, M. religiosa dispersed, in as little as 15 years, from Rochester into southern Ontario along the shores of Lake Ontario. This rapid, local expansion, remarkable for a relatively sedentary insect, was likely driven by human-assisted dispersal along the rail or trade routes connecting Rochester to urban centres in Ontario, much like the documented spread of the Oriental mantid species, Hierodula patellifera (Mantodea: Mantidae) (Audinet-Serville, 1839), in Europe (Battiston et al. Reference Battiston, Amerini, Di Pietro, Guariento, Bolognin and Moretto2020).
The presence of only two haplotypes among all sampled mantid individuals from Ontario and Quebec is striking. Although this pattern may reflect limited geographic or sample coverage, it may also suggest population-level processes at play. One plausible explanation is environmental filtering, whereby abiotic conditions, such as winter temperature extremes, selectively constrain which genotypes can survive and establish in a new environment (Kraft et al. Reference Kraft, Adler, Godoy, James, Fuller and Levine2015). In the case of M. religiosa, the overwintering success of the oothecae is a critical factor in establishment, and only a subset of introduced haplotypes may have been cold-tolerant enough to persist under Canadian conditions. Historical observations by Slingerland (Reference Slingerland1900) noted that some egg cases collected near Rochester were unviable, whereas others hatched normally, possibly reflecting early filtering in action. Whether the two haplotypes found in southern Canada represent a genetic bottleneck following introduction or the outcome of repeated introductions followed by selective persistence remains an open question. Further sampling across Canada and targeted ecological studies would help to assess whether this pattern reflects limited introduction sources, environmental constraints, or founder effects followed by local expansion.
Conclusions
Our phylogeographic analysis strongly supports a French origin for introduced M. religiosa populations in southern Quebec and Ontario. These populations carry two divergent haplotypes, A12 and B23, that are identical or nearly identical to variants found across France but which co-occur only in its western region. The limited haplotype diversity in Canadian samples (just 5%) may reflect incomplete sampling, founder effects, or environmental filtering, all of which could have constrained the species’ establishment to only a subset of introduced genotypes. Notably, haplotypes A12 and B23 occur within the same latitudinal band (46–44° N; Supplementary material, Table S1), and they appear to have originated from European populations that also show signatures of recent post-glacial range expansion (Linn and Griebeler Reference Linn and Griebeler2015), linking continental-scale demographic processes to the success of introduced lineages abroad.
Although our results support a French origin for the studied populations, the species’ broad native range and the ease with which its oothecae can be inadvertently transported suggest that additional introductions may have taken place. Expanded sampling across North America, especially in underrepresented regions of Canada (e.g., the Maritimes) and at historical entry points in the United States of America, could help uncover such events. Because our study relied on a maternally inherited mitochondrial marker (CO1), future work incorporating nuclear markers, such as microsatellites, single nucleotide polymorphisms, or restriction site–associated DNA sequences, would provide broader genomic coverage and enable the detection of secondary introductions and finer-scale genetic structure. Historical DNA from museum specimens may also reveal early haplotypes that failed to persist, offering insight into past filtering processes. By confirming the French origin of M. religiosa in southern Quebec and Ontario, our study provides critical source data to improve species distribution models, which benefit from ecologically realistic calibrations (Srivastava et al. Reference Srivastava, Roe, Keena, Hamelin and Griess2021). As M. religiosa continues to expand and other mantis species are increasingly transported beyond their native ranges (Connors et al. Reference Connors, Chen, Li, Edmonds, Smith and Gell2022), the present study provides a straightforward framework for tracking invasive pathways. Identifying regions that function as ecological sinks or sources for alien Mantodea taxa can guide conservation planning and biosecurity strategies aimed at limiting the future spread of generalist mantis species (e.g., Hierodula and Tenodera).
The present study brings closure to an arc that began 125 years ago with Horace F. Atwood’s keen observation. Although not a formally trained scientist, Atwood had a strong personal interest in science (Devoy Reference Devoy1895). His curiosity, detailed recording, and engagement with experts led to the discovery and first official record of M. religiosa in North America. By today’s standards, his contribution would be recognised as a citizen science–driven discovery (Bonney et al. Reference Bonney, Ballard, Jordan, McCallie, Phillips, Shirk and Wilderman2009). That same spirit is now reflected in the thousands of individuals who document species through platforms such as iNaturalist (e.g., bluehawkins 2023; sandyii 2024; leannestacy 2025; Fig. 1D), enabling scientific discoveries and accelerating biodiversity research (Mason et al. Reference Mason, Mesaglio, Barratt Heitmann, Chandler, Chowdhury and Gorta2025). This continuity illustrates how public observations, including historical ones, can help trace biological invasions over time when paired with modern scientific tools, deepening our understanding of ecological change.
Supplementary material
The supplementary material for this article can be found at https://doi.org/10.4039/tce.2025.10044.
Acknowledgements
The authors thank Martin Lefrançois (Centre sur la biodiversité, Institut de recherche en biologie végétale) and Étienne Normandin (Ouellet-Robert Entomological Collection) for their support. The authors are also grateful to Silvana Alcalá for crafting the map presented in Figure 1D. This work was supported by a Mitacs Accelerate scholarship (IT32681) awarded to J.R.


 Open access