


1. Motivation
After Republicans won a historic majority in the 2014 midterm election, Speaker of the House John Boehner (R-OH) had a problem. There was growing dissent in his ranks over his leadership style. Many Republican Congressmembers were worried that Boehner was far too willing to cut deals with the Obama administration and not committed enough to a sufficiently conservative agenda. Rumblings of a potential rebellion began to pass through the halls of the Capitol. This fomenting discontent boiled over on January 6, 2015. As the new Congress convened to vote on its Speaker, party leaders expected the (near) unanimous support of their caucus in the election. Boehner faced what Aaron Blake of the Washington Post dubbed “the biggest revolt...in more than 150 years.”Footnote 1 Many participants in this rebellion went on to establish the House Freedom Caucus. Led by Representative Mark Meadows of North Carolina, the Freedom Caucus has since made its objective to pursue solidly conservative policy goals, even if it means bucking the party leadership.
In an era of supposedly strong parties,Footnote 2 such rebelliousness is puzzling. Ideal point estimation methods of both the Poole and Rosenthal (Reference Poole and Rosenthal1997) and Bayesian flavors (Clinton et al., Reference Clinton, Jackman and Rivers2004) have shown increased within-party voting homogeneity over the last two decades. Beyond legislator ideal points, traditional and widely-used measures of party loyalty display similar patterns. The most widely employed flavor of these, Party Unity Scores (see, e.g., Brady et al., Reference Brady, Cooper and Hurley1979), show that members’ rates of voting with the majority of their party on party unity votes—votes in which at least half of the Democrats voted against half of the Republicans—are at all-time highs.
Despite these seemingly unmistakable trends, neither ideal points nor Party Unity Scores can explain this rebellion. In Figure 1, we see that both ideal points (measured using Bayesian ideal point approaches described below) and Party Unity Scores fail to discriminate between Republicans who voted for and against Boehner. In fact, looking at Party Unity Scores, we see that 23 of the 25 legislators who voted against Boehner had Party Unity Scores that were just as high, if not higher, than the members who voted for him.Footnote 3 While this discrepancy could be idiosyncratic, we argue that it is indicative of broader theoretical and empirical problems in the study of legislative voting. Both ideal point estimates and party loyalty scores rely on legislative roll call votes. If legislators’ voting behavior is driven by both underlying preferences and party influence, then failing to adequately account for this reality will lead to problematic inferences. Thus, in the Boehner rebellion, it could simply be the case that our measures of party loyalty are insufficiently specified and, as such, the most rebellious Republicans really were those most likely to abandon him.

Figure 1. Violin plots of the republican rebellion against Boehner in 2015.
These issues of measurement are just a part of an even broader debate in the study of legislative institutions: how do we disentangle legislators’ preferences from party loyalty and/or influence? The crux of this puzzle is at once both theoretical and methodological. Specifically, how do we know when parties care/prioritize the issue at hand? Virtually all existing empirical approaches make some assumption about when they do—e.g., they always care, never care, care about close votes, care but only with respect to procedure, and so on. One part of this literature (largely) ignores legislators’ preferences and assumes that examining some variant of party unity—measured as voting with either the majority of one’s party or with the party leadership—gives a sufficient measure of party loyalty (e.g., Erickson, Reference Erickson1971; Brady et al., Reference Brady, Cooper and Hurley1979; Cox and McCubbins, Reference Cox and McCubbins1991; Roberts and Smith, Reference Roberts and Smith2003; Lebo et al., Reference Lebo, McGlynn and Koger2007; Carson et al., Reference Carson, Koger, Lebo and Young2010; Pyeatt, Reference Pyeatt2015). The problem here is clear; these approaches make it impossible to distinguish loyalty by accident (i.e., voting with one’s party out of shared preferences) from actual loyalty (i.e., voting with the party despite preference disagreement). Another part of this literature assumes that parties care about a subset of votes—usually close ones (e.g., Snyder and Groseclose, Reference Snyder and Groseclose2000; Ansolabehere et al., Reference Steven, Snyder and Stewart2001; Minozzi and Volden, Reference Minozzi and Volden2013). Using this assumption, scholars estimate legislators’ ideal points from “party-free” votes and then use these to estimate party pressure on “party influenced” votes. But, to be sure, there is no way of knowing that parties actually do not care about lopsided votes but do care about close ones. While this is not necessarily an unreasonable assumption, it opens up such approaches to endless criticism.
In this paper, we employ new data and methods to address this complex set of issues in a straightforward fashion. Specifically, we use speeches made by party leaders—i.e., the Speaker, Majority Leader, and Minority Leader—on the House floor to identify the presence and direction of party interest and, in turn, build this into the standard Bayesian framework for ideal point estimation (Clinton et al., Reference Clinton, Jackman and Rivers2004). The results from our approach allow us to do two things. First, we are able to measure the preferences of legislators from the last two and a half decades netting out (most) direct party influence. Second, and more importantly, we are able to estimate the party loyalty of members of Congress over time. Critically, unlike extant approaches, we neither require party influence to be symmetric across parties, nor do we require that party effects are uniform across members. Together, these estimates allow us to disentangle the role of legislator’s preferences and party loyalty. These measures open the way for scholars to evaluate the impact of preferences, parties, or both across a wide array of research questions that have been entangled by the empirical melding of the two.Footnote 4
In what follows, we first develop a basic theoretical model of party influence and explore the empirical challenges in estimating it from data. Therein, we discuss the most prominent extant work in the literature that uses roll call votes to measure both legislator ideal points and party influence simultaneously. Second, we develop our statistical model, building off of the standard Bayesian ideal point model (Clinton et al., Reference Clinton, Jackman and Rivers2004). To disentangle preferences from party, we rely on a new dataset on party leader speeches from the 101st to 113th Congresses (Asmussen and Ramey, Reference Asmussen and Ramey2018). Third, we estimate preferences and party loyalty for all members during this period and examine trends in loyalty by party during this time period.Footnote 5 The results highlight new and interesting insights on the rise of intra-party rebellion during the Obama administration.Footnote 6
2. Theoretical and methodological challenges in measuring party influence
To understand the existing literature’s problems with measuring party loyalty, it is useful to develop a simple formal model of the legislative decision-making process. Since this model will be the basis for the estimator we develop in the next section, we will try to keep the notation and terminology as consistent as possible. Moreover, since the ultimate goal will be estimation, our attention will be focused on challenges to estimate the parameters of the model using real-world roll call data.
Suppose we have a group of legislators  $i=1,2,...,N$ voting on a series of roll calls
  $j=1,2,...,J$ during a series of time periods
 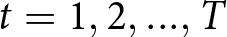 $t=1,2,...,T$. Legislator
  $i$ has a unidimensional ideal point
  $x_i\in\mathbb{R}$ and evaluates alternatives in this space using a quadratic utility function; that is, for any policy
  $\theta\in\mathbb{R}$,
 \begin{equation}
u_i(\theta|x_i)=-(x_i-\theta)^2 + \varepsilon,
\end{equation}
\begin{equation}
u_i(\theta|x_i)=-(x_i-\theta)^2 + \varepsilon,
\end{equation} where  $\varepsilon$ is a Normally-distributed shock to the utility function. For now, we assume (without loss of generality) that
  $x_i \gt 0$. We will relax this in our statistical model that follows.Footnote 7
In each roll call, legislator  $i$ must decide to vote “yea” or “nay;” denote this binary decision
  $y_{ij}$, such that
  $y_{ij}=1$ if the legislator votes in the affirmative and
  $0$ if not. Legislators make their voting decisions based on both their preferences and (potential) party pressure. Let
  $\psi_j$ denote the spatial position associated with voting “yea” and
  $\xi_j$ denote the corresponding position for “nay.” Absent partisan consideration,
  $i$ will decide which way to vote purely on the basis of spatial proximity. However, suppose
  $i$’s party reveals that it cares about a particular roll call
  $j$; specifically, let
  $\rho_j$ be an indicator for whether the party cares about vote
  $j$. On such a vote
  $j$,
$j$,  $i$’s receives a shock to his or her utility function by an amount
  $b_{ij}(x_i)$. This convention follows Minozzi and Volden (Reference Minozzi and Volden2013), in that it allows partisan considerations to vary according to legislators’ preferences (or not at all). For example, the utility shock could be larger for moderates, extremists, those closest to the party median, or uniform.Footnote 8 Note that we are agnostic about what this shock is. It can represent direct party pressure/vote buying or could be some sort of less direct indication that the party leadership cares about the vote in question.
Altogether, this implies legislator  $i$ will vote “yea” on roll call
  $j$ if his/her utility from doing so is at least as large as the utility for voting “nay,” i.e.,
 \begin{equation}
-(x_i-\psi_j)^2 + \rho_jb_{ij}(x_i) + \varepsilon_{ij} \ge -(x_i-\xi_j)^2 + \varepsilon'_{ij}.
\end{equation}
\begin{equation}
-(x_i-\psi_j)^2 + \rho_jb_{ij}(x_i) + \varepsilon_{ij} \ge -(x_i-\xi_j)^2 + \varepsilon'_{ij}.
\end{equation} Mathematically, this approach nicely encapsulates other theoretical and empirical approaches in the literature. For example, if we follow Snyder and Groseclose (Reference Snyder and Groseclose2000) and assume that party effects are constant across legislators but vary by vote, set  $b_{ij}(x_i)=\delta_j$. Assuming that
  $\varepsilon_{ij}-\varepsilon'_{ij} \sim N(0,1)$, Equation 2 reduces (with some simple algebra) toFootnote 9
 \begin{equation}
\Pr(y_{ij}=1) = \Phi\left(\beta_jx_i-\alpha_j + \rho_j\delta_j \right).
\end{equation}
\begin{equation}
\Pr(y_{ij}=1) = \Phi\left(\beta_jx_i-\alpha_j + \rho_j\delta_j \right).
\end{equation} Alternatively, if we take the Minozzi and Volden (Reference Minozzi and Volden2013) approach and assume that party effects are increasing in extremism, set  $b_{ij}(x_i)=\delta_j x_i$, Equation 2 now reduces to
 \begin{equation}
\Pr(y_{ij}=1) = \Phi\left(\beta_jx_i + \rho_j\delta_jx_i -\alpha_j \right).
\end{equation}
\begin{equation}
\Pr(y_{ij}=1) = \Phi\left(\beta_jx_i + \rho_j\delta_jx_i -\alpha_j \right).
\end{equation} Whichever approach we assume, it is straightforward to see two clear problems for the empirical estimation of these model parameters using legislators’ voting records. First, if  $\rho_j=1$ for all
  $j$, then we cannot simultaneously estimate the roll call parameters, legislator ideal points, or party influence parameters. Thus, it must be the case that we must either have clear theory or data that ensures
  $\rho_j$ is not always either
  $0$ or
  $1$. For example, Snyder and Groseclose (Reference Snyder and Groseclose2000) solve this problem by assuming that
  $\rho_j=0$ for lopsided votes (i.e., those in which more than 65% of the chamber votes “yea” or “nay”) and
  $\rho_j=1$ otherwise.
Second, even if we can identify which votes parties care about, we still cannot identify  $\delta_j$. To see why, in Equation 3, when
  $\rho_j=1$, we are left with (effectively) two roll call-specific intercepts:
 \begin{equation}
\Pr(y_{ij}=1) = \Phi\left(\underbrace{(\delta_j-\alpha_j)}_{\small \mbox{intercepts}} +\beta_jx_i \right).
\end{equation}
\begin{equation}
\Pr(y_{ij}=1) = \Phi\left(\underbrace{(\delta_j-\alpha_j)}_{\small \mbox{intercepts}} +\beta_jx_i \right).
\end{equation}Similarly, in Equation 4, we are left with two slopes:
 \begin{equation}
\Pr(y_{ij}=1) = \Phi\left(x_i\underbrace{(\beta_j + \delta_j)}_{\small \mbox{slopes}}-\alpha_j \right).
\end{equation}
\begin{equation}
\Pr(y_{ij}=1) = \Phi\left(x_i\underbrace{(\beta_j + \delta_j)}_{\small \mbox{slopes}}-\alpha_j \right).
\end{equation} The only way to be able to estimate  $\delta_j$ is make assumptions not only about
  $\rho_j$, but also about which legislators are affected by the party shock. Snyder and Groseclose (Reference Snyder and Groseclose2000); Ansolabehere et al. (Reference Steven, Snyder and Stewart2001); Clinton et al. (Reference Clinton, Jackman and Rivers2004); Minozzi and Volden (Reference Minozzi and Volden2013), and countless others do this by putting in a dummy variable for belonging to the Democratic party.Footnote 10 Thus, across all of these methods, the estimate of
  $\delta_j$ that we are able to generate is just a net utility differential between parties. That is,
  $\delta_j$ reflects a utility shift that is the net difference in intercept between Democrats and Republicans. The reason for this is simple: while we know that party inducements occur on close votes, we have no further data to disentangle which votes Democrats and Republicans individually pressure members on. As a result, we have no way of knowing whether or not party pressure was asymmetric across parties or across members.
Indeed, a key problem with this approach is that it excludes the possibility of asymmetric party influence. That is,  $b_{ij}(x_i)$ could be different across parties (e.g., Lawrence et al., Reference Lawrence, Maltzman and Smith2006; Smith, Reference Smith2007). Going further, and central to the point of this paper, it could also be the case that
  $b_{ij}(x_i)$ is a legislator-level indication of party loyalty—independent of preferences—and not merely a uniform effect within party, i.e.,
  $b_{ij}(x_i)=\delta_i$.Footnote 11 Indeed, we might also have good reason to believe that legislators vary in their propensity to support the party line, irrespective of their preferences. These reasonable suggestions cannot be incorporated into any roll call model of party influence unless (a) we are able to identify which votes parties care about, (b) the votes one party cares about are not the same set as those the other cares about, and (c) we know the direction the party desires members to vote in.
Fortunately, these conditions can be met using a new data collection effort by Asmussen and Ramey (Reference Asmussen and Ramey2018). This data provides scholars with a unique opportunity to measure legislator-level party inducements across votes. For the 101st to 113th Congresses, Asmussen and Ramey (Reference Asmussen and Ramey2018) gather data on party leaders’ speeches on the floor of the House of Representatives and identify which votes the leaders express clear positions on. Obviously, one concern with using speeches is that they could be considered a form of costless “cheap talk” (e.g., Matthews, Reference Matthews1989); that is, if giving a floor speech is relatively costless, then why should members take seriously the leadership’s posturing? While a legitimate concern, it seems more likely that leaders’ speeches are a form of costly signaling instead. Sinclair (Reference Sinclair1983) observes that a leader’s floor speech “puts the imprimatur of the leadership upon the legislation; it indicates not only the leadership’s position but also its commitment” (p.49, emphasis added). Similarly, Green (Reference Green2010) notes that “floor advocacy may even signal that obtaining such benefits in the future will be contingent upon supporting the Speaker’s position” (p.31). The act of giving a speech endorsing or opposing a roll call voting position takes time from leaders’ busy schedules and makes a clear, public pronouncement of leaders’ wishes. Such talk is hardly cheap and party leaders would suffer greatly if they were to stake a claim in the legislation at hand only to be opposed by backbenchers and subsequently do nothing about it.Footnote 12
Important for our purposes, there is considerable variation with respect to whether only one party or both parties take positions across roll calls.Footnote 13 This variation in speeches provides us with the ability to pin down legislator-specific party loyalty estimates. Perhaps most important for our purposes, these speeches provide a direct, concrete measure of party influence. Leaders are taking their cases to the floor, making it clear in the text of the Congressional Record what they want their members to do.
To get an idea of how these votes with leader speeches differ from other commonly-used measures in the existing literature, Table 1 presents some important summary statistics. Party Leadership votes are votes in which each party’s leader and whip vote together against the other parties’ leader and whip (Cox and McCubbins, Reference Cox and McCubbins1991). Party Unity votes (the basis for Party Unity Scores) are votes in which at least 50% of Democrats vote against at least 50% of Republicans (Brady et al., Reference Brady, Cooper and Hurley1979). Close votes are those where the vote margin is less than 30% (Snyder and Groseclose, Reference Snyder and Groseclose2000). Party Agenda votes are roll calls in which the leader and whip of the party in question vote together and the leader and whip of the other party either vote together or are divided (Cox and McCubbins, Reference Cox and McCubbins1991). Last, Minozzi-Volden refers to votes identified by Minozzi and Volden (Reference Minozzi and Volden2013) as being the subject of party influence. Minozzi & Volden’s measure partitions roll calls into party-influenced and party-free sets using an iterated procedure. They begin using the Snyder and Groseclose (Reference Snyder and Groseclose2000) criteria (lopsided vs. not). Then, they estimate ideal points from lopsided votes and estimate party effects from close votes. Close votes for which the party dummy is statistically insignificant are reclassified as party-free. They then repeat this process several times until a convergence criterion is reached. For each metric, we present both the percent of votes that meet the metric’s criteria and then give a breakdown of vote type for roll calls meeting the same criteria. The vote types are Amendments, Final Passage votes, Final Passage (Suspension of the Rules), votes on Rules, and miscellaneous Other Procedural votes.
Table 1. Types of votes by party-influence metric

We see that, compared to all other metrics, leadership speeches are rather infrequent; Republican leaders only make speeches on about 4.7% of roll calls, and the Democratic leadership does so on only 5.9% of votes. Indeed, the other metrics include a much larger number of roll calls in the set of those in which we should be looking for party influence. When we examine the summaries by vote type, we see that—unlike other measures—leader speeches are much more common on final passage votes and, to a lesser extent, amendments. This makes intuitive sense; key amendments and final passage are places where party leaders should try to extract the loyalty of their members.Footnote 14 On the other hand, depending on the metric of choice, 25-29% of the other measures’ supposedly party-influenced votes come from the miscellaneous procedural category, and relatively few come from final passage votes. Prima facie, this does not seem quite right and suggests that the leader speeches are picking up more substantively meaningful notions of party pressure.Footnote 15
All of that said, one might still remain skeptical as to whether the leaders’ speeches adequately encapsulate the universe of vote-level party influence. Indeed, whereas other measures of party influence and party loyalty perhaps include too many votes on which party pressure is present, our metric may include too few. While we cannot easily dismiss this criticism, we can offer at least two defenses. First, if we are to accept the idea that party leaders use loyalty as a criterion for rewards—e.g., plum committee assignments, upward mobility in party ranks, etc.—then leaders using their own explicit, verbal instructions on which way they wish their rank-and-file to vote as a test of loyalty seems to be an innocuous assumption. To wit, since the Item Response Theory (henceforth IRT) model comes from educational testing, a classroom analogy can help to explicate. Suppose a classroom teacher wishes to assess the knowledge acquisition of his or her large class. The teacher could give a test every single day or they could do so once a month. While testing every day would give students leeway for a bad day and would likely produce a better estimate of the extent of their learning, such immense amounts of grading would be prohibitive for the teacher. The situation is much the same for party leaders. Keeping track of loyalty across hundreds of votes—which would be the case, if we are to believe the other metrics of loyalty—would be laborious and, moreover, leaders do not actually care about every vote. As such, it seems much more likely that leaders would use a smaller set of votes that they actually care about as their yardstick for loyalty.
Second, our contention here is not that party influence is absent save for leaders’ speeches. Cox and McCubbins (Reference Cox and McCubbins1993, Reference Cox and McCubbins2005), for one, present convincing evidence that a tremendous amount of party influence goes into agenda setting and in the design of rules so as to further the party brand and avoid contentious floor divisions. We do not dispute this point at all. Rather, we contend that, after considering all agenda and “behind-the-scenes” machinations of the party leadership, leaders’ floor speeches are one of the final places to look for evidence of direct party-influence in floor votes.
Incorporating these speech signals into the model above is straightforward. Let  $s_{ij}$ denote whether legislator
  $i$’s party gave a speech on roll call
  $j$. This variable can take three forms:
 \begin{equation}
s_{ij}=\begin{cases}
&-1 \quad \text{if the party prefers} \ \unicode{x201C} \text{nay}\unicode{x201D}, \\
&\mbox{ 0 } \quad\,\, \mbox{if the party does not take a position}, \\
&+1 \quad \text{if the party prefers} \ \unicode{x201C}\text{yea}\unicode{x201D}. \\
\end{cases}
\end{equation}
\begin{equation}
s_{ij}=\begin{cases}
&-1 \quad \text{if the party prefers} \ \unicode{x201C} \text{nay}\unicode{x201D}, \\
&\mbox{ 0 } \quad\,\, \mbox{if the party does not take a position}, \\
&+1 \quad \text{if the party prefers} \ \unicode{x201C}\text{yea}\unicode{x201D}. \\
\end{cases}
\end{equation}We can thus rewrite the probability of voting “yea” as
 \begin{equation}
\Pr(y_{ij}=1) = p_{ij} = \Phi\left(\beta_jx_i-\alpha_j+\delta_{i,t[j]} s_{ij}\right),
\end{equation}
\begin{equation}
\Pr(y_{ij}=1) = p_{ij} = \Phi\left(\beta_jx_i-\alpha_j+\delta_{i,t[j]} s_{ij}\right),
\end{equation} where  $\delta_{i,t[j]}$ is the party inducement parameter and
  $t[j]$ denotes the time period of roll call
  $j$. Note that we are allowing
  $\delta_{i,t[j]}$ to vary by both legislator and time. This captures the idea that legislators’ degrees of party loyalty might change according to temporal circumstances. Modeling the legislator’s vote choice in this way thus assumes that party effects are asymmetric across individuals (and, hence, parties), an assumption in keeping with the party effects literature (Lawrence et al., Reference Lawrence, Maltzman and Smith2006; Smith, Reference Smith2007). Moreover, we assume party effects are the same in magnitude (but reversed in direction) for both positive and negative speeches. This is made possible by the fact that the speech signals vary by both party and direction. On the vast majority of roll calls, neither party takes a position. When they do, it is rarely the case that both parties take positions on the same roll call. Given this variation, it will be possible to estimate
  $\delta_{i,t}$ for each legislator-time pair.
To better understand the role of  $\delta_{i,t}$ in this model, it is useful to slightly reparameterize Equation 8 as follows:
 \begin{equation}
p_{ij} = \Phi\left(\beta_j(x_i-c_j)+\delta_{i,t[j]} s_{ij}\right),
\end{equation}
\begin{equation}
p_{ij} = \Phi\left(\beta_j(x_i-c_j)+\delta_{i,t[j]} s_{ij}\right),
\end{equation} where  $c_j=\frac{\alpha_j}{\beta_j}$ is the cutpoint for roll call
  $j$. Examining this equation, if legislator
  $i$’s ideal point,
  $x_i$, is located at the cutpoint, we would normally expect the legislator to flip a coin in deciding which way to vote, as
  $\Phi(0)=0.5$. Seen this way, if
  $\delta_{i,t} \gt ( \lt ) 0$, he or she is more (less) likely to vote in the direction the party wishes. In short, when
  $\delta_{i,t}=0$, legislators vote purely according to their preferences and when
  $\delta_{i,t}\ne 0$ (and there is a speech by a party leader), legislators are induced to vote contrary to their preferences.
Yet another way to think about this model is to note that in the standard two-dimensional item response model, the probability of voting in the affirmative is given by
 \begin{equation}
p_{ij} = \Phi\left(\beta_{j,1}x_{i,1} + \beta_{j,2}x_{i,2} -\alpha_j\right),
\end{equation}
\begin{equation}
p_{ij} = \Phi\left(\beta_{j,1}x_{i,1} + \beta_{j,2}x_{i,2} -\alpha_j\right),
\end{equation} where  $x_{i,d}$ and
  $\beta_{j,d}$ are the legislator ideal points and item discrimination parameters on dimension
  $d$, respectively. This model is typically identified by constraining one vote to have zero discrimination on the first dimension and another to have zero discrimination on the second dimension (Jackman, Reference Jackman2001). We readily note that this equation resembles Equation 8. Specifically, we can view
  $\delta_{i,t}$ as a pseudo-preference parameter on a dimension that is (potentially) orthogonal to the principal ideological one captured by
  $x_i$.Footnote 16 This dimension is only activated when a leader makes a speech (i.e.,
  $s_{ij} \ne 0$). The speeches then act as a fixed discrimination parameter (for identification purposes)—that is, we assume that the discrimination of this loyalty dimension is zero when speeches are absent but is exactly equal to +1 or -1 according to the direction of voting desired by the party leadership.Footnote 17
It is also worth noting that we do not constrain the direction of  $\delta_{i,t}$. That is, we do not assume that party inducements must be strictly nonnegative for all members. At first glance, this might appear odd. Indeed, both Snyder and Groseclose (Reference Snyder and Groseclose2000) and Minozzi and Volden (Reference Minozzi and Volden2013) motivate their models of party influence from the idea of vote buying. That is, party leaders exert influence by “buying” the votes of waffling copartisans. Why would party leaders attempt to buy votes only to be openly rebuked? Though this seems strange, it is perfectly conceivable that knowing the party really cares about a vote could lead some legislators to take public stands in opposition, even when their preferences would dictate otherwise. This idea is consistent with recent work by Kirkland and Slapin (Reference Kirkland and Slapin2017); they argue that moderates and extremists may strategically defect depending on whether their party is in the majority as well as their own electoral circumstances. The logic is fairly simple; legislators may derive either expressive or electoral (i.e., non-policy) benefits by “declaring their independence” from party leaders. In the context of our model, a value of
  $\delta_{i,t} \lt 0$ would be indicative of such systematic, strategic defections across votes that leaders care about.Footnote 18
3. Results: party loyalty in the 101st–113th Congresses
We derive a statistical estimator of the model described above in the Online Appendix. This model is essentially a modification of the Clinton et al. (Reference Clinton, Jackman and Rivers2004) Bayesian IRT ideal point model, allowing for estimates of both legislators’ ideal points (assumed to be fixed over time), as well as their party loyalty parameters (allowed to vary).Footnote 19 In what follows, we refer to the party effect parameters,  $\delta_{i,t}$, as IRT Party Loyalty.
Since most other measures of party loyalty are measured on a 0-100 scale, we make a simple transformation to make our estimates comparable. Recall that, for a legislator spatially indifferent between yea and nay, the probability of voting yea is given by
 \begin{equation}
p_{ij} = \Phi\left(\delta_{i,t[j]} s_{ij}\right).
\end{equation}
\begin{equation}
p_{ij} = \Phi\left(\delta_{i,t[j]} s_{ij}\right).
\end{equation} Given this, we can apply the standard normal cdf  $\Phi(\cdot)$ to our estimates and multiply the resulting probability by 100. This both transforms our estimates to the same interval as existing scales and shifts the neutral loyalty reference point from 0 to 50. That is, legislators whose IRT loyalty scores are significantly greater than 50 are loyalists—that is, party nudging via speeches makes them more likely to vote with the party; similarly, those with scores significantly less than 50 are rebels—that is, leadership pressure pushes them to vote against the party position.
3.1. The rise of rebellion in republican ranks
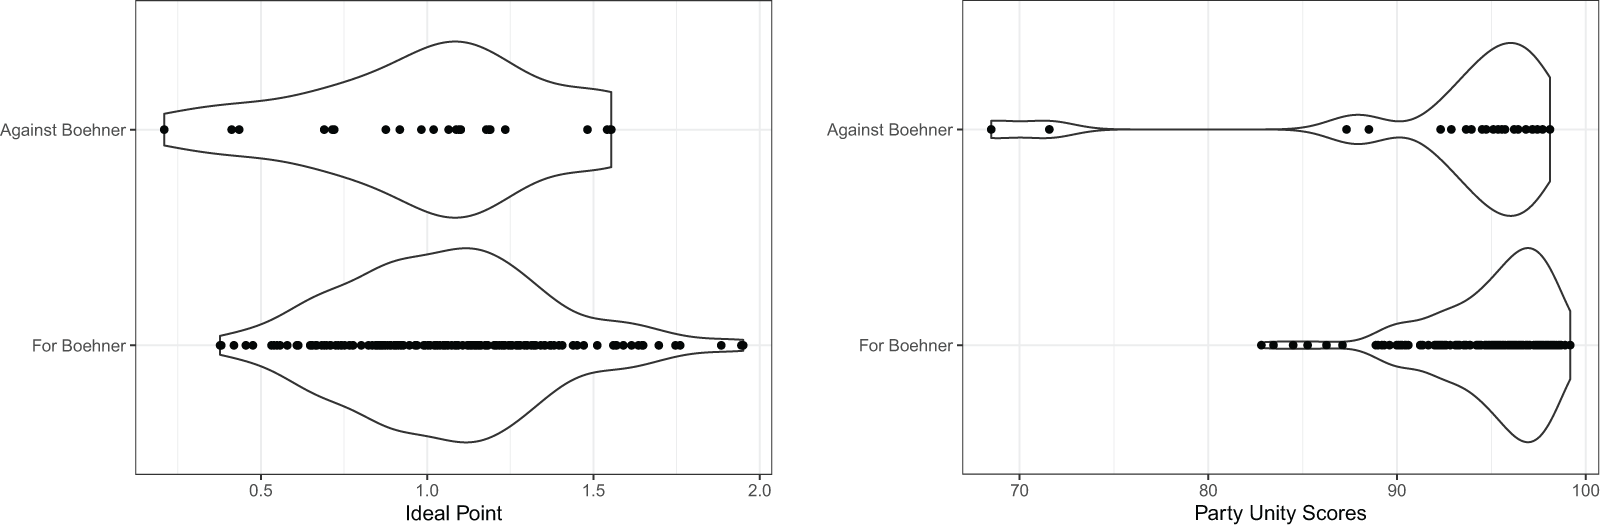
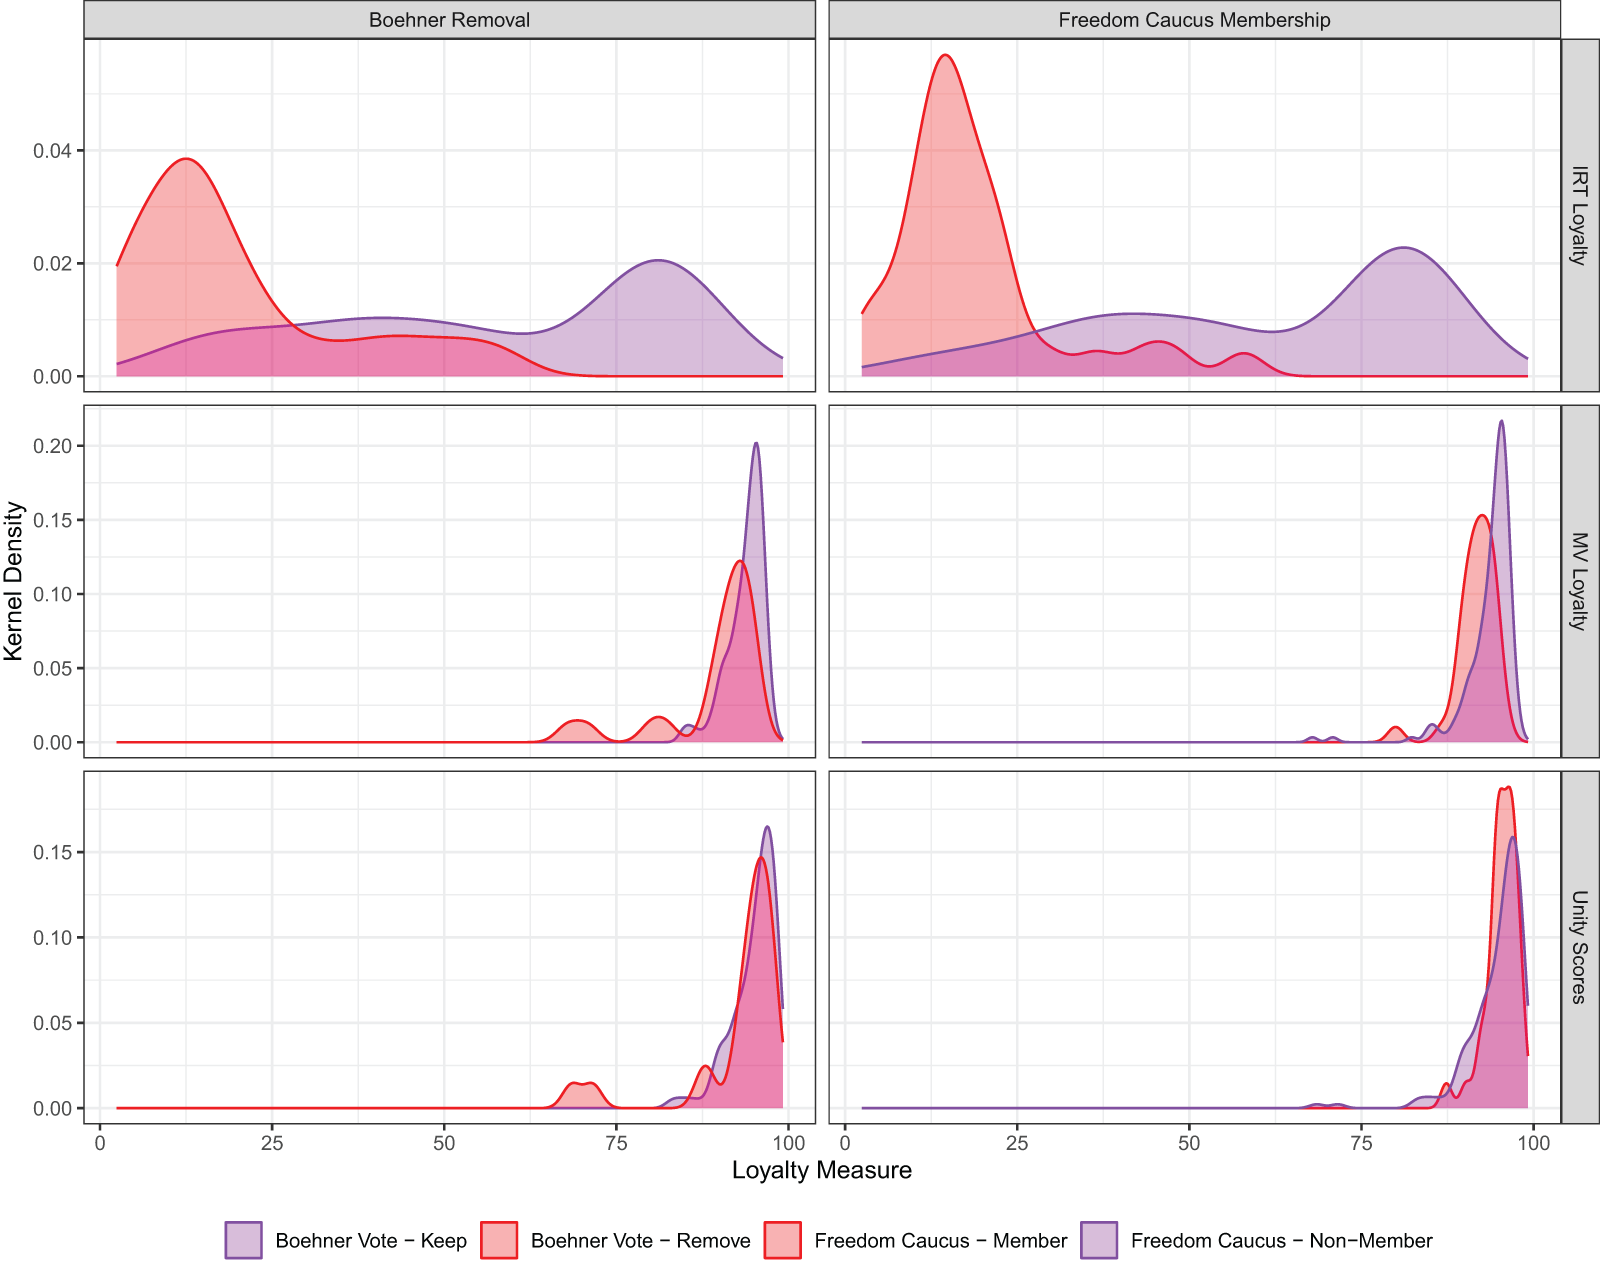
We began this paper examining the rise of rebelliousness in Republican ranks in early 2015. We saw that Party Unity Scores failed to discriminate between Boehner loyalists and defectors. Using our IRT Loyalty Scores, we can revisit this puzzle. For completeness, we also include Minozzi & Volden’s (Reference Minozzi and Volden2013) preference-adjusted Loyalty Scores in our comparisons. Party Unity Scores are measured as described previously. Minozzi & Volden calculate loyalty scores as a percentage of the time legislators vote with a majority of their party on votes that their iterative procedure identifies as being party-influenced. Figure 2 provides kernel density estimates of IRT Loyalty Scores, MV Loyalty Scores, and Party Unity Scores.Footnote 20 Each subfigure is shaded according to legislators’ behavior—that is, rebelling or staying loyal to Boehner and joining or not joining the Freedom Caucus. Visually, it is clear that our IRT Loyalty Scores clearly separate out rebels and loyalists. Both Party Unity Scores and Minozzi & Volden’s loyalty scores are unable to do so.Footnote 21

Figure 2. Who joined the Freedom Caucus? Who rebelled against Boehner?
We build off of these insights by running a series of logistic regressions predicting rebellious behavior. The binary dependent variables are joining the Freedom Caucus and rebelling against Boehner. We run regressions controlling for legislators’ ideal points, as well as loyalty measured using our method as well as both Party Unity Scores and MV Loyalty Scores. The results are reported in Table 2. Our IRT Loyalty Scores are statistically significant and negative in sign for both the Freedom Caucus and Boehner rebellion models, even after controlling for legislators’ ideal points. This relationship makes sense—loyalists are more likely to be loyal, and rebels are more likely to rebel! For Party Unity Scores, the results are muddled, at best. Party unity does not predict joining the Freedom Caucus. While party unity does seem to have mild predictive power in the Boehner rebellion vote, this is largely due to the two outliers identified at the beginning of this article. On the other hand, while the coefficient on MV Loyalty Scores is statistically significant for both outcomes, it is less precisely estimated than our IRT Loyalty Scores.
Table 2. Logit models predicting Freedom Caucus membership and Boehner rebellion

Note: Cell entries are logit coefficients.  $^*p \lt 0.05$
These distinctions are even clearer when we examine model fit. Specifically, which model more accurately fits the data? We see that for both the Freedom Caucus and Boehner rebellion models, the AIC, BIC, and Deviance are all much lower, and the Log-Likelihood is much higher for models using IRT Loyalty than those using Party Unity Scores or MV Loyalty Scores. In terms of outcomes, Party Unity Scores predict that no legislators would join the Freedom Caucus and two legislators would rebel against Boehner. Similarly, MV Loyalty Scores predict that only three would join the Freedom Caucus, and four would rebel against Boehner. In contrast, our IRT loyalty estimates predict 31 would join the Freedom Caucus, and 9 members would rebel against Boehner, both of which are much closer to the actual outcomes. In short, it would appear that the methodological problems with Party Unity Scores identified previously yield problematic inferences and that, as expected, Republican rebels are just that.
3.2. Contrasting measures of party loyalty
Given the differences in estimates above, we might wonder how our estimates differ from the others considered more generally. Figure 3 is a scatterplot matrix that includes Party Unity Scores, Minozzi-Volden (MV) Loyalty Scores, the IRT Loyalty Scores from this paper, and—for comparative purposes—ideological extremism (the absolute value of a legislator’s ideal point). For simplicity, these are pooled over all the years in question.Footnote 22 This figure demonstrates some of the key problems with existing metrics and some of the virtues of our approach. We see that Party Unity Scores and MV Loyalty Scores are almost perfect regurgitations of legislators’ ideal points—moderates in both parties are the least loyal and extremists are the most. This either suggests that ideology and loyalty are one-in-the-same or that there is something fundamentally wrong with both Party Unity Scores and MV Loyalty Scores.

Figure 3. Comparing party loyalty across methods.
If we examine the IRT Loyalty estimates, we see a much different relationship. Unlike the other two approaches, our loyalty estimates do not correlate at all with ideological extremism. While the IRT estimates correlate very modestly with the other metrics, there are clear divergences. Specifically, we can see that both Party Unity Scores and MV Loyalty Scores both classify some legislators as fiercely loyal that our model classifies as the most rebellious. To explore this discrepancy further, Figure 4 combines the observations from the previous figure to gain insight into when the models differ. In this plot, we compute each legislator’s within-party loyalty rank using our IRT method and subtract this from their loyalty rank using Party Unity Scores.Footnote 23 This time, we disaggregate the plot by Congress. We see a clear and consistent pattern—Party Unity Scores and MV Loyalty Scores are severely understating the party loyalty of moderates and overstating the loyalty of extremists vis-à-vis the IRT model.

Figure 4. Comparing intra-party loyalty ranks across the two methods, 101st–113th Congresses.
While these differences do not ensure that our method is “right,” they do suggest that our approach is picking up something more than just ideology. That said, our results seem to be more consistent with the spirit of the literature on voting in Congress. Other prominent work estimating the influence of party on roll call voting (e.g., Snyder and Groseclose, Reference Snyder and Groseclose2000; McCarty et al., Reference Nolan, Poole and Rosenthal2001) assumes that, if present, party influence will come in the form of a shifted cutpoint such that ideological moderates are more likely to vote with their party leadership than they otherwise would be. Our estimates demonstrate that ideological moderates are indeed more loyal than either Party Unity Scores or MV Loyalty Scores would lead us to believe. In sum, the findings of Figure 4 demonstrate fairly clearly that our estimates are more consonant with the arguments of this literature.
3.3. Digging deeper
Having examined the face validity of our measures and compared them with existing alternatives, it is useful to examine whether or not the added model complexity improves model fit over existing baselines. To that end, we calculate a number of model fit statistics for our model. These fit statistics are widely used in the ideal point estimation literature. They are the percent of decisions correctly classified, the model Log-Likelihood, the Akaike Information Criterion (AIC), the Geometric Mean Probability (GMP), and the Aggregate Proportion Reduction in Error (APRE). For comparison, we fit the standard IRT model using the EM approach introduced by Imai et al. (Reference Imai, James and Olmsted2016). The Log-Likelihood, percent correctly predicted, GMP, and APRE are higher for the model introduced in this paper; the AIC is substantially smaller. The ideal points across both methods correlate quite highly; the overall correlation is 0.99, and within-party correlations are 0.978 for Democrats and 0.967 for Republicans. Since our ideal point estimates are “party-free,” this would suggest that there are little ideological differences in party-influenced and party-free votes. This finding is surely at odds with Snyder and Groseclose (Reference Snyder and Groseclose2001); they find ideal points from party-induced roll calls are substantially different from those estimated from lopsided votes.Footnote 24
Though the ideal point estimates themselves correlated quite highly, they are not the primary interest of this paper. Rather, since our goal is to estimate party loyalty effects, a key question is whether the model complexity actually improves the classification of legislator decisions. To make this point clearer, Table 3 identifies some of the roll calls for which this model produces substantially increased numbers of correct predictions. As we see in the table, some of the most contentious votes from the last two-and-a-half decades are present in the list, including the General Agreement on Tariffs and Trade (GATT), the Homeland Security Act, the Omnibus Budget Reconciliation Act of 1990, and the reauthorization of the Export-Import Bank. Additionally, two votes that sought to invoke Section 5(c) of the War Powers Resolution to remove U.S. troops from Libya and Afghanistan are present. In all of these cases, the number of improved classifications over the standard IRT model is large. In some cases, the number of correct classifications was close to the actual vote margin. For example, in the Omnibus Budget Reconciliation Act of 1990, wherein President George H.W. Bush violated his “no new taxes” pledge, the actual vote margin was 227-203, a difference of 24 votes. In our model, we correctly classify exactly this many more votes than the baseline case. Additionally, all but one of these were designated a CQ “key vote,” giving further credence to the idea that leader speeches are more likely to occur on “significant” votes.Footnote 25
Table 3. Sample votes and improvements in classification

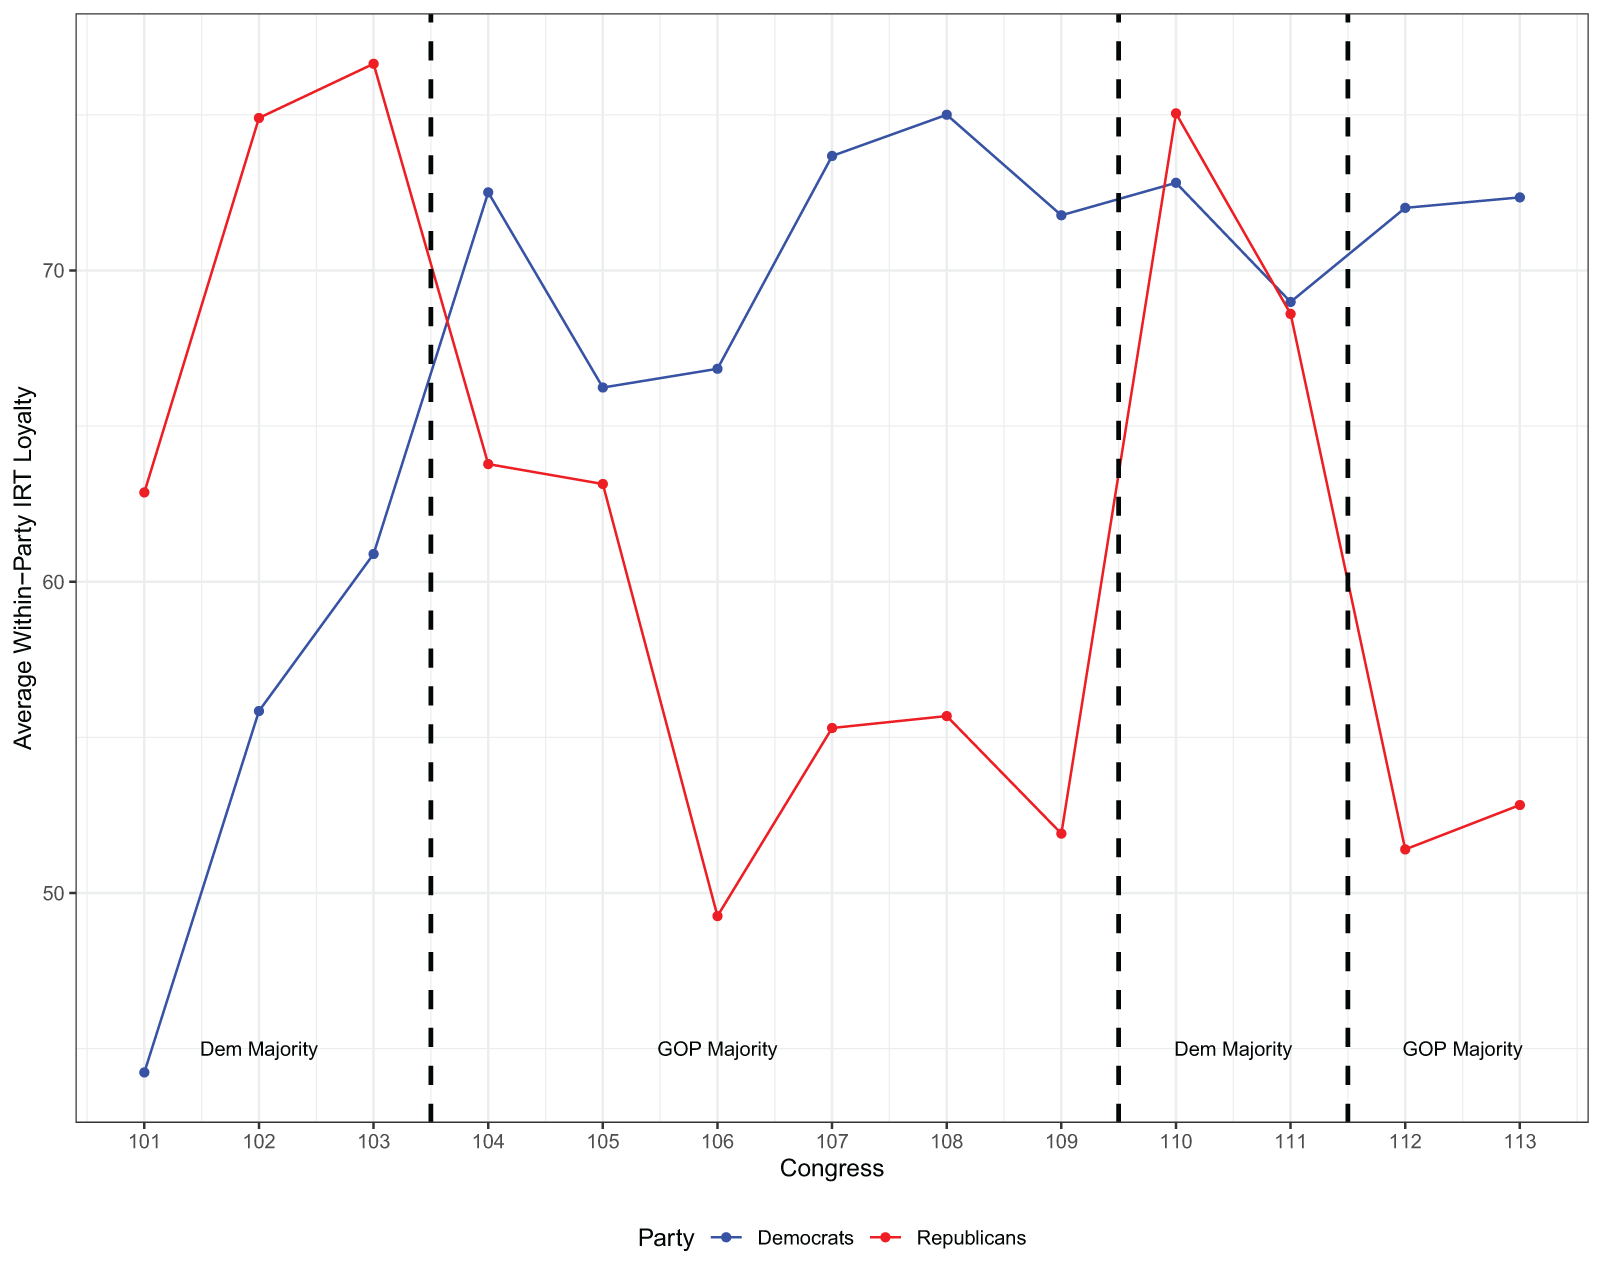
While we have focused mostly on macro-level behavior, we might be interested in how underlying loyalty dynamics vary across parties and members over time. We investigate both of these in turn. To evaluate cross-party dynamics, we compute the average IRT Loyalty Scores within-party by Congress; these are shown in Figure 5. A few clear trends are obvious from this figure. First, Democrats have a higher average level of loyalty than Republicans do for most years in our data. Second, and perhaps most interesting, there is a clear relationship between party control and loyalty for both parties. When in the majority, both parties have higher average loyalty compared to when they are in the minority, though this relationship is stronger for Republicans.

Figure 5. IRT loyalty variation by party, 101st–113th Congresses.
Why might this be the case? To investigate this, Figure 6 shows the relationship between legislator ideal point and IRT Loyalty, disaggregated by whether or not the member is in the majority party. For both parties, there is an inverted-U shape relationship between preferences and loyalty when in the majority. In plain English, legislators close to the party mean are more loyal than either ideological moderates or extremists (though extremists of both parties appear much less loyal than moderates). When in the minority, however, critical differences emerge. For Republicans in the minority, there is little-to-no relationship between ideology and party loyalty. For Democrats, only the most conservative caucus members show lower levels of loyalty than either their most liberal counterparts or those close to the party mean.

Figure 6. IRT loyalty scores by partisan control.
When zooming in on the individual level, we can see that these trends exist despite tremendous member-level heterogeneity. We can see this play out in Figure 7, showing the evolution of IRT Loyalty Scores for some select, long-serving members. Representatives Sander Levin (D-MI) and Chris Smith (R-NJ) show little variation over time, though Levin is usually much more of a loyalist than Smith. On the other hand, Representatives Ron Paul (R-TX) and Maxine Waters (D-CA) show dramatic swings in their loyalty. When in the minority party, both have significantly higher loyalty estimates than when they are in the majority.

Figure 7. Individual member loyalty over time.
Finally, is worth considering for a moment the possibility that our IRT Loyalty Scores could be merely an artifact of voting with party leaders. Specifically, while we are using leaders’ actual floor speeches as the basis upon which to measure members’ loyalty, there is a concern that we could replace these speech votes with members’ voting with the party leadership on any subset of votes. We deal with this possibility by conducting a simple placebo test. We describe this test in some detail in the online appendix. The essential idea is straightforward—create a series of synthetic “speeches” by randomly sampling roll calls, treat party leaders’ positions on the sampled votes as speech signals, and estimate the IRT loyalty model on this synthetic dataset. If our estimates are just reproducing voting with party leadership, then we should observe little-to-no difference between the leader speech-based estimates and the synthetic ones. Comparing the two results,Footnote 26 there is no doubt that our leader’s speeches are distinct.
4. Discussion
In this paper, we presented a method for measuring legislator preferences and party loyalty using roll call data. Unlike previous attempts, our approach allows for a cleaner separation of ideal points and party loyalty. Moreover, since our data on leader speeches allows us to separately pin down the wishes of each major party’s leadership, we are able to generate legislator-specific party loyalty parameters. The findings of the paper are clear. First, party loyalty does have a substantial impact on our ability to model and predict the way legislators vote. Our models estimates show strong improvements in the standard empirical spatial model’s predictions for legislative voting on some of the most prominent legislation in the last 25 years. Moreover, our approach has provided a valuable tool for understanding the rising rebellion among Congressional Republicans in the last several years. Second, using our approach, we have put into doubt key findings on the relationship between ideological extremism and party loyalty. These findings make intuitive sense and are perfectly consistent with standard accounts of party pressure in the literature on Congress.
Going further, our measures of party-free ideal points and independent party loyalty will be of great use to scholars of American politics. Indeed, empirical investigation of spatial theories of lawmaking almost always requires measures of legislators’ preferences. Since standard ideal point estimation approaches do not appropriately disentangle preferences from party loyalty, most existing research using ideal points generally sidesteps the issue entirely, goes through endless epistemological hoops to argue that party effects are not present, or attempts to separate party effects using fairly ad-hoc assumptions about when parties matter. Our ideal point measures are truly party-free, and our loyalty estimates are indeed measures of loyalty, as they are developed using data in which leaders explicitly communicate to their caucuses that they care about the votes in question.
Over three decades ago, Krehbiel (Reference Krehbiel1993) asked Where’s the Party? In that paper and a host of others, he challenged scholars to disentangle the commingling of preferences and party effects and to then show that party has an effect on outcomes independent of preferences. In this article, we have done just that. Moreover, we have shown that party loyalty really does matter and strongly predicts legislative behavior on high-profile issues facing the nation. While our results do seem to vindicate party scholars who have long argued that party effects are present in roll call voting, our findings place an important asterisk on the role of party influence. Whereas most scholars have argued that, if present, party effects will be positive inducements on behavior—that is, they would make legislators more likely to tow the party line—our findings suggest that, for some legislators, the inducements are negative. That is, upon hearing that their party cares about a roll call, some Congressmembers vote against the party position even though their preferences would dictate otherwise. It would seem legislators derive immense personal utility from bucking the party line and declaring their independence (see Kirkland and Slapin, Reference Kirkland and Slapin2017, Reference Kirkland and Slapin2018). This sort of self-sacrifice might seem bizarre and counterintuitive, but in the increasingly polarized world in which we find ourselves, it is far from extraordinary. Indeed, when party leaders offer their members an opportunity to move the status quo marginally closer—but perhaps not close enough—to their ideal point, some legislators appear more content throwing themselves atop a Congressional funeral pyre instead.
Supplementary material
The supplementary material for this article can be found at https://doi.org/10.1017/psrm.2025.10083. To obtain replication material for this article, please visit https://doi.org/10.7910/DVN/JXVSP4.
Acknowledgements
I thank Gary Hollibaugh, Lawrence Rothenberg, Adam Dynes, Justin Kirkland, Jonathan Slapin, Jonathan Klingler, Andy Harris, and Cole Tinagawa for helpful comments. All remaining errors are my own.


 Open access