

Over 44 million individuals living in the community in the U.S. reported having a disability in 2023, representing 13.5 percent of the total noninstitutionalized civilian population (Thomas et al. Reference Thomas, Paul, Bach and Houtenville2024). People with disabilities are more likely to experience financial insecurity than those without disabilities, as they are less likely to have checking and savings accounts, positive credit ratings, and financial assets, including retirement, real estate, and stocks and bonds (McDonald et al. Reference McDonald, Conroy, Morris and Jennings2015; Maroto and Pettinicchio Reference Maroto and Pettinicchio2020; Morris et al. Reference Morris, McGarity, Goodman and Zaidi2022). A recent report by Financial Health Network found that only 10 percent of working-age individuals with disabilities are financially healthy compared with 30 percent of working-age persons without disabilities (Warren et al. Reference Warren, Wanjira, Greene and Berdie2023). This means that the majority (90 percent) of people with disabilities face financial barriers to spending, saving, borrowing, and planning for the future without proper access to financial services and products.
Financial insecurity of people with disabilities can be exacerbated by the additional costs associated with living with disabilities, including medical care, assistive technologies, and caregiving services (Mitra et al. Reference Mitra, Palmer, Kim, Mont and Groce2017; Morris et al. Reference Morris, McGarity, Goodman and Zaidi2022). Furthermore, the inability to save and accumulate assets disrupts long-term financial well-being and exposes this population to greater risks during economic downturns (Parish et al. Reference Parish, Grinstein-Weiss, Yeo, Rose and Rimmerman2010; Maroto and Pettinicchio Reference Maroto and Pettinicchio2020; Friedman Reference Friedman2022).
People with severe disabilities with limited incomes who receive means-tested benefits may experience even deeper financial insecurity due to structural financial barriers embedded in social programs. For instance, recipients of Supplemental Security Income (SSI) from the Social Security Administration (SSA) must keep their asset levels below $2,000 for individuals and $3,000 for couples to maintain eligibility for SSI benefits and access to Medicaid. Although certain resources – such as the home in which the recipient lives or one household vehicle – are excluded from these limits, the thresholds are not indexed to inflation and have remained unchanged since 1989. Despite legislative efforts to raise the SSI asset limits (e.g., the SSI Savings Penalty Elimination Act of 2023), SSI recipients continue to face material hardship, including difficulty paying for extra health expenses (She and Livermore Reference She and Livermore2007; Savin Reference Savin2021; Whittle et al. Reference Whittle, Palar, Ranadive, Turan, Kushel and Weiser2017). In addition, because low asset limits create a disincentive to save (Leydorf and Kaplan Reference Leydorf and Kaplan2001), 28 percent of SSI recipients were unbanked in 2009 (i.e., having no checking or savings accounts), compared with only six percent of the general population (Anderson et al. Reference Anderson, Strand and Collins2018).
1. Options to save for people with disabilities: ABLE accounts
To help smooth income fluctuations and extraordinary healthcare expenses for people with disabilities, Congress passed the Stephen Beck, Jr., Achieving a Better Life Experience (ABLE) Act in 2014, providing a way to save for disability-related expenses through tax-free savings accounts. ABLE accounts can be particularly helpful for SSI recipients because the funds deposited do not count toward the asset limit set by program rules, allowing account holders to build savings without risking the loss of SSI benefits. Account holders who receive SSI benefits may save up to $100,000 in an ABLE account, with contributions allowed from anyone (up to the IRS annual gift tax exclusion, which is $19,000 in 2025).Footnote 1 Funds in ABLE accounts can be used for a wide range of disability-related expenses, including assistive technology, vehicle modifications, housing, food, education, and healthcare. Compared to establishing a trust for individuals with disabilities, ABLE accounts are relatively inexpensive to set up, and the account holders retain control over their own finances (Germany Reference Germany2018).
However, currently only 3 percent of eligible individuals with disabilities own ABLE accounts (Ellis et al. Reference Ellis, Ulisky and Schaller2024), and the participation rate is even lower for SSI recipients – 1.1 percent as of 2021 (Weathers et al. Reference Weathers, Kelly and Hemmeter2024). Beginning in January 2026, more people with disabilities, including SSI recipients, will be able to access ABLE accounts as the disability onset age threshold increases from age 26 to age 46, expanding opportunities to save for a larger population of individuals with disabilities. Given this expansion, it becomes an important policy question to examine the potential savings and financial capacity of eligible individuals with disabilities, including SSI recipients, who may benefit from the broadened ABLE eligibility criteria.
Despite this policy’s importance, little is known about the use and impact of ABLE accounts among SSI recipients, partly due to the lack of nationally representative public data and differences in administration mechanisms across states. However, existing evidence suggests the need for further investigation. Using the SSA administrative records, Weathers, Kelly, and Hemmeter (Reference Weathers, Kelly and Hemmeter2024) found that the participation rate among SSI recipients was only 1.1 percent in 2021, and the participation varied substantially across sociodemographic groups and state-level characteristics. Specifically, racial and ethnic minority SSI recipients – including Black, Hispanic, and Native American individuals – were less likely to have ABLE accounts than White SSI recipients. In addition, individuals with limited English proficiency had a lower likelihood of owning an ABLE account compared to those whose preferred language is English.
Limited participation in ABLE accounts may be due to limited awareness of the program. A recent Financial Health Network survey found that 93 percent of respondents were not familiar with ABLE accounts (Warren et al. Reference Warren, Wanjira, Greene and Berdie2023). In an experimental study using survey data from low-income tax filers, Roll et al. (Reference Roll, Ferris, Bufe and Kondratjeva2024) found that the structure of savings accounts may affect the willingness to save; specifically, annual fees can reduce the likelihood of using savings vehicles like ABLE accounts. Similarly, using administrative and survey data, Briscese, Levere, and Pollack (Reference Briscese, Levere and Pollack2024) found that high-income earners are more likely to own ABLE accounts than low-income individuals, highlighting income-related financial constraints that limit participation in ABLE accounts.
As previous studies provide limited understanding of the savings and financial capacity of SSI recipients who are newly eligible for ABLE accounts, this study aims to examine access to savings and financial assets among people with disabilities – particularly SSI recipients – and how savings and financial access vary by different disability onset age: prior to age 26 (currently eligible), ages 26 through 45 (soon-to-be eligible), and age 46 and over (ineligible). Individuals whose disability began before age 26 may differ from those whose disability began between the ages of 26 and 45. For example, those with older disability onset ages may have longer work histories and therefore greater savings capacity, which can influence the decision to open an ABLE account. Furthermore, as suggested by Briscese, Levere, and Pollack (Reference Briscese, Levere and Pollack2024), financial access (or constraints) can be an important factor associated with having ABLE accounts. Thus, this study seeks to identify differences in access to savings and levels of financial assets among people with disabilities, including SSI recipients, with particular attention to individuals whose disability began between ages 26 and 45 – the soon-to-be eligible ABLE account holders. While having any savings accounts or amount of financial assets does not directly indicate ABLE account ownership, these measures reflect attachment to financial institutions, which in turn may affect access to ABLE accounts as a type of savings account. Therefore, the goal of this study is not to assess the direct relationship between disability status (or SSI receipt) and ABLE access. Rather, it is to explore differences in savings patterns and financial assets among people with disabilities and SSI recipients by disability onset ages, which may provide insight into their potential financial capacity to open ABLE accounts once eligibility expands.
The findings can inform potential savings and financial constraints that people with disabilities, including SSI recipients, may experience, which can affect participation in ABLE accounts. More importantly, the findings can help improve the understanding of the life-course savings behavior of SSI recipients, who are incentivized to keep their savings under $2,000 for individuals and $3,000 for couples to maintain eligibility for social security benefits.
In the following sections, I provide a summary of the data sources and analytic models in the second section and present the descriptive statistics and regression results in the third section. The fourth section discusses the findings and concludes.
2. Methodology
2.1. Data
This study uses pooled panels of the 2014–2017 Survey of Income and Program Participation (SIPP) merged with the 2014 SSA Supplement. The SIPP is a nationally representative household survey collected by the U.S. Census Bureau that provides broad information on income dynamics, government program participation, employment, household composition, economic well-being, and health care. Disability onset age information comes from the 2014 Supplement, in which respondents from the 2014 SIPP were surveyed additionally to collect data on disability status, personal retirement accounts, pension and retirement plans, and self-reported health status. The 2014 SSA Supplement is the only publicly available survey data that contains disability onset age information. The Supplement asks respondents to report three types of disability onset ages: (i) “age that the main health condition started to bother,” (ii) “age that the main condition started to limit the work ability,” and (iii) “age that the main condition started to prevent from working.”
As this study utilizes individual-level observations across all waves of the 2014–2017 SIPP data, the longitudinal weight (FINPNL4) is applied, as recommended by the U.S. Census Bureau (U.S. Census Bureau 2019).
The final merged 2014–2017 SIPP and 2014 SSA Supplement contain 214,813 individual-year observations, including non-missing values of the focal variables. When this study focuses on exploring the savings and financial capacity of people with disabilities – particularly SSI recipients – the sample is restricted to people with disabilities only. These include respondents who report at least one of six core disability measures – hearing, seeing, cognitive, ambulatory, self-care, and independent living. Individuals with SSI benefits who report no disability in the sample (n = 1394) are excluded from this sample. This restricted sample of pooled 2014–2017 SIPP and 2014 SSA Supplement includes 44,313 individual-year observations with non-missing values for the focal variables.
2.2. Measures
2.2.1. Outcome variables
Savings capacity in this study is measured by having any savings accounts (EOWN_SAV), which include joint and individual savings accounts, savings in bank accounts, educational funds, and others. For jointly-owned savings accounts in the 2014–2017 SIPP data, the question is asked of only one spouse or partner, and the reported amount is divided by two and then copied to both spouses’ or partners’ records (U.S. Census Bureau 2018).
For an alternative outcome variable, this study uses the amount of assets held at financial institutions to measure financial capacity, which may also influence access to ABLE accounts. Financial assets include those in checking accounts, savings accounts, and money market or mutual funds (TVAL_BANK). All asset values are inflation-adjusted to 2017 dollars using the Consumer Price Index (CPI) and are inverse hyperbolic sine (IHS)-transformed due to the highly right-skewed distribution and the large number of zero values. The IHS transformation is widely recommended in financial and wealth data analyses to mitigate skewness and heteroskedasticity, making regression estimates more reliable (Pence Reference Pence2006; Bellemare and Wichman Reference Bellemare and Wichman2020). This study uses the Stata command, asinh, to perform the IHS transformation.
2.2.2. Key indicator
Onset ages. This study utilizes three onset-age variables from the SSA Supplement for respondents aged 18 or older who reported a health condition or a main condition that began after birth and were asked to report the age at onset. The health conditions in the Supplement refer to issues the respondent considers to be the main reason for difficulties, fair or poor health, or work limitations. The three onset-age measures include bothering, work-limiting, and work-preventing ages. Of these measures, this study reports the main findings using work-limiting age because, when SSA determines disability onset age for its disability programs, the claimant’s work history affected by the onset of disability is one of the factors used to determine the “established onset date (Social Security Administration 2024b).” For SSI recipients who plan to open ABLE accounts, whether the established onset date is before age 26 (in the current threshold) determines ABLE eligibility. Therefore, this study uses work-limiting age as a primary indicator for the established onset date, broadly capturing the eligible ABLE population among SSI recipients. Work-preventing age serves as a conservative supplemental proxy, and bothering age is also used as an additional measure.
To compare the characteristics of potential new ABLE users, this study groups onset ages into three categories: before age 26, ages 26 through 45, and age 46 and older, with particular focus on the second age group. Results using alternate onset-age measures (bothering and work-preventing) are qualitatively similar to the main findings and are available upon request.
SSI receipt. SSI recipients are identified as respondents aged 18 or over who reported receiving SSI benefits for blindness and/or disability for at least one month during the reference period. Note that qualifying disability eligibility for SSI benefits is not the same as the six core disability measures used for this study sample.
2.2.3. Other sociodemographic characteristics
The individual-level covariates include age, gender, race/ethnicity, education, marital status, and current employment status. Age is measured as the respondent’s age at their last birthday. For gender, individuals are coded as 1 if they identify as female (0 otherwise). Race/ethnicity categories include non-Hispanic White (reference), non-Hispanic Black, non-Hispanic Asian, non-Hispanic other, and Hispanic. Education is coded as 1 if the individual has a high school degree or higher (0 otherwise). Marital status is coded as 1 if the individual is married at the time of the interview. Employment status reflects whether the respondent reports currently working at the time of the interview, including both full- and part-time work. At the household level, this study includes poverty status, whether the household has children under the age of five, and the number of household members. Poverty status is based on the household income-to-poverty ratio in the SIPP; households with a ratio below 1 – meaning income is less than 100 percent of the official poverty measure (OPM) thresholds for that household size – are coded as being in poverty (1), and 0 otherwise.
2.3. Estimation strategy
To identify the characteristics of savings and financial capacity among people with disabilities, this study first models (1) having any savings accounts using a logistic regression and (2) the amount of assets held in financial institutions using an OLS regression, applying the same set of demographic and socioeconomic characteristics in both models. Then, in analyzing differential savings and financial capacity among SSI recipients by disability onset age, this study adds an interaction term between SSI receipt status and onset-age categories. The following equation describes the full specification of the logistic and OLS regression approaches with the interaction term:
 \begin{align} FinancialCapacit{y_{ist}} = & \alpha + {\rm{\;}}{\beta _1}{X_{it}} + {\beta _2}SS{I_{it}} + {\beta _3}OnsetAgeCa{t_i} + {\beta _4}SS{I_{it}}{\,\rm{*\,}}OnsetAgeCa{t_i} \\ &+ {\mu _t} + {\gamma _s} + {\varepsilon _{ist}} \end{align}
As explained in the previous section, the outcome variables for $FinancialCapacit{y_{ist}}$
include having any savings accounts (binary) and the value of assets at financial institutions (continuous) for individual
$FinancialCapacit{y_{ist}}$
include having any savings accounts (binary) and the value of assets at financial institutions (continuous) for individual $i$
living in state
$i$
living in state $s$
in year
$s$
in year $t$
. The vector of the socioeconomic characteristics is included in
$t$
. The vector of the socioeconomic characteristics is included in ${X_{it}}$
. The SSI receipt status of individual
${X_{it}}$
. The SSI receipt status of individual $i$
is measured by
$i$
is measured by $SS{I_{it}}$
, which equals 1 if the individual received SSI benefits for blindness or disability at least one month during the previous year.
$SS{I_{it}}$
, which equals 1 if the individual received SSI benefits for blindness or disability at least one month during the previous year. $OnsetAgeCa{t_i}$
represents the three disability onset-age categories (before age 26 as the reference), with work-limiting disability onset ages used for the main results. Lastly, the model includes year (
$OnsetAgeCa{t_i}$
represents the three disability onset-age categories (before age 26 as the reference), with work-limiting disability onset ages used for the main results. Lastly, the model includes year ( ${\mu _t}$
) and state (
${\mu _t}$
) and state ( ${\gamma _s}$
) dummies to control for time- and state-specific economic conditions, as well as an idiosyncratic error term (
${\gamma _s}$
) dummies to control for time- and state-specific economic conditions, as well as an idiosyncratic error term ( ${\varepsilon _{ist}}$
).
${\varepsilon _{ist}}$
).
3. Results
3.1. Summary statistics
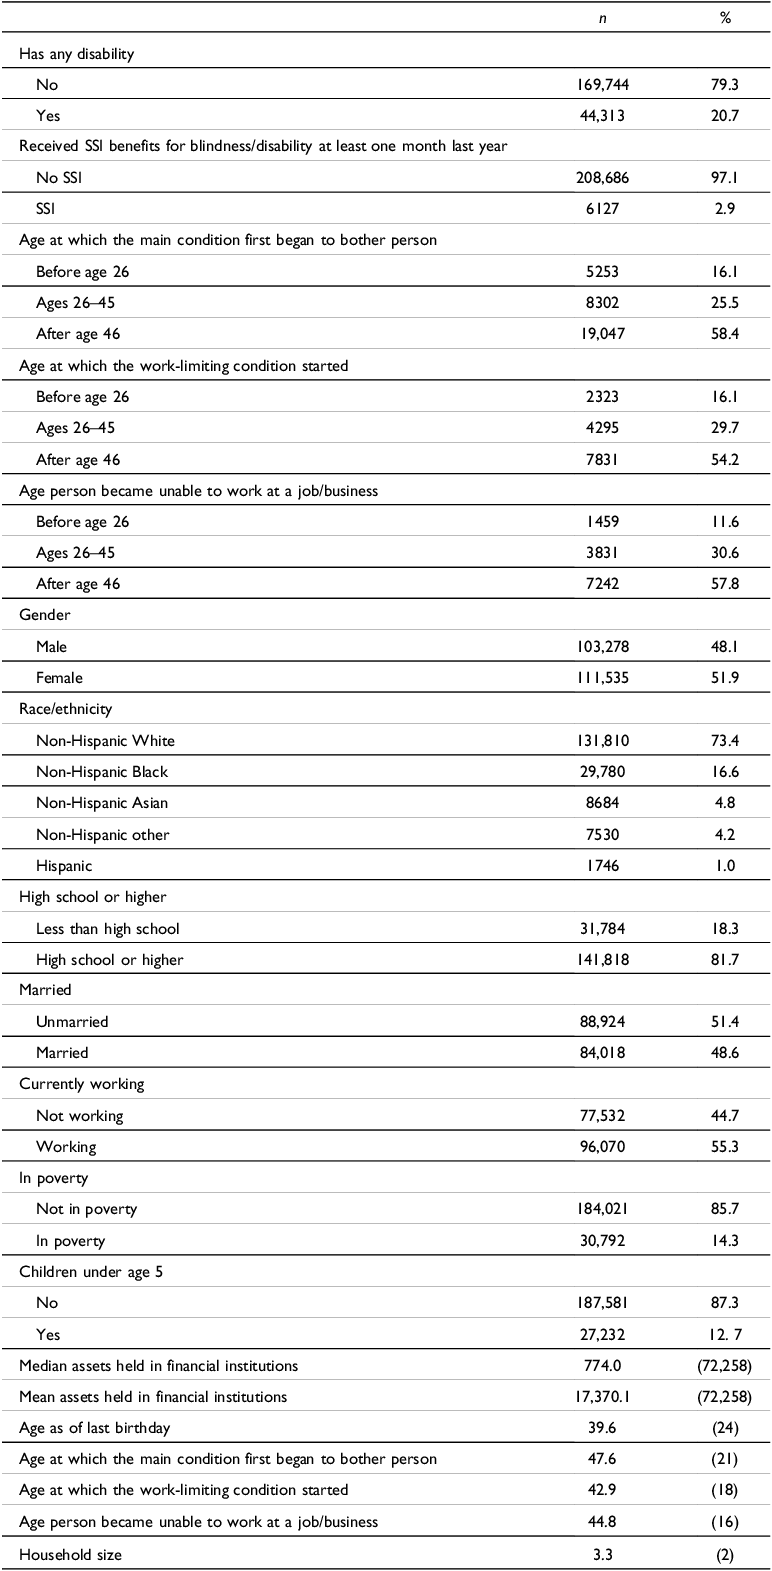
Table 1 reports unweighted descriptive statistics of all respondents in the 2014–2017 SIPP and Supplement. One in five individuals in the sample (20.7 percent) reported having a disability based on questions about difficulties with hearing, seeing, concentrating, walking or climbing, dressing or bathing, or going outside the home. Approximately 3 percent of people with disabilities in the sample reported receiving SSI benefits for blindness or disability for at least one month in the previous year. This may seem high given that the national SSI receipt rate historically ranges from 1 to 2 percent (Social Security Administration 2024a); however, the SIPP oversamples low-income households (Fee et al. Reference Fee, Fields, Smith, Shin and King2023), which includes a higher proportion of individuals with disabilities. In addition, because these summary statistics are unweighted, the three-percent SSI recipient rate among people with disabilities in this analytic sample is reasonable.
Table 1. Summary statistics (all waves pooled, unweighted, all individuals)

Source: Survey of Income and Program Participation 2014 Waves 1–4 merged with 2014 Social Security Administration Supplement Data.
Notes: Any disability counts as an affirmative “Yes” to any of the six questions, including difficulty seeing, hearing, concentrating, walking or climbing, dressing or bathing, or going outside the home. Assets held in financial institutions are reported both in mean and median values adjusted for 2017 U.S. dollars. Age variables and household size report mean values. Standard deviations in parenthesis.
OPM = Official Poverty Measure.
Most of the onset-age variables indicate that individuals tend to experience health conditions (bothering, work-limiting, or work-preventing) later in life (age 26 or over), while fewer than 20 percent report having their conditions begin before age 26.
A little over half of individuals are female, whereas the majority are non-Hispanic White (73.4 percent). Over 80 percent have a high school degree or higher, and less than half of individuals (48.6 percent) are currently married. Over half of respondents report being employed at the time of the interview (55.3 percent). According to the Official Poverty Measure, 14 percent of individuals live in households below the poverty line. About 12 percent of individuals report living in households with children under age 5.
The median value of assets held in financial institutions is 774 U.S. dollars, while the average is 17,370 U.S. dollars, indicating a highly right-skewed distribution. The average age of respondents in the sample is 40 years, while the average disability onset ages range from 43 (work-limiting) to 48 (bothering). The mean household size in the sample is 3.3.
3.2. Regression results
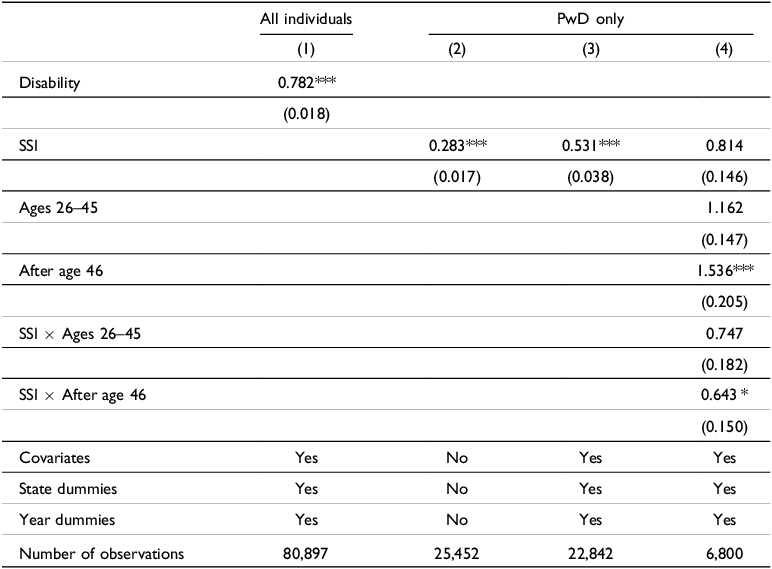
Table 2 presents the logistic regression results on having any savings accounts for all individuals in the sample and for people with disabilities, using work-limiting disability onset age. As Model (1) shows, people with disabilities are significantly less likely to have any savings accounts than people without disabilities (OR = 0.782, p < 0.01). Focusing on individuals with disabilities in Models (2) through (4), the first two models indicate that the SSI receipt is consistently associated with lower likelihoods of having savings accounts – both with or without covariates – compared to non-SSI recipients (OR = 0.283, p < 0.01 in Model (2); OR = 0.531, p < 0.01 in Model (3)).
Table 2. Odds ratio of having any savings accounts using work-limiting onset age (all individuals, people with disabilities only)

*** p < 0.01, ** p < 0.05, * p < 0.1.
Source: Survey of Income and Program Participation 2014 Waves 1–4 merged with 2014 Social Security Administration Supplement Data.
Notes: Robust standard errors in parenthesis. Covariates include current age, female, non-Hispanic Black, non-Hispanic Asian, non-Hispanic other, and Hispanic (reference group is non-Hispanic White), high school or higher, married, currently working, household has children under age 5, household size, and household in poverty. The reference group for the disability onset age categories is before age 26.
PwD = People with disabilities.
SSI = Received SSI benefits for blindness or disability for at least one month last year.
When the interaction term is introduced in Model (4), the SSI receipt status is no longer significantly associated with having savings accounts, although the odds ratio remains below one. Individuals whose work-limiting health conditions began after the age of 46 are more likely to have savings accounts than those whose disability onset occurred before age 26 (OR = 1.536, p < 0.01). The odds ratios for the interaction terms indicate that SSI recipients whose work-limiting conditions began after age 46 have a lower likelihood of having savings accounts compared to individuals whose disability began before age 26 (OR = 0.643, p < 0.1), although this relationship is only weakly significant. However, because interaction coefficients in non-linear models such as logistic regression cannot be directly interpreted as an interaction effect (Ai and Norton Reference Ai and Norton2003), the full impact of the interplay between SSI receipt and disability onset age on the probability of having savings accounts is examined next using marginal effects.
Figure 1 presents predicted probabilities of having any savings accounts by SSI receipt and work-limiting disability onset age groups among people with disabilities. For individuals who do not receive SSI benefits, the predicted probabilities increase as the disability onset age rises – from 38.5 percent (before age 26) to 47.8 percent (after age 46). In contrast, SSI recipients have consistently lower probabilities of having savings accounts overall (31.5 to 34.3 percent) than non-SSI recipients and do not display the same increasing pattern by onset age. More specifically, SSI recipients whose work-limiting conditions began between the ages of 26 and 45 have the lowest probability of having savings accounts (31.5 percent), indicating particularly limited financial capacity.

Figure 1. Predicted probabilities of having any savings accounts by SSI Receipt and work-limiting disability onset age with 95% confidence intervals (People with disabilities only).
Source: Survey of Income and Program Participation 2014 Waves 1–4 merged with 2014 Social Security Administration Supplement Data. Note: Predicted probabilities are reported based on Model 4 of Table 2.
When the predicted probabilities are compared in Appendix Table A1, however, the differences across onset-age groups for SSI recipients are not statistically significant. Only the 9.27-percentage-point increase from the younger onset-age group (before age 26) to the older onset-age group (after age 46) among non-SSI recipients shows a strong statistical significance.
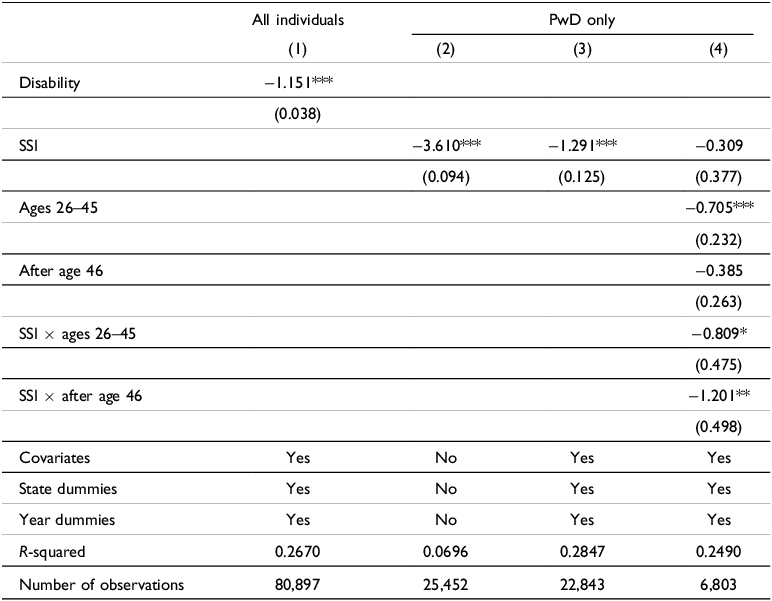
As an alternative measure for financial capacity – and perhaps a more direct measure of financial constraint – this study conducted a set of OLS regressions on the total amount of assets held at financial institutions using the same set of covariates and interaction terms. The asset amounts are IHS-transformed, a method widely used in the savings and wealth literature (Pence Reference Pence2006; Friedline et al. Reference Friedline, Masa and Chowa2015; Bellemare and Wichman Reference Bellemare and Wichman2020) because asset distributions include many zeros and are highly right-skewed. Due to the non-linear nature of the IHS transformation, the coefficients reported in Table 3 cannot be directly interpreted as dollar changes in asset holdings. While the magnitude and significance of the coefficients confirm the statistical relationships on the transformed scale, they do not represent marginal effects on the original dollar scale without bias correction (Bellemare and Wichman Reference Bellemare and Wichman2020; Norton Reference Norton2022). Therefore, the discussion that follows highlights only the statistical significance (i.e., direction and p-value) of the relationships between the key variables – including the interaction term – and the financial assets, rather than the magnitude of each coefficient. The analysis of the interplay between SSI receipt and disability onset age appears after Figure 2, which presents the back-transformed predicted values incorporating the weighted Duan Smearing Factor to correct for retransformation bias (Duan Reference Duan1983).
Table 3. OLS results of IHS transformed asset amounts held at financial institutions using work-limiting disability onset age (all, people with disabilities only)

*** p < 0.01, ** p < 0.05, * p < 0.1.
Source: Survey of Income and Program Participation 2014 Waves 1–4 merged with 2014 Social Security Administration Supplement Data.
Notes: Coefficients are not directly interpretable as marginal effects because the outcome is IHS-transformed. Robust standard errors in parenthesis. All specifications are clustered at the state. Covariates include current age, female, non-Hispanic Black, non-Hispanic Asian, non-Hispanic other, and Hispanic (reference group is non-Hispanic White), high school or higher, married, currently working, household has children under age 5, household size, and household in poverty. The reference group for the disability onset age categories is before age 26.
PwD = People with disabilities.
SSI = Received SSI benefits for blindness or disability at least one month last year.

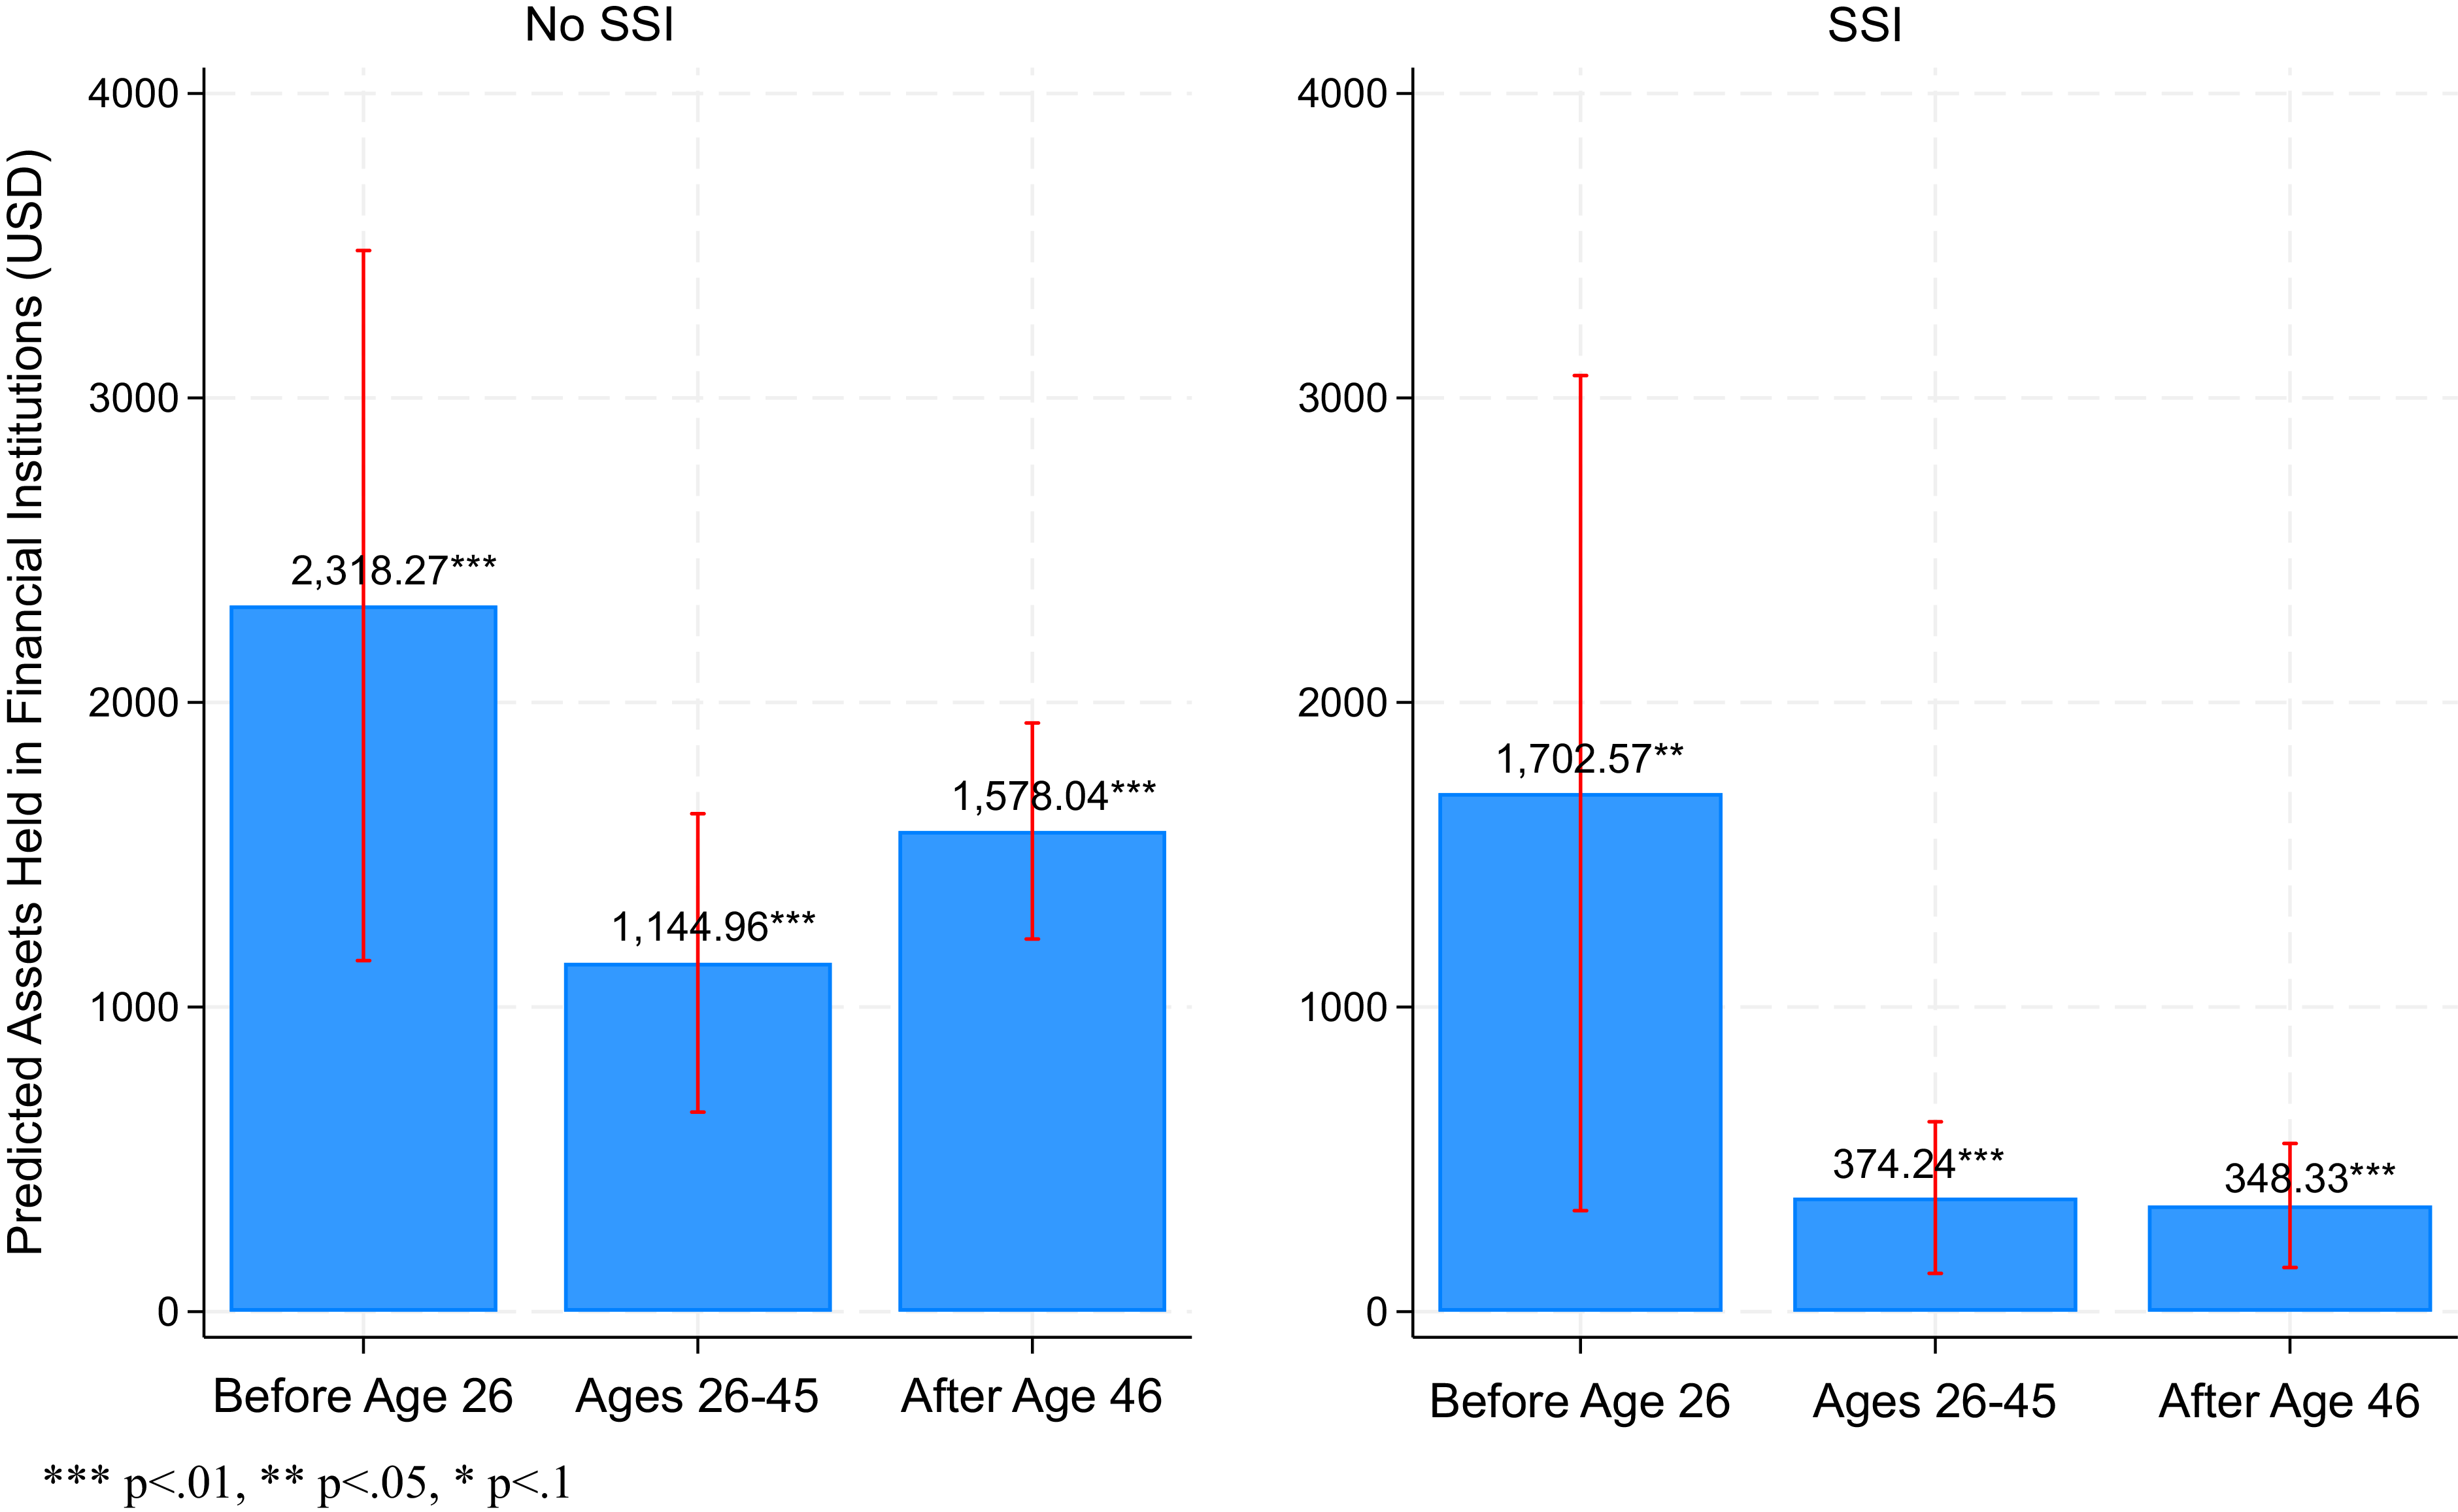
Figure 2. Back-transformed predicted values of asset amounts held at financial institutions by SSI Receipt and work-limiting disability onset age categories with 95% confidence intervals (2017 U.S. dollars, people with disabilities only).
*** p < 0.01, ** p < 0.05, * p < 0.1. Source: Survey of Income and Program Participation 2014 Waves 1–4 merged with 2014 Social Security Administration Supplement Data. Notes: Predicted values are back-transformed from the IHS regression using the weighted Duan smearing factor, based on Model 4 of Table 3. Asset values are inflation-adjusted using the 2017 Consumer Price Index. Delta-method standard errors are clustered at the state. Predicted values are adjusted for covariates, including current age, female, non-Hispanic Black, non-Hispanic Asian, non-Hispanic other, and Hispanic (reference group is non-Hispanic White), high school or higher, married, currently working, household has children under age 5, household size, and household in poverty.SSI = Received SSI benefits for blindness or disability for at least one month last year.USD = U.S. dollars.
Results in Model (1) of Table 3 indicate that people with disabilities have significantly smaller financial assets than people without disabilities. In Models (2) and (3), SSI receipt status is statistically significant and negatively associated with the IHS-transformed outcome, suggesting a substantial difference in assets for SSI recipients before accounting for the interaction. The interaction terms in Model (4) are significant ( $\beta $
= −0.809, p < 0.1 for SSI * Ages 26–45 and
$\beta $
= −0.809, p < 0.1 for SSI * Ages 26–45 and $\beta $
= −1.201, p < 0.05 for SSI * After age 46), indicating that the effect of SSI receipt on assets depends on the work-limiting disability onset age categories. To provide economically meaningful estimates, Figure 2 presents the results of back-transformed adjusted predicted values (in U.S. dollars).
$\beta $
= −1.201, p < 0.05 for SSI * After age 46), indicating that the effect of SSI receipt on assets depends on the work-limiting disability onset age categories. To provide economically meaningful estimates, Figure 2 presents the results of back-transformed adjusted predicted values (in U.S. dollars).
The back-transformed predicted values of assets held in financial institutions by SSI receipt and work-limiting disability onset age categories for people with disabilities in Figure 2 are estimated based on the Model (4) of Table 3, using the weighted Duan Smearing Factor (Duan Reference Duan1983). This approach allows the effects to be interpreted in terms of actual dollar amounts (i.e., the original unit) in predicted asset holdings. The back-transformed predicted values of each coefficient in all specifications (Models (1) through (4)) are presented in Appendix Table A2. Here, the focus is on the main interaction term (SSI*work-limiting disability onset age categories), highlighting the differential effects of SSI receipt across onset-age groups on the predicted value of financial assets.
The results in Figure 2 indicate that SSI recipients are likely to have smaller amounts of assets in financial institutions than non-SSI recipients among people with disabilities. Furthermore, the back-transformed predicted asset values vary substantially across disability onset-age categories. Individuals who had a work-limiting disability before age 26 are predicted to have more assets than others, regardless of SSI receipt (USD 2318.27, p < 0.01 for non-SSI recipients; USD 1702.57, p < 0.01 for SSI recipients). Notably, the smallest predicted asset values are observed among SSI recipients whose work-limiting disabilities began between ages 26 and 45 (USD 374.24, p < 0.01) and after age 46 (USD 348.33, p < 0.01), indicating pronounced financial constraints.
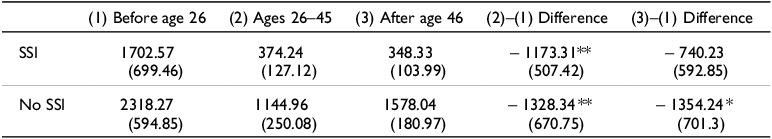
Furthermore, in a pairwise comparison by onset-age categories and SSI receipt status (base: individuals who had a disability before age 26) in Table 4, the back-transformed predicted asset values for SSI recipients are significantly different between the before-age-26 group and the ages-26–45-group (USD −1173.31, p < 0.05). This suggests that newly eligible ABLE users among SSI recipients may have even more constrained financial capacity than the currently eligible ABLE account holders. Comparing the older disability onset-age group (after age 46) with the younger group (before age 26) did not show a statistically significant difference, whereas all pairwise comparisons among non-SSI recipients are significantly different.
Table 4. Pairwise comparisons of back-transformed predicted asset values held at financial institutions by SSI receipt and work-limiting disability onset age (2017 U.S. dollars, people with disabilities only)

***p < 0.01, **p < 0.05, *p < 0.1.
Source: Survey of Income and Program Participation 2014 Waves 1–4 merged with 2014 Social Security Administration Supplement Data.
Notes: Back-transformed predicted asset values are reported based on Model 4 of Table 3. Predicted values are back-transformed from the IHS regression using the weighted Duan smearing factor, based on each specification of Table 3. Asset values are inflation-adjusted using the 2017 Consumer Price Index. Delta-method standard errors in parenthesis. All specifications are clustered at the state. Covariates include current age, female, non-Hispanic Black, non-Hispanic Asian, non-Hispanic other, and Hispanic (reference group is non-Hispanic White), high school or higher, married, currently working, household has children under age 5, household size, and household in poverty.
SSI = Received SSI benefits for blindness or disability at least one month last year.
As a robustness check, this study conducted the same set of OLS regressions excluding individuals with disabilities who have more than USD 2,000 in financial assets (n = 12,580), which is the minimum asset limit for SSI recipients. The goal is to more accurately capture the SSI effects on financial assets and the interaction with disability onset age. Results are reported in Appendix Table A3 and Figure A1 and indicate similar findings. When alternative disability onset age measures are used (i.e., the age at which health conditions began to bother individuals, and the age at which health conditions prevented them from working), the results are qualitatively similar to the main findings (available upon request).
4. Discussion and conclusion
This study explored characteristics of savings and financial capacity across three disability onset-age groups among people with disabilities. The focus was to examine different savings and financial capacity among SSI recipients whose health conditions began between ages 26 and 45 – a group expected to become eligible for ABLE accounts in January 2026 when the disability onset age threshold increases from 26 to 46. ABLE accounts can provide opportunities to save and build long-term financial security for SSI recipients, who otherwise face strict asset limits to maintain Social Security benefits.
Overall, the findings align with previous research showing that people with disabilities – particularly SSI recipients – have weaker attachment to financial services and products. They are less likely to have savings accounts and tend to hold smaller amounts of financial assets than people without disabilities. Research consistently shows that people with disabilities are unbanked or underbanked at substantially higher rates than those without disabilities. Being unbanked refers to having no checking or savings accounts, while underbanked individuals have accounts but rely on alternative financial services such as payday loans and pawnshop borrowing (Goodman and Morris Reference Goodman and Morris2019; McGarity and Caplan Reference McGarity and Caplan2019). Recent survey evidence shows that 9 percent of people with disabilities are unbanked (compared with 4 percent of people without disabilities) and 20 percent are underbanked (compared with 13 percent of those without disabilities) (Warren et al. Reference Warren, Wanjira, Greene and Berdie2023). Disability status remains a significant contributor to this financial gap even after controlling for demographic characteristics such as income and employment (Goodman et al. Reference Goodman, O’Day and Morris2017). SSI recipients, in particular, are unbanked at even higher rates and are more likely to use non-bank borrowing options than others with disabilities receiving SSA benefits (Anderson et al. Reference Anderson, Strand and Collins2018).
Among SSI recipients, disability onset age matters more for the amount of financial assets than for having any savings accounts. Considering the upcoming expansion for ABLE eligibility, this may mean that SSI recipients who will become eligible in 2026 exhibit a similarly weak attachment to financial systems as the currently eligible group, but with even more limited financial capacity. This study does not attempt to forecast the ABLE take-up without access to actual ABLE data; however, the findings cautiously suggest that the likelihood of opening ABLE accounts among SSI recipients who are newly eligible for ABLE may be similarly low – or possibly lower – than the current participation rate. This is because only a little over 31 percent of soon-to-be eligible individuals appear to have the financial attachment needed to open an ABLE account, and even if they were able to open one, they may not have sufficient financial assets to deposit. Furthermore, the older disability-onset group (age 46 and older) shows a similar level of limited financial capacity, indicating that ABLE take-up may remain low even if the disability onset age requirement were removed entirely.
Another point to consider is that access to financial institutions and overall financial capacity can be important factors when examining ABLE account participation. While income level can influence ABLE usage (Briscese et al. Reference Briscese, Levere and Pollack2024), this study adds to existing evidence that attachment to financial institutions and the amount of financial assets may also be important indicators of whether SSI recipients have ABLE accounts. However, drawing a direct connection between financial capacity and ABLE account access requires further investigation. Motivation and perceptions related to using financial products and services (Jumena et al. Reference Jumena, Siaila and Widokarti2022; Mauldin et al. Reference Mauldin, Henager, Bowen and Cheang2016) as well as financial literacy (Widjaja et al. Reference Widjaja, Arifin and Setini2020) are likely to influence the decision to open or maintain an ABLE account. In addition, the sources from which individuals receive information about savings vehicles such as ABLE accounts may shape the likelihood of account ownership, particularly given the weak attachment many SSI recipients demonstrate to financial institutions in this study. Furthermore, existing qualitative evidence suggests that many SSI recipients experience fear of losing Social Security benefits when reporting income outside of SSA checks (Savin Reference Savin2019) and face administrative burdens when managing multiple benefit programs (Savin Reference Savin2022). These concerns may discourage SSI recipients who are newly eligible for ABLE accounts from opening an account if information barriers – such as limited trust in benefits systems or ineffective communication about eligibility rules – are present. Finally, further analysis using actual ABLE administrative data could provide insight into the demographic characteristics of current ABLE account holders and support forecasting of future participation as eligibility criteria expand.
There are several limitations to this study. First, having any savings accounts and the amount of financial assets may not be complete measures of financial capacity for SSI recipients. SSA can monitor SSI recipients’ savings accounts through the AFI authority and assess eligibility by checking whether resources fall within the asset limits. Some SSI recipients may have less incentive to maintain savings accounts out of fear or mistrust (Parish et al. Reference Parish, Grinstein-Weiss, Yeo, Rose and Rimmerman2010; Savin Reference Savin2019). The alternative measure of financial capacity used in Table 3 and Figure 2 – the amount of assets held at financial institutions – may capture financial constraints more directly for SSI recipients, as these asset values are directly tied to maintaining SSI benefits. However, further research is needed to incorporate SSI recipients’ motivation for engaging with financial institutions to accurately measure financial capacity.
Second, although the different onset-age measures in this study show qualitatively similar patterns in savings and financial capacity, the bothering, work-limiting, and work-preventing onset ages are not perfect indicators of disability onset age as it relates to the ABLE accounts eligibility. While individuals with disabilities self-verify their disability when opening ABLE accounts, determining the disability onset age for SSI recipients depends on multiple factors, including the nature of impairment, medical evidence, and other eligibility rules, which are coordinated between SSA field offices and disability determination services (DDS) (Social Security Administration 2024b). Nonetheless, within the limits of publicly available data, the 2014 SSA SIPP Supplement provides the best available information on disability onset ages.
The findings in this study are descriptive but can suggest potential financial capacity among newly eligible ABLE users, which may contribute to low participation. Future research could use administrative records of ABLE accounts and verified disability onset ages to better assess the use and impact of ABLE accounts among people with disabilities and SSI recipients who need improved access to financial services and products for enhanced financial security.
Supplementary material
The supplementary material for this article can be found at https://doi.org/10.1017/flw.2025.10006.
Acknowledgments
The research reported herein was derived in whole or in part from research activities performed pursuant to a grant from the US Social Security Administration (SSA) funded as part of the Retirement and Disability Research Consortium. Additional funding source for this study was provided by the Advanced Rehabilitation Research and Training (ARRT) Program on Employment Policy at the University of New Hampshire, which is funded by the National Institute for Disability, Independent Living, and Rehabilitation Research, in the Administration for Community Living, at the US Department of Health and Human Services (DHHS) under grant number 90AREM000401. The opinions and conclusions expressed are solely those of the author and do not represent the opinions or policy of SSA, DHHS, or any agency of the Federal Government. Neither the United States Government nor any agency thereof, nor any of their employees, makes any warranty, express or implied, or assumes any legal liability or responsibility for the accuracy, completeness, or usefulness of the contents of this report. Reference herein to any specific commercial product, process, or service by trade name, trademark, manufacturer, or otherwise does not necessarily constitute or imply endorsement, recommendation, or favoring by the United States Government or any agency thereof.


 Open access