


Introduction
People donate to nonprofit organizations (NPOs) for a wide variety of reasons. When making charitable giving decisions, some donors are more sophisticated than others. Indeed, Wong and Ortmann (Reference Wong and Ortmann2016) hold that donors are heterogeneous: some value NPO information and use it to make giving decisions, whereas others do not. However, as the Internet has made it relatively easy to collect organizational information, donors increasingly evaluate NPOs online before giving (Saxton et al., Reference Saxton, Neely and Guo2014; Wright & Walmsley, Reference Wright, Walmsley, Walmsley, Simmons and Wright2022). According to the literature, donors care about the price of giving because they want their donations to maximize NPO outputs (Gneezy et al., Reference Gneezy, Keenan and Gneezy2014). The price of giving refers to the donors’ cost of purchasing charitable output (Weisbrod & Dominguez, Reference Weisbrod and Dominguez1986). Therefore, one can expect that donations increase when the price decreases. However, Wong and Ortmann (Reference Wong and Ortmann2016) review the results from studies on the price-donation relationship and find that even though the price is negatively associated with donations in many studies, there are quite a number of cases where donations increase as the price increases.
This inconsistency leads to two critical questions. First, are donors sensitive to the price of giving in general? Since Weisbrod and Dominguez (Reference Weisbrod and Dominguez1986) put forward the notion of price of giving around 40 years ago, the discussion on the price-donation relationship has not yet been settled. Second, as previous studies have produced mixed results on the effect of the price of giving (e.g., Bowman, Reference Bowman2006; Calabrese & Grizzle, Reference Calabrese and Grizzle2012; Harris & Krishnan, Reference Harris and Krishnan2012; Yetman & Yetman, Reference Yetman and Yetman2013), it is imperative to explore why donors’ sensitivity to the price of giving varies. The literature implies that the effect of the price of donations may vary for various reasons. For example, Hung et al. (Reference Hung, Hager and Tian2023) state that some donors are more likely than others to invest time in understanding the operations of NPOs, and thus donor-type matters. Tinkelman (Reference Tinkelman1999) argues that donors’ levels of concern about the price of giving differ by NPO type, after reviewing the research findings in the literature. Wong and Ortmann (Reference Wong and Ortmann2016, p. 969) suggest that the inconsistent results might depend on “the econometric tools that are used, the data analyzed, and the regulatory framework imposed at the time of analysis.” However, despite a rich body of literature, to our knowledge, no study systematically examines why donors’ sensitivity to the price of giving varies.
Practically, studying whether donors are sensitive to the price of giving, and why donors’ sensitivity to the price of giving varies, offers opportunities to understand how NPOs could manage their financial resources in general and donations in particular. Donations are important to NPOs for many reasons. For example, from the perspective of resource management, NPOs need financial resources to pursue their social missions and sustain their operations (Kim & Mason, Reference Kim and Mason2020; Lu et al., Reference Lu, Shon and Zhang2020). The more donations NPOs receive, the more likely they are to survive and thrive. Second, from the perspective of organizational identity, as Froelich (Reference Froelich1999, p. 258) puts it, donations are considered “a rather sacred source of nonprofit support.” Donations thus represent NPOs’ legitimacy as voluntary organizations, distinguishing them from government and business organizations. Given that donations are an important financial source for NPOs, and that donors increasingly evaluate NPOs before giving, research to summarize previous findings on the effect of price of giving on donations has practical implications.
Therefore, we conduct meta-analysis to synthesize and compare the results from previous quantitative studies to answer (1) whether donors are sensitive to the price of giving and (2) why donors’ sensitivity to the price of giving varies. Following Weisbrod and Dominguez (Reference Weisbrod and Dominguez1986), we set the price of giving to be determined by the level of tax deductibility to donors and overhead expenses by nonprofits (WD price).Footnote 1 This meta-analysis includes studies that perfectly implement the WD price, as well as those that imperfectly implement it, such as studies using the “No taxes WD” approach that includes only administrative and fundraising costs, or the “Fundraising only” method, which excludes administrative costs from the price calculation. However, studies that rely solely on the 1 − t approach, such as those using the “Taxes only” method where the price is calculated as 1 − t, are excluded.
This meta-analysis first contributes to the literature by providing a clear-cut and more accurate estimate of the overall effect of the price of giving on donations across existing studies. Second, this meta-analysis delves further into the moderating factors underlying the price-donation relationship. In particular, we investigate whether factors related to theoretical constructs, econometric tools, and research designs affect the price effect. Finally, the results of this study add to the rich literature of donors’ decision-making. There is often doubt among scholars and practitioners as to whether, or to what extent, donors rely on cost–benefit analysis to make giving decisions (Bekkers & Wiepking, Reference Bekkers and Wiepking2011; Breeze, Reference Breeze2013; Li & McDougle, Reference Li and McDougle2017; Tremblay-Boire & Prakash, Reference Tremblay-Boire and Prakash2017). Our study offers concrete evidence relevant to this ongoing debate.
Are Donors Sensitive to the Price of Giving?
Donors’ Giving Decisions
Scholars have been increasingly interested in studying individual decision-making about which NPOs to support. There is a line of studies (e.g., Bekkers & Wiepking, Reference Bekkers and Wiepking2011; Saxton et al., Reference Saxton, Neely and Guo2014; Wong & Ortmann, Reference Wong and Ortmann2016) supporting the idea that donors’ giving behaviors are similar to consumers’ purchasing behaviors. As Bekkers and Wiepking (Reference Bekkers and Wiepking2011, p. 932) state, “giving money costs money” and thus giving increases “when the costs of a donation are lower.” Wong and Ortmann (Reference Wong and Ortmann2016) further deconstruct the costs of a donation into two parts: information cost and output purchasing cost. People give more to NPOs when the sum of the two costs is lower. In their study of 400 NPOs in the United States, Saxton et al. (Reference Saxton, Neely and Guo2014) find that NPOs’ donations increase as the amount of Web disclosure provided by those NPO increases. Web disclosure disseminates valuable information to donors, which in turn reduces their information-gathering costs. This line of research has shown that people could be sophisticated agents who use cost–benefit analysis to make giving decisions.
Given that people could be sophisticated agents, it is important to know who is more likely to be sophisticated and under what circumstances. With regard to the “who” question, Cnaan et al. (Reference Cnaan, Jones, Dickin and Salomon2011) find that donors in the United States who donate larger sums tend to use ratings from watchdog organizations significantly more than others. Moreover, McDougle and Handy’s (Reference McDougle and Handy2014) study of a large county in Southern California concludes that individuals’ volunteer status, education attainment, income, race, and gender are all associated with their reliance on multiple information-gathering strategies. That is, some individuals are more likely than others to rely on information-gathering strategies to evaluate NPO performance before giving. With respect to the “when” question, one previous study finds that committed donors in the United Kingdom are more likely to compare NPOs when those NPOs are local, because they know what goes on locally and how efficient local NPOs are (Breeze, Reference Breeze2013). Furthermore, people are more likely to be sophisticated agents when information about NPOs is readily available to them. Over the past two decades, the Internet has made it relatively easy for potential donors to evaluate NPOs before giving (Saxton et al., Reference Saxton, Neely and Guo2014). We discuss donors’ evaluation of the price of giving in the next section.
Donors’ Sensitivity to the Price of Giving
The examination of donors’ reactions to the price of giving first appears in Weisbrod and Dominguez’s (Reference Weisbrod and Dominguez1986) study of factors influencing charitable contributions to NPOs. In their seminal paper, Weisbrod and Dominguez (Reference Weisbrod and Dominguez1986, p. 87) define price as “the cost to a donor of purchasing one dollar’s worth of the organization’s output.” In other words, it describes the cost of purchasing charitable output. Weisbrod and Dominguez (Reference Weisbrod and Dominguez1986) further hold that the price of giving depends on donors’ marginal income tax rate and NPOs’ expenditure on fundraising and administration. Their formula of the price of giving can be specified as follows:
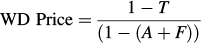
where T is a donor’s marginal income tax rate; A is an NPO’s percentage of total expenditure on administration; and F is an NPO’s percentage of total expenditure on fundraising. The value of price indicates how much after-tax income a donor must give up to provide an additional dollar of an NPO’s final output.Footnote 2
As price refers to donors’ cost of purchasing charitable output, donors might reward NPOs with a lower price by giving more donations (Weisbrod & Dominguez, Reference Weisbrod and Dominguez1986). The law of demand in economics provides an explanation for this. It states that the quantity purchased by consumers varies inversely with price. In other words, the lower the price, the higher the quantity demanded. The law of demand is largely based on the assumption that people calculate the costs and benefits of options available, to maximize their net interests. In the context of charitable giving, donors, expecting their contributions to maximize charitable output, would want NPOs to spend their contributions on producing charitable output (Gneezy et al., Reference Gneezy, Keenan and Gneezy2014; Hung et al., Reference Hung, Hager and Tian2023). The price of giving decreases when NPOs use a larger portion of their donations on program activities, as this indicates that only a smaller portion of their donations are used for administrative and/or fundraising expenses. If all of these are true, then donors are price-sensitive, and we can expect the price to have a negative effect on donations.
However, prior empirical research has yielded inconsistent results. Some find a positive effect, while others find a negative effect (e.g., Bowman, Reference Bowman2006; Calabrese & Grizzle, Reference Calabrese and Grizzle2012; Harris & Krishnan, Reference Harris and Krishnan2012; Yetman & Yetman, Reference Yetman and Yetman2013). Therefore, we synthesize the results of foregoing empirical studies by first estimating a clear-cut overall generalized effect and then examining why the influence of the price on donations varies across empirical studies. We discuss potential variables that may influence the price-donation relationship in the next section.
Why Does Donors’ Sensitivity to the Price of Giving Vary?
We investigate a series of study and model characteristics that might systematically predict the variation in the relationship within and across empirical studies. Informed by previous literature, the following 10 moderators across three categories were considered in this study: substantive factors, price calculation, and research design characteristics.
Substantive Factors
Individual vs. Institutional Donors
Some donors collect and use organizational information before giving, while others do not. For example, Cnaan et al. (Reference Cnaan, Jones, Dickin and Salomon2011) find that when making giving decisions, the majority of donors do not use NPO rating information provided by watchdog organizations. Instead, only donors who give significant amounts or who advocate actively are likely to seek the information. A similar argument can be found in Balsam and Harris (Reference Balsam and Harris2013). As donors who give significant amounts or advocate actively are likely to be institutional donors, such as foundations and businesses, we make a distinction between individual and institutional donors in our data, evaluating whether the relationship between the price and donations varies according to this distinction.
Donative NPOs vs. Commercial NPOs
Hansmann (Reference Hansmann1980) identifies two types of NPOs: commercial NPOs that generate income primarily from service fees, and donative NPOs that derive their income mainly from grants or donations. Donors’ level of concern about the price of giving might differ between different types of NPOs (Tinkelman, Reference Tinkelman1999). For example, donors might prefer commercial NPOs over donative ones because they deem commercial NPOs to be more efficient than donative NPOs in operating their organizations (Hung, Reference Hung2020). As efficient organizations are deemed able to use the lowest costs to generate the greatest benefit (Coupet & Berrett, Reference Coupet and Berrett2019), donors might expect that efficient organizations can lower their cost of purchasing charitable output. Therefore, price-sensitive donors might be more likely to give to commercial NPOs, compared to donative ones. In addition, since donative NPOs rely more heavily on donations than commercial NPOs, it is also likely that donors pay more attention to the price in donative NPOs as donations matter more to these NPOs.
Price Calculation
Fundraising Costs Only vs. Administrative and Fundraising Costs
NPOs’ expenditure on fundraising and administration are two crucial elements in the formula used to calculate the price of giving. Some previous studies only include fundraising costs (F) when specifying the formula (Okten & Weisbrod, Reference Okten and Weisbrod2000; Yetman & Yetman, Reference Yetman and Yetman2013), while others incorporate both fundraising and administrative costs (F + A) (Calabrese & Grizzle, Reference Calabrese and Grizzle2012; Feng, Reference Feng2014). It is important to note that compared to studies that include both fundraising and administrative costs, those that only consider fundraising costs may introduce measurement errors, resulting in a biased price of giving and potentially skewed results. Therefore, we evaluate whether the relationship between the price and donations varies depending on this distinction.
Without Income Tax Rate vs. With Income Tax Rate
Another element in the calculation of the price of giving is donors’ marginal income tax rate (T). While some studies exclude the tax rate (e.g., Feng et al., Reference Feng, Neely and Slatten2016; Khanna et al., Reference Khanna, Posnett and Sandler1995), others incorporate it (e.g., Yetman & Yetman, Reference Yetman and Yetman2013). Weisbrod and Dominguez (Reference Weisbrod and Dominguez1986) asserted that the price of giving is contingent upon both donors’ marginal income tax rate and NPOs’ expenditures on fundraising and administration. Consequently, studies that disregard taxes may introduce measurement error bias when computing the price of giving. Therefore, we anticipate that the effects observed in the previous studies that omit the tax rate (and thus provide a biased proxy of price) would differ from those in studies that include the tax rate in their calculations.
Research Design Characteristics
Basic vs. Advanced Regression Models
The effect of the price on donations may vary according to whether researchers use basic or advanced regression models. For example, in their review of previous results of the price-donation relationship, Wong and Ortmann (Reference Wong and Ortmann2016) propose that the study results depend on econometric tools used. A similar emphasis on the impact of model specification can be found in Tinkelman and Mankaney (Reference Tinkelman and Mankaney2007). Our moderator—basic models (e.g., ordinary least squares, logistic regression, or other models for limited dependent variables) vs. advanced models (e.g., fixed effects, quasi-experimental designs, or models with strong causal claims)—tests whether effect sizes differ according to this model difference.
Cross-Sectional vs. Longitudinal Data
Examining whether variation in effects across previous studies derives from the data structure of original studies has been common in meta-analyses (e.g., Hung, Reference Hung2020; Lu, Reference Lu2016). Compared to cross-sectional data, longitudinal data enable researchers to utilize both within-observational-unit variation and between-observational-unit variation to control for all unmeasured covariates that remain constant over time but vary across units, or those that are constant across units but vary over time.Footnote 3 Moreover, Wong and Ortmann (Reference Wong and Ortmann2016) conclude in their literature review that the variation in the results examining the effect of price on donations may derive from the data analyzed in the previous studies as well. Therefore, we test whether the relationship between the price and donations varies according to this distinction.
Non-Log Price vs. Log Price
In quantitative research, the choice of functional form—such as applying log transformations to variables like price—may affect estimation results and the interpretation of coefficients. This is because the functional form defines the nature of the relationship between variables and influences how we understand the estimated effects. Tinkelman and Mankaney (Reference Tinkelman and Mankaney2007) highlight how a log transformation can influence the estimation of the effect of administrative efficiency on donations. In contrast, Feng et al. (Reference Feng, Wang, Lu and Tu2013) provide evidence suggesting that log-transformed results may not always be appropriate or relevant. Therefore, we include functional form as a moderator to examine whether the relationship between price and donations varies depending on this distinction.
Non-Log Donations vs. Log Donations
Similarly, we also create a moderator to examine whether the relationship between the price and donations varies according to whether researchers take log transformation on donations or not.
Data Year
Donors’ sensitivity to the price of giving might vary over time. For example, potential donors might care more about how NPOs run their organizations now than before, as organizational information has become increasingly available via sources such as Form 990, NPOs’ annual reports, and/or rating information from watchdog organizations (McDougle & Handy, Reference McDougle and Handy2014; Saxton et al., Reference Saxton, Neely and Guo2014). If this is the case, statistical models based on more recent data would produce more negative results than models based on earlier data.
Publication Bias
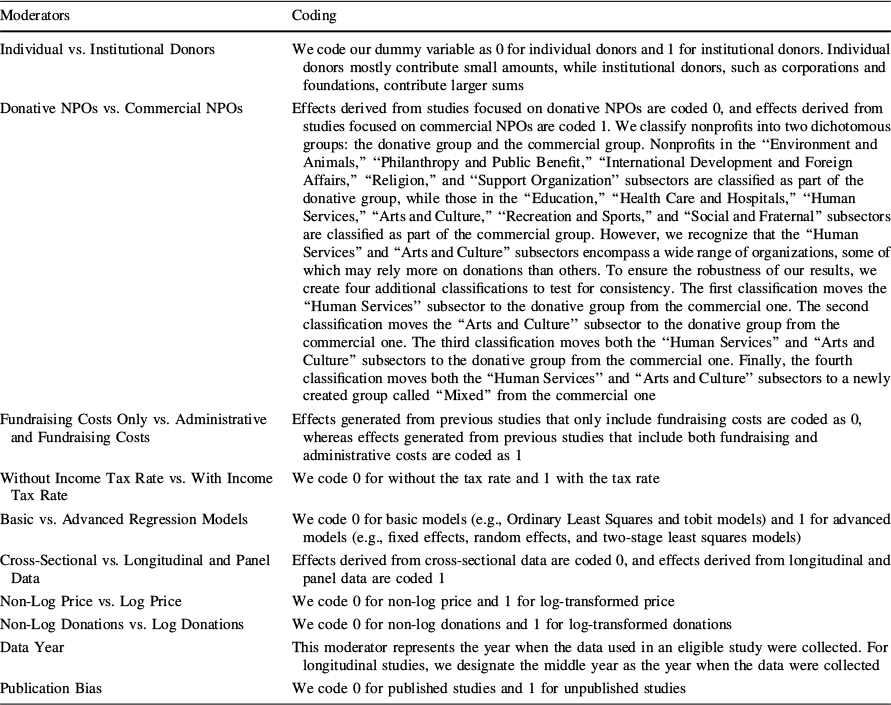
Studies that report null effects are less likely to be published, which may result in inflated effect sizes in the published literature and then publication bias for meta-analysis (Rothstein et al., Reference Rothstein, Sutton, Borenstein, Rothstein, Sutton and Borenstein2005). Therefore, moderator tests for publication bias are common in meta-analysis (e.g., Hung, Reference Hung2020; Lu, Reference Lu2016). We create a moderator to examine the potential difference in effects between studies published in academic journals and unpublished papers or theses. Tables 3 and 4 in the Appendix present our coding for the moderators.
Methods
To synthesize and compare the results from previous empirical studies regarding the effect of the price of giving on donations, we conduct a meta-analysis. According to Glass (Reference Glass1976, p. 3), meta-analysis is “the statistical analysis of a large collection of analysis results from individual studies for the purpose of integrating the findings.” The purpose of a meta-analysis is to combine existing research findings for more generalized or definitive conclusions (Hung & Lu, Reference Hung and Lu2022; Hunter & Schmidt, Reference Hunter and Schmidt2004). A primary task of meta-analysis is to gather previous studies that report the effect sizes of the statistical relationships of interest, usually Pearson’s correlation coefficients in the field of nonprofit studies (Hung & Lu, Reference Hung and Lu2022; Ringquist, Reference Ringquist2013). In this study, effect sizes refer to standardized relationships between the price of giving and donations. Once effect sizes are harvested, meta-analysts can further synthesize results from previous empirical studies by estimating an overall effect and examining the moderating effects of a series of study characteristics.
Literature Search
To harvest effect sizes of interest, we first search for relevant previous studies that report statistical relationships between the price of giving and donations. We start the search by screening 517 previous studies that cite Weisbrod and Dominguez (Reference Weisbrod and Dominguez1986), reported in Google Scholar. We rely on Weisbrod and Dominguez (Reference Weisbrod and Dominguez1986) because that study is among the first to define, examine, and discuss the price of giving. It is reasonable to assume that subsequent studies that examine the effect of price of giving on donations would cite this article. The decision to select previous studies for our meta-analysis is based on the following criteria:
-
1. Studies should use donations as a dependent variable and the price of giving as an independent variable. Donations could include individual donations, foundation donations, corporate donations, or legacy but not government grants. The price of giving could be measured by the “W&D” formula (WD price) specified by Weisbrod and Dominguez (Reference Weisbrod and Dominguez1986) and its revised forms (i.e., the WD price without T, the WD price without A, or the W&D price without T and A).
-
2. The price of giving is defined as donors’ cost of purchasing charitable output (Weisbrod & Dominguez, Reference Weisbrod and Dominguez1986). Previous studies that examine the effect of overhead ratios (e.g., the ratio of administrative expenses to total expenses) are not included in this meta-analysis, as overhead ratios are conceptually and empirically different from the price of giving (Calabrese, Reference Calabrese2011; Hung et al., Reference Hung, Hager and Tian2023).
-
3. We exclude previous relevant studies that define and specify the price of giving as 1 − T and do not take administrative and/or fundraising expenses into consideration.
-
4. We include both published and unpublished previous relevant studies to minimize potential publication bias.
-
5. We exclude previous relevant studies not written in English, but include studies on any country.
-
6. We exclude previous relevant studies that use qualitative research methods as they do not provide the necessary quantitative data.
-
7. We exclude previous relevant studies that do not provide sufficient information, such as t-statistics, regression coefficients, and standard errors, for us to recode or estimate effect sizes.
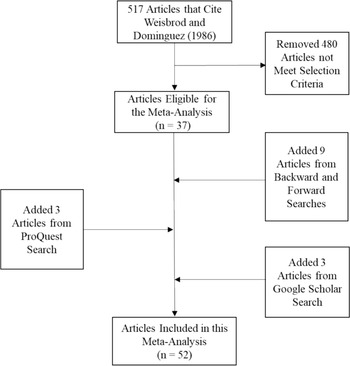
Following these criteria, this search yields 37 eligible studies. We then perform backward and forward searches on the 37 eligible studies to identify literature that the previous step might have missed, yielding nine eligible studies. Third, we search the ProQuest database for unpublished relevant studies, yielding three eligible studies. Finally, we conduct reality checking: a Google Scholar search of (price and donation), which uncovers three additional eligible studies. In total, our searches and checks yield 52 eligible studies, effective January 18, 2022 (Fig. 1).

Fig. 1 Study collection and selection process
Effect Size Calculation
We use Pearson’s correlation coefficient (r) suggested by Ringquist (Reference Ringquist2013) as the index of effect size for combining and comparing results (the association between the price of giving and donations) across the eligible studies. For those eligible studies that do not report r, we follow strategies given by Card (Reference Card2015) and Ringquist (Reference Ringquist2013, pp. 105–109) for estimating the effect sizes:
-
1. We use t statistics to estimate r effect sizes when eligible studies report t statistics (e.g., Rossi et al., Reference Rossi, Leardini and Landi2020; Saxton et al., Reference Saxton, Neely and Guo2014).
-
2. We calculate t statistics to estimate r effect sizes for eligible studies that report partial correlation coefficients and standard errors associated with regression parameter estimates in regression models (e.g., Krawczyk et al., Reference Krawczyk, Wooddell and Dias2017; Lee et al., Reference Lee, Lu and Shon2022).
-
3. We record standardized regression coefficient estimates as r effect sizes when eligible studies report standardized beta coefficients (e.g., Chen, Reference Chen2009; Feng et al., Reference Feng, Neely and Slatten2016).
-
4. We do not estimate low-bound r effect sizes when eligible studies only indicate whether the relationship is statistically significant without reporting standard errors, as they underestimate actual effect sizes.
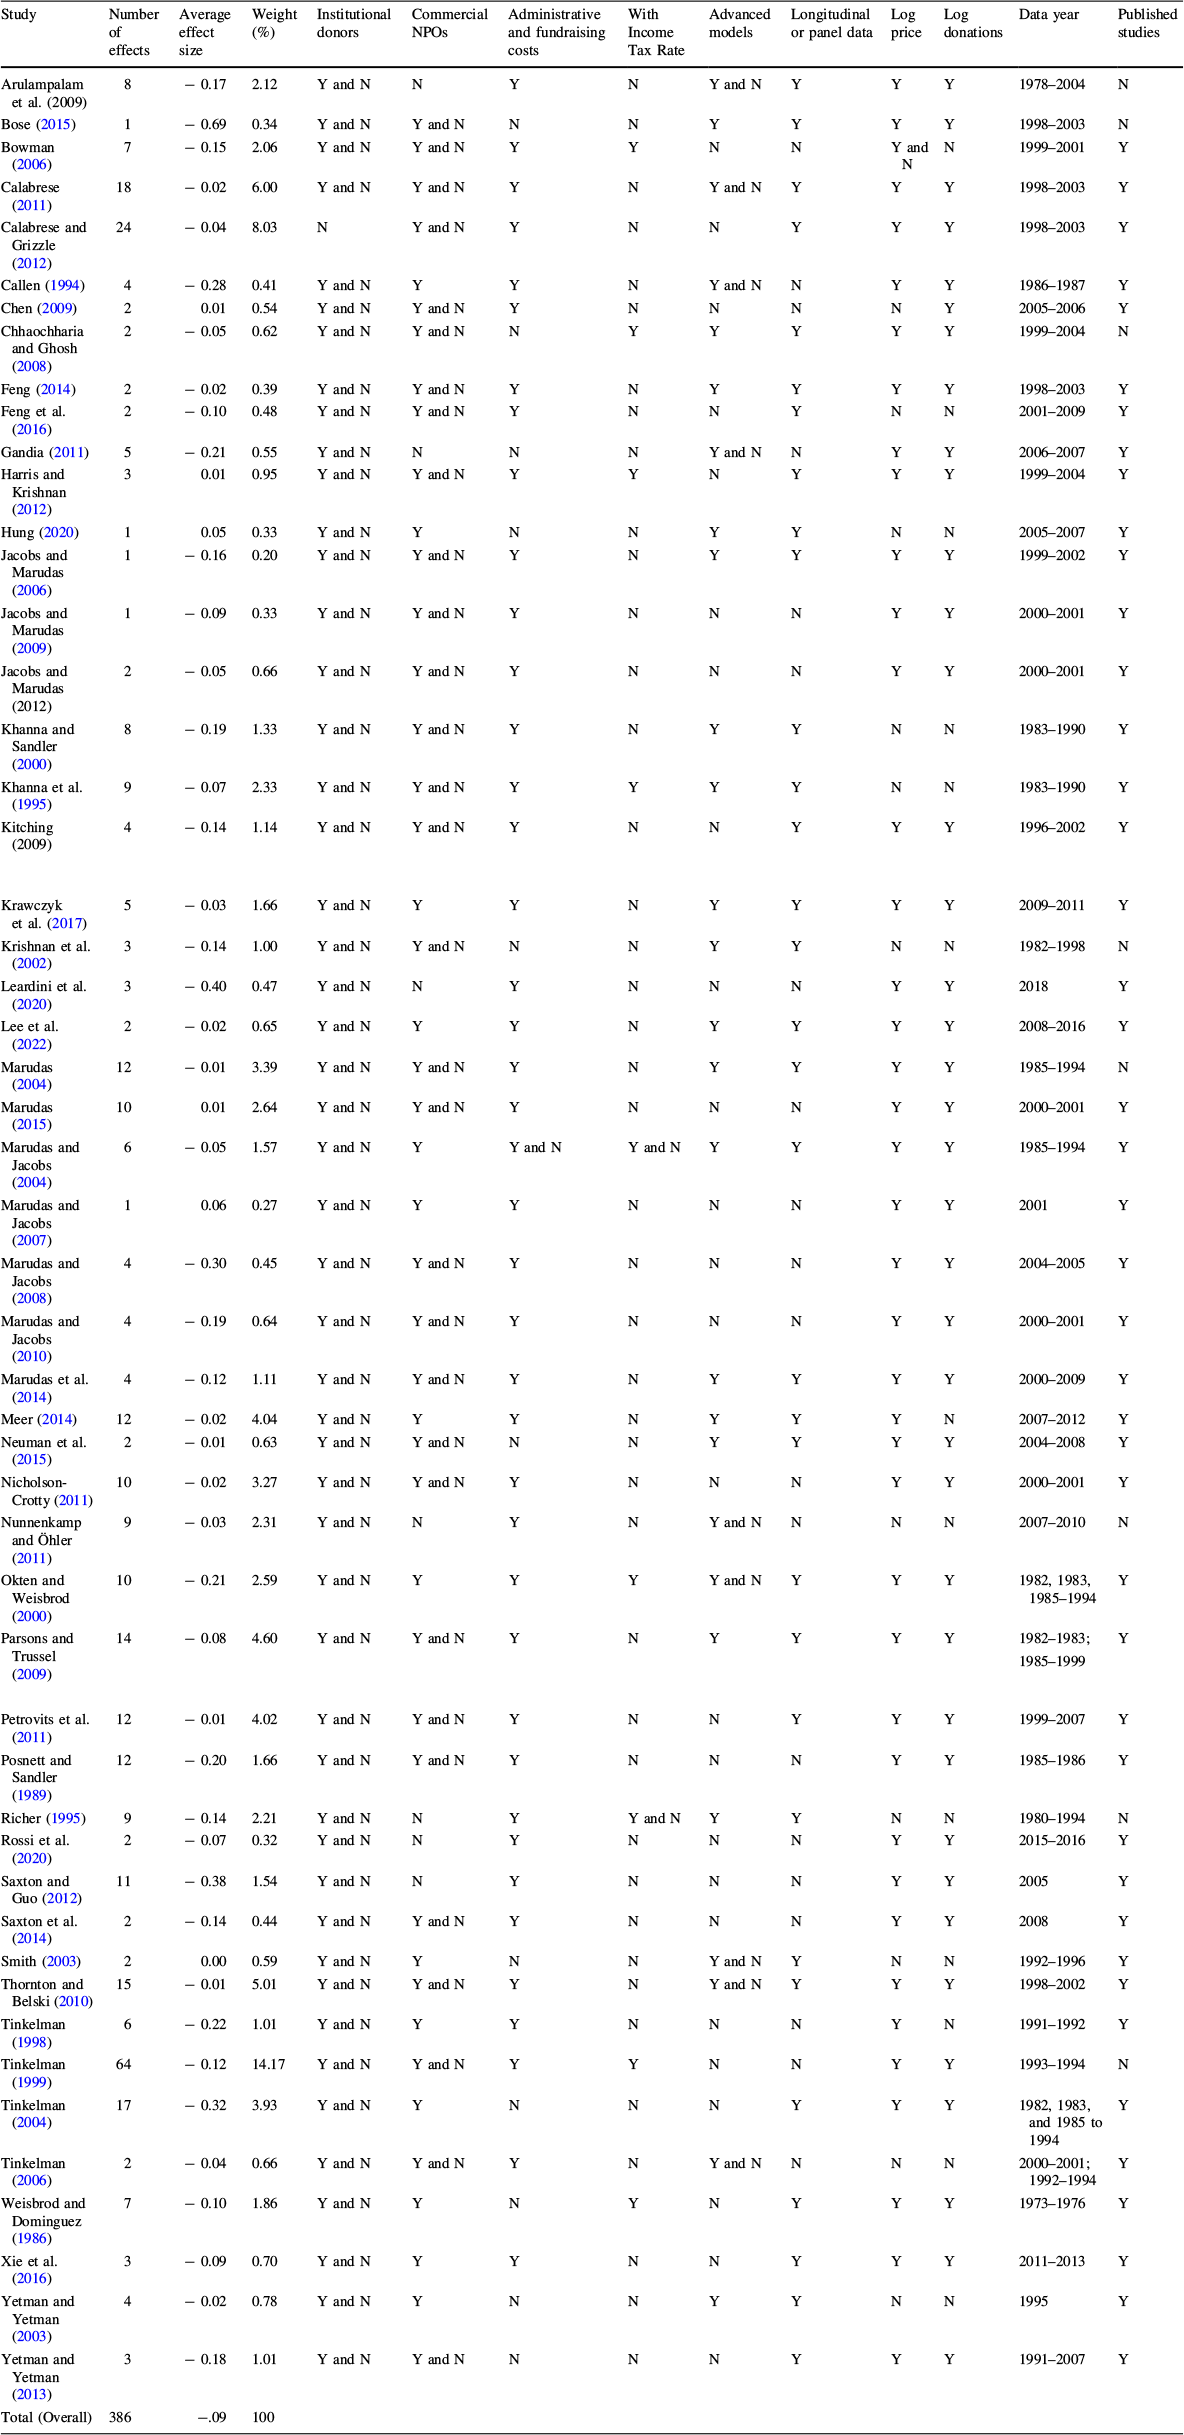
This procedure yields 386 effect sizes from the 52 eligible studies (Table 4 in the Appendix). Following Card (Reference Card2015) and Ringquist (Reference Ringquist2013), we transform each r into Fisher’s z. Of the 386 effect sizes, 44 indicate a positive association and 342 indicate a negative association. These effect sizes range from z = 0.27 (in Marudas, Reference Marudas2015) to z = − 0.69 (in Bose, Reference Bose2015).
While r is the primary effect size used in our meta-analysis, we also include elasticity to explore the percentage change in donations resulting from a 1% change in price.Footnote 4 Using elasticity reduces the number of relevant primary articles to 38 and the number of effect sizes to 310, as not all primary studies apply log transformations to both price and donations.
Meta-Regression Models
We conduct Hedge’s Q test and calculates I 2 statistics to choose between fixed-effect and random-effect frameworks. The result of Hedge’s Q test shows that there is variation in effect sizes that cannot be accounted for by sampling error alone. Also, the result of I 2 statistics reveals a high level of effect size variability. Therefore, we employ random-effects meta-regression models suggested by Hung and Lu (Reference Hung and Lu2022) and Ringquist (Reference Ringquist2013) to explore the variation in effect sizes due to assorted potential moderators. We use a cluster-robust variance estimation (CRVE) modeling approach since it allows us to address effect-size heteroscedasticity and non-independence of observations issues (Liang & Zeger, Reference Liang and Zeger1986; Ringquist, Reference Ringquist2013; White, Reference White1980). The dependent variable in the regression models is effect size, and the independent variables are the 10 moderators selected to explain the variation in effect sizes.
Results
Overall Effect
We combine the 386 effects to estimate an average effect size across studies using the random-effects framework. The summary effect magnitude and direction is − 0.09 (z = − 19.75, p < 0.01), with a 95% confidence interval of [− 0.09, − 0.08]. Therefore, when all eligible studies are considered together, the overall pattern indicates a negative and statistically significant association between the price of giving and donations. Donations decrease as the cost of purchasing charitable output increases. Moreover, the average elasticity is − 0.70 (z = − 40.67, p < 0.01), with a 95% confidence interval of [− 0.73, − 0.67]. The results suggest that, overall, donors are sensitive to the price of giving.
Moderator Analysis
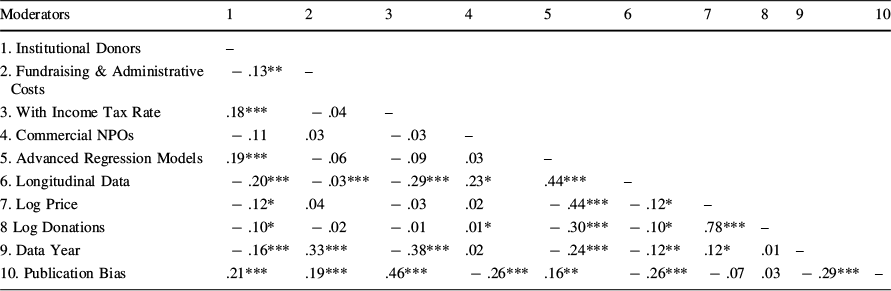
Before conducting meta-regression analysis to test whether the relationship between the price of giving and donations varies with the variety of moderators suggested above, we first check whether multicollinearity is present among the moderators. Our correlation analysis shows that effects generated from log-transformed price and from log-transformed donations correlate at 0.78. Therefore, we do not include the log-transformed price moderator in the same models with the log-transformed donations moderator. No other moderator intercorrelations approached 0.50 (Table 1).
Table 1 Correlations among the moderators

|
Moderators |
1 |
2 |
3 |
4 |
5 |
6 |
7 |
8 |
9 |
10 |
|---|---|---|---|---|---|---|---|---|---|---|
|
1. Institutional Donors |
– |
|||||||||
|
2. Fundraising & Administrative Costs |
− .13** |
– |
||||||||
|
3. With Income Tax Rate |
.18*** |
− .04 |
– |
|||||||
|
4. Commercial NPOs |
− .11 |
.03 |
− .03 |
– |
||||||
|
5. Advanced Regression Models |
.19*** |
− .06 |
− .09 |
.03 |
– |
|||||
|
6. Longitudinal Data |
− .20*** |
− .03*** |
− .29*** |
.23* |
.44*** |
– |
||||
|
7. Log Price |
− .12* |
.04 |
− .03 |
.02 |
− .44*** |
− .12* |
– |
|||
|
8 Log Donations |
− .10* |
− .02 |
− .01 |
.01* |
− .30*** |
− .10* |
.78*** |
– |
||
|
9. Data Year |
− .16*** |
.33*** |
− .38*** |
.02 |
− .24*** |
− .12** |
.12* |
.01 |
– |
|
|
10. Publication Bias |
.21*** |
.19*** |
.46*** |
− .26*** |
.16** |
− .26*** |
− .07 |
.03 |
− .29*** |
– |
N = 386 observations
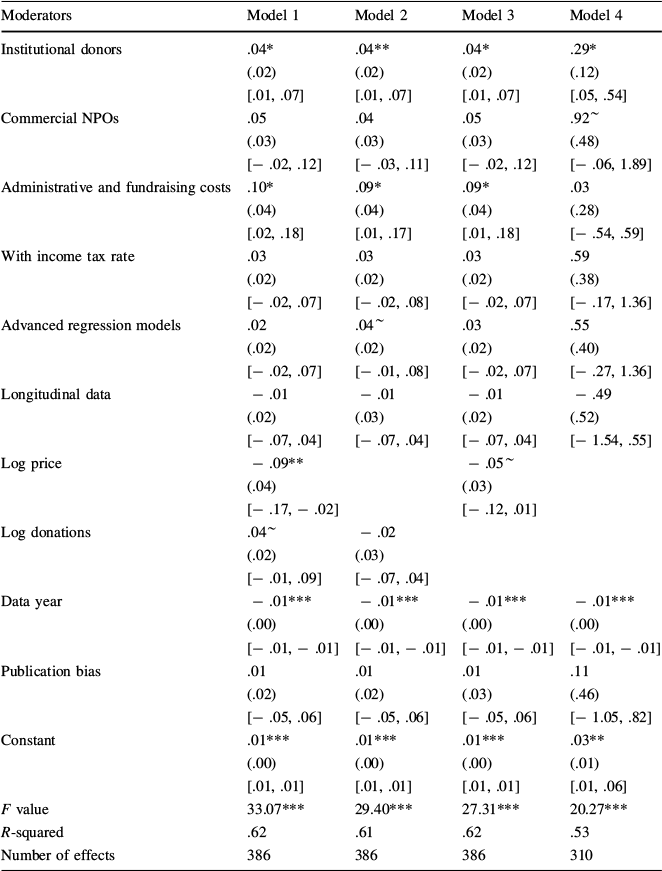
Table 2 presents results from random-effects CRVE models. Model 1 is a full model. We remove log-transformed price in Model 2 and log-transformed donations in Model 3. We replace r effect sizes with elasticity effect sizes in Model 4.
Table 2 CRVE model results

|
Moderators |
Model 1 |
Model 2 |
Model 3 |
Model 4 |
|---|---|---|---|---|
|
Institutional donors |
.04* (.02) [.01, .07] |
.04** (.02) [.01, .07] |
.04* (.02) [.01, .07] |
.29* (.12) [.05, .54] |
|
Commercial NPOs |
.05 (.03) [− .02, .12] |
.04 (.03) [− .03, .11] |
.05 (.03) [− .02, .12] |
.92~ (.48) [− .06, 1.89] |
|
Administrative and fundraising costs |
.10* (.04) [.02, .18] |
.09* (.04) [.01, .17] |
.09* (.04) [.01, .18] |
.03 (.28) [− .54, .59] |
|
With income tax rate |
.03 (.02) [− .02, .07] |
.03 (.02) [− .02, .08] |
.03 (.02) [− .02, .07] |
.59 (.38) [− .17, 1.36] |
|
Advanced regression models |
.02 (.02) [− .02, .07] |
.04~ (.02) [− .01, .08] |
.03 (.02) [− .02, .07] |
.55 (.40) [− .27, 1.36] |
|
Longitudinal data |
− .01 (.02) [− .07, .04] |
− .01 (.03) [− .07, .04] |
− .01 (.02) [− .07, .04] |
− .49 (.52) [− 1.54, .55] |
|
Log price |
− .09** (.04) [− .17, − .02] |
− .05~ (.03) [− .12, .01] |
||
|
Log donations |
.04~ (.02) [− .01, .09] |
− .02 (.03) [− .07, .04] |
||
|
Data year |
− .01*** (.00) [− .01, − .01] |
− .01*** (.00) [− .01, − .01] |
− .01*** (.00) [− .01, − .01] |
− .01*** (.00) [− .01, − .01] |
|
Publication bias |
.01 (.02) [− .05, .06] |
.01 (.02) [− .05, .06] |
.01 (.03) [− .05, .06] |
.11 (.46) [− 1.05, .82] |
|
Constant |
.01*** (.00) [.01, .01] |
.01*** (.00) [.01, .01] |
.01*** (.00) [.01, .01] |
.03** (.01) [.01, .06] |
|
F value |
33.07*** |
29.40*** |
27.31*** |
20.27*** |
|
R-squared |
.62 |
.61 |
.62 |
.53 |
|
Number of effects |
386 |
386 |
386 |
310 |
Robust standard errors in parentheses; confidence intervals in brackets; ~ p ≤ .10; *p ≤ .05; **p ≤ .01; ***p ≤ .001. Model 1 includes all moderators in the analysis. Model 2 excludes Log Price due to its high correlation with Log Donation. Conversely, Model 3 excludes Log Donation because of its high correlation with Log Price. Unlike the first three models, which utilize r effect sizes for analysis, Model 4 employs elasticity effect sizes, as recommended by a reviewer
Substantive Factors
Individual vs. Institutional Donors
The average effect size for individual donors (85.29% of the effects) is − 0.05 while the average effect size for institutional donors (14.71%) is − 0.01. We find across the models in Table 2 that effects derived from previous studies that focus on institutional donors are more positive, on average, than effects reported from studies that focus on individual donors. In other words, other things being the same, the price would have a less negative effect in crowding out institutional donations than in crowding out individual donations.
Donative NPOs vs. Commercial NPOs
The average effect size for donative NPOs (32.09% of the effects) is − 0.16 while the average effect size for commercial NPOs (67.91%) is − 0.09. However , the coefficient for commercial NPOs is not statistically significant in all four models in Table 2, except for Model 4, where it is marginally statistically significant. This result implies that donors seem not to differentiate donative and commercial NPOs when considering the price in their donation decisions. The results persist when we run robustness tests that use several different methods to categorize NPOs (see Table 3 in the Appendix for the categorizations).Footnote 5
Price Calculation
Fundraising Costs Only vs. Administrative and Fundraising Costs
The average effect size for fundraising costs only (15.03% of the effects) is − 0.19 while the average effect size for administrative and fundraising costs (84.97%) is − 0.09. We find across the models in Table 2 that effects derived from previous studies that measure both administrative and fundraising expenses are more positive, on average, than effects reported from studies that only measure fundraising expenses, except for Model 4, where it is not statistically significant. Because of this, we hesitate to suggest that the relationship between the price and donations varies depending on this distinction.
Without Income Tax Rate vs. With Income Tax Rate
This moderator compares the studies specifying price with and without income tax rate. The average effect size for without income tax rate (71.24% of the effects) is − 0.10, while the average effect size for with income tax rate (28.76%) is − 0.12. The coefficients for the moderator in all four models in Table 2 are not significant. In other words, effects generated from previous studies that include the tax rate are not statistically different from effects generated from previous studies that exclude the tax rate.
Research Characteristics
Basic vs. Advanced Regression Models
The average effect size for basic models (73.06% of the effects) is − 0.12 while the average effect size for advanced models (26.94%) is − 0.08. Despite that advanced regression models are considered superior to basic regression models, our moderator analysis indicates that the effects derived from advanced regression models are not significantly different from the effects reported from basic regression models across all four models in Table 2, except for Model 2, where it is marginally statistically significant. Regression model seems not to matter significantly to the price-donation relationship.
Cross-Sectional vs. Longitudinal Data
The average effect size for cross-sectional data (41.45% of the effects) is − 0.14, while the average effect size for longitudinal data (58.55%) is − 0.09. Similar to the moderating effect of regression model, the moderator analysis finds that on average the results from cross-sectional analyses are not statistically different from those from longitudinal analyses. Data structure does not seem to affect the estimates of the price-donation relationship.
Non-Log Price vs. Log Price
The average effect size for non-log price (13.73% of the effects) is − 0.09 while the average effect size for log price (86.27%) is − 0.11. Efforts to make skewed original data more normally distributed by taking natural logarithm of variables are expected to produce better estimators, which in turn might be more sensitive in calculating the magnitude and direction of the relationship between the price of giving and donations. Although we find a statistically significant result in Model 1 in Table 2, the statistically significant result turns marginal in Model 3 where the moderator “log-transformed donations” is removed due to its high correlation with “log-transformed price.” The results of our moderator analysis thus cannot confirm the value of the effort to take natural logarithm of the price of giving.
Non-Log Donations vs. Log Donations
The average effect size for non-log donations (19.17% of the effects) is − 0.10 while the average effect size for log donations (80.83%) is − 0.11. The same conclusion can be drawn from the results of the moderator analysis of log-transformed donations. Effect sizes in analyses of the relationship between the price of giving and nonprofit donations do not differ according to whether researchers take natural logarithm of donations or not.
Data Year
Our moderator for data year tests whether donors’ sensitivity to the price of giving varies over time. The coefficients across the models in Table 2 indicate that effect sizes turn more negative as time goes by. In other words, more recent studies tend to produce more negative price effects on donations.
Publication Bias
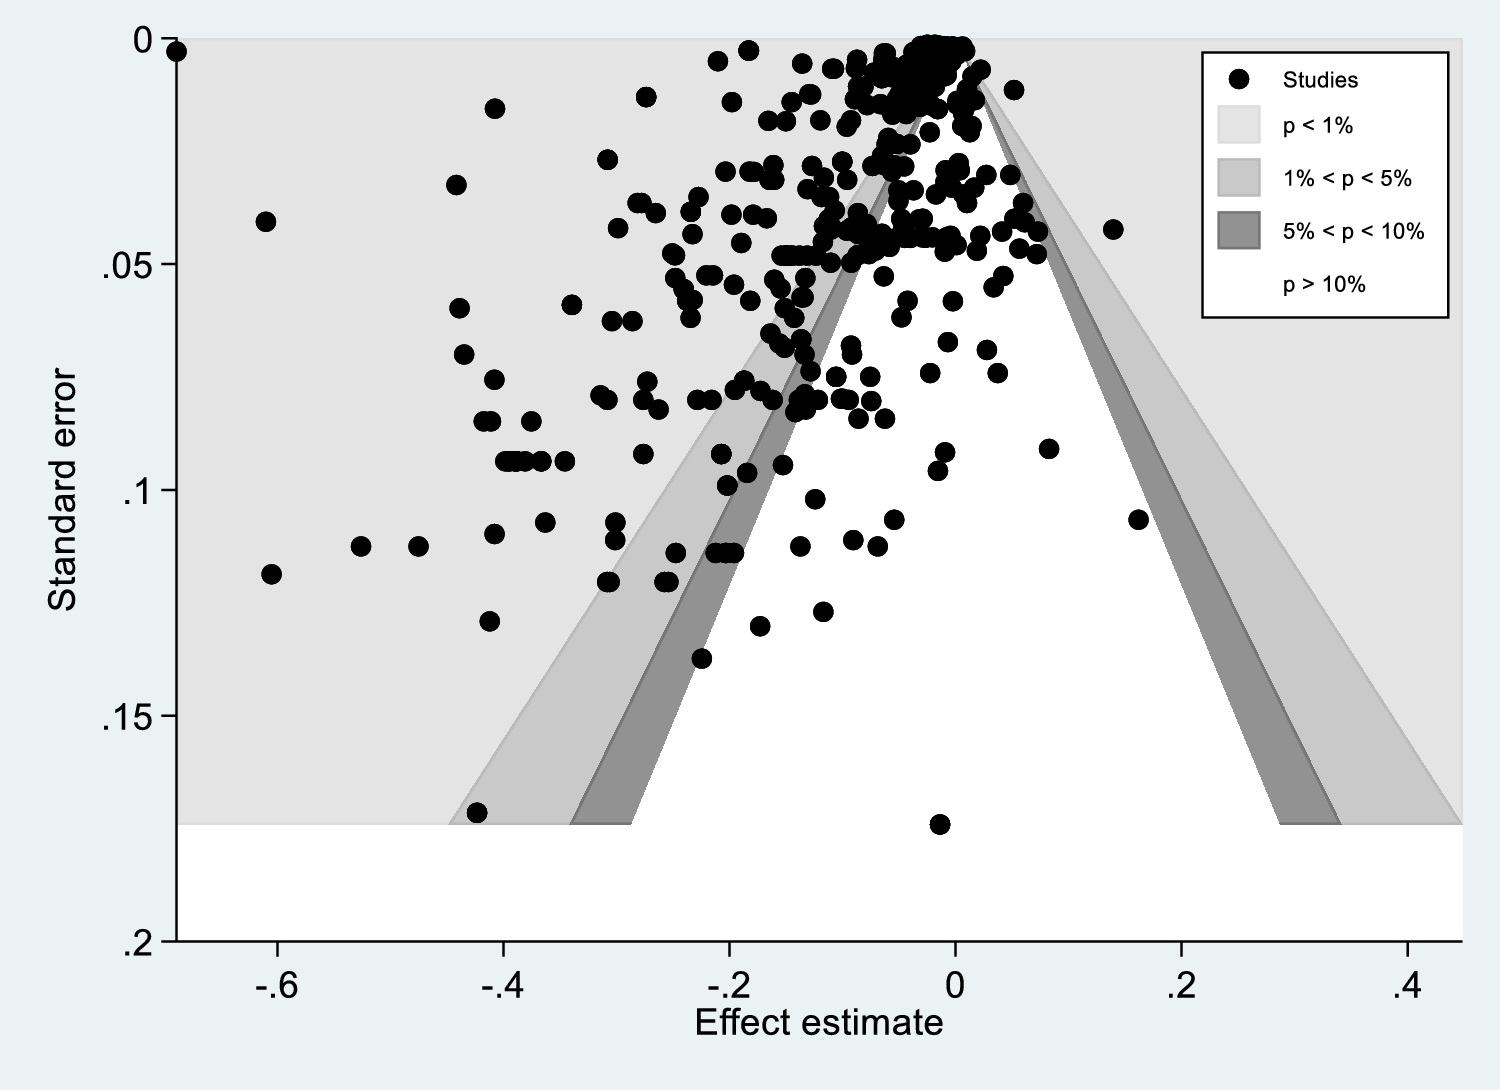
The average effect size for published studies (68.65% of the effects) is − 0.11 while the average effect size for unpublished studies (31.35%) is − 0.10. Our moderator on publication bias is not statistically significant in any of the four models in Table 2. This result suggests that the effects from unpublished studies such as working papers and conference papers are not different from the ones from published studies. The result is consistent with the contour-enhanced funnel plot shown in Fig. 2 in the Appendix, where studies appear not to be missing in areas of low statistical significance. Publication bias therefore does not seem to undermine our present analysis.
Discussion and Conclusion
In the literature, the impact of the price of giving on charitable donations has been subject to extensive scrutiny, but the empirical evidence has been inconsistent. We conduct a meta-analysis to synthesize the empirical findings on the price-donation relationship across existing studies, to estimate a generalized effect and explore underlying moderators.
We find that the price of giving generally has a significant, negative association with charitable donations. The negative direction of the relationship suggests nonprofits with higher prices of giving tend to receive less charitable donations. In other words, donors are sensitive to the price of giving, and thus the price is a relevant factor in donation decisions. The finding concurs with some studies in suggesting that donors are sophisticated agents who consider costs and benefits while making giving decisions (e.g., Bekkers & Wiepking, Reference Bekkers and Wiepking2011; Wong & Ortmann, Reference Wong and Ortmann2016). The finding contributes to the literature by providing an empirical integration of the extant empirical evidence across studies and offering a more accurate interpretation of the previous findings. The results thus lay the foundation for further explorations of antecedents of private giving.
In addition to estimating a generalized effect of the price of giving on donations, we also explore the moderators that could help account for different results in existing studies. The findings contribute new knowledge to the literature in several ways. First, we examine whether the substantive factors moderate the price-donation relationship; the results present a mixed but interesting picture. The analysis highlights the moderating effect of donor type: compared with studies on individual donors, studies on institutional donors report a more favorable effect of the price on donations. In other words, institutional donors seem to be less sensitive to the price when making donation decisions. This difference may stem from institutional donors, such as foundations, being required to pay out 5% of their asset base annually (whether based on last year’s asset base or a moving average of several years), while individual donors are not required to donate at all. Consequently, it would be surprising if foundations exhibited the same level of price sensitivity as individual donors.Footnote 6 Moreover, institutional donors, as organizations, may have a better understanding of the components included in the price (e.g., necessity of administrative and fundraising costs). They may also be more capable of gathering organizational information to inform their donation decisions, resulting in less reliance on the price. Importantly, institutional donors may also be more aware of the conceptual limitations of the WD price itself. As noted in prior literature, the WD price conflates average and marginal costs (Steinberg, Reference Steinberg and Rose-Ackerman1986), fails to account for key factors such as prospecting, lagged effects, and Rose-Ackerman’s (Reference Rose-Ackerman1982) multiplier effect, and overlooks the broader impact on nonprofit mission attainment, such as the influence of induced volunteering or the unintended consequences of fundraising on mission delivery. Thus, institutional donors’ reduced sensitivity may not only reflect structural or informational advantages but also a more critical view of the WD price’s validity as a proxy for the “true” cost of giving. Hung et al. (Reference Hung, Hager and Tian2023) further support this idea, finding that donors who incorporate NPOs’ financial and program performance information into their giving decisions are more likely to invest time in understanding the operations of the subject NPOs.
In contrast, the effect of NPO type on the price-donation relationship, if any, is hard to detect from analysis of existing studies. NPO type may matter for two possible reasons. Commercial NPOs, due to their attention to the market mechanism and business operations, may be perceived by donors as more efficient. As such, price-sensitive donors could be more willing to give to commercial NPOs. Also, given donative NPOs’ heavy reliance on charitable donations, donors may care more about NPOs’ costs of producing charitable output. However, the meta-regression finds no support for the moderating effect of NPO type. The finding is robust to different categorizations of NPO type. In other words, the price-donation relationship is largely consistent across commercial and donative NPOs. Some previous literature suggests that people’s stereotypical understandings of NPO type matter, as they would create ideological perceptions of and reactions to different types of NPOs (e.g., Xu & Li, Reference Xu and Li2022). Our finding lends no support for the impact of this stereotype in the context of how donors respond to the price of giving.
Second, we explore whether and how price calculation matters to the price-donation relationship, with attention to both the numerator (marginal income tax rate) and denominator (administrative and fundraising costs) of the price formula. On the numerator side, although Weisbrod and Dominguez’s (Reference Weisbrod and Dominguez1986) original work includes donors’ marginal income tax rate as part of the price, later studies do not always include the tax rate in calculating the price, largely due to data availability. Conceptually, studies that disregard taxes may introduce measurement error bias when calculating the price of giving, potentially resulting in biased results. However, no study has examined whether the exclusion of tax rate matters to the estimates of the price-donation relationship empirically. Our analysis suggests that studies excluding the tax rate in the price calculation do not on average produce significantly different results from those including the tax rate.Footnote 7 This finding may provide support for the treatment of excluding the tax rate in the price calculation in previous studies. As Khanna et al., (Reference Khanna, Posnett and Sandler1995, p. 261) write, “By dropping tax deductibility, our price differs from the true price by a positive random variable. The expected value of the resulting bias for price elasticity, however, is zero.”
Regarding the denominator in the price calculation, studies that consider only fundraising costs may introduce measurement errors compared to those that include both fundraising and administrative costs. However, similar to the tax rate, it is unclear whether the denominator significantly affects the price-donation relationship. Our meta-regression compares these two groups of effects, revealing a mixed picture. When using correlation coefficients to measure the effect, including both administrative and fundraising costs in calculating the price of giving produces significantly different results compared to using fundraising costs alone, suggesting that correlation measures are sensitive to how the price is defined. Conversely, when using elasticity to measure the effect, the results remain consistent regardless of whether administrative costs are included. This suggests that elasticity may be a more robust measure in assessing the impact of the price of giving on charitable donations, as it is unaffected by variations in price calculation. Given the sensitivity of correlation measures, researchers should exercise caution when interpreting such results. Further investigation could explore why elasticity remains stable despite changes in price calculation, potentially providing deeper insights into donor behavior and the factors driving charitable giving.
Third, we examine whether research design affects the results concerning the price-donation relationship. Following Wong and Ortmann’s (Reference Wong and Ortmann2016) proposition that the inconsistent results in the literature could result from the econometric tools and data used, we focus on the effects of four potential moderators: econometric methods, data structure, data year, and log transformation. The results show a mixed picture. On the one hand, our analysis shows the moderating effect of data year. Studies employing more recent data produce more negative results than those employing older data. In other words, donors become more sensitive to the price of giving over time. The finding is consistent with the notion that donors pay increasing attention to NPOs’ information and thus become more sophisticated in their donation decisions (Yetman & Yetman, Reference Yetman and Yetman2013). It also is consistent with the literature that NPO information become increasingly accessible to donors (e.g., Saxton et al., Reference Saxton, Neely and Guo2014). On the other hand, the analysis does not provide significant support for the moderating effects of the other three factors: econometric methods, data structure, and log transformation. Specifically, despite previous studies arguing and finding that these might be the factors causing inconsistent results in the price-donation relationship (Tinkelman, Reference Tinkelman1999; Tinkelman & Mankaney, Reference Tinkelman and Mankaney2007; Wong & Ortmann, Reference Wong and Ortmann2016), when estimating the relationship among existing studies, there appears to be no discernible difference based on whether a study uses basic or advanced econometric tools, cross-sectional or longitudinal data, logged donations, or non-logged donations. Future research can employ more nuanced approaches or include other research design factors to examine the variation.
It is important to note that the present analysis involves a number of limitations. First, we could not include all potential moderators in the analysis since meta-analysis can only examine factors that are explicit in existing studies. Unobserved heterogeneity and residual specification errors may still exist, which could affect the interpretation of our aggregated results. For example, we investigated the moderating effects of donor type and nonprofit type individually. However, due to the limited number of studies examining the interaction effect between donor type and nonprofit type, we were unable to consider this interaction in our meta-analysis. Moreover, data on regulatory frameworks, government funding, and organizational characteristics are not available from the existing studies. These gaps in the literature present an opportunity for future research to explore. Second, given that all studies included in the analysis rely on observational data, we acknowledge the potential limitations of non-experimental studies. Consequently, our study may inflate the effect sizes (Kvarven et al., Reference Kvarven, Strømland and Johannesson2020) and the findings may imply association rather than causality. Future research could add value by employing experimental designs to explore this relationship further and validate our findings.
We conclude that donors are sensitive to the price of giving. They punish NPOs with a higher price by giving smaller donations. Moreover, we offer evidence that individual donors seem to be more sensitive to the price than institutional donors when making giving decisions and that donors become more sensitive to the price of giving over time. These factors explain the variation in the price-donation relationship within and across empirical studies.
Appendix
See Fig. 2 and Tables 3 and 4.

Fig. 2 Contour-enhanced funnel plot for publication bias
Table 3 Moderator coding
|
Moderators |
Coding |
|---|---|
|
Individual vs. Institutional Donors |
We code our dummy variable as 0 for individual donors and 1 for institutional donors. Individual donors mostly contribute small amounts, while institutional donors, such as corporations and foundations, contribute larger sums |
|
Donative NPOs vs. Commercial NPOs |
Effects derived from studies focused on donative NPOs are coded 0, and effects derived from studies focused on commercial NPOs are coded 1. We classify nonprofits into two dichotomous groups: the donative group and the commercial group. Nonprofits in the "Environment and Animals," "Philanthropy and Public Benefit," "International Development and Foreign Affairs," "Religion," and "Support Organization" subsectors are classified as part of the donative group, while those in the "Education," "Health Care and Hospitals," "Human Services," "Arts and Culture," "Recreation and Sports," and "Social and Fraternal" subsectors are classified as part of the commercial group. However, we recognize that the "Human Services" and "Arts and Culture" subsectors encompass a wide range of organizations, some of which may rely more on donations than others. To ensure the robustness of our results, we create four additional classifications to test for consistency. The first classification moves the "Human Services" subsector to the donative group from the commercial one. The second classification moves the "Arts and Culture" subsector to the donative group from the commercial one. The third classification moves both the "Human Services" and "Arts and Culture" subsectors to the donative group from the commercial one. Finally, the fourth classification moves both the "Human Services" and "Arts and Culture" subsectors to a newly created group called "Mixed" from the commercial one |
|
Fundraising Costs Only vs. Administrative and Fundraising Costs |
Effects generated from previous studies that only include fundraising costs are coded as 0, whereas effects generated from previous studies that include both fundraising and administrative costs are coded as 1 |
|
Without Income Tax Rate vs. With Income Tax Rate |
We code 0 for without the tax rate and 1 with the tax rate |
|
Basic vs. Advanced Regression Models |
We code 0 for basic models (e.g., Ordinary Least Squares and tobit models) and 1 for advanced models (e.g., fixed effects, random effects, and two-stage least squares models) |
|
Cross-Sectional vs. Longitudinal and Panel Data |
Effects derived from cross-sectional data are coded 0, and effects derived from longitudinal and panel data are coded 1 |
|
Non-Log Price vs. Log Price |
We code 0 for non-log price and 1 for log-transformed price |
|
Non-Log Donations vs. Log Donations |
We code 0 for non-log donations and 1 for log-transformed donations |
|
Data Year |
This moderator represents the year when the data used in an eligible study were collected. For longitudinal studies, we designate the middle year as the year when the data were collected |
|
Publication Bias |
We code 0 for published studies and 1 for unpublished studies |
Table 4 Selected studies, effects, and moderator characteristics (n = 52 studies, 386 effects)

|
Study |
Number of effects |
Average effect size |
Weight (%) |
Institutional donors |
Commercial NPOs |
Administrative and fundraising costs |
With Income Tax Rate |
Advanced models |
Longitudinal or panel data |
Log price |
Log donations |
Data year |
Published studies |
|---|---|---|---|---|---|---|---|---|---|---|---|---|---|
|
Arulampalam et al. (2009) |
8 |
− 0.17 |
2.12 |
Y and N |
N |
Y |
N |
Y and N |
Y |
Y |
Y |
1978–2004 |
N |
|
Bose (Reference Bose2015) |
1 |
− 0.69 |
0.34 |
Y and N |
Y and N |
N |
N |
Y |
Y |
Y |
Y |
1998–2003 |
N |
|
Bowman (Reference Bowman2006) |
7 |
− 0.15 |
2.06 |
Y and N |
Y and N |
Y |
Y |
N |
N |
Y and N |
N |
1999–2001 |
Y |
|
Calabrese (Reference Calabrese2011) |
18 |
− 0.02 |
6.00 |
Y and N |
Y and N |
Y |
N |
Y and N |
Y |
Y |
Y |
1998–2003 |
Y |
|
Calabrese and Grizzle (Reference Calabrese and Grizzle2012) |
24 |
− 0.04 |
8.03 |
N |
Y and N |
Y |
N |
N |
Y |
Y |
Y |
1998–2003 |
Y |
|
Callen (Reference Callen1994) |
4 |
− 0.28 |
0.41 |
Y and N |
Y |
Y |
N |
Y and N |
N |
Y |
Y |
1986–1987 |
Y |
|
Chen (Reference Chen2009) |
2 |
0.01 |
0.54 |
Y and N |
Y and N |
Y |
N |
N |
N |
N |
Y |
2005–2006 |
Y |
|
Chhaochharia and Ghosh (Reference Chhaochharia and Ghosh2008) |
2 |
− 0.05 |
0.62 |
Y and N |
Y and N |
N |
Y |
Y |
Y |
Y |
Y |
1999–2004 |
N |
|
Feng (Reference Feng2014) |
2 |
− 0.02 |
0.39 |
Y and N |
Y and N |
Y |
N |
Y |
Y |
Y |
Y |
1998–2003 |
Y |
|
Feng et al. (Reference Feng, Neely and Slatten2016) |
2 |
− 0.10 |
0.48 |
Y and N |
Y and N |
Y |
N |
N |
Y |
N |
N |
2001–2009 |
Y |
|
Gandia (Reference Gandia2011) |
5 |
− 0.21 |
0.55 |
Y and N |
N |
N |
N |
Y and N |
N |
Y |
Y |
2006–2007 |
Y |
|
Harris and Krishnan (Reference Harris and Krishnan2012) |
3 |
0.01 |
0.95 |
Y and N |
Y and N |
Y |
Y |
N |
Y |
Y |
Y |
1999–2004 |
Y |
|
Hung (Reference Hung2020) |
1 |
0.05 |
0.33 |
Y and N |
Y |
N |
N |
Y |
Y |
N |
N |
2005–2007 |
Y |
|
Jacobs and Marudas (Reference Jacobs and Marudas2006) |
1 |
− 0.16 |
0.20 |
Y and N |
Y and N |
Y |
N |
Y |
Y |
Y |
Y |
1999–2002 |
Y |
|
Jacobs and Marudas (Reference Jacobs and Marudas2009) |
1 |
− 0.09 |
0.33 |
Y and N |
Y and N |
Y |
N |
N |
N |
Y |
Y |
2000–2001 |
Y |
|
Jacobs and Marudas (2012) |
2 |
− 0.05 |
0.66 |
Y and N |
Y and N |
Y |
N |
N |
N |
Y |
Y |
2000–2001 |
Y |
|
Khanna and Sandler (Reference Khanna and Sandler2000) |
8 |
− 0.19 |
1.33 |
Y and N |
Y and N |
Y |
N |
Y |
Y |
N |
N |
1983–1990 |
Y |
|
Khanna et al. (Reference Khanna, Posnett and Sandler1995) |
9 |
− 0.07 |
2.33 |
Y and N |
Y and N |
Y |
Y |
Y |
Y |
N |
N |
1983–1990 |
Y |
|
Kitching (2009) |
4 |
− 0.14 |
1.14 |
Y and N |
Y and N |
Y |
N |
N |
Y |
Y |
Y |
1996–2002 |
Y |
|
Krawczyk et al. (Reference Krawczyk, Wooddell and Dias2017) |
5 |
− 0.03 |
1.66 |
Y and N |
Y |
Y |
N |
Y |
Y |
Y |
Y |
2009–2011 |
Y |
|
Krishnan et al. (Reference Krishnan, Yetman and Yetman2002) |
3 |
− 0.14 |
1.00 |
Y and N |
Y and N |
N |
N |
Y |
Y |
N |
N |
1982–1998 |
N |
|
Leardini et al. (Reference Leardini, Rossi and Landi2020) |
3 |
− 0.40 |
0.47 |
Y and N |
N |
Y |
N |
N |
N |
Y |
Y |
2018 |
Y |
|
Lee et al. (Reference Lee, Lu and Shon2022) |
2 |
− 0.02 |
0.65 |
Y and N |
Y |
Y |
N |
Y |
Y |
Y |
Y |
2008–2016 |
Y |
|
Marudas (Reference Marudas2004) |
12 |
− 0.01 |
3.39 |
Y and N |
Y and N |
Y |
N |
Y |
Y |
Y |
Y |
1985–1994 |
N |
|
Marudas (Reference Marudas2015) |
10 |
0.01 |
2.64 |
Y and N |
Y and N |
Y |
N |
N |
N |
Y |
Y |
2000–2001 |
Y |
|
Marudas and Jacobs (Reference Marudas and Jacobs2004) |
6 |
− 0.05 |
1.57 |
Y and N |
Y |
Y and N |
Y and N |
Y |
Y |
Y |
Y |
1985–1994 |
Y |
|
Marudas and Jacobs (Reference Marudas and Jacobs2007) |
1 |
0.06 |
0.27 |
Y and N |
Y |
Y |
N |
N |
N |
Y |
Y |
2001 |
Y |
|
Marudas and Jacobs (Reference Marudas and Jacobs2008) |
4 |
− 0.30 |
0.45 |
Y and N |
Y and N |
Y |
N |
N |
N |
Y |
Y |
2004–2005 |
Y |
|
Marudas and Jacobs (Reference Marudas and Jacobs2010) |
4 |
− 0.19 |
0.64 |
Y and N |
Y and N |
Y |
N |
N |
N |
Y |
Y |
2000–2001 |
Y |
|
Marudas et al. (Reference Marudas, Hahn and Jacobs2014) |
4 |
− 0.12 |
1.11 |
Y and N |
Y and N |
Y |
N |
Y |
Y |
Y |
Y |
2000–2009 |
Y |
|
Meer (Reference Meer2014) |
12 |
− 0.02 |
4.04 |
Y and N |
Y |
Y |
N |
Y |
Y |
Y |
N |
2007–2012 |
Y |
|
Neuman et al. (Reference Neuman, Omer and Thompson2015) |
2 |
− 0.01 |
0.63 |
Y and N |
Y and N |
N |
N |
Y |
Y |
Y |
Y |
2004–2008 |
Y |
|
Nicholson‐Crotty (Reference Nicholson-Crotty2011) |
10 |
− 0.02 |
3.27 |
Y and N |
Y and N |
Y |
N |
N |
N |
Y |
Y |
2000–2001 |
Y |
|
Nunnenkamp and Öhler (Reference Nunnenkamp and Öhler2011) |
9 |
− 0.03 |
2.31 |
Y and N |
N |
Y |
N |
Y and N |
N |
N |
N |
2007–2010 |
N |
|
Okten and Weisbrod (Reference Okten and Weisbrod2000) |
10 |
− 0.21 |
2.59 |
Y and N |
Y |
Y |
Y |
Y and N |
Y |
Y |
Y |
1982, 1983, 1985–1994 |
Y |
|
Parsons and Trussel (Reference Parsons and Trussel2009) |
14 |
− 0.08 |
4.60 |
Y and N |
Y and N |
Y |
N |
Y |
Y |
Y |
Y |
1982–1983; 1985–1999 |
Y |
|
Petrovits et al. (Reference Petrovits, Shakespeare and Shih2011) |
12 |
− 0.01 |
4.02 |
Y and N |
Y and N |
Y |
N |
N |
Y |
Y |
Y |
1999–2007 |
Y |
|
Posnett and Sandler (Reference Posnett and Sandler1989) |
12 |
− 0.20 |
1.66 |
Y and N |
Y and N |
Y |
N |
N |
N |
Y |
Y |
1985–1986 |
Y |
|
Richer (Reference Richer1995) |
9 |
− 0.14 |
2.21 |
Y and N |
N |
Y |
Y and N |
Y |
Y |
N |
N |
1980–1994 |
N |
|
Rossi et al. (Reference Rossi, Leardini and Landi2020) |
2 |
− 0.07 |
0.32 |
Y and N |
N |
Y |
N |
N |
N |
Y |
Y |
2015–2016 |
Y |
|
Saxton and Guo (Reference Saxton and Guo2012) |
11 |
− 0.38 |
1.54 |
Y and N |
N |
Y |
N |
N |
N |
Y |
Y |
2005 |
Y |
|
Saxton et al. (Reference Saxton, Neely and Guo2014) |
2 |
− 0.14 |
0.44 |
Y and N |
Y and N |
Y |
N |
N |
N |
Y |
Y |
2008 |
Y |
|
Smith (Reference Smith2003) |
2 |
0.00 |
0.59 |
Y and N |
Y |
N |
N |
Y and N |
Y |
N |
N |
1992–1996 |
Y |
|
Thornton and Belski (Reference Thornton and Belski2010) |
15 |
− 0.01 |
5.01 |
Y and N |
Y and N |
Y |
N |
Y and N |
Y |
Y |
Y |
1998–2002 |
Y |
|
Tinkelman (Reference Tinkelman1998) |
6 |
− 0.22 |
1.01 |
Y and N |
Y |
Y |
N |
N |
N |
Y |
N |
1991–1992 |
Y |
|
Tinkelman (Reference Tinkelman1999) |
64 |
− 0.12 |
14.17 |
Y and N |
Y and N |
Y |
Y |
N |
N |
Y |
Y |
1993–1994 |
N |
|
Tinkelman (Reference Tinkelman2004) |
17 |
− 0.32 |
3.93 |
Y and N |
Y |
N |
N |
N |
Y |
Y |
Y |
1982, 1983, and 1985 to 1994 |
Y |
|
Tinkelman (Reference Tinkelman2006) |
2 |
− 0.04 |
0.66 |
Y and N |
Y and N |
Y |
N |
Y and N |
N |
N |
N |
2000–2001; 1992–1994 |
Y |
|
Weisbrod and Dominguez (Reference Weisbrod and Dominguez1986) |
7 |
− 0.10 |
1.86 |
Y and N |
Y |
N |
Y |
N |
Y |
Y |
Y |
1973–1976 |
Y |
|
Xie et al. (Reference Xie, Lu, Huang, Wang and Pei2016) |
3 |
− 0.09 |
0.70 |
Y and N |
Y |
Y |
N |
N |
Y |
Y |
Y |
2011–2013 |
Y |
|
Yetman and Yetman (Reference Yetman and Yetman2003) |
4 |
− 0.02 |
0.78 |
Y and N |
Y |
N |
N |
Y |
Y |
N |
N |
1995 |
Y |
|
Yetman and Yetman (Reference Yetman and Yetman2013) |
3 |
− 0.18 |
1.01 |
Y and N |
Y and N |
N |
N |
N |
Y |
Y |
Y |
1991–2007 |
Y |
|
Total (Overall) |
386 |
−.09 |
100 |
||||||||||
Y stands for Yes and N stands for No; NPOs in the education, health care and hospitals, human services, arts and culture, recreation and sports, and social and fraternal subsectors are categorized into commercial group, whereas NPOs in the environment and animals, philanthropy and public benefit, international development and foreign affairs, religion, and support organization subsectors are categorized into donative group, In our analysis, data year represents the year when the data used in an eligible study are collected. For those studies that use longitudinal data, we use the middle value of the year ranges
Funding
This study was not funded by any organization.
Declarations
Conflict of interest
The authors declare that they have no conflict of interests.
Ethical Approval
This study does not involve Human Participants and/or Animals.


 Open access