


Statement of Research Significance
Research Question(s) or Topic(s): Pediatric traumatic brain injury can lead to difficulties with complex cognitive skills like attention, problem solving, and organization. This may be because of how brain injury affects whether and how different regions of the brain communicate with each other in “networks”. Main Findings: We examined patterns of network communication in youth with brain injury compared to non-brain injured peers, and whether these alterations were linked with difficulties with complex cognitive skills in day-to-day life. We found that the expected link between the default mode network (DMN) and the salience network (when one ramps up, the other tones down) was dampened or absent in youth with brain injury. The extent of dampening of this network connection was significantly related to difficulties with cognitive skills. Study Contributions: This suggests that the strength of between-network disruption is one potential explanation of some of the cognitive consequences of pediatric brain injury.
Introduction
Traumatic brain injury (TBI) is a leading cause of death and disability in children and adolescents (Langlois et al., Reference Langlois, Rutland-Brown and Thomas2005) and a prevalent cause of long-term morbidity (Sariaslan et al., Reference Sariaslan, Sharp, D’Onofrio, Larsson and Fazel2016). Executive function is oftentimes disrupted following TBI (Azouvi et al., Reference Azouvi, Arnould, Dromer and Vallat-Azouvi2017), which can impact downstream skills like social and adaptive functioning. Unfortunately, these deficits are persistent (Shultz et al., Reference Shultz, Hoskinson, Keim, Dennis, Taylor, Bigler, Rubin, Vannatta, Gerhardt, Stancin and Yeates2016) and have ramifications continuing into adulthood, such as lower quality of romantic partnerships and poorer educational and occupational outcomes (Bodley-Scott & Riley, Reference Bodley-Scott and Riley2015; Shames et al., Reference Shames, Treger, Ring and Giaquinto2007). Children may be even more vulnerable to deficits in executive function post-TBI than their adult counterparts, given ongoing brain development in regions known to support executive function. In particular, disruption in how coordinated regions, or “networks”, interact may explain some of the executive function deficits seen in pediatric TBI.
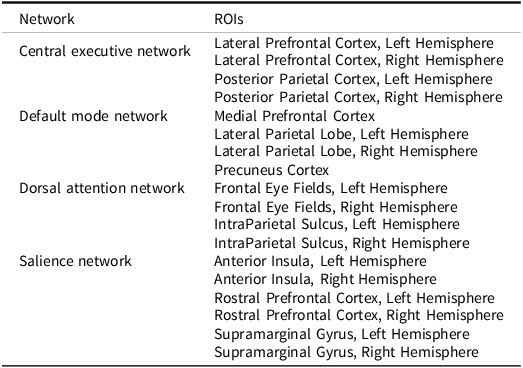
Functional connectivity within reproducible neural networks can be assessed using resting-state functional magnetic resonance imaging (fMRI), which determines how networks communicate with each other (van den Heuvel & Hulshoff Pol, Reference van den Heuvel and Hulshoff Pol2010). Several networks have been linked to specific cognitive functions. The highly researched DMN consists of the medial prefrontal cortex (MPFC), precuneus cortex (PCC), and lateral parietal lobules (LPL), which are more active while at rest than while engaged in a task (Raichle et al., Reference Raichle, MacLeod, Snyder, Powers, Gusnard and Shulman2001). The dorsal attentional network (DAN) is comprised of the intraparietal sulcus and frontal eye fields, and directs attention toward a particular task (Szczepanski et al., Reference Szczepanski, Pinsk, Douglas, Kastner and Saalmann2013). The central executive network (CEN) has functional hubs within the lateral prefrontal and posterior parietal cortices, and is involved with goal-directed behavior (Scolari et al., Reference Scolari, Seidl-Rathkopf and Kastner2015). Finally, the salience network (SN), containing the rostral prefrontal cortex (RPFC), supramarginal gyrus, and anterior insula (AI), mediates the balance between the DMN and CEN (Goulden et al., Reference Goulden, Khusnulina, Davis, Bracewell, Bokde, McNulty and Mullins2014).
Disruptions in connectivity between one or more of these networks may underlie executive morbidities following pediatric TBI. Previous research in adults with TBI shows a relationship between TBI symptoms and neural network connectivity, particularly in the DMN (Mayer et al., Reference Mayer, Mannell, Ling, Gasparovic and Yeo2011; van der Horn et al., Reference van der Horn, Scheenen, de Koning, Liemburg, Spikman and van der Naalt2017). Literature also points to a reduction in DMN connectivity in individuals with TBI (Johnson et al., Reference Johnson, Zhang, Gay, Horovitz, Hallett, Sebastianelli and Slobounov2012), but focuses solely on within-network dynamics and without considering networks more commonly associated with higher-order cognition. In non-brain injured adolescents and adults, when someone detects something important (or “salient”) in their environment, the SN dampens activity in the DMN so that other networks involved in skills like attention or problem solving, like the DAN or CEN, can make use of neural resources needed to increase activity. When the usual negative association between the SN and DMN is disrupted, this can impact the extent to which other networks can simultaneously “come on line”. In some early evidence on this topic, TBI-related damage to the structural integrity of the SN can result in the inability to efficiently regulate the DMN, impairing cognition (Bonnelle et al., Reference Bonnelle, Ham, Leech, Kinnunen, Mehta, Greenwood and Sharp2012; Sharp et al., Reference Sharp, Scott and Leech2014). Individuals with TBI have also shown increased positive functional connectivity between the DMN and DAN (which we’d expect to be negatively associated), contributing to problems with memory (Sours et al., Reference Sours, Zhuo, Janowich, Aarabi, Shanmuganathan and Gullapalli2013). Additionally, the CEN can be impacted by TBI, often correlated with higher risk of executive dysfunction (Ryan et al., Reference Ryan, Catroppa, Hughes, Painter, Hearps, Beauchamp and Anderson2021). TBI appears to have the potential to impact functional connectivity not only within individual networks, but also to affect between-network communication; that said, existing studies often focus solely on one to two functional networks and broader implications for mutli-network dynamics remains unclear.
The present study aims to address this understudied question by examining functional connectivity in the DMN, SN, CEN, and DAN in relation to one another, and the relation to executive function in youth with TBI. We predicted group differences in functional connectivity between these networks, where normal functional connectivity patterns would be altered as TBI severity increased. We also hypothesized that TBI severity would have a dose-dependent effect on parent-rated measures of executive function as it manifests in the daily environment. Lastly, we anticipated that individual differences in between-network connectivity – reflecting disruption of typical between-network communication – would be associated with deficits in executive function.
Methods
Participants
Eleven youth with moderate-to-severe TBI (msTBI; M age = 11.78, SD = 2.68; 6 boys), 12 youth with complicated-mild TBI (cmTBI; M age = 12.59, SD = 1.99; 9 boys), and 17 youth with orthopedic injury (OI; M age = 11.75, SD = 2.12; 11 boys) participated in a study of neuroanatomical and functional correlates of emotional and behavioral outcome following childhood injury. These participants are a subset of those who participated in the overall study, limited to those with data that passed quality control for the MRI modalities used in these analyses. Those included in the analyses (69.0% of the total sample) did not differ from those excluded in child age, self-reported sex distribution, race, ethnicity, proxies of socioeconomic status (SES), injury severity, or time since injury.
Eligibility criteria for the study included being age 8–16 at recruitment, living within 120 miles of a midwestern children’s hospital, and at least 1 year post-injury. Children in each group must have been hospitalized at least overnight for a traumatic injury involving the head (msTBI, cmTBI) or an extremity bone fracture without head involvement (OI). TBI injury severity was classified based on a Glasgow Coma Scale (Teasdale & Jennett, Reference Teasdale and Jennett1974) score of 3–12 for the msTBI group and 13–15 for the cmTBI group, which also had accompanying injury-related brain abnormalities on neuroimaging acquired at the time of hospitalization; typical abnormalities for those in the cmTBI group included intracranial hemorrhages, contusions, and linear skull fracture. Exclusion criteria for each group included a history of prior TBI requiring medical treatment, premorbid intellectual disability or significant neurological diagnosis, injury resulting from child abuse or assault, history of psychiatric hospitalization, sensory or motor impairment that precluded study measure completion, inability to complete study measures in English, or contraindication to MRI. Children also need to be receiving at least some education in a mainstream classroom setting at the time of recruitment, as a component of the study not reported here included a visit held in the school setting.
Procedures
Prior to research procedures, parents and children provided written informed consent and assent, respectively. All procedures were approved by affiliated Institutional Review Boards, in accordance with the Helsinki Declaration (The Ohio State University IRB#s 2013H0206 and 2015H0322, Office of Responsible Research Practices). Prior to MRI, children were introduced to the MRI environment using a mock scanner. MRI session, which lasted approximately 50 minutes, involved acquisition of volumetric and resting-state functional sequences. Parents and children were compensated for their participation. Demographic and injury-related information for those included in the current analyses are provided in Table 1. Groups did not differ in child age, self-reported sex, race, ethnicity, or time since injury. In contrast, groups differed in two of three proxy metrics of SES. Youth with cmTBI were more likely to come from a single-parent household (66.7%) relative to those with msTBI (27.3%) or OI (21.4%), while youth with msTBI were more likely to report annual family income <$70,000 (90.9%; a threshold selected based on the median family income in the region of data collection based on the US Census), relative to those with cmTBI (50.0%) or OI (35.3%). This is consistent with research showing that youth with lower SES are more likely to have a TBI, particularly one of higher severity level (Brown, Reference Brown2010; Howard et al., Reference Howard, Joseph and Natale2005). Since these differences in SES are likely inherent to injury group, accounting for shared variance, we did not include these proxies for SES as covariates in our analyses (Dennis et al., Reference Dennis, Francis, Cirino, Schachar, Barnes and Fletcher2009). As expected based on enrollment criteria and TBI epidemiology, distributions of injury mechanism and presence/absence of loss of consciousness also differed by group.
Table 1. Demographic and descriptive information

Note. msTBI = moderate to severe traumatic brain injury; cmTBI = complicated-mild traumatic brain injury; OI = orthopedic injury; M (SD) = mean (standard deviation); GCS = Glasgow Coma Scale score; ATV = all terrain vehicle/”4 wheeler”. Income threshold of 70,000 per year was selected based on the median household income in the study region during the nearest US Census to the date of data collection.
Bold values are values that fall within the range of statistical significance.
Measures
During the child’s MRI, parents completed the Behavior Rating Inventory of Executive Function (BRIEF; Gioia et al., Reference Gioia, Isquith, Guy and Kenworthy2000), a parent-rated measure of children’s executive function in the daily environment. The BRIEF consists of eight clinical scales divided into two composite indexes: Behavioral Regulation (Inhibit, Shift, Emotional Control clinical scales) and Metacognition (Initiate, Working Memory, Plan/Organize, Organization of Materials, Monitor clinical scales). The BRIEF shows both strong test-reliability (r = .82) and internal consistency (α = .80–.98). The Behavioral Regulation and Metacognition Indices, and Global Executive Composite (GEC), were used in the analyses. In partial correlations accounting for age and self-reported sex, raw scores were used; in one-way ANOVAS testing group differences on the BRIEF and in tables, scores are reported as T-scores, with a mean of 50 and standard deviation of 10, where higher scores indicate worse executive function.
Image acquisition
Participants completed MRI on a 3T Siemens Prisma scanner, located in a research-dedicated university-affiliated neuroimaging center. Imaging was completed without sedation. High-resolution structural images were acquired using a 3D localizer, T1-weighted sequence, and T2-weighted transverse sequence. The T1-weighted magnetization prepared rapid gradient echo (MPRAGE) was attained with single-shot slice acquisition in the anterior–posterior direction. This consisted of 176 slices, with a TR = 1950 ms, TE = 4.44 ms, FOV = 256 × 256, voxels = 1 mm3, and flip angle 12°, aligned to the AC-PC plane. The T2 sequence parameters used traverse orientation consisting of 60 slices, a TR = 4000 ms, TE = 56 ms, FOV = 240 mm, voxels = 2 mm3, and flip angle 170°. Resting-state functional connectivity was quantified based on a 48-slice transverse acquisition, with anterior to posterior phase encoding, while participants rested with their eyes open, viewing a fixation cross. Sequence parameters included TR = 2000 ms, TE = 28 ms, FOV = 240 mm, voxels 3 mm3, and a 70° flip angle.
Image processing
Prior to analyses, images were examined for artifact or unexpected irregularities. Volumetric data were post-processed using FreeSurfer 7.1 pipelines (http://surfer.nmr.mgh.harvard.edu), including co-registration, normalization, and motion correction preprocessing protocols, for use in resting-state analyses described below.
Resting-state fMRI was analyzed using the CONN Toolbox v22a (Nieto-Castanon & Whitfield-Gabrieli, Reference Nieto-Castanon and Whitfield-Gabrieli2022), which processes and analyzes MRI data using MATLAB_R2023b. In this study, the CONN Toolbox was first applied to analyze resting-state data using ROI-to-ROI analyses of regions prescribed based on CONN Toolbox-integrated masks of four functional networks related to higher-order neurocognition: the DMN, SN, DAN, and CEN (referred to as the “Fronto-Parietal Network” in CONN Toolbox). Resting-state functional data first underwent preprocessing that included realignment, slice-timing correction, co-registration, normalization, and spatial and temporal smoothing with an 8 mm Gaussian kernel. Since resting-state data is susceptible to linear drifts and motion effects, images also underwent denoising before conducting first-level analysis and group-level (or second-level) analysis. Additional noise components, including the blood-oxygen level-dependent (BOLD) signal from cerebral white matter and cerebrospinal fluid, were removed before ROI-based analyses were conducted.
Atlas ROIs for each network are pre-embedded in the CONN Toolbox software using the networks.nii file, and methods of identification of these ROIs using independent component analysis of data from the Human Connectome Project are provided by the developers of the toolbox (Whitfield-Gabrieli & Nieto-Castanon, Reference Whitfield-Gabrieli and Nieto-Castanon2012; see Table 2 for network ROIs). Individual participants’ ROI-to-ROI correlation matrices were generated by extracting the average resting-state BOLD time course from each network-based ROI and calculating correlation coefficients with the average BOLD time course in the yoked ROI. While there is no singular approach to absolute thresholding for what is considered “connectivity” (e.g., r ≥ .30; van den Heuvel et al., Reference van den Heuvel, de Lange, Zalesky, Seguin, Yeo and Schmidt2017), our coefficients were then normalized using Fisher’s r-to-z transformation and are presented as Pearson correlations. Matrices were aggregated across participants, used in second-level analyses of group differences (voxel-wise analysis p(uncorrected) < .05 and cluster-level p(FDR corrected) < .05), and extracted and integrated into an SPSS (v29.0.1) database for pooled within-group correlation with neurocognitive assessment measures, an approach that accounts for group membership when computing correlation coefficients.
Table 2. Network-based regions of interest (ROIs)

Statistical analysis
Multivariate analysis of variance (MANOVA) examined group differences in between-network connectivity based on the Fisher-transformed connectivity correlations from the resting-state fMRI analyses, with p(FDR corrected) < .05. Post-hoc Tukey’s pairwise comparisons were completed for any omnibus comparison where group differences met statistical significance thresholds. Group differences in parent-rated executive function were also assessed using MANOVA with planned contrasts of each TBI group relative to OI.
To examine the relationships among neural markers and parent-report measures, we used pooled within-group correlation accounting for injury group. We opted for the pooled within-group approach rather than bivariate Pearson correlation because 1) it allows us to simultaneously optimize sample size, under the assumption that although there may be group-level differences in connectivity and/or BRIEF scores, the correlations among these factors isn’t predicted to be substantively different; and 2) the option to simply compute bivariate Pearson correlations separately for each sample would require a much larger sample than we have available. To conserve statistical power, analyses assessed associations of BRIEF T-scores on composite indices with ROI-to-ROI connections that varied by group. Raw data are available from the corresponding author (KRH) upon request, in adherence with IRB and research institute policies on data use and release.
Results
Group differences
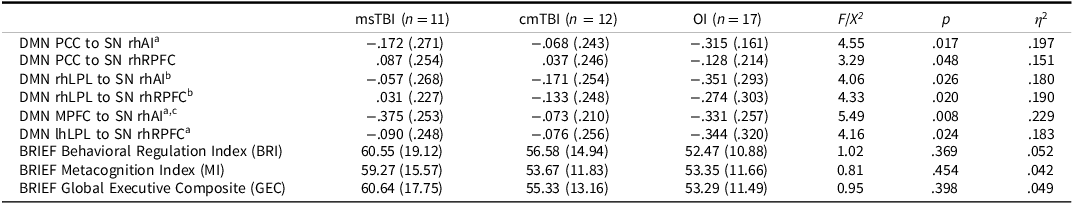
Group differences in between-network connectivity are depicted in Figure 1 and statistics reported in Table 3. The overall MANOVA was significant, F(12, 64) = 2.49, p = .010, Wilk’s Λ = 0.465, η 2 = .32. For illustrative purposes, within-group between-network connectivity patterns are shown in Figure 2. After correcting for false discovery rate <.05, we found group differences in the strength of connectivity among four ROIs in the DMN and two ROIs of the SN. The association between the PCC of the DMN and right hemisphere (rh) AI of the SN (p = .017) differed by group, as did the association between the rhLPL of the DMN and the rhRPFC (p = .020) and rhAI (p = .026) of the SN. Connectivity between the PCC of the DMN and rhRPFC of the SN also differed by group (p = .048), as did the association between MPFC of the DMN and rhAI of the SN (p = .008) and between the lhLPL of the DMN and rhRPFC of the SN (p = .024). There were no significant differences in the strength of connectivity among any ROIs in the CEN or DAN.

Figure 1. Group differences in cross-network connectivity (top left, right panels) among regions of the DMN (teal regions) and SN (red regions); depth of gray connections indicates magnitude of connectivity. Individual group effect sizes for each of 6 DMN ROI to SN ROI dyads (bottom panel), msTBI = blue bars; cmTBI = orange bars; OI = yellow bars; black bars reflect group-specific effect size standard deviation; horizontal bars in the effect sizes bar plot reflect significant pairwise group differences detected in post hoc analyses, with green bars reflecting msTBI versus OI differences, orange bars reflecting cmTBI versus OI differences, and purple bars reflecting msTBI versus cmTBI differences.

Figure 2. Exemplar graphic of within-group cross-network connectivity for the OI (left), cmTBI (middle), and msTBI (right) groups.
Table 3. Group differences in cross-network connectivity and parent-rated executive function

Note. msTBI = moderate to severe traumatic brain injury; cmTBI = complicated-mild traumatic brain injury; OI = orthopedic injury; DMN = default mode network; PCC = precuneus cortex; SN = salience network; rhAI = right hemisphere anterior insula; rhRPFC = right hemisphere rostral prefrontal cortex; rhLPL = right hemisphere lateral parietal lobe; MPFC = medial prefrontal cortex; lhLPL = left hemisphere lateral parietal lobe; BRIEF = Behavior Rating Inventory of Executive Function; cross-network connectivity values are presented as means and (standard deviations) of normalized r to z coefficients; parent-ratings of executive function on the BRIEF are presented as means and (standard deviations) of T-scores, relative to a normative mean of 50 and standard deviation of 10, with higher scores reflecting worse functioning.
a cmTBI and OI differ, p < .05.
b msTBI and OI differ, p < .05.
c msTBI and cmTBI differ, p < .05.
Post-hoc Tukey’s analyses, again with p(FDR corrected) < .05, revealed the direction of group differences in between-network connectivity. Across networks, we anticipated negative connectivity effects, as engagement of the SN would be expected to correspond to disengagement of the DMN (Bonnelle et al., Reference Bonnelle, Ham, Leech, Kinnunen, Mehta, Greenwood and Sharp2012). As predicted, the OI group showed negative between-network associations, while the cmTBI and msTBI groups had attenuated, negligible negative associations or, in some cases, positive between-network associations. More specifically, the msTBI had significantly weaker between-network associations than the OI group between the rhLPL of the DMN and the rhRPFC (p = .015) and rhAI (p = .023) of the SN. Additionally, the cmTBI group had significantly weaker negative between-network associations than the OI group between rhAI of the SN and the MPFC (p = .021) and PCC (p = .014) of the DMN. The cmTBI group also had significantly weaker negative associations between the rhRPFC of the SN and the lhLPL (p = .043) of the DMN than the OI group. Finally, the msTBI group had significantly stronger negative association between the MPFC of the DMN and rhAI (p = .014) of the SN, than the cmTBI group, which showed a negligible association. No pairwise group differences were found in the strength of connectivity between the PCC of the DMN and the rhRPFC of the SN.
Groups did not significantly differ on parent ratings on the BRIEF in either the main ANOVA or planned contrasts (all ps > .05; Table 3). In examining mean ratings for each group, the msTBI group approached or exceeded a full standard deviation above the normative mean for each index, with effect sizes between ds = 0.69–0.74 across indices. Mean ratings for the cmTBI and OI groups were also above the normative mean, but were less pronounced, with ds = 0.33–0.52 and ds = 0.24–0.31, respectively.
Cross-domain associations
Pooled within-group correlations were conducted to examine links among between-network connectivity and parent-rated behavior, accounting for injury severity group (Table 4). Higher connectivity between the PCC of the DMN and the rhRPFC of the SN was significantly associated with higher BRIEF T-scores, reflecting worse parent-rated executive behavior on the metacognition index (MI) (r = .302), and GEC (r = .291). Connectivity between the PCC of the DMN and the rhAI of the SN was also significantly correlated with higher raw scores on the MI (r = .317) and global executive composite (r = .299).
Table 4. Associations among cross-network connectivity and parent-rated behavior

Note. BRI = Behavioral Regulation Index; MI = Metacognition Index; GEC = Global Executive Composite; DMN = default-mode network; PCC = precuneus cortex; SN = salience network; rhAI = right hemisphere anterior insula; rhRPFC = right hemisphere rostral prefrontal cortex; rhLPL = right hemisphere lateral parietal lobe; MPFC = medial prefrontal cortex; lhLPL = left hemisphere lateral parietal lobe.
Bold values are values that fall within the range of statistical significance.
* Significant at the p < 0.05 level.
Discussion
Pediatric TBI can result in cognitive and behavioral impairments that are persistent and threaten quality of life. This study sought to investigate network connectivity in children and adolescents following cmTBI or msTBI and whether differences in connectivity are reflected in day-to-day executive skills. Group differences in network connectivity were found among functional hubs of the DMN and SN. Generally, strong positive within-network connectivity, and strong negative between-network connectivity, were evident in the OI group, as anticipated. Furthermore, negative between-network connectivity between hubs in the DMN and SN was diminished, absent, or even slightly reversed (i.e., positive) in TBI groups, consistent with prior research on young adults (Johnson et al., Reference Johnson, Zhang, Gay, Horovitz, Hallett, Sebastianelli and Slobounov2012). Our expectation that network connectivity would be impacted in a dose-dependent fashion was not fully reflected in our findings, with weaker connectivity between the DMN MPFC and SN rhAI in the cmTBI group relative to both the msTBI and OI groups. While some studies have found evidence of disrupted connectivity following mild TBI, particularly in the DMN (e.g., Mayer et al., Reference Mayer, Mannell, Ling, Gasparovic and Yeo2011; Sours et al., Reference Sours, Zhuo, Janowich, Aarabi, Shanmuganathan and Gullapalli2013; van der Horn et al., Reference van der Horn, Scheenen, de Koning, Liemburg, Spikman and van der Naalt2017), attenuation relative to the msTBI group is surprising and will require replication. We did examine whether there were outliers or systematic trends that may have skewed the finding and led to this unexpected pattern, but did not find evidence of this type of bias. It is possible that our subgroup of youth with cmTBI suffered from selection bias, over-selecting for youth with persistent post-concussive symptoms or those with concerned parents interested in an MRI study, but that hypothesis is speculative. Our sample of youth with msTBI was almost certainly oversampled for youth with less severe deficits given the study’s requirement that youth receive at least partial education in a mainstream classroom setting, leading to a less diverse severity spectrum than that reflective of the full continuum following moderate to severe childhood brain injury.
While groups did not differ significantly on the BRIEF, all three groups were rated above standardized norms. The OI group received poorer parent ratings than expected in a normative distribution, which could explain the lack of group differences between TBI and OI groups. For instance, in exploratory one-sample t-tests relative to a normative mean of 50 with a standard deviation of 10, we found medium to large effect sizes for the msTBI group, and small to medium for cmTBI and OI groups, showing increasing magnitude of difficulties across groups. Therefore, results do not suggest an absence of deficits in executive function following moderate to severe injury, but rather reflect sub-threshold difficulties found in those prone to injury in general. In this way, findings resonate with literature on reduced executive function in pediatric TBI (Beauchamp & Anderson, Reference Beauchamp and Anderson2013; Levin & Hanten, Reference Levin and Hanten2005) and highlight the importance of considering the implications of selecting mild injury and orthopedic injury as comparison cohorts rather than a true “healthy control” (Asarnow et al., Reference Asarnow, Satz, Light, Lewis, McCleary, Broman and Michel1995; Yeates, Reference Yeates2010). It is also possible that elevations across groups reflect a “valence bias” or tendency towards an overly negative view of a child’s behavior by their reporting parent (Camara-Costa et al., Reference Câmara-Costa, Dellatolas, Jourdan, Ruet, Bayen, Vallat-Azouvi, Allain, Chevignard and Azouvi2024); indeed, we found extremely high correlations among parents’ report on the BRIEF and reporting on other study measures not reported here (i.e., emotional, behavioral, and adaptive function measures), suggesting that parents who were reporting elevated executive function difficulties were describing their children as struggling across the board, just to a greater extent in those with msTBI.
Atypical between-network connectivity was associated with parent-rated executive skills, such that higher connectivity predicted poorer executive function. This may be related to disruptions in functional connectivity within the SN in the TBI groups. Since the SN is needed to regulate the DMN in order to perform cognitive tasks (Bonnelle et al., Reference Bonnelle, Ham, Leech, Kinnunen, Mehta, Greenwood and Sharp2012), findings suggest that connectivity of regions in the SN to the PCC could be important in downregulating the DMN. The PCC is the central hub of the DMN (Fransson & Marrelec, Reference Fransson and Marrelec2008), and appears to be most influenced by the SN, thus affecting behavioral outcomes. The parent-rated outcomes on the BRIEF measure many goal-oriented behaviors (Gioia et al., Reference Gioia, Isquith, Guy and Kenworthy2000), and downregulation of the DMN is needed in order to perform such tasks (Raichle et al., Reference Raichle, MacLeod, Snyder, Powers, Gusnard and Shulman2001).
Although the SN also regulates the CEN, we did not see differences in network connectivity between the SN and CEN. While we had resting-state data for over 20 youth with TBI, we opted to subgroup by severity in accordance with existing research to examine the effect of injury severity. However, this lowered statistical power to detect group differences, and replication of our findings is needed. Future research might see poorer outcomes in executive function associated with CEN connectivity, as others have found (Ryan et al., Reference Ryan, Catroppa, Hughes, Painter, Hearps, Beauchamp and Anderson2021).
We acknowledge several limitations. The small sample size could have contributed to the lack of significant differences in network connectivity between other networks of interest (DAN, CEN). A larger sample could also reveal more differences in network connectivity between TBI groups, account for injury mechanism or other potential medical covariates, or would allow us to use more conservative thresholding. As shown by error bars in Figure 1, there was notable within-group heterogeneity. We also only included participants who could remain still during MRI, and excluded youth who required full-time special education, which disproportionally impacted our ability to recruit those with severe TBI. These data were collected prior to the start of the NIH-NINDS TBI Classification and Nomenclature Initiative (Manley et al., Reference Manley, Dams-O’Connor, Alosco, Awwad, Bazarian, Bragge, Corrigan, Doperalski, Ferguson, Mac Donald, Menon, McNett, van der Naalt, Nelson, Pisică, Silverberg, Umoh, Wilson and Yuh2025) and rely solely on the GCS as an indicator of injury severity, which is increasingly acknowledged as insufficient. Additionally, the BRIEF is a parent-rated measurement of behavior (Gioia et al., Reference Gioia, Isquith, Guy and Kenworthy2000) and may not fully capture executive function capacity in these youth. Our sample was primarily comprised of White and non-Hispanic participants so it is unclear whether or not our findings would be applicable to a more diverse population; future research efforts should include targeted outreach to diverse groups and considerations for designing community-focused research (e.g., budgeting for alternate transportation, community-based assessment flexibility, recruitment of non-English speakers). Finally, we opted to focus on between-network connectivity in our analyses due to our modest sample size, as we viewed this as the more novel contribution of our work; that said, a well-powered analysis that integrates both within- and between-network patterns would likely provide a more comprehensive picture of neurofunctional substrates of behavior post-TBI, potentially leveraging exciting advancements in multi-institutional consortia.
Pediatric TBI can result in cognitive and behavioral impairments that are linked with network-based functional connectivity. Our research shows the importance of examining brain–behavior relationships following pediatric TBI using an approach that moves beyond focusing on single regions of interest to include cross-network communication. This is an important step to identify potential mechanisms of the behavioral sequelae of child and adolescent TBI, and may provide some insights to guide neuropsychologists as they prepare children and their families for possible long-term sequelae of childhood TBI. Furthermore, identified brain–behavior mechanisms can inform neural biomarker targets to evaluate future intervention design and clinical trials as management and treatment of the sequelae of childhood TBI continues to improve.
Availability of data and materials
Data and materials are available from the corresponding author upon request, in adherence with data use agreements as deemed necessary by the corresponding author’s institution.
Acknowledgments
We would like to acknowledge the contribution of Ryan Wier, Holly Dustin, Sandra Glazer, Hanan Guzman, Young Jin Kim, and Brianna Laney to data collection efforts. This work would not have been possible without the time and effort of participants and their families.
Funding statement
Our work was supported by a Clinical and Translational Intramural Research Award (Abigail Wexner Research Institute at Nationwide Children’s Hospital) and K01 HD083459 (Eunice Kennedy Shriver National Institute of Child Health and Human Development), each to K. R. Hoskinson.
Competing interests
The authors have no relevant financial or non-financial conflicts of interest related to this work.
Ethics approval
All procedures were approved by affiliated Institutional Review Boards at The Ohio State University, IRB#s 2013H0206 and 2015H0322.
Consent to participate
Written informed consent and assent were obtained from participating parents and children, respectively, before research procedures commenced, in accordance with the Declaration of Helsinki.
Consent for publication
Non-applicable.
Code availability
Code language is also available from the corresponding author upon request, in adherence with data use agreements as deemed necessary by the corresponding author’s institution.


 Open access