


Introduction
Micronutrient deficiency (MND) remains a pervasive challenge in sub-Saharan Africa, where rural populations, reliant on staple crops, often face inadequate intake of essential nutrients, such as iron. Biofortification has emerged as a promising strategy to combat this ‘hidden hunger’ by enhancing the micronutrient content of staple foods. High-iron beans (HIBs) show significant potential, as evidenced by efficacy studies demonstrating that their consumption can improve iron status and cognitive function (De Moura et al. Reference De Moura, Palmer, Finkelstein, Haas, Murray-Kolb, Wenger and Boy2014). This is explained in Rwanda, where regular intake has been shown to boost haemoglobin levels (Haas et al. Reference Haas, Murray-Kolb, Wenger, Scott, Rhoten and Lung’aho2017).
However, the nutritional success of biofortification hinges on consistent adoption and consumption by farmers, a process that is often dynamic and non-linear. A growing body of evidence reveals that technology adoption is not a simple binary of adopters and non-adopters. Studies from Rwanda on HIBs indicate that farmers are classified into three categories: continuous, intermittent, and discontinued growers (Asere-Marfo et al. Reference Asare-Marfo, Herrington, Birachi, Birol, Cook, Diressie and Zeller2017). Similar discontinuation patterns have been observed for other technologies, such as improved rice in Kenya (Kijima et al. Reference Kijima, Otsuka and Sserunkuuma2011) and pesticides in Uganda (Pan et al. Reference Pan, Smith and Sulaiman2018), highlighting that initial adoption does not guarantee sustained use.
The factors influencing these complex adoption patterns are multifaceted. Existing literature emphasises the role of socio-economic characteristics (education, gender, wealth) in shaping a farmer’s capacity to access resources and absorb risk (Jogo et al. Reference Jogo, Bocher and Grant2021; Muthini Reference Muthini2018). Institutional factors, such as access to markets, credit, and reliable seed systems, are equally critical, as constraints such as high input costs and poor market linkages are frequently cited as barriers (Monela, Reference Monela2014). Furthermore, perceptual factors such as taste, cooking time, and yield expectations are key determinants of a variety’s acceptability (Jenkins et al. Reference Jenkins, Byker Shanks and Houghtaling2015; Okello et al. Reference Okello, Sindi, Shikuku, McEwan and Low2017).
Despite this understanding, a significant gap remains. Many studies treat adoption as a binary outcome, failing to capture the critical distinctions between farmers who sustain a technology, those who discontinue it, and those who use it intermittently. This oversimplification limits the effectiveness of policy interventions. In Uganda, where substantial investments have been made in agricultural technology delivery (World Bank, 2010), understanding the drivers of sustained adoption is crucial for improving nutritional outcomes and ensuring return on investment.
This study addresses this gap by investigating the factors that influence the dynamic adoption patterns of HIBs in Uganda. Moving beyond a binary framework, we categorise farmers as discontinued, intermittent, or continued growers. Our analysis employs a multinomial logit (MNL) model on cross-sectional data to determine how socio-economic, institutional, and social capital factors specifically affect these different adoption trajectories.
The context of this study is the Developing and Delivering Biofortified Crops (DDBC) project in Uganda, which built upon the successful Reaching End Users (REU) pilot. The REU project demonstrated that a significant majority (66%) of farmers who received biofortified orange sweet potato vines continued to cultivate them two years later (Hotz et al. Reference Hotz, Loechl, de Brauw, Eozenou, Gilligan, Moursi and Meenakshi2012), underscoring the potential for sustained adoption with adequate support. This paper contributes to the empirical literature on agricultural technology diffusion by providing a nuanced analysis of adoption behaviour and offering evidence-based recommendations for designing interventions that not only promote initial uptake but also sustain the cultivation of biofortified crops.
Materials and methods
Data sources and sampling
The data for this analysis come from the midline evaluation of the DDBC project in Uganda. The original sampling framework employed a stratified three-stage cluster design. Twenty sub-counties were initially selected in proportion to the operational reach of five implementing partners. Subsequently, 70 farmer groups were randomly selected, and 10 farmers were randomly selected from each group, yielding an initial sample of 700 households.
To model dynamic adoption patterns (discontinued, intermittent, and continued use), the analysis was restricted to farmers with a sufficient cultivation history. From the initial sample, we identified 425 households that had ever planted HIBs. We then excluded 142 new growers (33% of adopters) who had only started in the current season, as their long-term adoption status was indeterminate. Our analytical sample thus comprises 283 farmers who began cultivation in 2012 or 2013, providing a multi-season track record. The final sample for the multivariate analysis comprised 278 cases after excluding those with incomplete data. This focused approach ensures that our model explains the factors influencing sustained adoption among farmers with established experience with the technology.
Empirical framework
The MNL model was used to analyse the factors influencing the adoption patterns of biofortified crops. The model was chosen because it allows analysis of decisions across more than two categories of the dependent variable; thus, it is possible to estimate choice probabilities for different grower groups (Wooldridge, Reference Wooldridge2010). The MNL model has been applied in various adoption studies to model farmers’ decisions (Ojo et al. Reference Ojo, Nmadu, Tanko and Olaleye2013; Tessema et al. Reference Tessema, Asafu-Adjaye, Kassie and Mallawaarachchi2013). The MNL model is specified as in Equation (1) as follows:
 $$P\left( {{Y_i} = j\mid {{\rm{X}}_i}} \right) = {{{\rm{exp}}\left( {\beta _j^ \top {{\rm{X}}_i}} \right)} \over {\sum\nolimits_{k = 1}^J {{\rm{exp}}} \left( {\beta _k^ \top {{\rm{X}}_i}} \right)}}{\rm{for}}\;j = 1,2, \ldots, J,$$
where ${Y_i}$
denotes the adoption pattern for the farmer
${Y_i}$
denotes the adoption pattern for the farmer $i$
, taking on the values
$i$
, taking on the values $\left\{ {1,2, \ldots, J} \right\}$
with
$\left\{ {1,2, \ldots, J} \right\}$
with $1 = $
discontinued grower,
$1 = $
discontinued grower, $2 = $
intermittent grower, and
$2 = $
intermittent grower, and $3 = $
continued grower (thus
$3 = $
continued grower (thus $J = 3$
).
$J = 3$
). ${{\rm{X}}_i}$
denotes a
${{\rm{X}}_i}$
denotes a $K \times 1$
vector of explanatory variables for the farmer
$K \times 1$
vector of explanatory variables for the farmer $i$
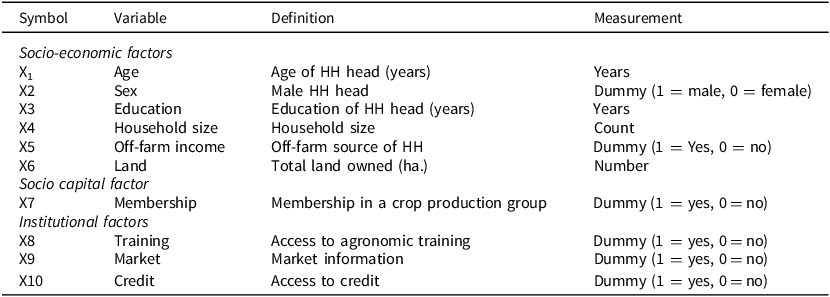
(Table 1).
$i$
(Table 1). ${\beta _j}$
is a
${\beta _j}$
is a $K \times 1$
vector of parameters for adoption category
$K \times 1$
vector of parameters for adoption category $j$
, with
$j$
, with $j = 1, \ldots, J$
.
$j = 1, \ldots, J$
.
In practice, when estimating the model, the coefficient of the reference group (discontinued farmers) is normalised to zero (i.e., ${\beta _1} = 0$
(Wooldridge, Reference Wooldridge2010). This is because the probabilities across all categories must sum to one; hence, for three categories, only two distinct parameter sets are identifiable and estimable.
${\beta _1} = 0$
(Wooldridge, Reference Wooldridge2010). This is because the probabilities across all categories must sum to one; hence, for three categories, only two distinct parameter sets are identifiable and estimable.
The natural logarithm of the odds ratio in Equation (1) yields the relative probability of each category relative to the reference group, also known as the relative risk ratio. The relative risk ratio of a coefficient indicates the risk of the outcome in the comparison group relative to the risk of the outcome in the referent group, as shown in Equation (2)
 $${\rm{ln}}\left( {{{P\left( {{Y_i} = j\mid {{\rm{X}}_i}} \right)} \over {P\left( {{Y_i} = 1\mid {{\rm{X}}_i}} \right)}}} \right) = \beta _j^ \top {{\rm{X}}_i}\;{\rm{for}}\;j = 2, \ldots, J.$$
The estimated coefficients for each category reflect the effects of the explanatory variable on the likelihood that farmers are in the alternative category relative to the reference category. The relative risk ratio was determined using the rrr command in STATA. However, we did not present the relative risk ratios.
In addition, marginal effects were used to quantify the expected change in the probability of belonging to a category resulting from a unit change in an independent variable, holding all other variables constant (Wooldridge, Reference Wooldridge2010). Marginal effects were computed for the model, where Equation (1) is differentiated with respect to the explanatory variables as shown in Equation (3):
 $${{\partial P\left( {{Y_i} = j\mid {{\rm{X}}_i}} \right)} \over {\partial {{\rm{X}}_i}}} = P\left( {{Y_i} = j\mid {{\rm{X}}_i}} \right)\left[ {{\beta _j} - \sum\limits_{k = 1}^J P \left( {{Y_i} = k\mid {{\rm{X}}_i}} \right){\beta _k}} \right].$$
It has also been noted that the signs of the marginal effects and their respective coefficients may differ (Hassan and Nhemachena, 2007), as the former depend on the sign and magnitude of all other coefficients. Marginal effects were computed in Stata using the mfx command.
The explicit form of the function is specified in Equation (4):
 $${Y_i} = \left\{ {\matrix{ 1 & {{\rm{if\;farmer\;}}i{\rm{\;is\;a\;discontinued\;grower}},} \cr 2 & {{\rm{if\;farmer\;}}i{\rm{\;is\;an\;intermittent\;grower}},} \cr 3 & {{\rm{if\;farmer\;}}i{\rm{\;is\;a\;continued\;grower}}.} \cr } } \right.$$
Barriers to high-iron bean production
Understanding these constraints helps increase crop productivity among farmers. Several methods are used to rank farmers’ constraints, including Kendall’s tau correlation (Prempeh et al. Reference Prempeh, Manu-Aduening, Asante, Asante, Offei and Danquah2017; Amedi, Reference Amedi2014). Kendall’s tau correlation is a nonparametric measure used to assess the degree of concordance between two variables measured on an ordinal scale (typically ranks). The simplified formula for Kendall’s tau is presented in Equation (5):
 $$\tau = {{4\sum\nolimits_{i = 1}^n {{R_i}} } \over {n\left( {n - 1} \right)}} - 1,$$
where $\tau $
is Kendall’s tau coefficient,
$\tau $
is Kendall’s tau coefficient, ${R_i}$
is the rank assigned to the constraint
${R_i}$
is the rank assigned to the constraint $i$
,
$i$
, $n$
is the total number of ranked constraints.
$n$
is the total number of ranked constraints.
Kendall’s coefficient of correlation is obtained by normalising the symmetric difference to lie between $ - \!1$
and
$ - \!1$
and $ + \!1$
, with
$ + \!1$
, with $ -\! 1$
corresponding to the maximum possible distance (obtained when one order is the exact reverse of the other) and
$ -\! 1$
corresponding to the maximum possible distance (obtained when one order is the exact reverse of the other) and $ + \!1$
corresponding to the minimum possible distance. Zero is obtained when both orders are identical. The statistical significance of Kendall’s tau correlation coefficient is assessed using the
$ + \!1$
corresponding to the minimum possible distance. Zero is obtained when both orders are identical. The statistical significance of Kendall’s tau correlation coefficient is assessed using the $z$
-test statistic, with the null hypothesis typically that there is no correlation between the ranked pairs (Prempeh et al. Reference Prempeh, Manu-Aduening, Asante, Asante, Offei and Danquah2017).
$z$
-test statistic, with the null hypothesis typically that there is no correlation between the ranked pairs (Prempeh et al. Reference Prempeh, Manu-Aduening, Asante, Asante, Offei and Danquah2017).
Results
Categorising iron bean farmers by the adoption pattern
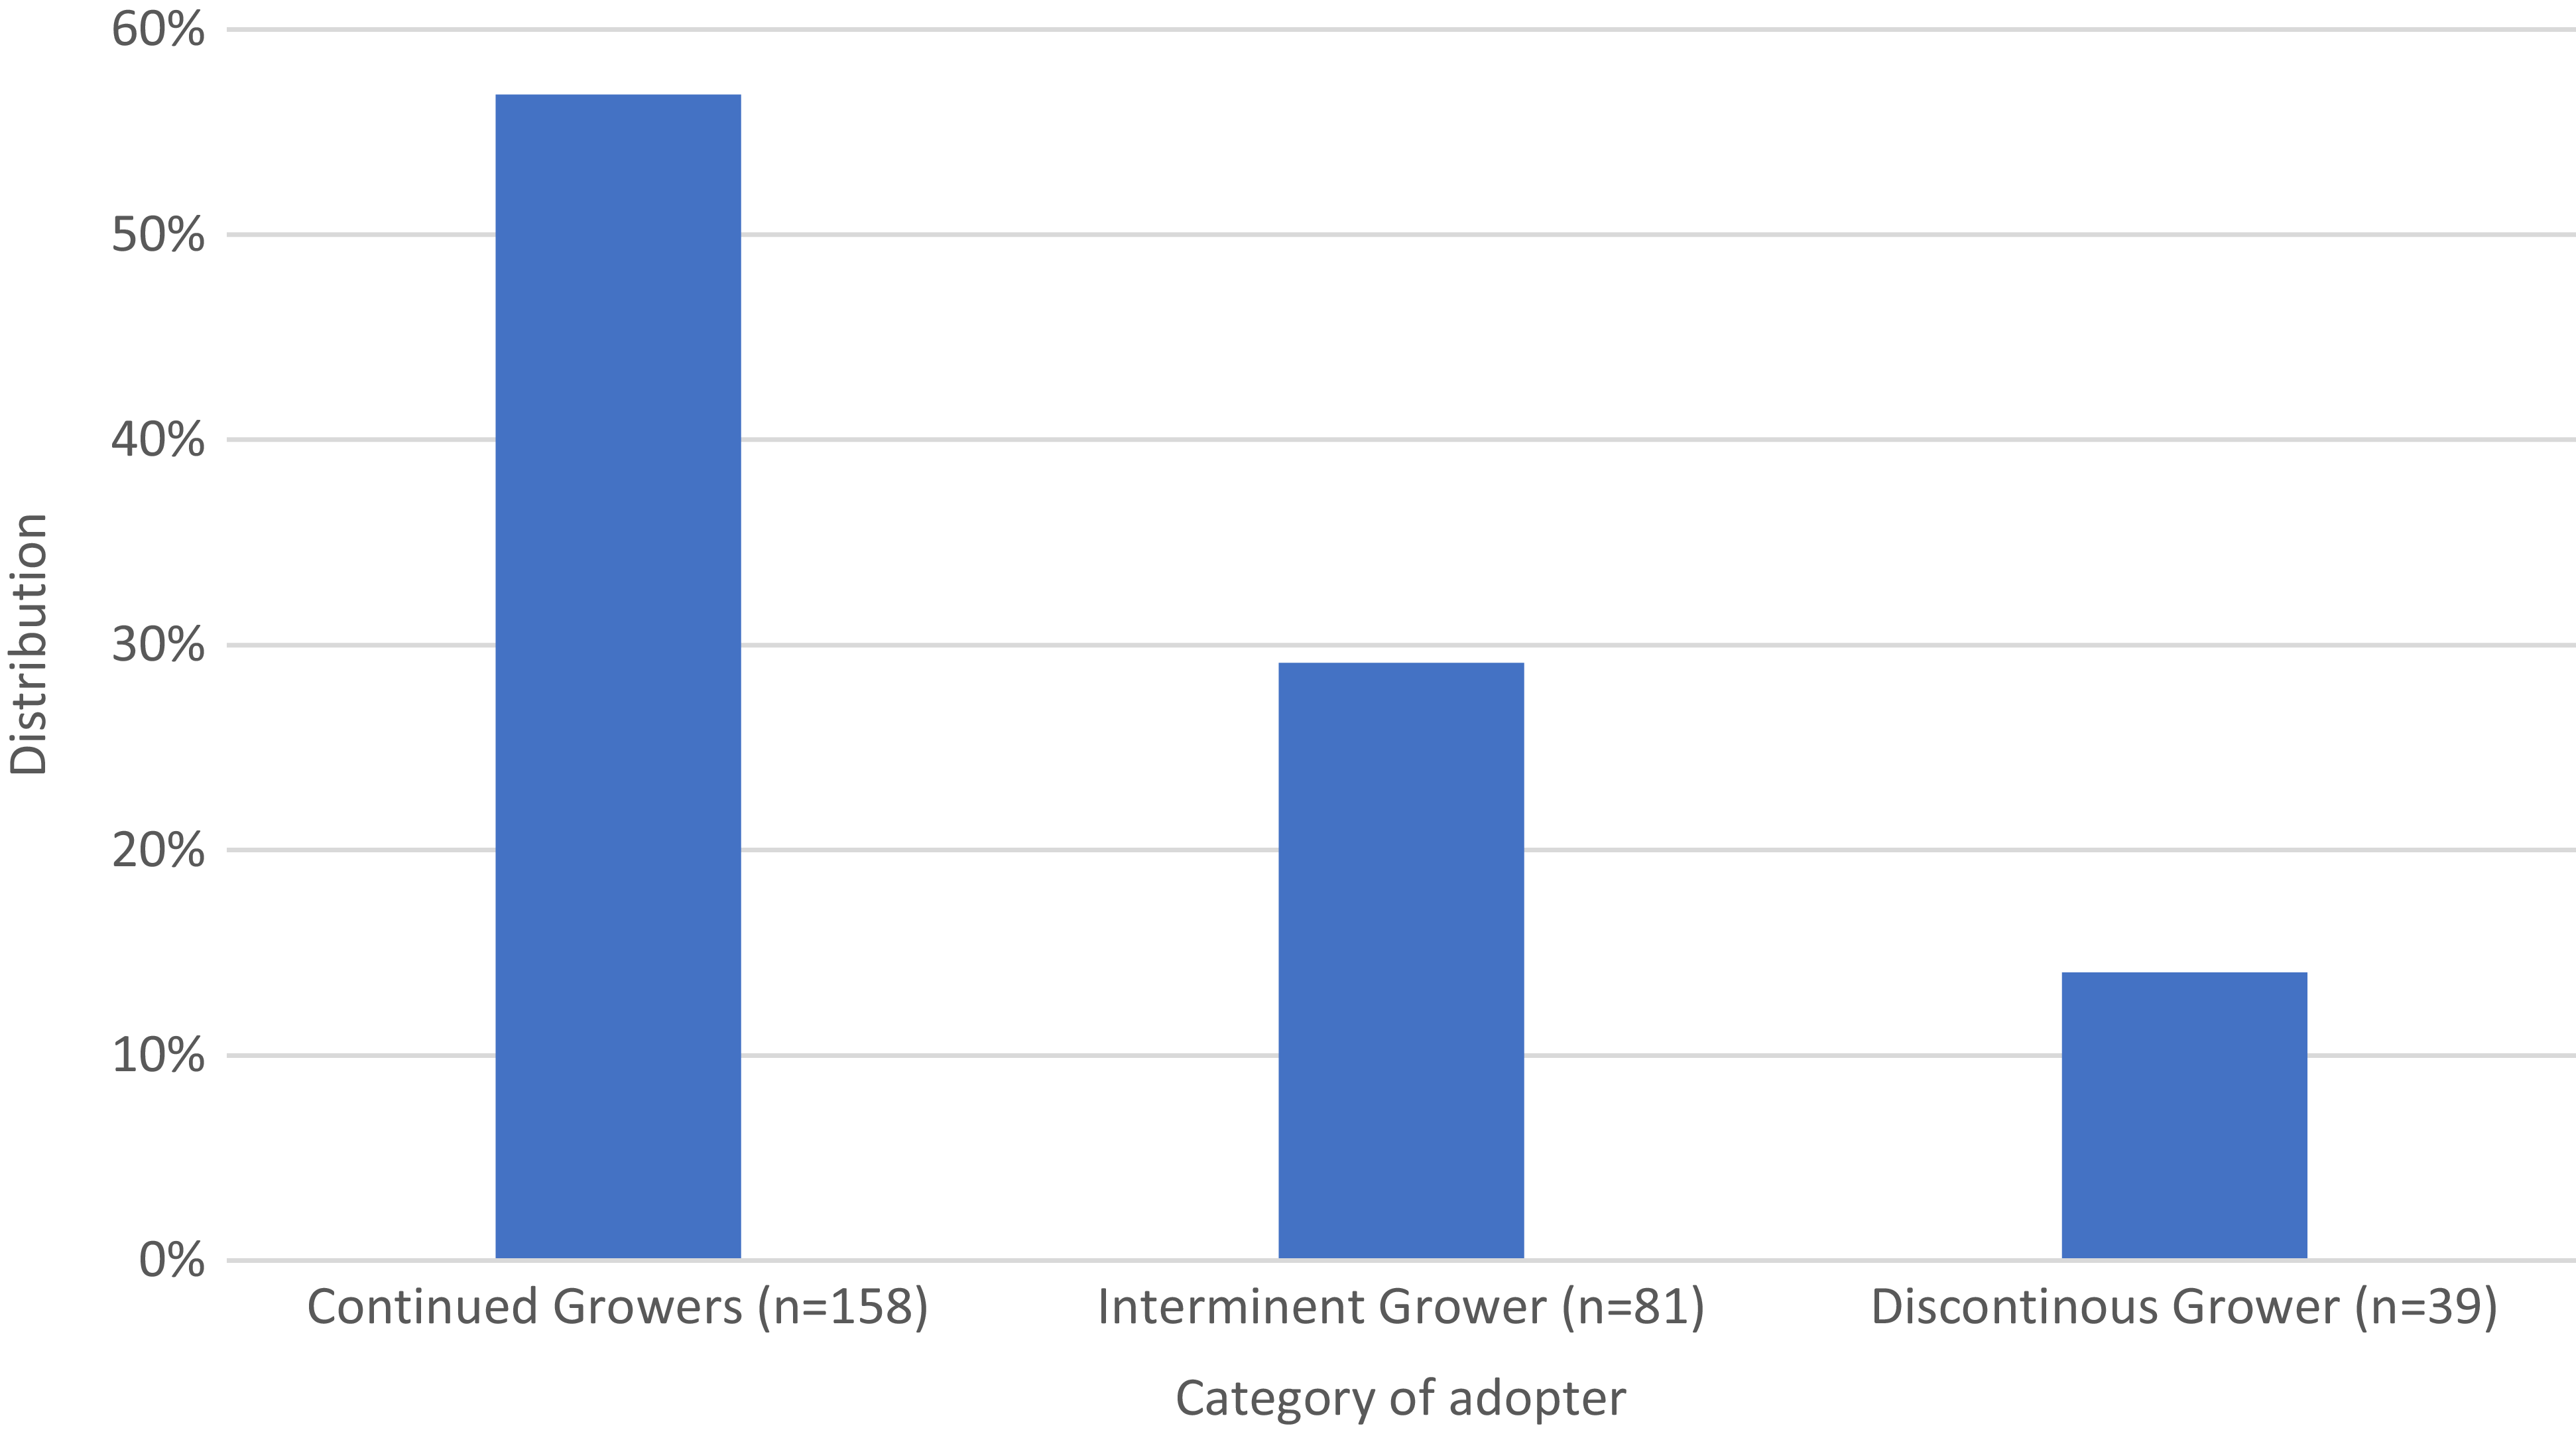
Figure 1 illustrates the categorisation of adoption patterns. The results show that most farmers have consistently grown iron beans since beginning cultivation, whereas 14% have ceased cultivation. Although NGOs did not provide farmers with iron bean seeds for several seasons, other activities, such as radio messages, field days, and extension visits, may have encouraged them to continue growing iron beans. Similar findings were reported by Asare-Marfo et al. (Reference Asare-Marfo, Birol, Gonzalez, Moursi, Perez, Schwarz and Zeller2016), who observed that 54% of farmers in Rwanda continuously grew iron beans during a project aimed at reducing MND. However, results from Kijima et al. (Reference Kijima, Otsuka and Sserunkuuma2011) indicated higher rates of discontinuation at the end of the project.

Figure 1. Distribution of adoption patterns among Ugandan farmers growing high-iron beans. Values represent percentages of farmers in each category.
Demographic characteristics of farmers
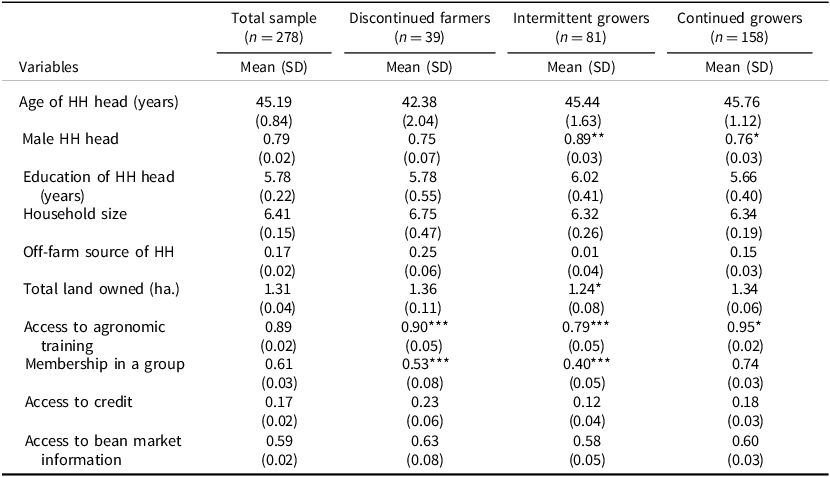
Table 2 presents demographic characteristics of farmers. The results indicated that the average age of the farmer was 45.2 years. The mean age of household heads across the discontinued intermittent and continuous grower categories did not differ significantly. About 79% of the household heads were male, and 21% were female. Furthermore, the proportion of male-headed households was significantly higher than that of female-headed households among the intermittent and continuous grower categories. Household heads spent an average of 6 years in formal education, equivalent to primary schooling. The average household size was 6.4 with a standard deviation of 0.15. Moreover, the results indicated that the average household size for discontinued growers, intermittent growers, and continuous growers was 7, 6, and 6 members, respectively. Among households interviewed, 17% participated in off-farm activities, whereas 83% did not. The percentage of households engaged in off-farm activities varied across categories of iron bean growers. The average total land holding of the sample households was 1.31 hectares. The average landholdings of intermittent HIB growers differed significantly from those of other categories.
Table 1. Variables used in the model

Source: Author’s own work.
Table 2. Demographic characteristics of farmers

*, **, *** is 10%, 5%, 1% level of significance respectively. For dummy variables, the mean represents the proportion of the sample with that characteristic (e.g., a mean of 0.79 indicates 79% of the sample.
Source: Author’s own work.
Among the total farmers interviewed, 89% attended a training programme on HIB production, whereas 11% did not. The percentage of farmers who attended training was significantly higher in the continued grower category than in other categories. Among farmers, 59% had access to HIB marketing information. Continued grower categories had the highest percentage of farmers who had accessed market information, whereas the intermittent grower category had the lowest. 17% of farmers had access to credit, whereas the majority did not. Of the total sampled households, 61% are members of groups.
Factors that influence the adoption pattern of high-iron beans
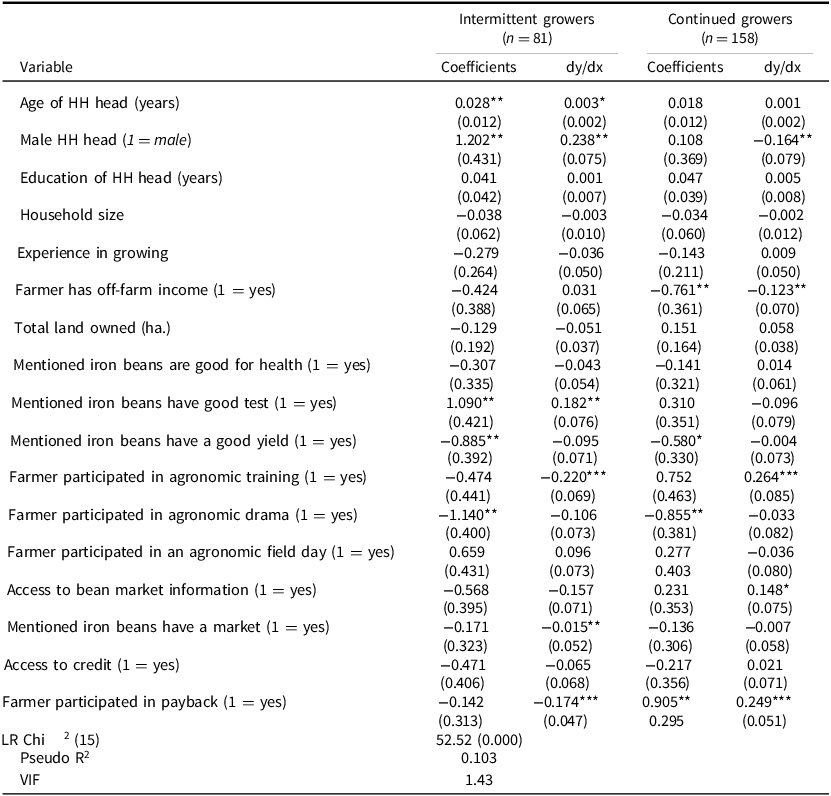
Table 3 presents the coefficients and marginal effects from MNL model estimates of the factors affecting the adoption patterns of biofortified crop varieties. The model diagnostics indicate an average variance inflation factor of 1.42, suggesting that the model is free of multicollinearity. The likelihood ratio chi-square of 52.52 showed that for both equations (intermittent relative to discontinued and continued relative to discontinued), at least one of the predictors’ regression coefficients is not equal to zero. The model fits the data at the 1% significance level. This implies that the independent variables were relevant in explaining the farmers’ adoption patterns of HIB technologies. An important assumption of the MNL model is the Independence of Irrelevant Alternatives (IIA). The model was tested using the Hausman test to determine if it fulfils this assumption. The Hausman test supported the finding that IIA was not violated, χ2 values ranged from −9.22 to 0.92, and probabilities approached 1.0. LR and Wald tests also confirmed the explanatory variables’ power in the model.
Table 3. MNL results for factors that influence the adoption pattern of iron beans

The figures in parentheses are standard error, MNL is multinomial logit, dy/dx is the marginal effect, *, **, *** are 10%, 5%, 1% level of significance, respectively.
Source: Own calculation from survey data.
The results from the MNL model provide insights into the factors influencing the adoption patterns of biofortified crops among farmers. Gender plays a significant role, with male farmers having a 23% higher probability of being intermittent growers (those who cultivate biofortified crops in some years but not others) than discontinued growers (those who have ceased cultivation altogether). This suggests that male farmers are less consistent in adopting biofortified crops than their female counterparts. Age also appears to be a factor, albeit with a more negligible effect. For each additional year of age, a farmer’s likelihood of being an intermittent adopter increases by 0.3% relative to being a discontinued adopter. This implies that older farmers may be slightly more inclined to maintain some level of biofortified crop cultivation rather than abandoning it entirely. Furthermore, the analysis reveals the importance of taste perception in shaping adoption patterns. Farmers who report that iron beans have a good taste demonstrate an 18% higher probability of being intermittent growers compared to those who have discontinued growing them. This suggests that positive taste perception can encourage farmers to persist with some level of cultivation, even if not continuously. Interestingly, the perception of good yield appears to have the opposite effect. Farmers reporting good yields for iron beans are 9% less likely to be intermittent growers compared to those who have discontinued growing iron beans. This seemingly counterintuitive finding may indicate that farmers who experience good yields are more likely to transition from intermittent to continuous adoption, thereby reducing their chances of reverting to discontinued cultivation.
The analysis reveals that farmer training and participation in market or payback schemes are positively associated with continuous adoption. Farmers who received training had a 25% higher probability of remaining continuous growers than those who discontinued cultivation. Similarly, engagement in market activities and participation in payback schemes increased the likelihood of continuous adoption by 15% and 25%, respectively. Conversely, participation in off-farm and drama activities was negatively associated with continued adoption, reducing the likelihood by 13% for each. This suggests that such activities may divert farmers’ time and resources, hindering consistent cultivation efforts of iron beans. These findings underscore the importance of training, market access, and off-farm income in promoting the sustained adoption of biofortified crops, while also highlighting the potential influence of competing activities on farmers’ engagement with these crops.
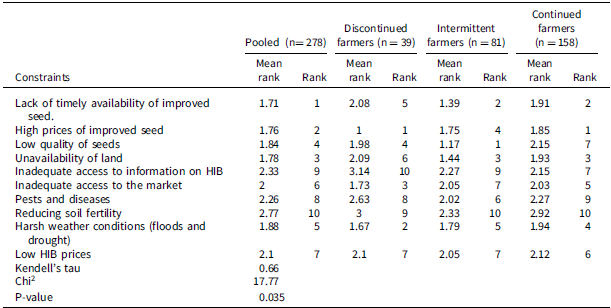
Analysis of farmers’ constraints
Farmers face numerous challenges during the production and marketing of crops. These constraints can be categorised as biotic, physical, and socio-economic. Identifying these constraints helps develop strategies that can be incorporated into the project design. Farmers were presented with some constraints to confirm their applicability and were required to rank them. In ranking, the constraint with the highest number assumes the least importance, and vice versa. The results of farmers’ rankings of constraints are presented in Table 4.
Table 4. Constraints faced by farmers in HIB production

Source: Author’s own work.
Farmers identified timely access to high-quality iron bean seeds as their primary production barrier, mainly because they rely on NGOs and development partners whose planning cycles often do not align with seasonal variations and individual farmers’ schedules. This mismatch disrupts planting and affects iron bean yields. As in rice farming studies, inadequate land and market access (specifically, distance to market) were significant constraints (Amedi, Reference Amedi2014). Intermittent iron bean growers, in particular, highlighted land limitations (Baker et al. Reference Baker, Nixon and Liani2015). Additional challenges included limited information, pests, diseases, declining soil fertility, and adverse weather conditions, consistent with broader studies on agricultural constraints (Nabbumba and Bahiigwa, Reference Nabbumba and Bahiigwa2003; Singh et al. Reference Singh, Hodson, Huerta-Espino, Jin, Bhavani, Njau and Govindan2011; Amikuzuno and Ihle, Reference Amikuzuno and Ihle2010). Statistical analysis using Kendall’s coefficient of concordance indicated 66% agreement among farmers regarding these constraints, with a statistically significant chi-square test supporting the reliability of these rankings.
Discussion
The adoption patterns of HIBs among Ugandan farmers were influenced by socio-economic, institutional, and perceptual factors. Age has a heterogeneous impact on HIB adoption. Our findings suggest that older farmers tend to adopt practices intermittently, likely due to their extensive farming experience and increased awareness of the nutritional benefits, particularly for young children in their households. This observation aligns with existing literature (Adekambi et al. Reference Adekambi, Okello, Abidin and Carey2020; Chidiebere-Mark and Anyanwu, Reference Chidiebere-Mark and Anyanwu2020; Glover et al. Reference Glover, Kim and Stone2019), which suggests a link between older farmers and the adoption of biofortified crops. However, some studies argue that younger farmers are often more receptive to new technologies, while older farmers may be perceived as less efficient (Ayodele et al. Reference Ayodele, Omonona and Ogunleye2020; De Groote et al. Reference De Groote, Gunaratna, Ergano and Abate2016). The relationship between age and the adoption of biofortified crops, such as orange-fleshed sweet potatoes, underscores the complex interaction between age, farming experience, and household needs in shaping adoption patterns (Adekambi et al. Reference Adekambi, Okello, Abidin and Carey2020).
Another key finding is that male farmers are 23% more likely than female farmers to grow biofortified crops intermittently. This indicates that male farmers often engage sporadically with HIB rather than completely stop cultivation. This aligns with studies indicating that male-headed households are more willing to grow biofortified crops (Olayinka et al. Reference Olayinka, Ogunlade and Adebayo2020) and that there is a general positive link between male involvement and adoption (Kaguongo et al. Reference Kaguongo, Ortmann, Wale and Darroch2012; Opata et al. Reference Opata, Okorie, Iwuchukwu, Ume and Oyinbo2021). These results highlight the importance of increasing women’s involvement in promoting biofortified crops. In addition, targeted nutrition education for female-headed households is vital to achieving more balanced and consistent adoption.
Engaging in off-farm income activities reduces the likelihood of regularly adopting biofortified crops by 13%. This contrasts with the usual positive effect of household income on a farmer’s willingness to grow and prefer these crops. This suggests a complex relationship where having multiple income sources may sometimes divert time or resources from consistent HIB cultivation. On the other hand, involvement in market activities and payback schemes significantly drives the adoption of continuous HIB, increasing the likelihood by 15% and 25%, respectively. This finding aligns with studies that highlight the role of market proximity in promoting technology adoption (Abebe et al. Reference Abebe, Bijman, Pascucci and Omta2013; Ayodele et al. Reference Ayodele, Omonona and Ogunleye2020; Li et al. Reference Li, Qing, Hu and Li2021). The success of the payback scheme in facilitating seed sharing between farmers further emphasises the need for effective distribution and incentive systems. However, some studies suggest that in specific contexts, closer market access may have an inverse effect on adoption (Okello et al. 2015).
Surprisingly, the concept of ‘good yield’ appears to hinder the consistent adoption of iron beans. This contradicts earlier findings that show farmers’ positive views on traits such as colour, taste, and nutritional value typically lead to increased cultivation (Jenkins et al. Reference Jenkins, Byker Shanks and Houghtaling2015; Adekambi et al. Reference Adekambi, Okello, Abidin and Carey2020; Jogo et al. Reference Jogo, Bocher and Grant2021). While farmers often prefer nutrient-rich and visually appealing crops, some studies indicate a stronger preference for local varieties that resist disease, even if biofortified crops are more nutritious (Okello et al. 2015). This suggests that, in some instances, farmers may prioritise disease resistance and perceived yield stability over direct nutritional benefits. This highlights the need for a more comprehensive understanding of the criteria farmers use when deciding whether to adopt new technologies.
Conclusions
This study demonstrates that the adoption patterns of HIBs among Ugandan farmers are influenced by a diverse set of socio-economic, institutional, and perceptual factors. We observed three distinct adoption behaviours, namely continuous cultivation, intermittent cultivation, and discontinuation of iron bean cultivation. Key determinants identified include farmers’ age, gender, engagement in training programmes, access to market opportunities, off-farm income, and participation in seed payback schemes. These factors significantly shape how farmers interact with iron beans. Despite the evident benefits of interventions such as training and drama activities conducted by non-governmental organisations (NGOs), persistent challenges, including limited access to high-quality seeds, high seed costs, and climate variability, continue to impede consistent adoption. These constraints underscore the need for a more integrated, comprehensive strategy to ensure the sustained adoption of iron beans.
To promote continued use and improve nutritional outcomes for individuals and communities, the following recommendations are important. First, targeted awareness and training are crucial for encouraging the adoption of HIB among farmers. These efforts should highlight the nutritional and economic benefits of iron beans. Second, increasing farmers’ participation in on-farm demonstration activities is essential to shifting their attitudes and promoting long-term engagement. Third, launching and supporting community seed-sharing programmes can significantly accelerate seed distribution and enhance nutritional outcomes by increasing access to HIB varieties. Examples include a payback mechanism in which initial recipients of the iron bean seed pass them on to subsequent farmers. Ultimately, the government, NGOs, and farmers must work together to systematically identify and address barriers to the adoption of iron beans. This joint effort will create a supportive environment for the sustained growth of biofortified crops, ultimately improving nutrition.
While this study provides valuable insights, it also acknowledges a potential limitation arising from recall bias. Farmers’ memories of past cultivation patterns may impact the accuracy of adoption pattern classification. Future research should explore methods to reduce this bias, such as shorter recall periods or longitudinal data collection, to better understand farmer adoption behaviour.

 Open access