

I
Although today’s banks in developed countries generally have a number of branch offices across regions, this system is relatively new in the history of banking. In the early stages of the banking industry, in most countries there were many small banks with no or only a few branch offices and most banks were local, i.e. territorially limited to a specific region. Only from the late nineteenth and early twentieth centuries did banks grow to form regional branch networks through mergers and de novo entry.Footnote 1 The empirical literature on banking integration – much of it based on the modern-day natural experiment of US state-level banking deregulation during the 1980s and 1990s – generally concludes that integration spurs growth (Jayaratne and Strahan Reference JAYARATNE and STRAHAN1996; Morgan et al. Reference MORGAN, RIME and STRAHAN2004). But because we usually lack granular historical branch-level data on lending and deposits, it has to date been largely impossible to study the causal role that the geographical expansion of branch networks may have played in mobilizing savings and in enabling the reallocation of capital towards regions with higher growth prospects in the early stages of a country’s economic and financial development. This is particularly true for non-western economies outside Europe and the US. In this article, we aim to contribute to closing this gap using unique branch-level lending and deposit data from early twentieth-century Japan.
One of the most important macroeconomic benefits from branching is that it effectively integrates regional financial markets (Gilje et al. Reference GILJE, LOUTSKINA and STRAHAN2016) and therefore allows the reallocation of capital across regions and sectors (Cetorelli and Goldberg Reference CETORELLI and GOLDBERG2012; Hoffmann and Okubo Reference HOFFMANN and OKUBO2022) using banks’ internal capital markets. We refer to this view as the modern view on branch banking.Footnote 2
We contrast the modern view with what we call the traditional view or ‘conventional paradigm’, aptly summarized by Berger et al. (Reference BERGER, GOULDING and RICE2014) as follows:
Opaque small businesses would be best served by small, single-market, local banks, while large, multi-market, non-local institutions would tend to serve more transparent firms… [Hence,] [t]he large banks, multi-market banks, and non-local banks created by consolidation may be disadvantageous in relationships based on soft information and may be more likely to sever relationships or withdraw credit than the small, single-market, and local institutions they replace. (Berger et al. Reference BERGER, GOULDING and RICE2014, pp. 264–5)
The traditional view is more skeptical of the cross-regional integration of branch networks because branching is often seen as being associated with a shift away from a relationship-based business model to a more arm’s-length approach to lending. Such a shift could be to the disadvantage of small, informationally opaque firms which tend to be the main beneficiaries of the traditional relationship-based model (Berger and Udell Reference BERGER and UDELL2002; Berger et al. Reference BERGER, MILLER, PETERSEN, RAJAN and STEIN2005, Reference BERGER, GOULDING and RICE2014; Stein Reference STEIN2002).
Indeed, it is widely accepted that relationship lending generally benefits small firms.Footnote 3 However, evidence on whether or not bank mergers benefit or harm small firms is much scarcer and less clear-cut (Berger et al. (Reference BERGER, SAUNDERS, SCALISE and UDELL1998) offer an early analysis). It is not obvious that mergers necessarily destroy relationship capital through a move to a more formalized, arm’s-length lending process. But even if this was the case, it remains unclear what the net effect on small firms is when the benefits from branch lending (such as better capital allocation) are also accounted for.Footnote 4
Cotugno et al. (Reference COTUGNO, MONFERRÀ and SAMPAGNARO2013) show that moving the decision on a loan from individual branches to geographically distant, higher-up organizational layers (e.g. regional head offices) does indeed make it more difficult for small, opaque firms to obtain credit. In our context, using data from Japan for the 1920s and 1930s, Okazaki et al. (Reference OKAZAKI, SAWADA and WANG2007) show that bank mergers reduced the influence on lending of bank directors who had also director positions at industrial firms. While these authors’ focus is not on branch banking, their findings also suggest that organizational changes of banks through mergers did weaken relationship lending. This contrasts with the bulk of the literature on regional banking integration in the United States that concludes that small firms were prime beneficiaries of interstate branching (Demyanyk et al. Reference DEMYANYK, OSTERGAARD and SØRENSEN2007; Rice and Strahan Reference RICE and STRAHAN2010; Hoffmann and Shcherbakova-Stewen Reference HOFFMANN and SHCHERBAKOVA-STEWEN2011).
Relationship lending also has its downsides. The reliance of relationship borrowers on what is often a single lender who holds a lot of non-transferrable information also creates a hold-up problem that can make it difficult for borrowers to switch bank when the bank itself is in distress (Sharpe Reference SHARPE1990; Rajan Reference RAJAN1992). Hoffmann and Okubo (Reference HOFFMANN and OKUBO2022) argue that this hold-up problem made it difficult for small firms in regions with many small, regional banks to obtain finance during Japan’s lost decade of the 1990s. Overall, the authors find that small firms in regions where they primarily tended to bank with country-wide integrated banks were actually better off because integrated banks used their internal capital markets to allocate funds to small firms with their high dependence on – and willingness to pay for – bank credit. Importantly, these findings hold even though integrated banks were usually much more affected by the bursting of Japan’s real estate bubble of the 1990s than local banks. This suggests that the benefits from integration are first order and may well outweigh the costs of moving from a relationship-based to an arm’s-length model even for those borrowers who would tend to benefit most from relationship lending.
This article shows how the development of branch banking integrated regional financial markets in Japan during the 1920s and that it led to a reallocation of savings from low-growth peripheral prefectures to high-growth areas in the rest of the country. As we argue, this happened in a way that largely preserved the relationship-based lending model that remains a feature of Japan’s banking landscape to the present day.
We focus on the period after World War I, during which the Japanese banking system underwent substantial organizational change. A wave of bank mergers increased the number of branch offices and developed bank branch networks across regions, while the number of banks declined sharply. The merger waves were driven by financial instability. Following several small bank panics, a serious financial crisis occurred in 1927, known as the Showa financial crisis. A panic run on the banks resulted in the closure of 45 banks, which led the government to declare a three-week bank moratorium. The financial authorities’ countermeasures against the fragile financial system caused a wave of large-scale bank mergers in the late 1920s (Goto Reference GOTO1985; Shiratori Reference SHIRATORI2006; Okazaki and Sawada Reference OKAZAKI and SAWADA2007; Okazaki et al. Reference OKAZAKI, SAWADA and WANG2007). These mergers drastically changed the structure of the banking industry, particularly through the expansion of branch banking, as they generated large-scale banks that had broad branch networks across villages, counties and prefectures throughout Japan (Yoshizu Reference YOSHIZU1978; Abe Reference ABE1980, Reference ABE1981).
Our analysis makes use of unique branch-level data from historical sources. In prewar Japan, each prefecture government issued the Statistical Yearbook of Prefectures (Fuken Tokeisho), and four prefectures, Fukushima, Tottori, Kumamoto and Miyazaki, provided branch-office level information for each bank, including the location of the branch office and the total amount of deposits and loans outstanding at each office (including headquarters and all branches) for each bank.
Using these data, we can directly observe bank behaviors at the branch-office level. We document first that the branch-level correlation between deposits and lending is substantially lower for banks operating large branch networks, consistent with the view that these banks did indeed operate internal capital markets. We then show that deposit supply shocks in prefectures in Japan’s periphery causally affected the lending of ‘urban’ banks – mainly those headquartered in Tokyo and Osaka – in the rest of the country. Our approach to identification builds directly on Gilje et al. (Reference GILJE, LOUTSKINA and STRAHAN2016) and exploits bank-level heterogeneity in the exposure to terms-of-trade shocks affecting local economies in the periphery. While our findings provide important quantitative evidence that branching played a key role in integrating Japans regional economies, they also suggest that urban banks mainly used peripheral economies as funding sources, thus effectively exporting liquidity. We provide narrative evidence based on archival sources from the merger of Higo and Yasuda banks to illustrate that the big urban banks did indeed move to an arm’s-length business model following mergers with local banks. In line with contemporary commentators, it therefore seems tempting to conclude that this shift towards arm’s-length lending is what ultimately drained local economies with their traditional industries of credit because it led to the destruction of relationship capital and would therefore vindicate the skepticism of the conventional paradigm towards branch banking.
However, our further branch-level analysis reveals that the capital export from peripheral prefectures through the branches of urban banks ultimately was an efficient reallocation of capital and most likely was not primarily driven by a shift in lending business models. This is because reallocation mainly played out in deposit markets.
A key feature of our mechanism is that local and urban banks lent to very different customers, consistent with the conventional paradigm laid out in the quote from Berger et al. (Reference BERGER, GOULDING and RICE2014) above. We note that this specialization on particular customers implies that a de facto segmentation of banking markets along functional or sectoral lines – effectively preferred habitats for banks – persisted, even while banking markets were at the same time becoming geographically integrated through branching. Local banks specialized on a relationship-based business model of local lending to small firms in traditional industries such as agriculture, silk reeling and cotton weaving (Ito Reference ITO1975; Takashima Reference TAKASHIMA1979; Nakabayashi Reference NAKABAYASHI2001). Conversely, urban banks were often explicitly founded to help finance ventures in modern industries with many large firms, such as trading, cotton spinning, electricity, marine shipping and cement (Mitsui Bank Reference MITSUI1957; Asai Reference ASAI1975). However, when branch networks deepened the regional integration of banking markets during the 1920s, it were not primarily the urban banks that directly drained traditional industries from credit through a move to arm’s-length lending. Rather, it were the local banks that reduced lending to traditional industries because they faced higher refinancing costs. In fact, our results suggest that the impact of integration on credit to local firms mainly played out indirectly, through banks’ funding markets. We show that, faced with high-return lending opportunities in the core prefectures, urban banks drove up deposit rates for incumbent local banks in these peripheral markets. This reduced local banks’ lending to traditional industries, because higher funding costs squeezed the interest margins of local banks which then reduced lending to the riskiest and presumably least efficient borrowers. In the aggregate, the effect was a major – and overall efficient – reallocation of capital towards higher-growth regions and industries.
The mechanism we identify in the data sheds new light on on the interplay between the traditional view – emphasizing the importance of relationship lending for small firms – and the modern view with its emphasis on efficient capital allocation.
First, in the context of Japanese economic and financial history, our findings are closely connected to a view proposed by Takafusa Nakamura in his classic work (Nakamura Reference NAKAMURA1971). Nakamura considered that the prewar Japanese economy experienced a shift of growth patterns in the 1910s. Before World War I, the indigenous and modern industries, those based on Western advanced technologies, achieved ‘balanced growth’. After World War I, however, the indigenous industries stagnated, which led to a ‘dual structure’ of modern large firms and small indigenous firms. From our viewpoint, it is notable that he pointed out that one of the major reasons for the emergence of a dual structure is that a wave of bank mergers involving branch banking impeded access to finance for small local businesses (Nakamura Reference NAKAMURA1971, pp. 199–200). Our results offer a more optimistic perspective on Nakamura’s analysis. While Nakamura viewed the wave of bank mergers and branch banking as impeding access to finance for small local businesses, our analysis suggests that this reduction in credit to small firms was efficient and most likely reflected declining growth opportunities in these sectors.
Second, at a more general level, our results show that in a dual system in which markets are functionally segmented because banks specialize in certain customer groups and sectors, geographical integration through branch banking by one type of bank can still ensure efficient capital reallocation across sectors through competition in deposit markets.
Third, our results shed light on why integrated branch banks and local relationship lenders – the dual structure identified by Nakamura – continued to coexist for what is now a century after the geographical integration of banking markets. As we already mentioned, our framework effectively integrates the conventional and the modern views as actually pertaining to two different forms of segmentation in banking markets. Arm’s-length and relationship lenders – the dichotomy emphasized by the traditional view – ultimately cater to very different industries and firms of very different sizes. This leads to a de facto functional segmentation of the banking market. Conversely, the ‘modern paradigm’ emphasizes the dichotomy between local and geographically integrated banks. These concepts overlap (local banks are often relationship lenders) but they are not the same. Branch banking removes geographical barriers, but it does not necessarily remove the functional segmentation of banking markets on the borrower side. In Japan, a significant number of relatively small, mainly local banks continue to serve small local customers through relationship lending to this day. Our results illustrate that geographical integration and increased competition in deposit markets can achieve efficient fund allocation while preserving the advantages of functional specialization in the banking sector. We speculate that this could be one explanation for the persistence of the ‘dual structure’.
Our article relates to a number of papers that have explored the regional integration of banking markets in a historical context, in Japan and elsewhere. Carlson and Mitchener (Reference CARLSON and MITCHENER2009) explore the role of branching for market integration and banking stability in Depression-era California. Theirs is one of the few papers that uses granular historical branch-level data for a major economy. Our analysis here provides such data for a major non-western economy and, importantly, also adds branch-level information on lending and deposits. This allows us to study the geographical reallocation of capital in considerable detail. Mitchener and Ohnuki (Reference MITCHENER and OHNUKI2009) show that interest rate differentials between Japanese prefectures declined during the late nineteenth and early twentieth centuries and provide prefecture-level evidence that financial integration related to the development of both infrastructure and branch banking. Grossman and Imai (Reference GROSSMAN and IMAI2008) also show that interest rate differentials relative to the center and bank intermediation spreads for prefectures in the periphery declined during this period. They also find spreads to be negatively associated with local banking competition as we do here. Relative to both papers our results add new branch-level evidence on deposit and lending rates to show how deposit competition with urban branch banks forced local banks to become more efficient and helped reallocate capital.
This article is organized as follows. Section II discusses the development of branch banking in Japan after World War I. Section III provides some stylized facts on branch banking and funds allocation using bank office-level data and provides a case study of the merger of Higo and Yasuda banks. Section IV contains our econometric analysis. Section V concludes.
II
The history of the Japanese modern banking system dates back to 1872, when the National Bank Act provided the legal framework for national banks – which were in fact private banks – to issue bank notes. According to the Act, 153 national banks were founded by 1879, when the total amount of national bank notes issued by the national banks reached the upper limit prescribed by the Act. In 1882, the Bank of Japan was established as the central bank, and it began to exclusively issue Bank of Japan notes in 1885. Then the national banks were closed or transformed into ordinary banks that did not possess the privilege of issuing bank notes. A time frame of 20 years from the date when each national bank was licensed was established for this transformation. In 1893, the Bank Act was legislated as the legal framework for private banks. This sharply increased the number of private banks (Figure 1), which reached a peak of 2,334 in 1901, comprising 1,890 ordinary banks and 444 savings bank.Footnote 5

Figure 1. Number of banks in Japan over time and by type of bank
These private banks, which had close ties with their affiliated industrial firms, had some distinctive features (Okazaki et al. Reference OKAZAKI, SAWADA and YOKOYAMA2005, Reference OKAZAKI, SAWADA and WANG2007). First, the banks were small in size. The average amount of paid-up capital of ordinary banks was 134,000 yen in 1901 (US $264,000 in today’s prices) (Goto Reference GOTO1970).Footnote 6 Second, related to the first feature, each bank had few branches. Figure 2 indicates the total number of branches of ordinary banks.Footnote 7 As shown, the average number of branches was less than one in the early 1900s. In other words, branch banking was still underdeveloped in this period.

Figure 2. Number of bank branches over time
From the early 1900s, the number of banks declined steadily. This reflected a consolidation wave that is generally observed in the evolution of industries (Klepper Reference KLEPPER1996, Reference KLEPPER2002; Jovanovic and McDonald Reference JOVANOVIC and MCDONALD1994). As shown in Figure 3, a substantial number of banks exited the market because of dissolutions, bankruptcies and closures. Many banks were small and concentrated on lending to their affiliated firms, which made the banks vulnerable to several major recessions that occurred in this era.Footnote 8 As a result, the average size of the remaining banks and their branch networks steadily increased. Figure 2 shows that the total number of branches of ordinary banks (including the head offices) as well as the number of branches per bank gradually increased.Footnote 9
Figure 1 shows that there was a dramatic decline in the number of banks in the 1920s, especially the latter half of the decade. The number of ordinary banks and savings banks declined from 1,987 in 1920 to 872 in 1930.Footnote 10 In this period, many mergers and acquisitions of banks occurred, mainly as a result of government policies promoting mergers, including the enactment of the Bank Law (Okazaki and Sawada Reference OKAZAKI and SAWADA2012), while dissolutions, bankruptcies and closures were frequent (Figure 3). In the wake of the Showa financial crisis, the Bank Law enacted in 1928 enforced a minimum limit on capital assets, under which an ordinary bank was required to have capital of no less than one million yen (Asakura Reference ASAKURA1988, pp. 159–61; Okazaki and Sawada Reference OKAZAKI and SAWADA2007).Footnote 11 When the law was enacted, 807 of the 1,407 ordinary banks failed to meet this criterion. These banks were granted five-year exemptions to give them time to meet the criterion. However, as the Ministry of Finance did not allow these small banks to increase their capital by themselves, they were obliged to either merge with other banks or close.

Figure 3. Bank entry and exit over time
The wave of bank exits through mergers and acquisitions, dissolutions, bankruptcies and closures fostered branch banking. As shown in Figure 2, although the total number of branches began to fall after a jump in 1923, which reflected the transformation of savings bank to ordinary banks (Figure 1), the number of branches per bank continuously increased. The average number of branches per ordinary bank in 1920 was 2.1. By 1930, it had risen to 8.6. A substantial increase in branch offices per bank was driven by the exit of the small banks that possessed only a few branch offices, as well as by the transformation of the headquarters of acquired banks into branches.Footnote 12
It is notable that the development of branch banking generated inter-prefectural branch networks over Japan (Shiratori Reference SHIRATORI2000, pp. 64–5). The regional administration system in prewar Japan was organized as a three-tier structure, composed of (1) prefecture, (2) city and county, and (3) town and village. Our main focus is tiers (1) and (2). Hereafter, city and county are referred to as ‘municipality’ for simplicity. Table 1 classifies headquarters and branches (hereafter headquarters and branches are called ‘offices’) of ordinary banks, savings banks and special banks into the following categories: (A) offices with headquarters in the same municipality; and (B) offices with headquarters outside the municipality. We further decompose (B) into (B1) offices with headquarters in the same prefecture; and (B2) offices with headquarters in other prefectures.Footnote 13 Hereafter, we refer to the bank office of (A), (B1) and (B2) category as ‘local bank office’, ‘quasi-local bank office’ and ‘urban bank office’, for simplicity. In 1910, the share of the urban bank offices was just 8.7 percent in terms of number, indicating the highly segmented nature of financial markets across prefectures. However, by 1930, the share had risen to 19.0 percent. To a large extent this happened because urban banks led the bank merger wave, and as a result headquarters and branches of reginal banks became branches of urban banks.
Table 1. Expansion of branch network across prefectures

Note: The data include special banks as well as ordinary banks and savings banks.
Source: Bureau of Banks, Ministry of Finance (eds.), Ginko Soran (Handbook of Banks), various issues.
Table 2 lists the top 20 banks in terms of the number of branches in 1930. Among the top 20 banks, seven were headquartered in the metropolitan prefectures, i.e. Tokyo and Osaka, with the other 13 banks located in other prefectures. We find that the features of the branch networks were substantially different between the banks headquartered in the metropolitan prefectures and those headquartered in the non-metropolitan prefectures. The former had many branches in prefectures other than their headquartered prefectures, whereas the latter had fewer such branches. That is, the branch networks of the non-metropolitan banks tended to concentrate on the headquartered prefectures and the neighboring regions with which they had close economic relationships (Abe Reference ABE1981, p. 103). One of the historical reasons why large metropolitan banks founded branches in distant prefectures was that they had a strategy of being the treasurers of regional governments in the late nineteenth century, and hence, many of their branches were located in the capital cities of prefectures (Asai Reference ASAI and Yui1986, pp. 131–5; Yoshizu Reference YOSHIZU1978, p. 36).
Table 2. Banks with large branch networks in 1930

Source: Bank Bureau of the Ministry of Finance, Ginko-kyoku Nenpo (Yearbook of the Bank Bureau), 1930 issue; Bank Bureau of the Ministry of Finance, Ginko Soran (Handbook of Banks), 1930 issue.
The expansion of branch networks across prefectures functioned to integrate financial markets, which had been locally segmented. At the same time, the development of branch banking raised concerns that funds in rural areas would contract because branches of banks headquartered in metropolitan areas would transfer funds from rural areas to urban areas. This echoed the debate on the bank merger policy in the 1920s (Shiratori Reference SHIRATORI2000), as seen in the records of the Financial System Research Council (Kin’yu Seido Chosakai) established under the Ministry of Finance from 1926 to 1927. Rhuichiro Nagaoka, a council member and chief of the Social Bureau of the Ministry of Home Affairs, submitted the following memorandum to the council concerning the policy promoting bank mergers:
If small lots loaned in rural areas tend to decline and they are shifted to large lots loaned to large-sized commercial and industrial firms in urban areas as a result of bank mergers, there is a concern that this trend might dry up regional finance to impoverished agricultural areas. I want to have appropriate measures taken to prevent this problem. (Financial System Research Council 1956, p. 162, authors’ translation)
Nagaoka was especially concerned about the negative consequences of bank mergers, because the Ministry of Home Affairs was in charge of administering rural regions. Furthermore, his concern was shared by the bureaucrats of the Ministry of Finance, the financial authorities in the government. In a 1925 press interview, the chief of the Bank Bureau of the Ministry of Finance, Osamu Matsumoto, noted:
[T]he merger in which an urban bank merges rural banks to make them branches will cause a concentration of rural industrial funds in urban areas and dry up local finance. Also, as the urban bank and its rural branches have little information about the rural industries, they will be too cautious about loans and bring about undesirable consequences.Footnote 14
It is remarkable that the second sentence in the citation indicates the basic idea of the ‘conventional paradigm’ mentioned in the introduction.
III
As stated in the introduction, bank-office (branch) level data on loans and deposits in the 1910s and the 1920s are available from the Statistical Yearbook (Fuken Tokeisho) of Fukushima, Tottori, Kumamoto and Miyazaki Prefectures. The data report the total of all loans and deposits at all maturities and by all types of borrowers and depositors held at each office and where presumably collected by the prefectural government from the respective banks. For some years and branches in Fukushima, we also have data on the maximum interest rates paid for deposits or charged on loans loans held in that office.
Importantly, all the four prefectures were in rural areas, remote from the metropolitan prefectures (see the map in Figure 4).Footnote 15 The basic features of the banking industry in these prefectures are summarized in Table 3. A noteworthy fact in Table 3 is that the number of offices of banks headquartered in other prefectures (i.e. urban bank offices) and banks headquartered in other municipalities (i.e. quasi-local bank offices) increased, especially relative to the offices of banks in the same municipality (i.e. local bank offices). These observations reflect the expansion of bank branch networks across municipalities.Footnote 16

Figure 4. Location of the four prefectures in Japan
Table 3. Number of banks and bank offices by category of bank office

Source: Statistical Yearbook of Miyazaki Prefecture, various issues.
The changes in the structure of the banking industry in the four prefectures is reflected in the composition of deposits and loans there. Panels A to D of Figure 5 plot total loan, deposit and loan–deposit ratio in each prefecture by bank office category, namely local, quasi-local and urban. First, in Fukushima prefecture, while local bank offices continued to have the largest deposit share, the share of quasi-local bank offices increased sharply in the 1920s. A major driver of the increase in deposit of quasi-local bank offices was expansion of a large regional bank, Dai Hyaku-shichi Bank. Dai Hyaku-shichi Bank was founded in 1878, based on capital raised mainly from wealthy landowners in Fukushima Prefecture. The headquarters was located in Fukushima town in Shinobu County, which became Fukushima City in 1907 (Dai Hyaku-shichi Bank 1924, p. 30; Fukushima Prefecture Reference PREFECTURE1971, pp. 813–14). Dai Hyaku-shichi Bank aggressively founded branches in Fukushima Prefecture and, by the end of 1920, had 13 branches that covered most municipalities in the prefecture. Furthermore, it merged with three regional banks, and absorbed their headquarters and branches during the 1920s (Fukushima Branch of Bank of Japan 1969, p. 175). Although quasi-local bank offices collected increasing amount of deposits, they were not so positive in lending funds in the local markets. As shown in Panel A-3, loan–deposit ratios of quasi-local bank offices were generally lower than those of local bank offices.

Figure 5. Loans, deposits and loan–deposit ratios by prefecture and bank type
Next, Tottori Prefecture saw some bank mergers across prefectures. That is, from 1927 to 1928, two major regional banks headquartered in Tottori, namely Neu Bank and Taisho Tottori Bank were acquired by Un’yo Jitsugyo Bank headquartered in Shimane Prefecture, next to Tottori (Tottori Bank 1994, p. 68). As a result, deposits held in urban bank offices drastically increased. These urban bank offices were not so positive in lending funds in the local markets, as indicated in the loan–deposit ratio in Panel B-3.
In Kumamoto Prefecture, urban bank offices sharply increased deposits and established a dominant position. A major driver was Yasuda Bank, one of the largest banks in Japan, headquartered in Tokyo. Yasuda Bank already affiliated a major regional bank in Kumamoto Prefecture, Higo Bank, in 1901, and finally merged it in November 1923,Footnote 17 as a part of the ‘great merger’ of 11 banks affiliated to Yasuda Zaibatsu (Asai Reference ASAI1976, p. 167; Asai Reference ASAI and Yui1986, pp. 327–31). We will now discuss Yasuda’s managerial policy after the great merger in detail. Concerning Miyazaki Prefecture, it is difficult to judge the trend because the observation period is short, but we can confirm a lower loan–deposit ratio for urban bank offices and quasi-local bank offices compared with local bank offices.
Case study: the takeover of Higo Bank by Yasuda Bank. The merger of Higo Bank with Yasuda Bank provides a useful illustration of the behavior of an urban bank in a local market. Higo Bank was taken over by Yasuda Bank as a part of great merger of banks affiliated to Yasuda Zaibatsu (business group) in November 1923. Yasuda Zaibatsu and Yasuda Bank began to plan this merger in 1922. The reasons were first of all to strengthen the control over the affiliated banks, and second, to expand the capital of Yasuda Bank, responding to the trend towards larger-scale banks (Yasuda Bank Reference YASUDA1940, p. 229). Yasuda Zaibatsu decided to merge 11 affiliated banks including Yasuda Bank, and for this purpose it founded a new bank, Hozen Bank. Then Hozen Bank acquired the 11 banks, and was renamed as Yasuda Bank in November 1923 (Yasuda Bank Reference YASUDA1940, pp. 229–44). Higo Bank was one of these 11 affiliated banks and thus became a part of the new Yasuda Bank. As shown in Table 4, the headquarters and 10 branches of Higo Bank were reorganized as branches of the new Yasuda Bank. Once we look at the deposits and loans of Higo Bank offices before and after the merger of 1923, we find that deposits stayed on an increasing trend while loans first increased but then started to decrease after the merger.
Table 4. Impact of merger of Higo Bank with Yasuda Bank in 1923

Source: Kumamoto-ken Tokeisho, various issues.
In the context of this article, it is remarkable that there is descriptive evidence that these changes in loan and deposit reflected the managerial policy of Yasuda Bank. When the Ministry of Finance approved the merger application by Yasuda Zaibatsu, it declared, ‘If the new consolidated bank strictly constrained loans from merged bank offices in future, regional firms would suffer from financial inconveniences, and hence the new bank should refrain from a substantial change in the business policy, considering the situation of regional finance’ (authors’ translation). This declaration was made at the request of governors of prefectures. At the opening of the new bank, Zenjiro Yasuda, the president of Yasuda Bank, announced: ‘We will not change the business policy in regional markets and will not concentrate funds to the center, in as far as there are appropriate opportunities for loans.’ However, at the same time he stressed ‘Because we are entrusted precious assets of shareholders and depositors, we should be most careful in managing funds’ (Yasuda Bank Reference YASUDA1940, pp. 275–7, authors’ translation).
To put this cautious loan policy into practice, Yasuda Bank established the Department of Supervision (Kantoku-bu), under which the Audit Section (Kanri-ka) and Inspection Section (Kensa-ka) were placed. The Audit Section examined the reports and approval documents from branches, while the Inspection Section conducted on-site inspection of branches. Also, in order to support the Department of Supervision, Yasuda Bank divided regions into seven blocs, and placed a regional control office in each bloc (Yasuda Bank Reference YASUDA1940, pp. 299–303). Furthermore, Yasuda Bank implemented a large-scale reshuffle of personnel and branch managers. In March 1924, managers of 52 branches out of around 200 branches were exchanged. According to the explanation by the chief of the Department of Supervision at the Branch Manager Meeting, a main purpose of this personnel reshuffle was to ‘vanquish the low spirits of merged banks’ (Fuji Bank 1982, p. 281, authors’ translation). The cautious loan policy and attendant organizational reform are consistent with the decline in loans from the offices shifted from Higo Bank to Yasuda Bank seen in Table 4.
IV
We now conduct econometric analyses of branch banking and funds allocation using bank office-level data for the four prefectures (Fukushima, Tottori, Kumamoto and Miyazaki Prefectures). We start out with a reduced-form analysis of the branch-level link between deposits and loans. Our conjecture is that this link is less strong for banks with a larger, interregional branch network that operate internal capital markets and that, therefore, are more likely to reallocate funds between their individual branches. We therefore run panel regressions of the form
 \begin{equation}\Delta {\text{lendin}}{{\text{g}}_{ot}} = \alpha \times \Delta {\text{deposi}}{{\text{t}}_{ot}} + \beta \times {\text{I}}{{\text{B}}_{b(o)t}} \times \Delta {\text{deposi}}{{\text{t}}_{ot}} + {\text{controls}} + {\varepsilon _{ot}}\end{equation}
 where  $\Delta{\text{lending}}_{ot}$ and $\Delta {\text{deposi}}{{\text{t}}_{ot}}$ denote growth rates (or specifically: the change in the logarithm) of lending and deposits respectively and $o$ indexes the bank branch (‘office’). The variable ${\text{I}}{{\text{B}}_{b(o)t}}$ is a dummy indicating if office $o$ belongs, as of year $t$, to a bank $b(o)$ that is (geographically) integrated, i.e. that operates a branch network across prefectures. Our main indicator for ${\text{I}}{{\text{B}}_{b(o)t}}$ is whether a branch belongs to a bank headquartered in Tokyo or Osaka. The vector of controls includes bank’s $b(o)$ level of capital as well as a range of fixed effects: office-level, bank-level and prefecture-time effects.
The regression (1) can be understood as a version of classical investment-savings regression in the tradition of Feldstein and Horioka (Reference FELDSTEIN and HORIOKA1980). Specifically, we interpret the coefficient  $\alpha $ as a savings-retention coefficient that tells us to what extent local ‘savings’, i.e. in our setting deposits, help finance local investment (or, in our setting: lending). Our conjecture is that this link between local deposits and lending is weaker for integrated banks, so that we expect the coefficient on the interaction term to be negative, $\beta\ \lt \ 0$.
Because it is formulated in first (logarithmic) differences and because our data are annual, regression (1) emphasizes the year-to-year correlation between branch-level deposits and lending and therefore captures the cyclical comovement between these two variables. An equally important issue is to what extent local deposits help finance local lending (and thus investment) in the longer run. To this end, we run a version of the regression in logarithmic levels of the variables so that
 \begin{equation}{\text{lendin}}{{\text{g}}_{ot}} = \alpha \times {\text{deposi}}{{\text{t}}_{ot}} + \beta \times {\text{I}}{{\text{B}}_{b(o)t}} \times {\text{deposi}}{{\text{t}}_{ot}} + {\text{controls}} + {\varepsilon _{ot}}\end{equation}
 Again we hypothesize that offices belonging to integrated banks were less positive to lending in the local markets than local bank offices so that we again expect  $\beta\ \lt \ 0$.
Table 5 presents our results for regressions (1) and (2), estimated for the period 1921–31. We cluster standard errors at the bank level. As our indicator of bank integration,  ${\text{I}}{{\text{B}}_{b(o)t}}$, we use whether the bank $b(o)$ owning office $o$ is headquartered in one of the core prefectures, i.e. the greater Tokyo and Osaka areas. As expected, our main coefficient of interest, $\beta $, is negative in both the differenced and the log-level specifications. It is also significant at least at the 10 percent level, which, given that our set of fixed effects is quite demanding for our limited-size data set, we view as strong evidence in support of our conjecture: integrated banks had a much stronger tendency to reallocate deposits throughout their branch network, away from local lending markets.
Table 5. Branch-level correlation between deposits and lending

* Note: The table reports branch-level panel regressions of lending on deposits of the form (1) (column ‘Differences’) and (2) (column ‘log levels’) respectively. The banking integration indicator  $I{B_{b(o)t}}$ is a dummy indicating if the bank is headquartered in a core prefecture (i.e. Tokyo or Osaka). Controls include bank-level log(total assets), branch- and bank-level fixed effects and prefecture-time effects. Sample period is 1921–31. Standard errors (in parentheses) are clustered by bank. Asterisks denote significance at the conventional levels: p $\ \lt \ $0.1; **p $\ \lt \ $0.05; ***p $\ \lt \ $0.01.
It is instructive to consider the magnitude of the coefficients  $\alpha $ and $\beta $. For a purely local bank with a single branch (i.e. a ‘unit bank’), we would expect the correlation between deposits and lending to be virtually perfect. Once a bank operates several branches, it can reallocate its deposit intake between branches, so we would expect the correlation to deviate from strict unity, even if the bank operates only in a single prefecture or municipality. This intuition is reflected in the magnitude of the coefficient $\alpha $, which deviates significantly from unity in both specifications. For integrated banks, however, this correlation is around 50 percent lower than for the local banks, as indicated by our estimate of $\beta $ in both specifications. Importantly, our finding seems to be driven by the business model of the big integrated ‘urban’ banks headquartered in Tokyo and Osaka, actively managing internal capital markets. When we use an indicator of whether a bank is headquartered outside the prefecture (including the directly adjacent prefectures) as our measure of ${\text{I}}{{\text{B}}_{b(o)t}}$, the coefficient $\beta $ is much closer to zero and insignificant (results available upon request). This suggests that indeed mainly the large Tokyo- and Osaka-based banks operated internal capital markets on a large scale.
We expect the branch-level correlation between lending and deposits to change over time. This for several reasons. First, the correlation is likely to have decreased gradually as as the branch networks of urban and regional banks expanded geographically, thus making it less likely for the geographical source of funding and the destination of lending to coincide. Also, bank liquidity shocks could affect the within-bank/cross-branch correlation between lending and deposits during our sample period. We examine these two possibilities, by interacting deposits with a year-dummy, estimating the equation
 \begin{equation}{\text{lendin}}{{\text{g}}_{ot}} = {\beta _t} \times {1_{year = t}} \times {\text{deposi}}{{\text{t}}_{ot}} + {\text{controls}} + {\varepsilon _{ot}}\end{equation}
 where  ${1_{year = t}}$ is a dummy that takes the value of unity in year $t$ and zero otherwise. Regression (3) is a essentially equivalent to a sequence of cross-sectional regressions for each year (after having partialled out for the controls which include, in particular, a measure of bank capital which is likely to correlate with branching). In estimating (3), we split the sample into local and urban banks. Figure 6 plots the sequence of coefficients ${\beta _t}$ obtained for each subsample.

Figure 6. Branch-level correlation between lending and deposits over time – urban versus local banks
Consistent with our conjectures, the cross-branch correlation between lending and deposits does indeed decrease gradually for the urban banks. Interestingly, the lending–deposit correlation for urban banks starts to decline at around the time of the Kanto earthquake of 1923 and this decline accelerates after the Showa financial crisis in the late 1920s. However, the decline is generally very gradual, suggesting that these shifts reflect underlying trends in lending opportunities (e.g. for the reconstruction after the Kanto earthquake) and not mainly a need of urban banks to respond to bank-specific liquidity shocks.
The results in Table 5 show that the major urban banks differed from more traditional, regional banks by actively reallocating funds through their branch network, effectively operating internal capital markets. We now provide causal evidence that shows that deposit supply shocks in the four prefectures in our sample affected lending supply of the urban banks in the rest of the country.
Our analysis builds on Gilje et al. (Reference GILJE, LOUTSKINA and STRAHAN2016) and exploits variation across banks to deposit supply shocks that are specific to the four prefectures in our sample. As a measure of the local shock we propose changes in the terms of trade of the respective prefecture. We then assume that each bank is exposed to the shock in prefecture  $p$ in proportion to the share of its total number of branches in the prefecture. This gives us the bank-level exposure to deposit supply shocks as
 \begin{equation}{\text{EXPOSUR}}{{\text{E}}_{bt}} = \sum\limits_{p \in \mathcal{P}} {\text{BranchShare}}_{bt}^p \times \Delta {\text{ToT}}_t^p\end{equation}
 where  ${\text{BranchShare}}_{bt}^p$ is the share of all branches of bank $b$ located in prefecture $p$ and $\Delta ToT_t^p$ is the year-on-year change in the (logarithmic) terms of trade of prefecture $p$. The symbol $\mathcal{P}$ denotes the set of four prefectures, i.e.
  $\mathcal{P} =\left\{\!\!\!{\begin{array}{*{20}{c}}{Fukushima,}&{Tottori,}&{Kumamoto,}&{Miyazaki}
\end{array}}\!\!\!\right\}$.
$\mathcal{P} =\left\{\!\!\!{\begin{array}{*{20}{c}}{Fukushima,}&{Tottori,}&{Kumamoto,}&{Miyazaki}
\end{array}}\!\!\!\right\}$.
To construct  ${\text{ToT}}_t^p$, we use country-wide price indexes of a range of important products, including the price of raw silk, silk fabric, cotton, wheat, soy sauce and rice wine (sake). For each prefecture we then weight these prices with the share of each of these sectors in the value of prefecture-level output in 1921.Footnote 18 We then take the ratio of this ‘GDP’ deflator to an analogously constructed aggregate ‘GDP’ deflator for the whole of Japan from the same source to obtain the prefecture-level terms of trade. Since the sectoral price data are computed for the country as a whole (and often reflect the prices for these outputs in the Tokyo market), they are clearly exogenous at the level of individual prefectures. Also, using the shares of each of the sectors in 1921, the beginning of the sample period for our analysis, eliminates short-term feedback from local financial conditions to the sectoral composition. Hence, $\Delta ToT_t^p$reflects only exogenous variation in sectoral prices and the terms of trade shocks differ across prefectures only because of the heterogeneity of prefectures in terms of their predetermined sectoral composition.
We argue that  $\Delta {\text{ToT}}_t^p$ is an exogenous shifter of the deposit supply facing integrated banks operating in prefecture $p$. For example, we would expect that an increase in the price of raw silk would typically improve the terms of trade of the rural prefectures in our sample, leading to a windfall for local producers and a concomitant increase in funds deposited into banks with branches in prefecture $p$. One concern that could be raised against our identification strategy is that banks might strategically choose to expand their branch networks in response to improvements in a prefecture’s terms of trade and to shrink them when the terms of trade deteriorate. We emphasize, however, that our focus here is on year-to-year changes in the terms of trade, not on their longer-term trends. These annual changes are quite volatile and we would therefore not expect a strong feedback on branch networks.
Another issue that warrants discussion is that shocks to the terms of trade could also be shocks to the local demand for credit, since improvements in the terms of trade are also likely to improve investment opportunities for local firms. Again, we believe this to be no major concern since we focus on short-term volatility in the terms of trade rather than their longer-term trends. But even to the extent that short-term fluctuations in the terms of trade do have an impact on firms’ investment and their credit demand, our identification strategy would still hold up, for at least two reasons. The first is that we will analyze how credit supply of urban banks outside the affected prefectures was affected by the terms of trade shocks. If terms-of-trade shocks are uncorrelated between the four prefectures and the bank’s market in the rest of Japan, this ensures the validity of our instrument. Secondly, even if urban banks lent more in the four prefectures after a positive terms of trade shock, this would tend to dampen the impact of the terms of trade shock on credit supply elsewhere in the country, thus tending to reduce the size and significance of the effects that we will report below.
Having constructed the bank-level exposure  ${\text{EXPOSUR}}{{\text{E}}_{bt}}$, we run the following reduced-form regression for the urban banks in our sample:
 \begin{equation}\Delta {\text{lending}}_{bt}^{RoJ} = \gamma \times {\text{EXPOSUR}}{{\text{E}}_{bt}} + {\text{controls}} + {\nu _{bt}}\end{equation}
 where  ${\text{lending}}_{bt}^{RoJ}$ denotes the (logarithm) of lending of bank $b$ in the ‘’Rest of Japan’, i.e. outside the four prefectures. Given our considerations concerning the exogeneity of ${\text{EXPOSUR}}{{\text{E}}_{bt}}$ above, we can then interpret $\gamma $ as the causal impact of terms of trade shocks in the four prefectures on urban banks’ lending in the rest of the country. We obtain data on bank-level lending and deposits outside our four prefectures from yearbook on banks (Toyo Keizai Shinpo-sha, 1925) for the years 1922–5 and for the years after 1925 from the yearbook of the Bank Bureau (Bank Bureau of the Ministry of Finance, various issues)
Our conjectured mechanism is that  ${\text{EXPOSURE}}$ affects lending in the rest of Japan through its impact on deposit supply in the four prefectures. To test this hypothesis, we also consider a structural form of regression (5), in which we regress urban banks’ lending in the rest of Japan on their deposit growth in the four prefectures, instrumented with the exposure measure. Hence the second stage is given by
 \begin{equation}\Delta {\text{lending}}_{bt}^{RoJ} = \delta \times \Delta {\text{deposit}}_{bt}^{\mathcal{P}} + {\text{controls}} + {\nu _{bt}}\end{equation}
and the first stage by
 \begin{equation}\Delta {\text{deposit}}_{bt}^{\mathcal{P}} = \phi \times {\text{EXPOSUR}}{{\text{E}}_{bt}} + {\text{controls}} + {\zeta _{bt}}\end{equation}
 where  $\Delta {\text{deposit}}_{bt}^{\mathcal{P}}$ denotes bank $b$‘s deposit growth across the prefectures in the periphery.
Table 6 shows the results for the reduced-form regression (5). We run the regression on two samples of integrated banks: integrated banks headquartered in Tokyo or Osaka – again labeled here as ‘urban’ – and all other regionally integrated banks present in one of the four prefectures but headquartered outside. Our results suggest that bank-level exposure to terms of trade shocks in the four prefectures significantly affects the lending of the urban banks in the rest of Japan but not that of the banks that are integrated only at the regional level. By contrast, regional banks seem to increase their lending within the four prefectures, suggesting that deposit supply and demand for lending by local industries are indeed correlated.Footnote 19
Table 6. Bank-level lending and exposure to deposit supply shocks

Note: The table reports bank-level panel regressions of the form (5) for both urban (i.e. Tokyo-Osaka head-quartered) and regional integrated banks (where the latter are defined as banks with branches in more than one prefecture but head-quartered outside Tokyo and Osaka). Regressions include bank- and time-effects and standard errors (in parentheses) are clustered by bank. Sample period is 1923–31. Asterisks denote the conventional significance levels: *p $\ \lt \ $0.1; **p $\ \lt \ $0.05; ***p $\ \lt \ $0.01.
To appreciate the order of magnitude of the estimated effects, consider the coefficient on  ${\text{EXPOSUR}}{{\text{E}}_{bt}}$ in the reduced-form regression for the urban banks. This coefficient is around $0.11$. The standard deviation of ${\text{EXPOSUR}}{{\text{E}}_{bt}}$ in the sample of core-headquartered banks is around $0.9$ percent, implying that a typical terms of trade shock to the four prefectures would lead the average country-wide bank to change its credit supply in the rest of Japan by 0.1 percentage points – a sizable effect, given that the four prefectures account for only around only 10 percent of the total deposit base of the urban banks in our sample.
Table 7 shows the results for the first and second stages of the IV regression for the core (urban) banks, i.e. (6) and (7) respectively. For robustness, we also report results based on a version of the instrument (4) in which the weights are based on the share of a banks’ total deposits held in a prefecture rather than on the share of branches. Note that the first stage of the IV-regression has a F-statistics of 18 and 20 for the two exposure measures and the first-stage Wald (Kleibergen-Paap) statistics that are also consistent with clustered standard errors show p-values of effectively zero. This suggests that our exposure measures are indeed a very strong instruments for local deposit supply.
Table 7. IV Regressions for urban banks

Note: The table reports the first and second stages of the IV regression (regressions 7 and 6) of bank-level lending growth outside the four prefectures Fukushima, Tottori, Kumamoto and Myazaki (denoted by  $\Delta {\text{lending}}_{bt}^{RoJ}$) on deposit growth in these four prefectures (denoted by $\Delta {\text{deposit}}_{bt}^{\mathcal{P}}$), instrumented with our bank-level exposure measure, ${\text{EXPOSUR}}{{\text{E}}_{bt}}$, for our sample of 14 urban banks over the sample period 1923–31. We report results for two measures of ${\text{EXPOSUR}}{{\text{E}}_{bt}}$. In columns 1 and 2, ${\text{EXPOSUR}}{{\text{E}}_{bt}}$ is constructed based on the share of the bank’s total numbers of branches in each prefecture; in columns 3 and 4 based on the share of the bank’s total deposits held in each prefecture. Regressions contain bank fixed and head-quarter prefecture-time effects and standard errors (in parentheses) are clustered by bank. Asterisks denote the conventional significance levels: *p $\ \lt \ $0.1; **p $\ \lt \ $0.05; ***p $\ \lt \ $0.01.
The point estimate of the second stage in both specifications is around  $0.035$ and highly significant. This implies that for the average urban bank in our sample, a 10 percentage point increase in deposit growth in the four peripheral prefectures is associated with an increase in country-wide lending growth of around a third of a percentage point. Again, this is a sizable magnitude bearing in mind that for the average urban bank the share of the four prefectures in the total deposit base (and also in the number of branches) was only around 10 percent.
These results suggest that positive terms of trade shocks in the four prefectures in our sample led to a considerable export of liquidity through the branch networks of the modern banks headquartered in Tokyo and Osaka. Branch banks operated internal capital markets by reallocating funds across their branch network in response to local funding supply shocks. These findings provide quantitative evidence that the networks of modern branch banks in Japan did indeed help integrate regional financial markets during the interwar period.
So far, our results do suggest that urban banks exported liquidity from prefectures in the periphery, but they do not answer the question as to whether this export helped improve the efficiency of capital allocation. As we have seen, scholars of Japanese economic history as well as contemporary sources have expressed skepticism with respect to the role of modern branch banking during the interwar period, arguing that urban banks effectively drained traditional industries in local economies of credit. In the following paragraphs, we try to shed further light on this issue.
First, Figure 5 illustrates that the loan–deposit ratios of urban banks were generally lower than those of local banks. The loan–deposit ratios of urban banks were also generally more volatile and not very correlated with those of local banks. This pattern is consistent with the view that both types of banks lent to very different customers and were subject to very different loan demand shocks. At the same time, loan–deposit ratios of local banks were quite flat during the 1920s and in some cases even drifted well below unity towards the end of the period. This suggests that local banks saw stagnant or declining lending opportunities in their local markets – even though their deposit base was at the same time being contested by urban banks.
Turning next to Figure 7, it can be seen that the loan–deposits ratios of urban banks were generally higher outside the four peripheral prefectures in our data set than within them. This pattern is consistent with our interpretation that the export of liquidity reflected the operation of internal capital markets where funds flow from areas with low-return lending opportunities (and therefore low lending–deposit ratios) to higher-return lending opportunities in the core prefectures (and high loan–deposit ratios).

Figure 7. Loan–deposit ratios of urban banks in the four peripheral prefectures and the core
One implication of our mechanism is that, if urban banks found high-return use for deposits in the core prefectures, they should have bid up deposit rates in the periphery, thus draining local banks of funds. To explore this aspect of the mechanism, for local banks, we run branch-level regressions of the form
 \begin{equation}\Delta {\text{outcom}}{{\text{e}}_{ot}} = \alpha \times {\text{COMPETITIO}}{{\text{N}}_{ot}} \times \Delta {\text{ToT}}_t^{p(o)} + \beta \Delta {\text{ToT}}_t^{p(o)} + {\text{controls}}\end{equation}
 where  ${\text{COMPETITIO}}{{\text{N}}_{ot}}$ is a measure of the competition for deposits by urban banks that local branch office $o$ faces and $\Delta {\text{outcome}}$ stands, in turn, for the growth rates of lending and deposits. Our measure of the deposit supply shock is $\Delta {\text{ToT}}_t^{p(o)}$, the change in the terms of trade of prefecture $p(o)$ in which the office is located, that we also used in the construction of the bank-level (cross-prefecture) ${\text{EXPOSURE}}$ of urban banks above.
We use four different measures of deposit competition. The first is the share of branches in prefecture  $p$ that belong to urban banks. The second is the share of total deposits in the prefecture that fall on urban banks. Third, to directly illustrate how the investment opportunities of urban banks outside the periphery increase funding pressure on local banks, we look at the loan–deposit ratio in the core relative to the loan–deposit ratio of bank $b(o)$ to which branch office $o$ belongs. Formally, we have
 \begin{equation}{\text{COMPETITION}} = \frac{{\overline {{\text{LDR}}} _{RoJ}^l}}{{{\text{LD}}{{\text{R}}^b}}}\end{equation}
 where  ${\text{LDR}}$ stands for loan–deposit ratio and $\overline {{\text{LDR}}} _{RoJ}^l = \frac{1}{{\# U(l)}}\sum\nolimits_{b \in U(l)} {\text{LDR}}_{RoJ}^b$ where $U(l)$ is the set of urban banks active in location (prefecture or county) $l$,
$l$,  $\# U(l)$ is the number of elements in that set and ${\text{LDR}}_{RoJ}^b$ is the ratio of all loans to deposits for bank $b$ in the rest of Japan (i.e. outside the four prefectures in our sample). We call (9) the ${\text{LDR}}$ gap. To the extent that loan–deposit ratios are an indicator of the expected returns that banks see in their lending activity, this is meant to capture the return gradient between urban and local banks and therefore their relative willingness to pay for deposits. A high ${\text{LDR}}$ gap should therefore put particularly high funding pressure on local banks by bidding up deposit rates. In our empirical analysis, we use two versions of the ${\text{LDR}}$ gap. One, in which the numerator $\overline {{\text{LDR}}} _{RoJ}^l$ is captured by the average loan–deposit ratio of banks in the prefecture, so that $l = p$ and one, in which $\overline {{\text{LDR}}} _{RoJ}^l$ is constructed at the county-level, so that $l = c$.Footnote 20
Table 8 reports the results for regressions (8) for the various measures of deposit competition. The conjectured mechanism is clearly borne out by the data: deposit supply shocks – as measured by  $\Delta {\text{ToT}}$ – clearly impact deposit growth of local banks positively on their own. But, as conjectured, competition for deposits from urban banks lowers the impact on the deposit growth of local banks’ branches. This is true for all measures of deposit competition.
Table 8. Deposit competition with urban banks – branch-level evidence for local banks’ deposit and lending growth

Notes: The table shows results for regressions of the form (8),  $\Delta {\text{outcom}}{{\text{e}}_{ot}} = \alpha \times {\text{COMPETITIO}}{{\text{N}}_{ot}} \times \Delta {\text{ToT}}_t^{p(o)} + \beta \Delta {\text{ToT}}_t^{p(o)} + {\text{controls}}$, where $\Delta {\text{outcom}}{{\text{e}}_{ot}}$ stands in turn for branch office level deposit growth (in columns 1--4) and lending growth (in columns 5–8), $\Delta {\text{ToT}}$ is the terms of trade shock and ${\text{COMPETITION}}$ is our measure of deposit competition. For both deposits and lending growth we reports results based on four different measures of ${\text{COMPETITION}}$. The first is the share of branches in prefecture $p$ that belong to urban banks (columns 1 and 5). The second is the share of total deposits in the prefecture that fall on urban banks(columns 2 and 6). Finally, we use the LDR gap as defined in equation (9), once computed at the prefecture level (columns 3 and 7) and once at the county level (columns 4 and 8). Standard errors (in parentheses) are clustered by bank and asterisks denote the conventional significance levels:
* p $\ \lt \ $0.1; **p $\ \lt \ $0.05; ***p $\ \lt \ $0.01.
Turning to lending growth next, we see that the stand-alone term of  $\Delta {\text{ToT}}$ is generally not significant and the point estimate actually negative. This suggests that during our sample periods, positive terms of trade shocks in the peripheral prefectures did not necessarily lead to higher lending by local banks, consistent with the view that growth expectations in traditional industries were already relatively low. The interaction term with deposit competition is also significantly negative throughout, which suggests that increasing funding pressure also made it more expensive for local banks to lend, thus lowering credit demand from local traditional, low-return industries.
One implication of our mechanism is that deposit competition by urban banks should affect lending conditions by local banks via the deposit rate. We examine this implication using data on branch-level lending and deposit rates that are, however, available for only one of our four prefectures, Fukushima. We use the  ${\text{LDR}}$ gap at the bank-county level (there are four counties in Fukushima prefecture) as a measure of deposit competition and use it to instrument branch-level deposit rates. In the second stage, we then regress lending conditions – banks’ lending rates and their net interest margins – on instrumented deposit rates.
Table 9 shows the results of these two-stage least squares regressions. First, it turns out that the  ${\text{LDR}}$ gap is indeed a strong instrument for branch-level deposit rates, consistent with our conjectured mechanism. Interestingly, the second-stage effect of deposit rates on lending rates is insignificant and its point estimate even negative. Turning to the net interest margin, we see that rising deposit rates reduce net interest margins, suggesting that the pass-through of deposit competition does not generally increase interest rates for borrowing firms but the margins charged by local banks.
Table 9. Local banks’ branch-level deposit rates and lending conditions – 2SLS regressions

Notes: The table shows results of the two-stage least squares (2SLS) regression of local banks’ branch-level lending conditions (lending rates and net interest margins) on deposit rates, instrumented with the county-level  $\overline {{\text{LDR}}} gap$ as defined in equation (9) above. Data are for Fukushima prefecture for the sample period 1923–31. Standard errors clustered at the bank level are reported in parentheses. Asterisks denote the conventional significance levels: *p $\ \lt \ $0.1; **p $\ \lt \ $0.05; ***p $\ \lt \ $0.01.
Hence, our results show that local banks did face higher deposit rates due to competition from urban banks and that they did indeed reduce lending in response. However, reduced lending also went in hand with imperfect pass-through of interest increases to local banks’ borrowers This suggests that local banks shifted the composition of their lending towards less risky borrowers and more efficient firms which in turn allowed them to charge lower risk premia.Footnote 21
V
The unstable financial market after World War I dramatically changed the Japanese financial system. A wave of bank mergers led to large-scale urban banks, associated with larger branch networks, that is, the development of branch banking. In this article, we explore the implications of branch banking for regional finance, using unique bank office-level data for four rural prefectures.
Our results provide quantitative evidence that branch banking contributed to integrating regional banking markets with the rest of the country in the 1920s. In particular the larger banks headquartered in Tokyo and Osaka do seem to have operated internal capital markets, using shocks to deposit supply in peripheral prefectures as funding for lending elsewhere in the country.
An important narrative in the earlier historical literature as well as in contemporary sources is that the expansion of branch banking during the 1920s drained traditional industries of credit, accelerating their relative decline. The financial authorities and prefectural governments were concerned that bank mergers and the expansion of branch networks of banks headquartered in the core prefectures would cause a shift of funds from regional markets to the central market in the core prefectures of Tokyo and Osaka.
This ‘traditional’ view effectively corresponds to a conventional paradigm in the academic banking literature which emphasizes the importance of relationship-based lending by small local banks to small local firms. We have argued that this view does not actually stand in contradiction to the ‘modern’ view, which sees regional banking integration as a prerequisite for the operation of internal capital markets and the efficient reallocation of capital across geographies and sectors.
Our results provide strong empirical evidence that reconciles the traditional and the modern views. Specifically, even after branch networks of the big urban banks became geographically integrated, a functional segmentation of banking markets persisted and meant that both local and urban banks continued to lend to very different customers. Local banks remained specialized on a relationship-based business model of local lending to traditional industries such as agriculture, silk reeling and cotton weaving (Ito Reference ITO1975; Takashima Reference TAKASHIMA1979). Conversely, urban banks mainly provided loans to large firms in modern industries, such as trading, cotton spinning, electricity, marine shipping and cement (Mitsui Bank Reference MITSUI1957; Asai Reference ASAI1975). When the geographical expansion and institutional consolidation (through mergers) of branch networks accelerated the integration of banking markets during the 1920s, this generally did not directly affect credit supply to local borrowers in the periphery. Rather the integration mainly affected funding markets. Faced with high-return lending opportunities in the core prefectures, urban banks were able to pay high deposit rates, thus bidding up refinancing rates for local banks. While local banks reduced lending, they also lowered their interest margins, which suggests that they reallocated credit to less risky and more efficient borrowers, which allowed them to charge lower risk premia. In the aggregate, the effect was a major – and overall efficient – reallocation of capital towards higher-growth regions and industries.
Our results illustrate that geographical integration and increased competition in deposit markets can achieve efficient fund allocation while preserving the advantages of functional specialization (and thus de facto segmentation) in the banking sector. We speculate that this could be one explanation for the persistence of a ‘dual structure’ (as first explored in the Japanese context by Nakamura (Reference NAKAMURA1971)) in the banking markets of many developed countries today, where small local and large, geographically integrated banks coexist in different ‘preferred habitats’, serving largely different groups of borrowers while competing in an integrated deposit market.


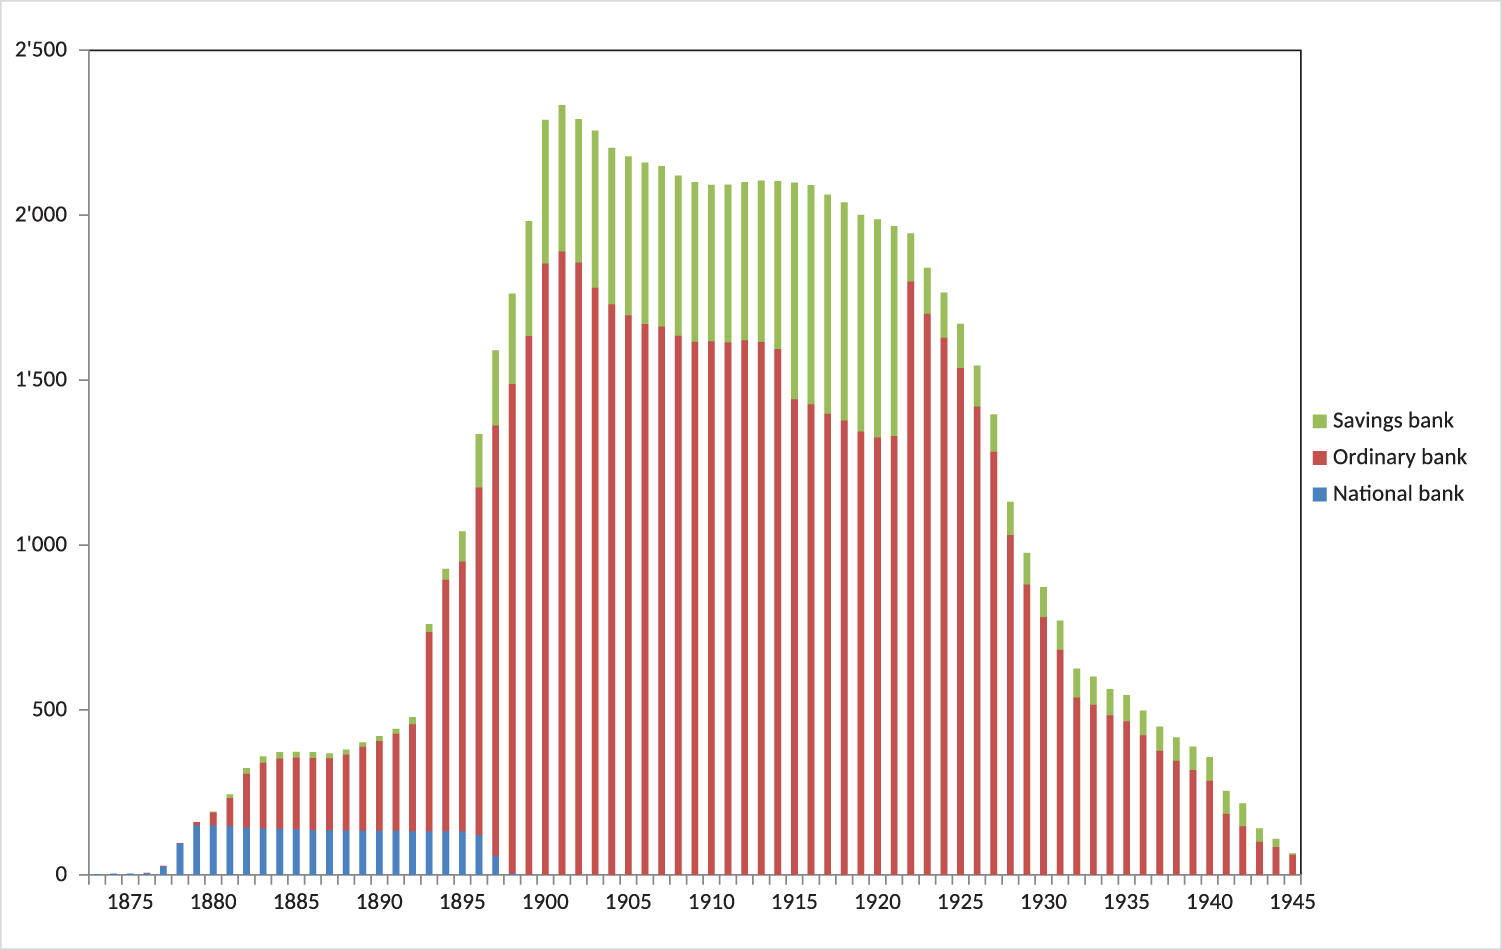
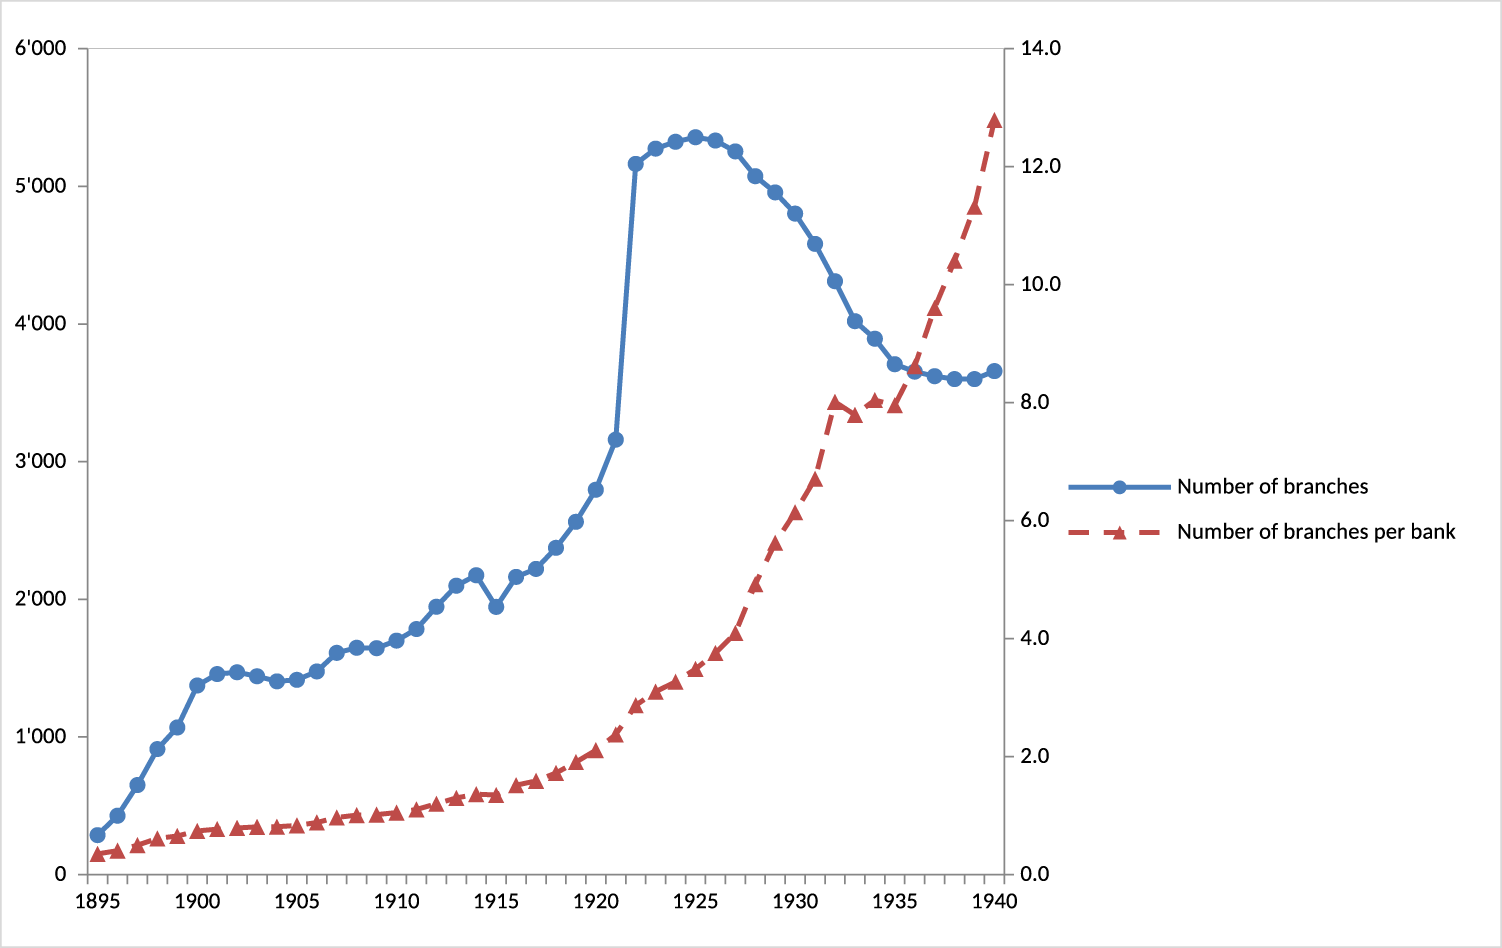
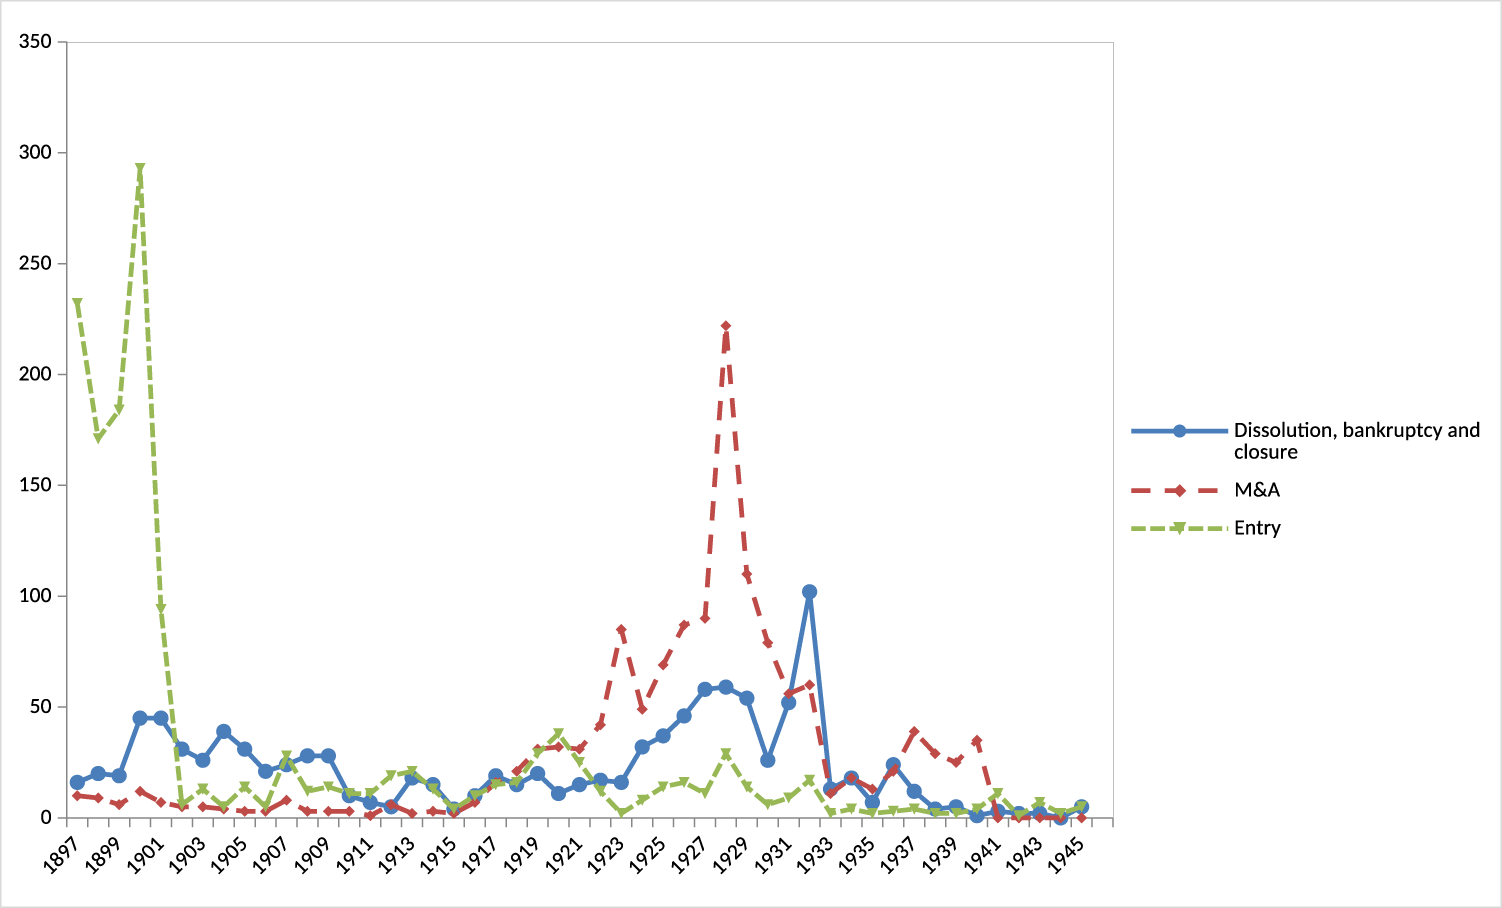

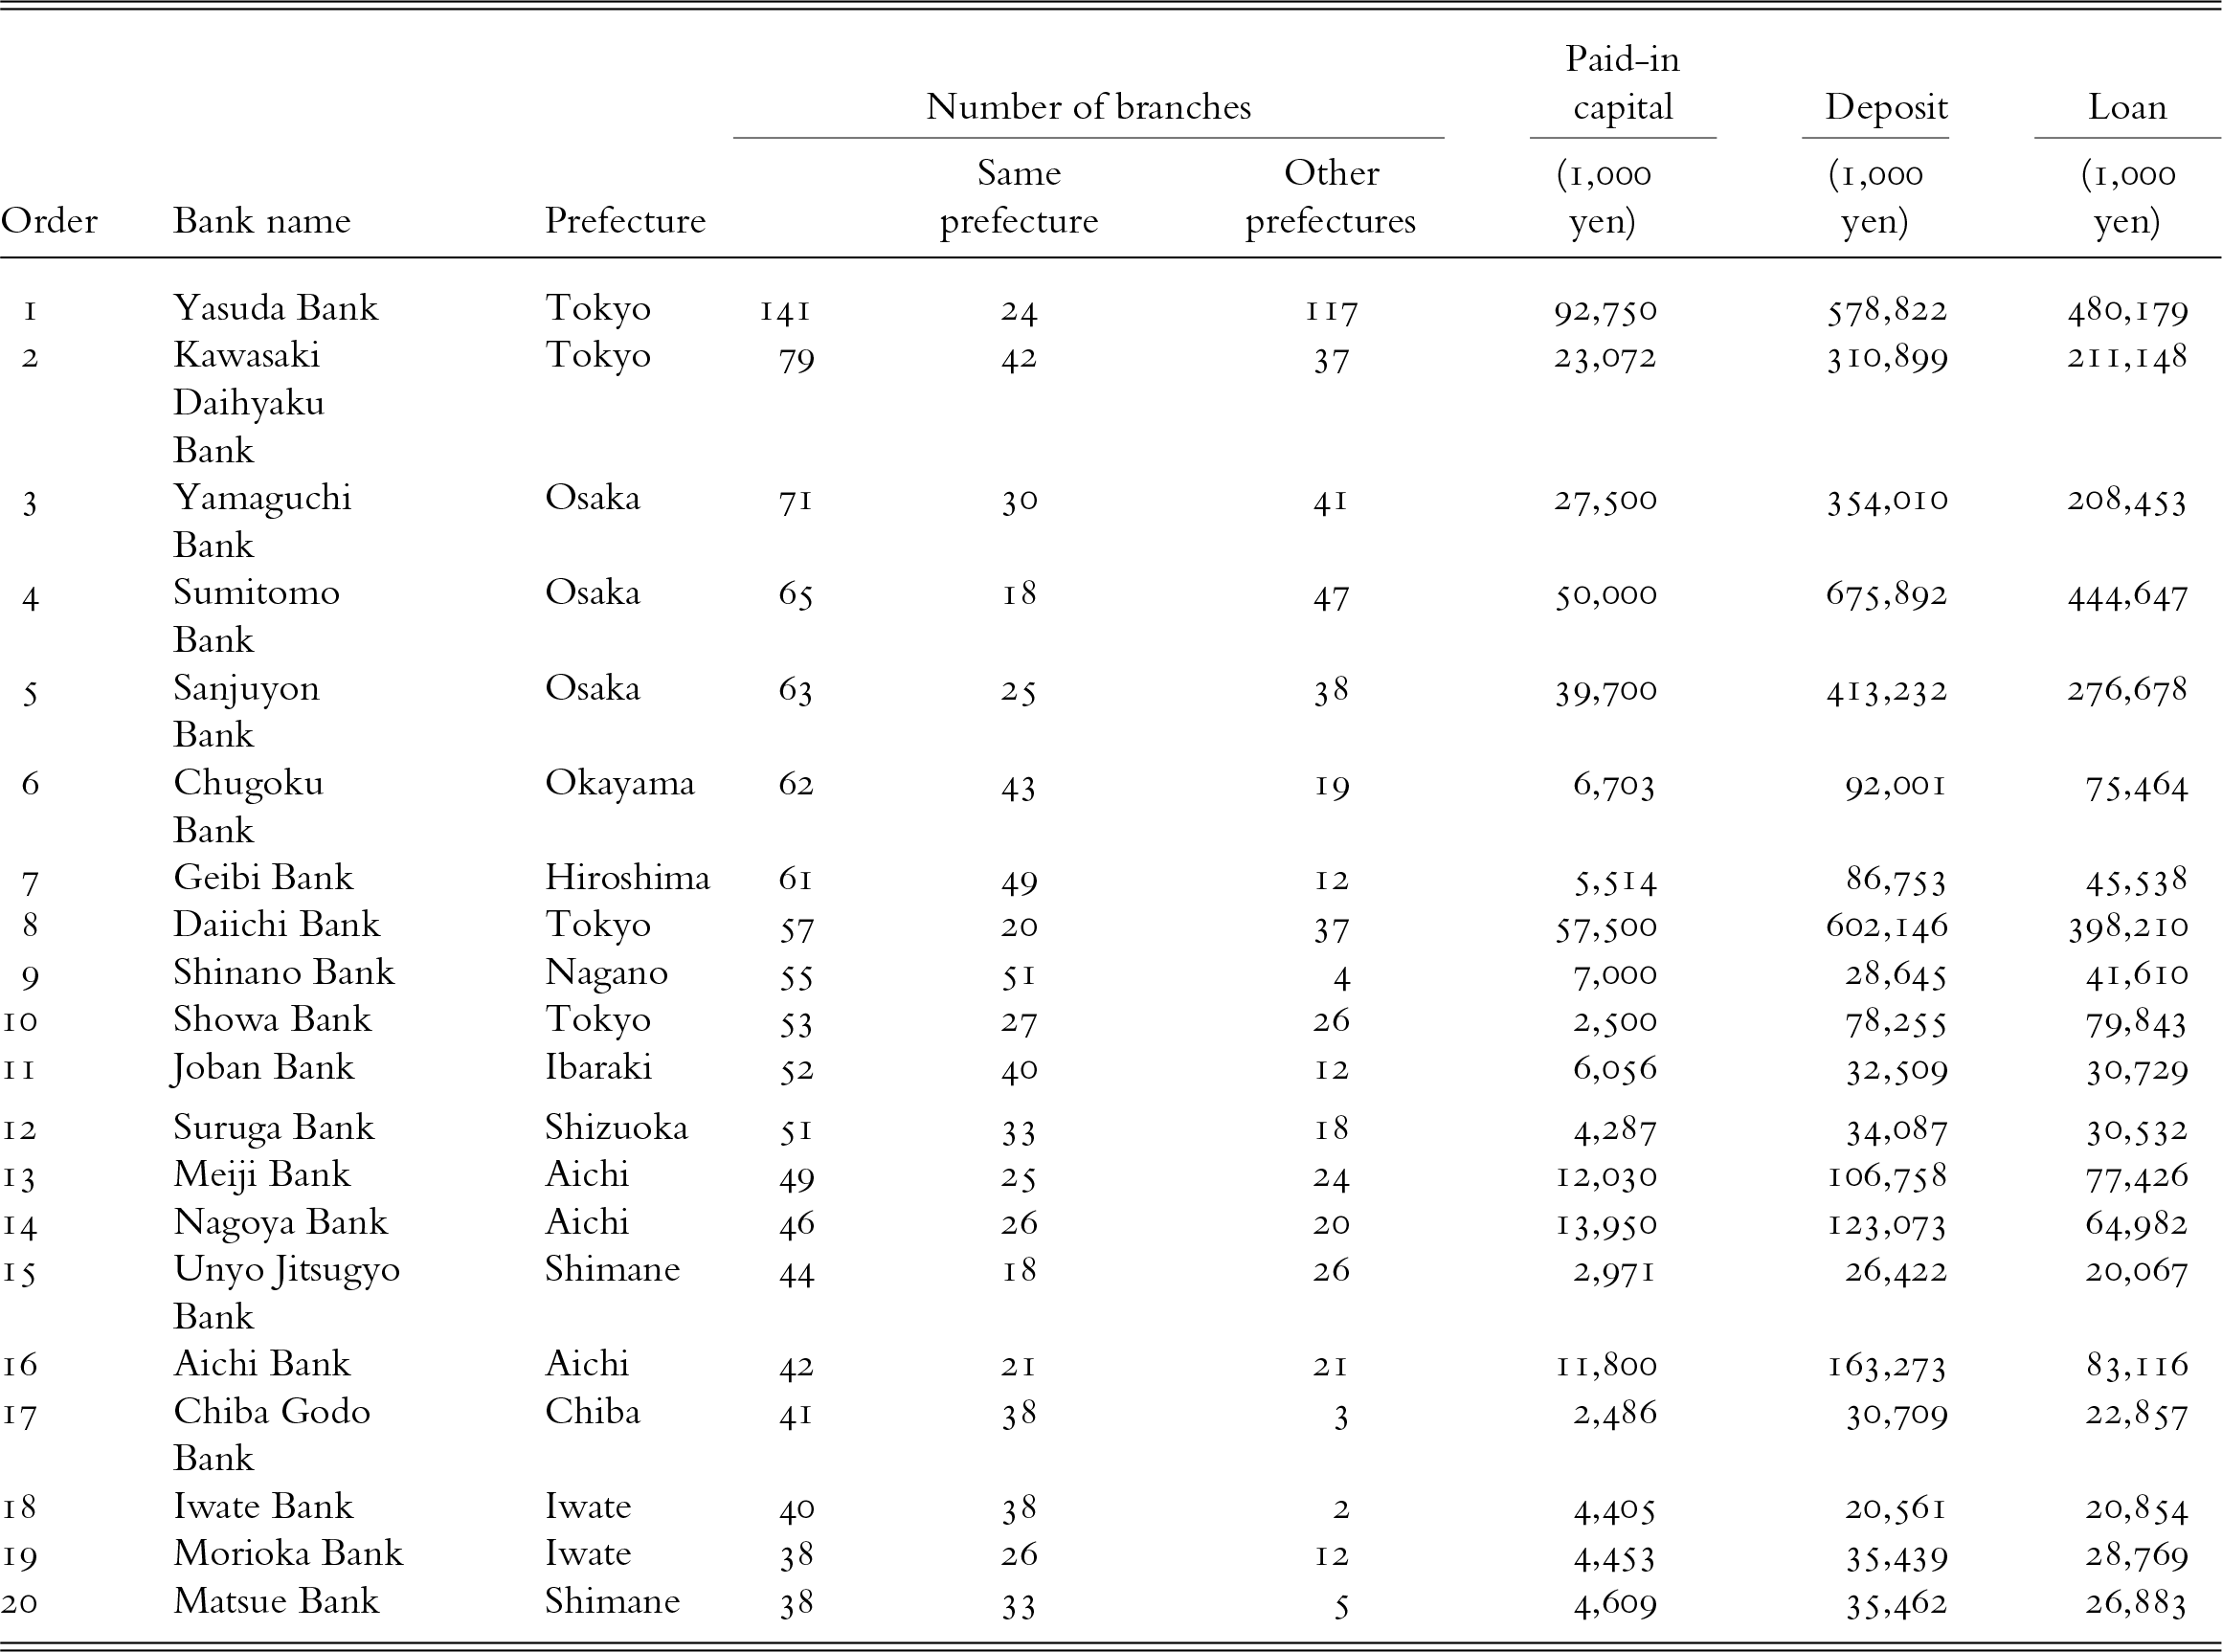


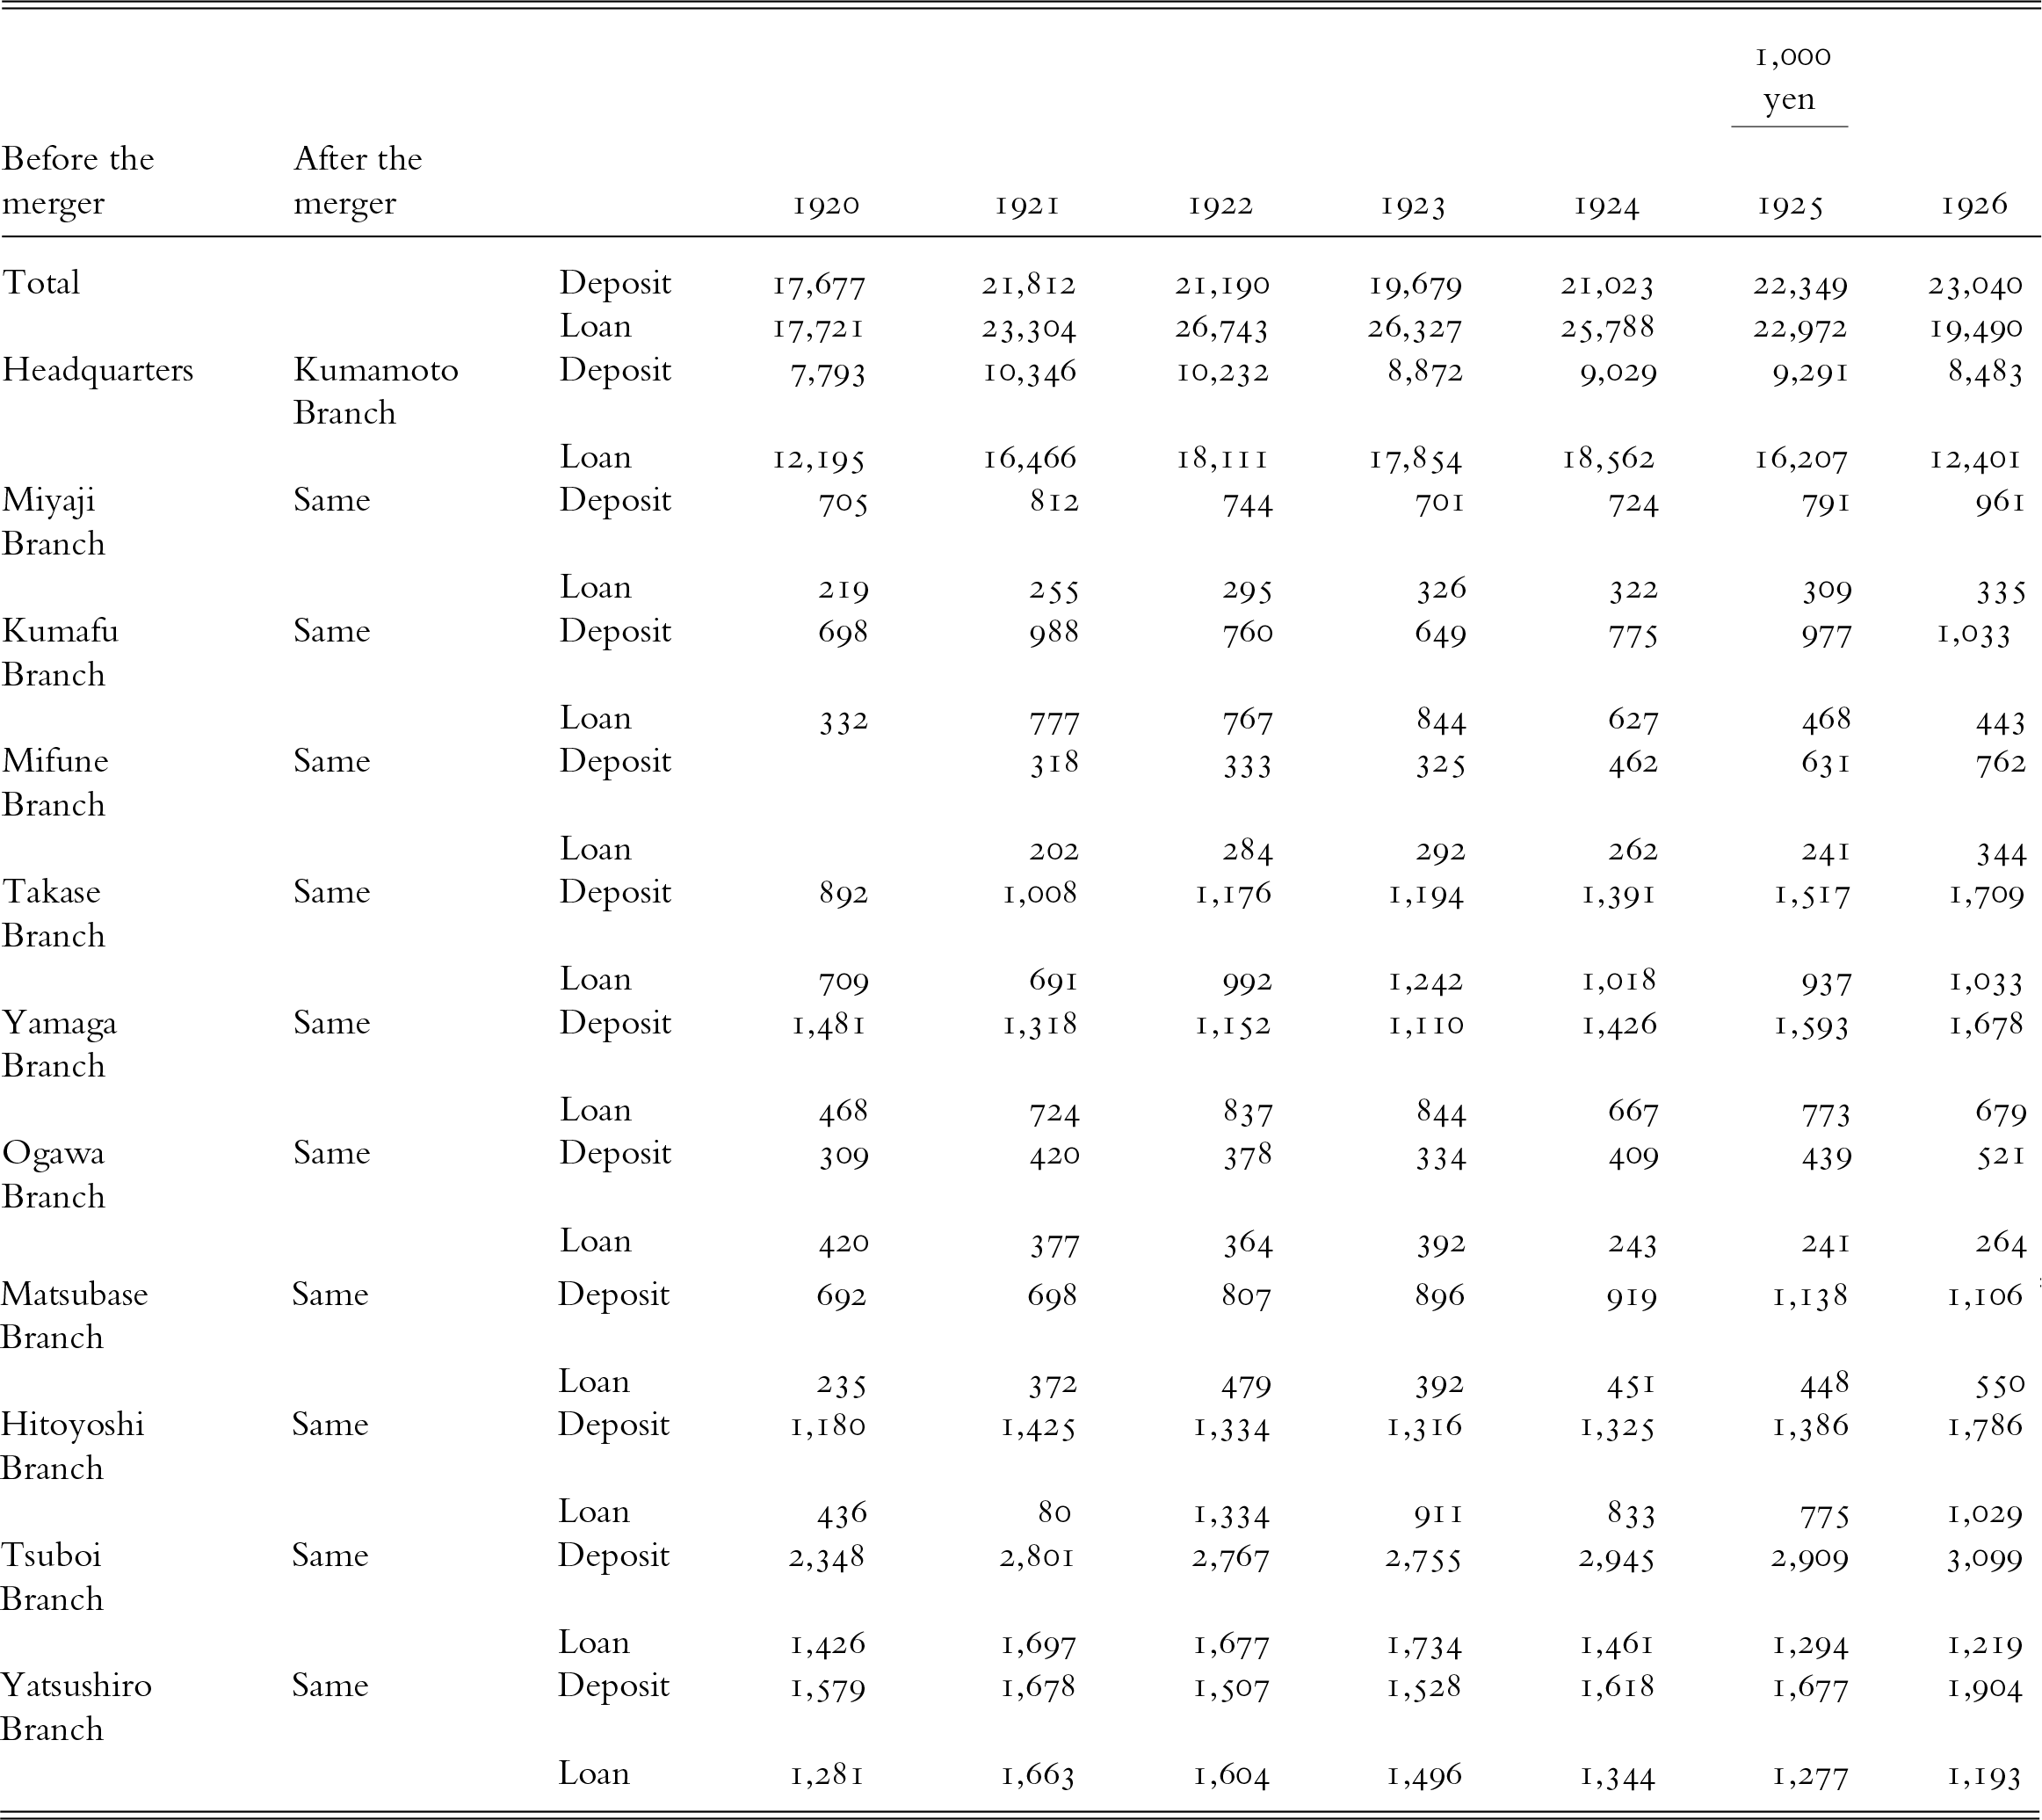

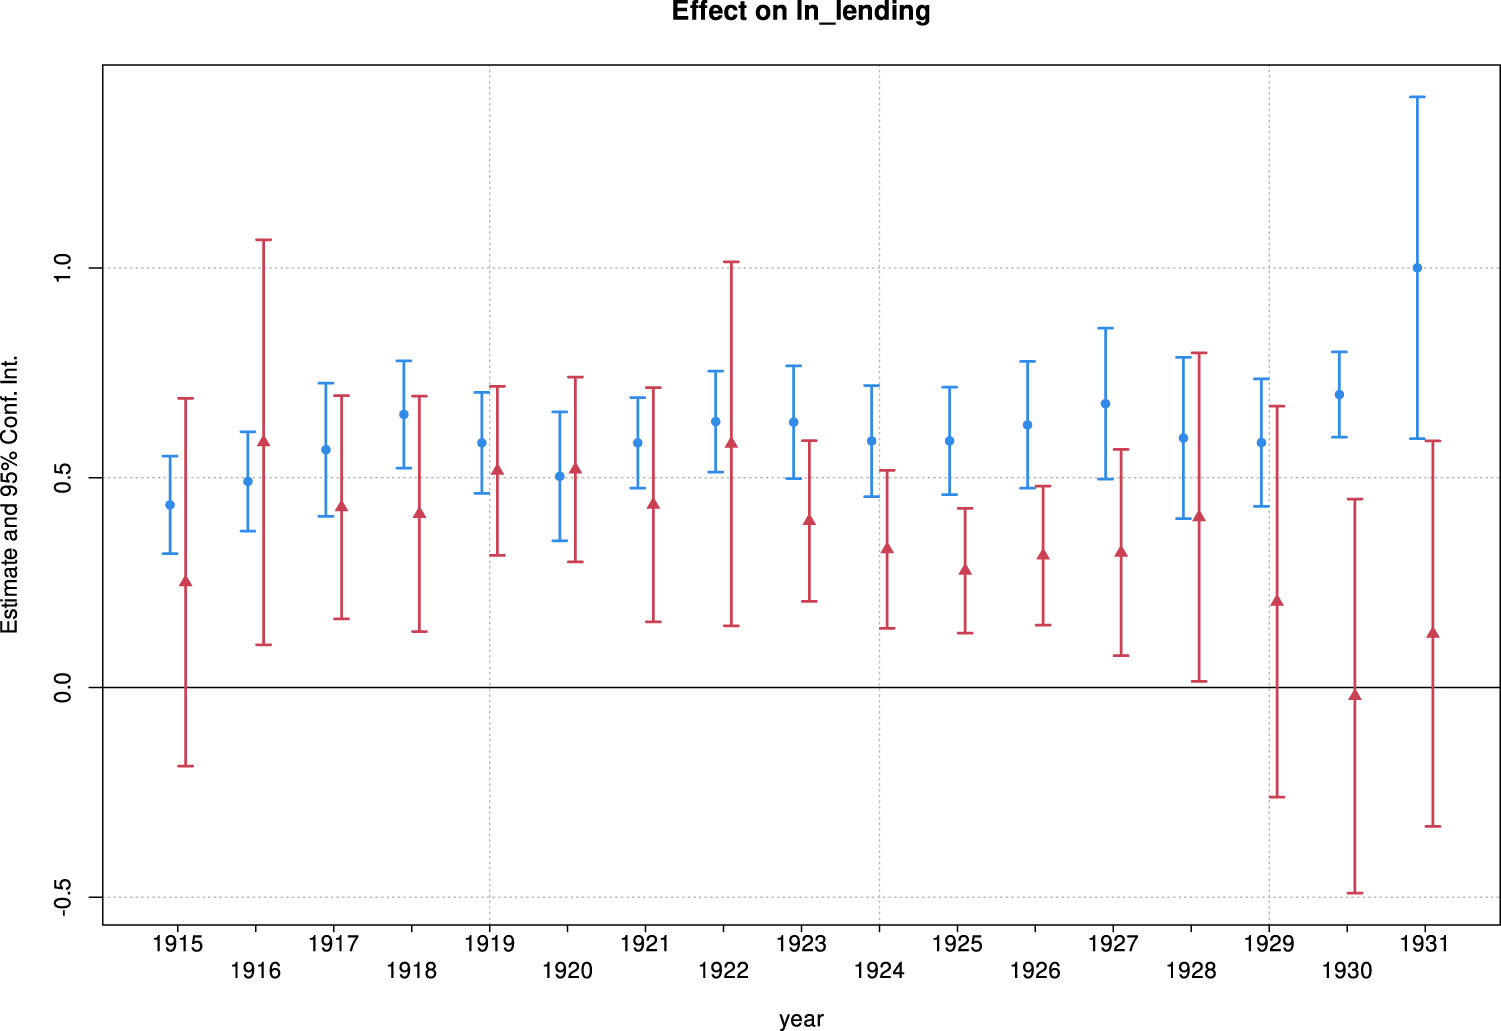


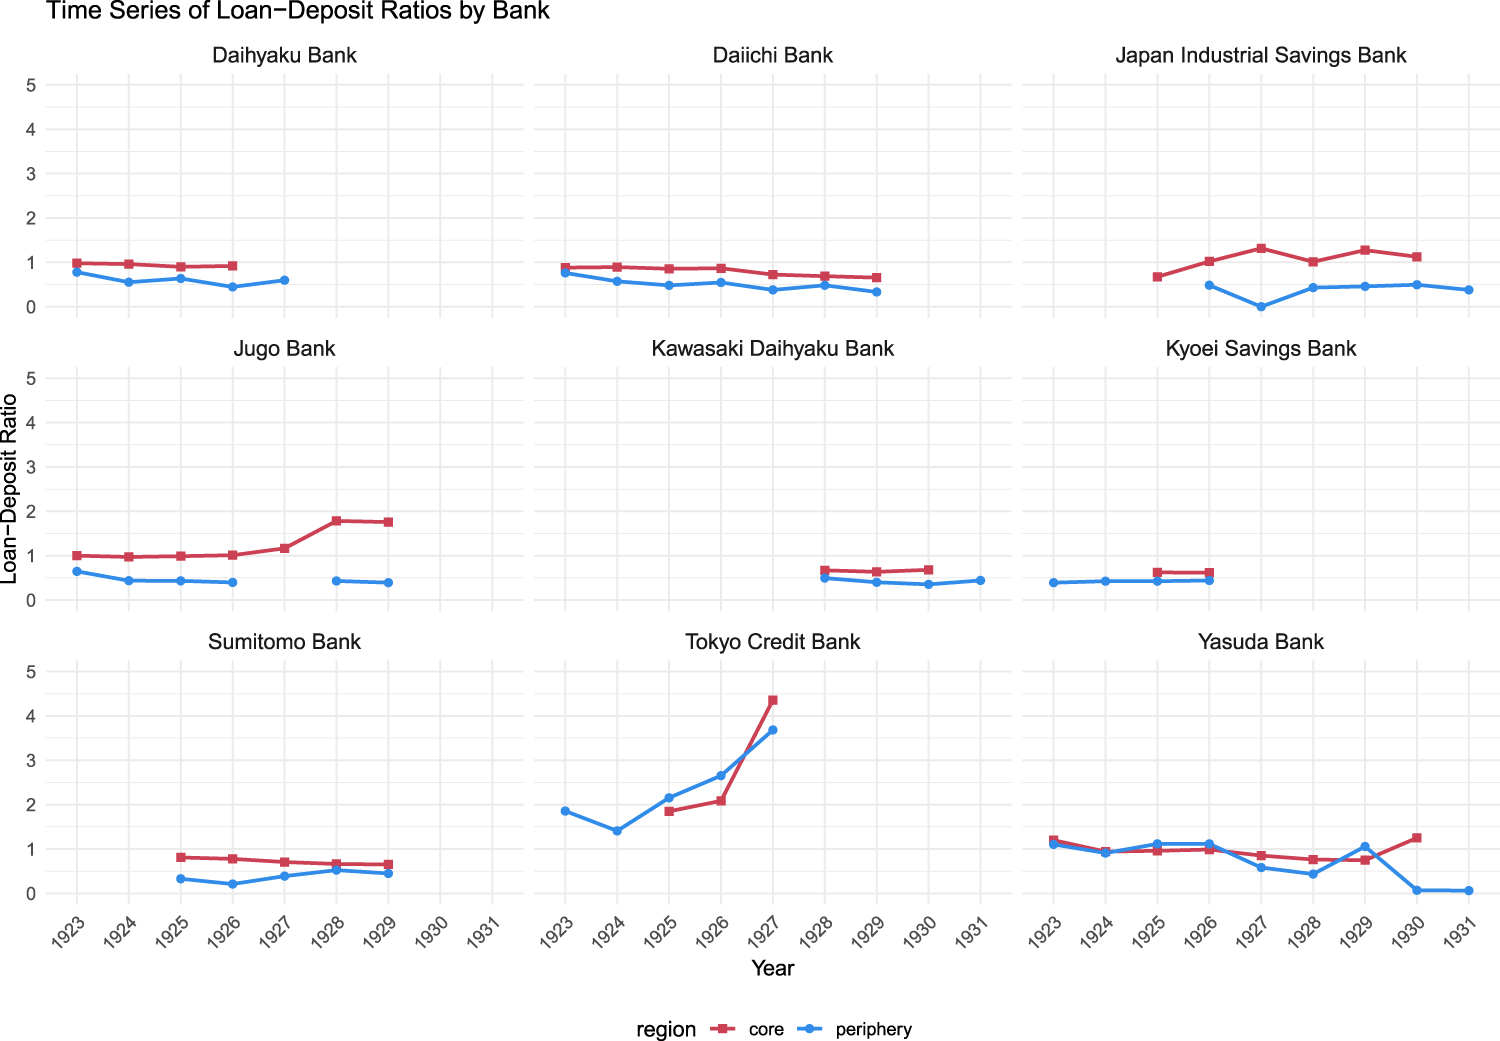
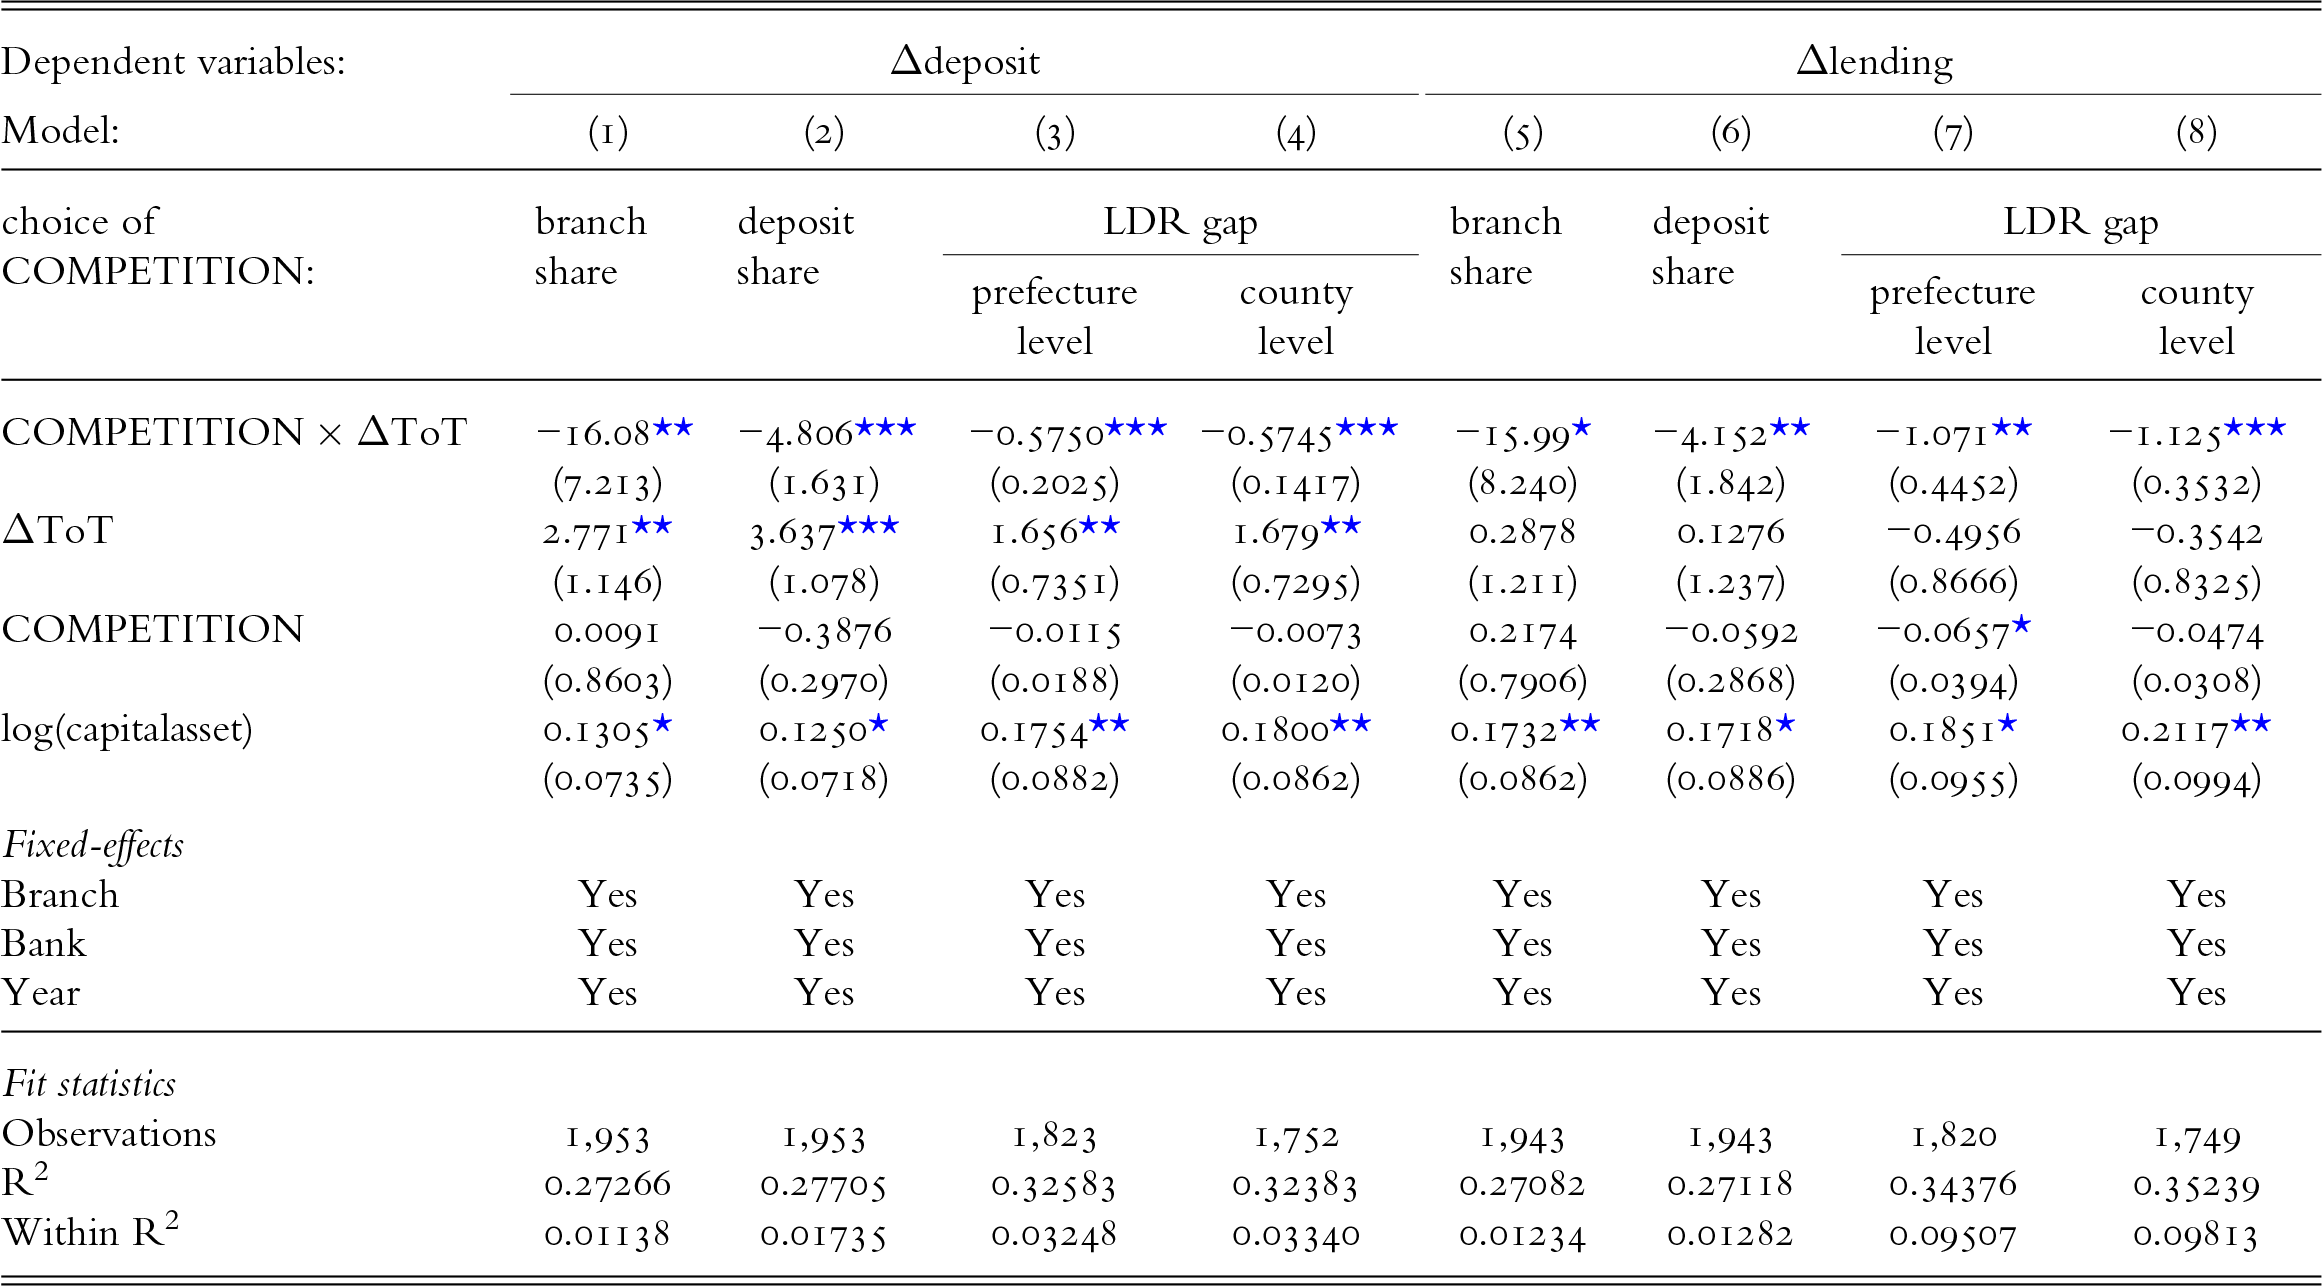


 Open access