


1. Introduction
Glaciers serve as the reliable indicators of climate change, with glacier mass balance reflecting changes in regional and local meteorological conditions (Oerlemans, Reference Oerlemans2001; Vincent and others, Reference Vincent2018). Most of the world’s glaciers are out of balance and wasting mass due to climate change in recent decades (Hock and others, Reference Hock2019). The Himalaya–Karakoram (HK) region has ∼39 660 glaciers covering an area of ∼42 535 km2 and an ice volume of ∼3422 km3 (Jackson and others, Reference Jackson2023). These glaciers serve as the source for the Indus, Ganga and Brahmaputra River systems, supplying water to support over one billion people (Azam and others, Reference Azam2021).
In the Himalayan Range, ∼35 glaciers have been monitored in the field for glacier-wide mass balance using the in situ glaciological method (Vishwakarma and others, Reference Vishwakarma2022). Most of these glaciers are small, often having extensive debris cover and sometimes lacking a well-developed accumulation area (Azam and others, Reference Azam2018); therefore, their behaviour may not be representative of large glaciers. For instance, Pokalde and West Changri Nup (located in Dudh Koshi Basin, central Himalaya) are debris-free, small (0.1 km2 and 0.9 km2, respectively) and low-lying glaciers with small elevation ranges (5430–5690 and 5330–5690 m a.s.l., respectively) and may have a bias towards negative mass balances (annual-glacier-wide mass balances of −0.69 ± 0.28 meter water equivalent (m w.e.) a–1 over 2009–15 and −1.24 ± 0.27 m w.e. a–1 over 2010–15, respectively) (Sherpa and others, Reference Sherpa2017). Further, Dunagiri (2.6 km2; central Himalaya) and Hamtah (3.2 km2; western Himalaya) glaciers, having extensive debris cover (∼80%) and lacking a proper accumulation area, also showed highly negative mass balances (–1.05 m w.e. a–1 over 1984–90 and −1.43 m w.e. a–1 over 2000–12, respectively), and have negative biases in estimated glacier-wide mass balances (Vincent and others, Reference Vincent2013; Laha and others, Reference Laha2017).
The available glaciological studies are primarily concentrated in the Khumbu and Garhwal regions of the central Himalaya and the Baspa and Chandra basins in the western Himalaya, while no observations are available from the Zanskar Range (Ladakh Region, western Himalaya), eastern Himalaya and the Karakoram Range (Azam and others, Reference Azam2018).
The Ladakh Region is a cold-arid mountain range (Archer and Fowler, Reference Archer and Fowler2004). Therefore, meltwater from glaciers and snow covers is socio-economically important for the remote villages therein (Nüsser and others, Reference Nüsser, Dame, Kraus, Baghel and Schmidt2019; Soheb and others, Reference Soheb2024). Climate change has an evident and direct impact on the region’s livelihood—especially during spring and dry years—through changes in seasonality and volumes in river runoff (Schmidt and Nüsser, Reference Schmidt and Nüsser2017; Mandal and others, Reference Mandal2024). Despite the critical importance of glaciers in the Ladakh Region, only three glaciers have been monitored for their mass balances. Rulung Glacier (1.10 km2) was observed for its mass balance only for 2 years over 1979–81 (–0.11 m w.e. a–1) (Srivastava, Reference Srivastava2001). Pensilungpa Glacier (10.62 km2) has been observed over 2016–19 (–0.36 m w.e. a–1) (Mehta and others, Reference Mehta, Kumar, Garg and Shukla2021), and Stok Glacier (0.74 km2) was observed over 2014–19 (–0.39 m w.e. a–1) (Soheb and others, Reference Soheb2020). The Zanskar Range (14 817 km2) lies northwest of the Ladakh Region (Soheb and others, Reference Soheb2022) and has 1243 glaciers, covering an area of 1036 km2. However, no glacier has been observed in the Zanskar Range for in situ glacier-wide mass balance and other field investigations.
To address the monitoring gap for large glaciers—which mainly control the catchment hydrology due to their large ice volume—in the HK region (Soncini and others, Reference Soncini2015), in September 2021, we initiated a glaciological mass-balance monitoring program on a large (69.6 km2) relatively clean-ice glacier, Drang Drung, in the Zanskar Range of Ladakh Region in the western Himalaya. This newly initiated mass-balance program on Drang Drung Glacier will provide long-term integrated field monitoring to serve it as a benchmark glacier for process-based understanding in the north-west Himalayan region, following the guidelines of international climate-related glacier monitoring (‘tier-2’ level labelled in Paul and others, Reference Paul, Kääb and Haeberli2007). This article provides initial field observations on Drang Drung Glacier. First, we present the 2 years of in situ glacier-wide mass balances and vertical mass-balance gradients from 2021 to 2023. Second, we address the limitations of the accumulation measurements. Third, we compare the vertical mass-balance gradients of Drang Drung Glacier with those of other glaciers in High Mountain Asia (HMA).
2. Study area
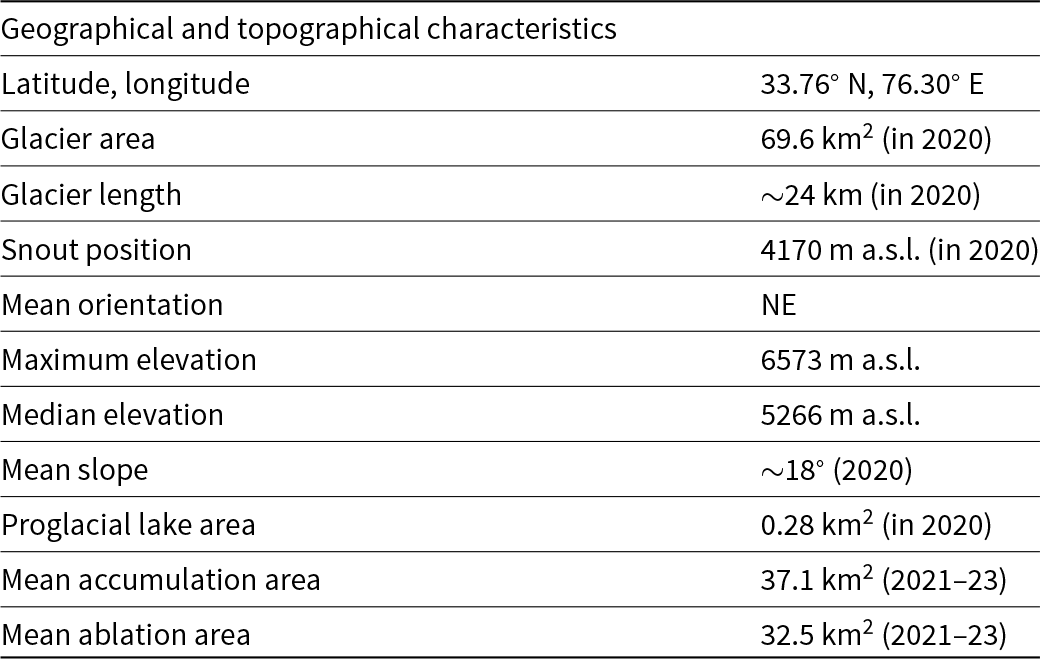
Drang Drung Glacier (33.76° N, 76.30° E) is in the Zanskar Range, Ladakh Region (western Himalaya). Drang Drung Glacier snout is located just below the Pensi La, which is a mountain pass (∼4400 m a.s.l.) that makes a hydrological/water divide between the Zanskar Valley and the Suru Valley. It is one of the easy-access glaciers in the Himalaya (∼1.5 km from the road). Drang Drung is the largest glacier in the Zanskar Range and the Ladakh Region, with an area of 69.6 km2 (in 2020; Fig. 1). It flows from the Doda peak (6573 m a.s.l.) over a length of ∼24 km and terminates in a proglacial lake at 4170 m a.s.l. Drang Drung Glacier is an elongated valley glacier with well-defined ablation and accumulation areas and a mean slope of ∼18° (Fig. 1). It is a relatively clean-ice glacier with only 9.2% (6.4 km2) of debris-covered area concentrated towards the terminus with occasional ice cliffs. The debris thickness varies from a couple of centimetres, with sporadic boulder distribution, to 20–30 centimetres towards the extreme edges. The recent accelerated glacier retreat (13.84% area shrinkage over 1971–2017) resulted in a proglacial lake formation ∼2014 (Rashid and Majeed, Reference Rashid and Majeed2018). This proglacial lake (0.28 km2 area in 2020) drains out through a single stream called Doda (or Stod) River that flows south-eastwards and meets with the Tsarap River at Padum town and becomes the Zanskar River that further meets with Indus River at Nimmoo village at Leh city. The snow and glacier meltwater contributions to the Doda River is vital for irrigation and domestic needs in several villages, including Abran, Phey and Padum, with ∼900 households and a population of ∼5000 population. The glacier hypsometry and proglacial lake area were calculated by manually delineating a 2 m high-resolution Pléiades image from 24 September 2020. A preliminary bathymetry survey suggests a lake volume of 0.18 × 10⁶ m3 in 2021 (Ramsankaran and others, Reference Ramsankaran, Verma, Majeed and Rashid2023). Table 1 lists the geographical, topographical and glaciological characteristics of Drang Drung Glacier.
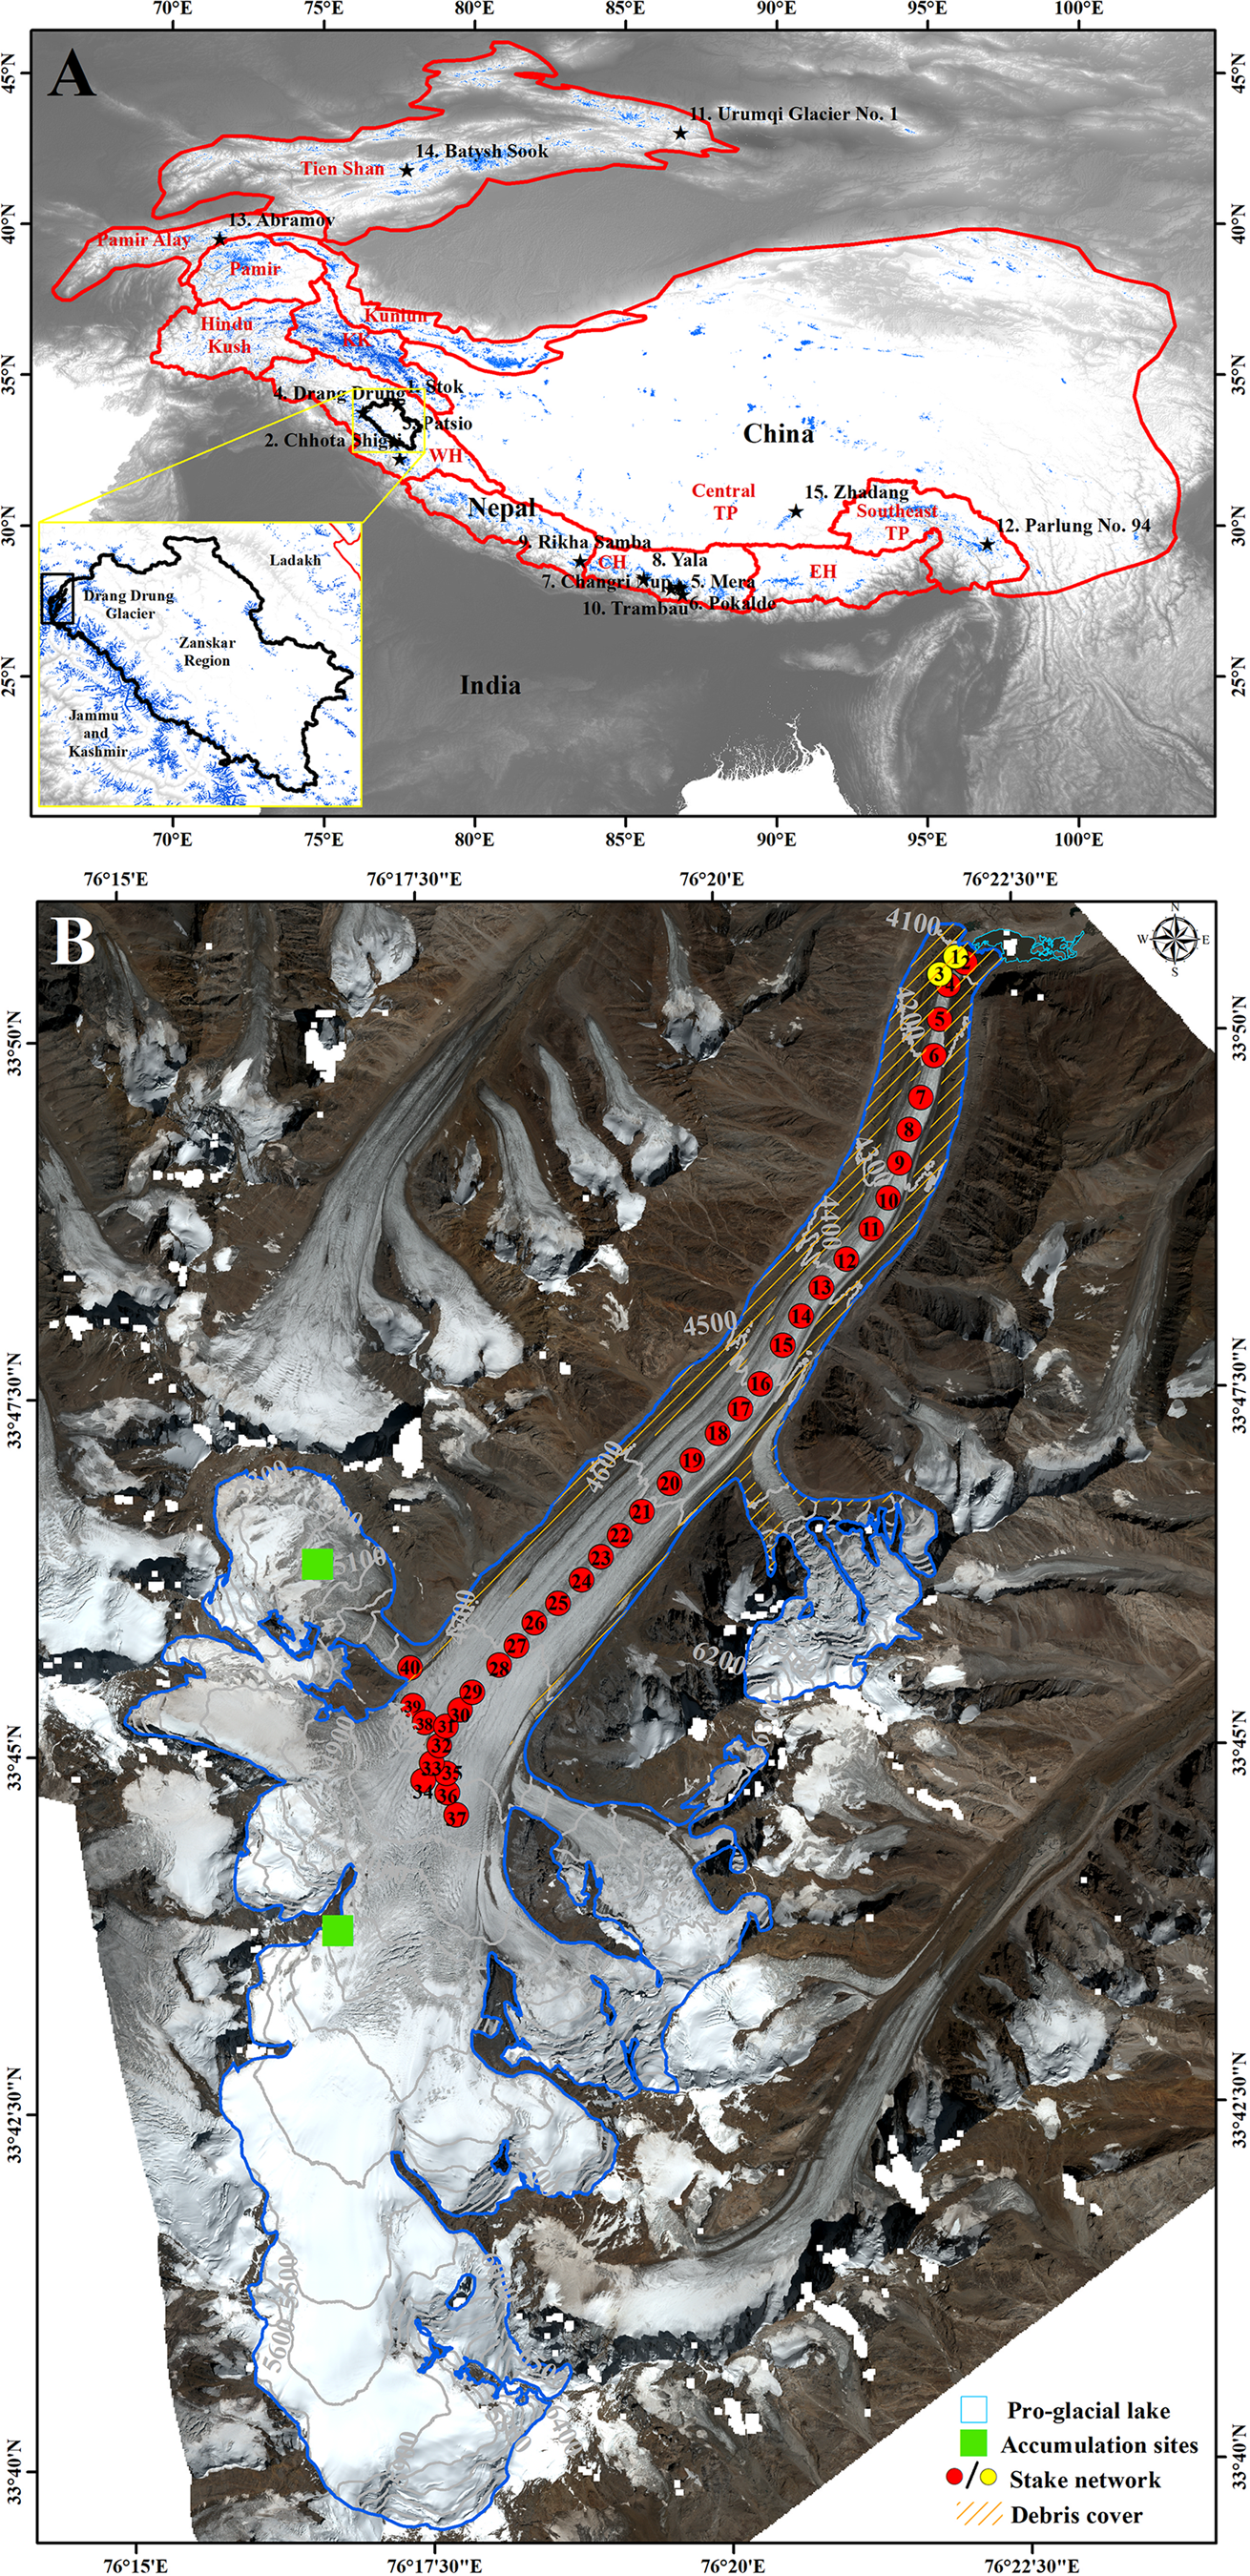
Figure 1. (A) High Mountain Asia (HMA) region showing the Zanskar Range in the Ladakh region. The shape files for HMA are from Brun and others (Reference Brun, Berthier, Wagnon, Kääb and Treichler2017). The location of 15 glaciers used in section 5.2 are also shown. (KK = Karakoram, WH = western Himalaya, CH = central Himalaya, EH = eastern Himalaya and TP = Tibetan Plateau). (B) Drang Drung Glacier showing the locations of ablation stakes (red colour dots for clean ice/yellow colour dots for debris-covered ice), and accumulation sites (green squares). The background image is a high-resolution Pléiades image from 24 September 2020 (© CNES 2020, distribution Airbus Defence and Space). The glacier outline (blue polygon) corresponds to the same image. Thin lines on the map show the 50 m contours. A few stakes were installed in September 2021 along a transverse cross section between 4750 and 4800 m a.s.l. but could not be found in consecutive expeditions.
Table 1 Geographical and topographical characteristics of Drang Drung Glacier
3. Methods
3.1. Glacier-wide mass balance
Glacier-wide mass balance is the net balance between ablation and accumulation processes at glacier-wide scale and expressed in m w.e. We used the classical glaciological method to estimate the glacier-wide mass balance (Østrem and Brugman, Reference Østrem and Brugman1991). The point ablation measurements were taken using a stake transact of 40 bamboo stakes inserted at 400–500 m intervals in the glacier between 4050 and 4850 m a.s.l. during the last week of September every year using the Heucke steam drill. Due to the Drang Drung Glacier’s elongated shape, ablation stakes were mainly inserted along the medial flow line (Fig. 1). The length of the ablation stakes varies from 10 to 12 m in the lower ablation area (stake 1 to 20 between 4050 and 4600 m a.s.l.) to 8 m in the upper ablation area (stake 21 to 40 > 4600 m a.s.l.). The lower ablation area is debris covered towards the edges. Over this region, two ablation stakes were inserted over the thin debris–covered (1–2 cm thick) area parallel to the main stake network to observe the melt over the thin debris-covered area (Fig. 1). The thick debris–covered area, concentrated towards the sidewalls, was not accessible due to crevassed, unstable slopes; hence, no stake could be installed (Fig. 2A).
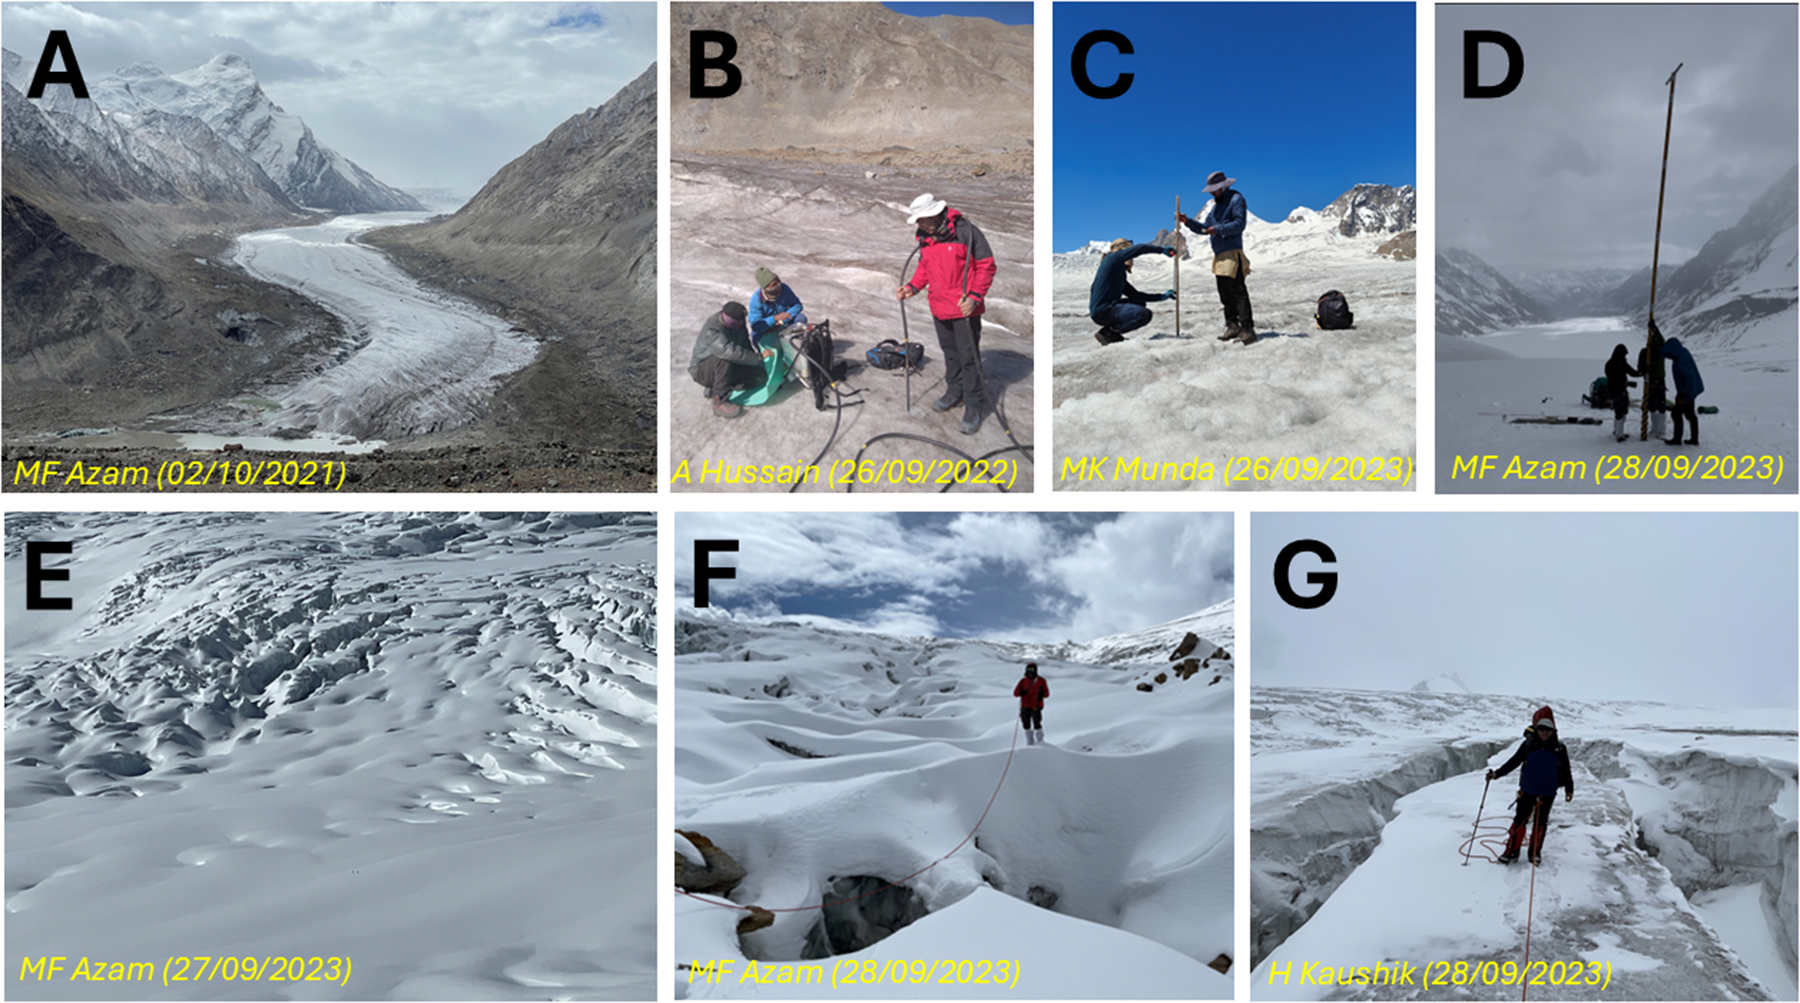
Figure 2. Field photographs showing Drang Drung Glacier with proglacial lake, glaciological measurements and surface topography. Details about each panel are given in the picture inset. The photo credit and acquiring dates are given on each panel. (A) Drang Drung with proglacial lake, picture taken from Penzi La (∼4400 m a.s.l.); (B) Stake installation (4075 m a.s.l.); (C) Stake measurement (4795 m a.s.l.); (D) Accumulation measurement (5230 m a.s.l.); (E) Synoptic view of crevassed area; (F, G) Crevasse negotiation (∼5100 and ∼5200 m a.s.l., respectively).
In the accumulation area, two accumulation cores (one in the western tributary at 5225 m a.s.l. and the other in the main glacier at 5230 m a.s.l.) were drilled using an ice corer (Kovacs Mark VI) during the last week of September each year to estimate the point–scale accumulation (Figs. 1 and 2). The coring was done until last year’s surface was found (up to 3–4 m deep; Fig. 2D), clearly marked with a dirty, refrozen icy layer. The density of accumulated snow/firn was estimated along the core length and was found to be ranging from 0.39 to 0.58 g cm–3, with a mean density of 0.52 g cm–3. The main accumulation area is separated from the ablation area with a dense network of interwoven transverse and longitudinal crevasses spread over 5050–5350 m a.s.l. (Fig. 2E–G). These crevasses pose significant technical challenges for accessing the accumulation area. We could reach only up to 5230 m a.s.l. in the main accumulation area in September 2022 and September 2023 (Fig. 2D). Due to this access restriction, in our glacier-wide mass-balance calculations (Eqn (1)), we assumed a uniform distribution of snow accumulation (a mass-balance gradient of 0.00 m w.e. (100 m)–1); hence, the observed annual net snow accumulation at 5230 m a.s.l. was extrapolated to the higher elevations in the accumulation area (section 5.1).
First, the mean annual altitudinal mass balances were estimated for each 50 m elevation band by taking the average of all available point mass balances within the corresponding 50 m elevation band (Fig. 1). The altitudinal mass balances for elevations bins between 4800 and 5200 were estimated by linear interpolation. These mean altitudinal mass balances were then extrapolated to the whole glacier to estimate the annual-glacier-wide mass balance (Ba) by applying the following equation (Østrem and Brugman, Reference Østrem and Brugman1991):
 \begin{equation}{B_a} = \frac{1}{S}\mathop \sum \limits_{z = min}^{z = max} {b_z}{s_z}\end{equation}
where bz represents the mean altitudinal mass balance of the corresponding 50 m elevation band (m w.e. a–1), sz (in m2) is the elevation band area of range z, and S (in m2) represents the total glacier area. The annual mass balances are estimated at the end of the ablation year (1 October to 30 September of the following year). In the ablation area, stake exposure measured at each ablation stake was converted to the point mass balance using a fixed density of 900 kg m−3 for ice and 350 kg m−3 for snow (wherever snow was observed), respectively (Wagnon and others, Reference Wagnon2007), while in the accumulation area, the varying snow/firn densities were measured in the field (Fig. 2D).
3.2. Random error analysis in glacier-wide mass balance
The random error in glacier-wide mass balances on Drang Drung Glacier was estimated following the framework developed by Thibert and others (Reference Thibert, Blanc, Vincent and Eckert2008) using the long-term data on Glacier de Sarennes (France). Although this random error analysis was conducted on an Alpine glacier, it can be generalized to other glaciers because it is based on measurement errors that are similar to every glacier while applying the traditional glaciological method (Østrem and Brugman, Reference Østrem and Brugman1991). Overall, random error incorporates uncertainties associated with measurements, including uncertainty in positive and negative mass balances and sampling uncertainty due to a finite number of observed sites.
The positive mass-balance measurements were obtained from accumulation cores (section 3.1) in the accumulation area. Therefore, they are based on the determination of core length and density. The overall uncertainty on a positive mass balance (σ b+) is estimated by
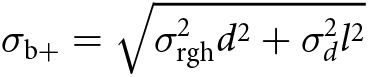 \begin{equation}{\sigma _{{\text{b}} + }} = \sqrt {\sigma _{{\text{rgh}}}^2{d^2} + \sigma _d^2{l^2}} \end{equation}
where d is the mean density of the snow core, σd is the standard deviation of snow densities along the depth, l is the snow core depth and σ rgh is the surface roughness. σ rgh is unknown on Drang Drung Glacier and taken as 0.35 m w.e. from Thibert and others (Reference Thibert, Blanc, Vincent and Eckert2008). This results in σb+ of ±0.23 and ±0.20 m w.e. for 2021/22 and 2022/23 accumulation zone measurements, respectively.
The uncertainty in negative mass balances ( $\sigma _{\text{b} - }^{\text{ice}}$) is mainly associated with the jointed stakes and irregular surface at the bottom of the stakes due to the boreholes, which is estimated to be 0.14 m w.e. (Thibert and others, Reference Thibert, Blanc, Vincent and Eckert2008). In September 2023, Drang Drung Glacier received a significant amount of fresh snow, and all the ablation stakes witnessed some snow accumulation. In this case, using the mean l = 0.23 m from all stakes, an additional uncertainty ( $\sigma _{\text{b} - }^{\text{snow}}$) was estimated by applying Eqn (2). Combining the errors from both ( $\sigma _{\text{b} - }^{\text{ice}}$) and ( $\sigma _{\text{b} - }^{\text{snow}}$), an overall uncertainty ( ${\sigma _{\text{b} - }}$) in negative mass balance for 2022/23 ablation zone measurements was estimated to be ±0.18 m w.e.
The finite number of point mass-balance sampling sites also results in a sampling error (σ samp) that depends on the number of sampled sites (n, 32 in 2021/22 and 30 in 2022/23) and the spatial variability of mass balance (σ sp) across the glacier, and is expressed as follows:
 \begin{equation}{\sigma _{\text{samp}}} = \frac{{{\sigma _{\text{sp}}}}}{{\sqrt n }}\end{equation}
σ sp is assumed to be equal to the standard deviation of all available point mass balances measured each year and σ samp estimated to be ±0.34 and ±0.34 m w.e. for 2021/22 and 2022/23, respectively.
The overall random error in the annual-glacier-wide mass balance was calculated by combining the uncertainties from positive mass balances ( ${\sigma _{\text{b} + }}$), negative mass balances ( ${\sigma _{\text{b} - }}$) and sampling error (σ samp) using the following equation:
 \begin{equation}\text{Random error} = \sqrt {\sigma _{\text{b} + }^2 + \sigma _{\text{b} - }^2 + \sigma _{\text{samp}}^2} \end{equation}
In the years 2021/22 and 2022/23, the estimated random error in annual-glacier-wide mass balances was ±0.43 m w.e.
4. Results
4.1. Point mass balances and vertical mass-balance gradients
Figure 3 represents the annual point mass balances as a function of elevation on Drang Drung Glacier for 2 hydrological years (2021/22 and 2022/23). The point ablation varied from −1.8 to −8.3 m w.e. a–1 in the ablation area, while point accumulation varied from 0.15 to 1.70 m w.e. a–1 during 2021–23 (Fig. 3). Two stakes installed over thin debris–covered region (shown as circles, Fig. 3) showed slightly higher mass wastage (ranging from 0.1 to 0.9 m w.e. a–1) due to enhanced melting compared to the stakes installed at the similar elevations over the clean–ice glacier (Figs. 1 and 3). The annual point mass balances showed very limited differences with elevation over 4200–4300 and 4600–4700 m a.s.l. elevation ranges (Fig. 3). This is probably due to the near–flat ablation areas over these elevation bands (with ∼8° and ∼5° slopes, respectively). A maximum point mass balance of −8.3 m w.e. was recorded at 4099 m a.s.l. at the lowest ablation stake in 2021/22 (Fig. 3). Vertical mass-balance gradients (db/dz) were estimated using regression lines fitted to all annual point mass balances for both years (thick lines; Fig. 3). db/dz was 0.63 m w.e. (100 m)–1 in 2021/22 and 0.61 m w.e. (100 m)–1 in 2022/23 (Table 2).
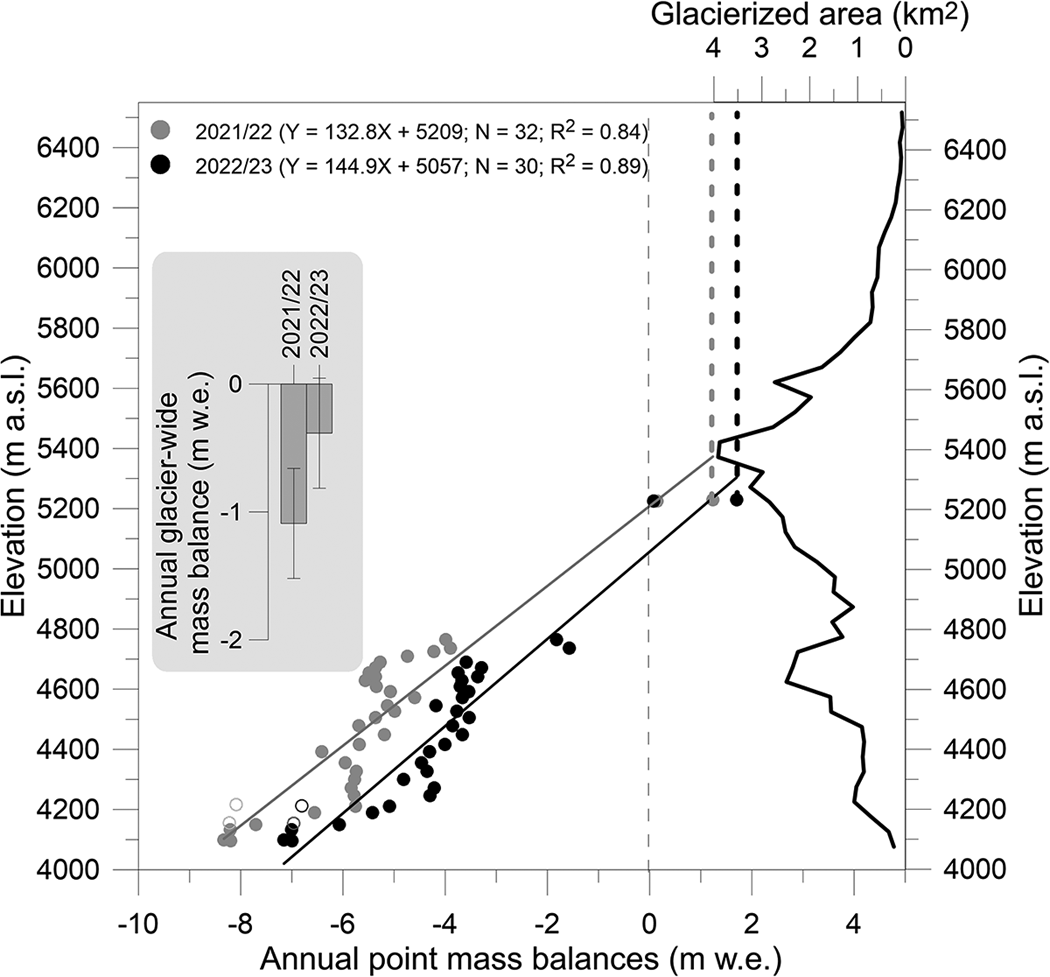
Figure 3. Annual point mass balances as a function of elevation for 2021/22 and 2022/23 hydrological years. The secondary y-axis shows the glacier area–elevation distribution. The inset shows the glacier-wide mass balances with the estimated error bars (±0.43 m w.e. a–1). The circles show the stakes installed over the debris–covered area. The thin black dotted vertical line shows the zero mass balance, while thick grey and black dotted vertical lines show the constant accumulations above 5230 m a.s.l. for 2021/22 and 2022/23 hydrological years, respectively.
Table 2 Annual-glacier-wide mass balances (Ba), ELA, AAR and vertical mass-balance gradients (db/dz) over the observed period 2021–23
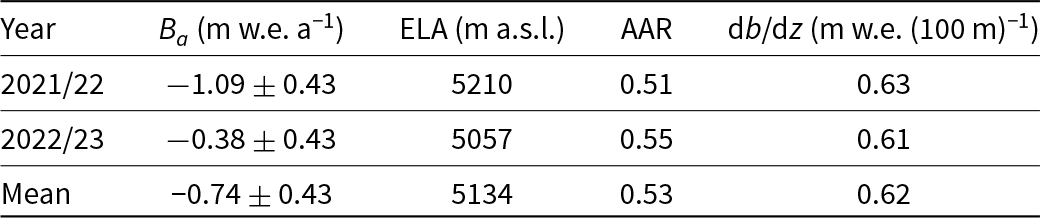
4.2. Annual-glacier-wide mass balances, ELA and AAR
Glacier-wide mass balances on Drang Drung were estimated to be ‒1.09 ± 0.43 and ‒0.38 ± 0.43 m w.e. a‒1 for 2021/22 and 2022/23 hydrological years (Fig. 3; Table 2). The equilibrium line altitude (ELA), extracted from the regression line plotted over annual point mass balances (both ablation and accumulation), was estimated to be 5210 and 5057 m a.s.l, respectively (Table 2). The accumulation area ratio (AAR) was estimated to be 0.51 and 0.55 for 2021/22 and 2022/23, respectively (Table 2). The mean annual-glacier-wide mass balance was ‒0.74 ± 0.43 m w.e. a‒1 over 2021‒2023, corresponding to a mean ELA of 5134 and a mean AAR of 0.53 (Table 2).
The overall uncertainty in glacier-wide mass balance stems from random and systematic errors (section 5.1; Thibert and others, Reference Thibert, Blanc, Vincent and Eckert2008). The estimated random error of 0.43 m w.e. a‒1 in annual-glacier-wide mass balances on Drang Drung Glacier aligns well with the random error of 0.40 m w.e. a‒1 estimated on Chhota Shigri Glacier (Azam and others, Reference Azam2012) but is higher than the random error of 0.28 m w.e. a‒1 estimated on Mera Glacier (Wagnon and others, Reference Wagnon2013). The lower estimate of random error on Mera Glacier is likely due to the dense network of observed point mass balances (∼4 data points km‒2) compared to Chhota Shigri (∼2 data points km‒2) and Drang Drung Glacier (∼0.5 data points km‒2).
5. Discussion
5.1. Systematic biases in glacier-wide mass balances
Accessing the accumulation area on the Himalayan glaciers is often challenging, resulting in limited observations of accumulation sites (Azam and others, Reference Azam2018). In such a situation, several studies have relied on extrapolating the observed accumulation at a few close-to-the-ELA sites to the entire accumulation area, assuming a uniform distribution of snow accumulation across the entire accumulation area, while estimating the glacier-wide mass balance (Sunako and others, Reference Sunako, Fujita, Sakai and Kayastha2019; Dobhal and others, Reference Dobhal, Pratap, Bhambri and Mehta2021; Kumar and others, Reference Kumar2021; Stumm and others, Reference Stumm, Joshi, Gurung and Silwal2021; Gurung and others, Reference Gurung2022). However, given the large accumulation area (37.2 km2) on Drang Drung Glacier, the linear extrapolation of accumulation measurements at 5230 m a.s.l. to higher elevations can have an important impact on the glacier-wide mass balances. Therefore, due attention is given to this assumption.
The snow accumulation, generally, increases with elevation (Sherpa and others, Reference Sherpa2017; Mandal and others, Reference Mandal2020); therefore, we performed a sensitivity test for the estimated glacier-wide mass balance on Drang Drung Glacier, assuming the accumulation gradients from other glaciers in the Himalayan region.
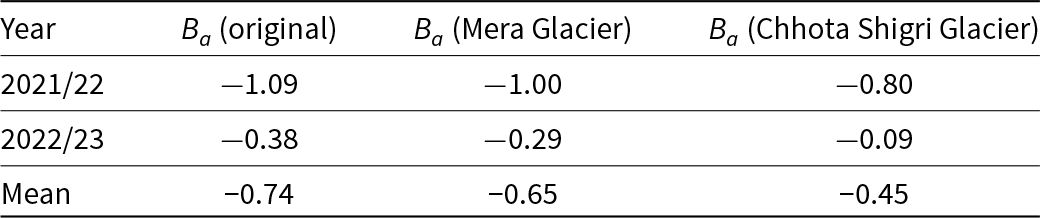
The db/dz in the accumulation area (db/dz acc) has been sporadically estimated in the HK region due to the limited point accumulation measurements. Using the several point accumulation measurements, the mean db/dz acc on Mera Glacier was estimated to be 0.07 m w.e. (100 m)‒1 a‒1 over 2007‒2023 (Wagnon and others, Reference Wagnon2021). The db/dzacc was also estimated occasionally (only 5 years of data) on Chhota Shigri Glacier, and a mean db/dzacc was estimated to be 0.22 m w.e. (100 m)‒1 a‒1 over 2003‒2011 (Azam and others, Reference Azam2016). To assess the impact of the assumed uniform distribution of snow accumulation across the entire accumulation area for the glacier-wide mass balances on Drang Drung Glacier, we extrapolated the observed point accumulation at 5230 m a.s.l. in the main accumulation area applying the mean db/dzacc from Mera Glacier and re-estimated the glacier-wide mass balances. This exercise changed the glacier-wide mass balances by only 0.09 m w.e. a‒1 from other original values (Table 3). Further, applying the db/dzacc of Chhota Shigri Glacier changed the glacier-wide mass balances on Drang Drung Glacier by 0.29 m w.e. a‒1 (Table 3). Though these mass balance deviations with db/dzacc from Mera and Chhota Shigri glaciers reflect the systematic source of error, these are well within the estimated random error of ±0.43 m w.e. a‒1 in glacier-wide mass balances on Drang Drung Glacier. Therefore, the limitations associated with our approach for extrapolation of the observed accumulation at 5230 m a.s.l. to the whole accumulation area do not change the results of this preliminary data reporting study.
Table 3 Annual-glacier-wide mass balances (Ba) on Drang Drung Glacier over the observed period 2021–23 using linear accumulation assumption (original), applying the accumulation gradients observed of Mera, and Chhota Shigri glaciers
However, we admit that only two sampled sites in the accumulation area (37.1 km2) and 28–30 sites in the ablation area (32.5 km2) might not capture the spatial variability of surface mass balance that may result in systematic biases in estimating the glacier-wide mass balance (Thibert and others, Reference Thibert, Blanc, Vincent and Eckert2008). These systematic biases in the glacier-wide mass balance series have been investigated and removed by reanalysing the glacier-wide mass balances with the satellite-based geodetic mass balances only on Mera and Chhota Shigri glaciers in the Himalaya (Wagnon and others, Reference Wagnon2021; Azam and others, Reference Azam2024). As suggested by several studies (Thibert and others, Reference Thibert, Blanc, Vincent and Eckert2008; Zemp and others, Reference Zemp2013), we will address these possible systematic biases on Drang Drung Glacier by reanalysing the glacier-wide mass balances with the geodetic mass balances once the mass balance series is sufficiently long (∼5 years or longer) in future. Further, we plan to employ technical mountaineering assistants to mitigate the risks of crossing the crevassed area and collect more accumulation measurements at higher altitudes in the coming years.
5.2. Comparison of vertical mass-balance gradients
The db/dz serves as a crucial indicator for understanding the climatic settings of a glacier. Glaciers in wet and warm climates, having large mass turnover, tend to have steeper db/dz compared to those in drier and colder regions, with less mass turnover (Oerlemans, Reference Oerlemans2001). We compiled all the available db/dz from the HMA glaciers to understand the relationship between db/dz and glacier-wide mass balance, and to infer the climatic settings from estimated db/dz (Fig. 4). Though, the glacier-wide mass-balance observations are available from several glaciers in HMA, db/dz have been reported only from 15 glaciers (ten from the Himalaya and five from other regions in HMA) (Figs. 1 and 4). The available studies have estimated the db/dz over ablation areas as point accumulation measurements are very limited in the accumulation area (Mandal and others, Reference Mandal2020; Wagnon and others, Reference Wagnon2021). Furthermore, db/dz has been estimated over debris–free ablation areas, as debris cover has a strong local impact on db/dz (Banerjee, Reference Banerjee2017).

Figure 4. Mean annual-glacier-wide mass balance as a function of mean annual db/dz observed from different glaciological mass-balance series in the western Himalaya (WH), central Himalaya (CH), eastern Himalaya (EH), Tien Shan (TS), Pamir Alay (PA), southeast Tibetan Plateau (SE–TP) and central Tibetan Plateau (CTP). The observed mass balances and corresponding db/dz are from different periods. The uncertainties in glacier-wide mass balances are given whenever available from the source.
In general, the mean annual db/dz of 0.62 m w.e. (100 m)–1 on Drang Drung Glacier is comparable to those observed on the other Himalayan glaciers (Mandal and others, Reference Mandal2020) as well as on glaciers in the European Alps, and other mid-latitude regions (Rabatel and others, Reference Rabatel, Dedieu and Vincent2005; Zemp and others, Reference Zemp, Hoelzle and Haeberli2009). In line, Stok Glacier in the Ladakh Region (western Himalaya) showed a mean db/dz of 0.61 m w.e. (100 m)–1 over 2014–19 (Soheb and others, Reference Soheb2020). Chhota Shigri Glacier (Lahaul–Spiti Valley, western Himalaya) showed a mean annual db/dz of 0.66 m w.e. (100 m)–1 over 2002–23 (Azam and others, Reference Azam2024). Patsio Glacier (Lahaul–Spiti Valley, western Himalaya) showed a relatively smaller mean annual db/dz of 0.47 m w.e. (100 m)–1 over 2010–17 (Angchuk and others, Reference Angchuk2021).
Figure 4 shows steeper db/dz associated with more negative glacier-wide mass balances, which is expected as the more negative glacier-wide mass balances are often driven by the higher temperatures that directly control the db/dz (Oerlemans and Hoogendoorn, Reference Oerlemans and Hoogendoorn1989). In general, glaciers in the western Himalaya (Drang Drung, Stok, Patsio and Chhota Shigri), Tien Shan (Urumqi Glacier No. 1 and Batysh Sook), and Pamir Alay (Abramov)—characteristically of drier and colder climatic regimes—show less mass wastage associated with gentle db/dz (Kenzhebaev and others, Reference Kenzhebaev2017; Soheb and others, Reference Soheb2020; Angchuk and others, Reference Angchuk2021; Azam and others, Reference Azam2024; Zhang and others, Reference Zhang, Li, Wang and Wang2014; Kronenberg and others, Reference Kronenberg2022). The glaciers in the central Himalaya (Changri Nup, Pokalde and Yala) and southeast Tibetan Plateau (Parlung No. 94)—characteristically of wet and warm climatic regimes—show steeper db/dz (Yang and others, Reference Yang2013; Sherpa and others, Reference Sherpa2017; Stumm and others, Reference Stumm, Joshi, Gurung and Silwal2021) (Fig. 4). However, there are some exceptions. Mera and Rikha Samba glaciers in the central Himalaya, Trambau Glacier in the eastern Himalaya and Zhadang Glacier in the central Tibetan Plateau—characteristically of wet and warm climatic regimes—show less mass wastage associated with the gentle db/dz (Yu and others, Reference Yu2013; Sunako and others, Reference Sunako, Fujita, Sakai and Kayastha2019; Wagnon and others, Reference Wagnon2021; Stumm and others, Reference Stumm, Joshi, Gurung and Silwal2021) (Fig. 4). These exceptions can partially be explained by the precipitation amounts that decide whether a glacier is in a dry or wet climate. While the air temperature correlates over long distances (Khadka and others, Reference Khadka2022), precipitation amounts may vary drastically even in neighbouring catchments due to specific orography, location of orographic barriers, etc. (Maussion and others, Reference Maussion2014). For instance, the precipitation at Gangotri Glacier (492 mm w.e.) is only 30% that of Dokriani Bamak Glacier (1616 mm w.e.), a glacier that is located on the orographic front in the same range ∼30 km SW of Gangotri Glacier (Hussain and others, Reference Hussain, Azam, Srivastava and Vinze2022). Thus, the compiled db/dz data from 15 glaciers shows variability across climatic settings. Furthermore, as discussed in section 4.1, the glacier-wide mass balance may be affected by systematic uncertainties due to the limited accumulation measurements. Hence, the relationship between glacier-wide mass balance and db/dz may be affected by underestimation/overestimation of mass-balance estimates (Zemp and others, Reference Zemp2013; Azam and others, Reference Azam2018). Some of the existing elevation–dependent ice ablation models used a single value of mass-balance gradient to estimate the runoff at the watershed scale (Racoviteanu and others, Reference Racoviteanu, Armstrong and Williams2013; Azam and others, Reference Azam2021). With increasing data on vertical mass-balance gradients from different regions, such melt models can also be improved in future using different mass-balance gradients for different glaciers.
6. Conclusions
In situ glaciological observations in the HK region are challenging. Hence, they are available from a limited number of small glaciers. Here, we discuss 2 years of in situ glacier-wide mass balances on Drang Drung Glacier. With an area of 69.6 km2, Drang Drung Glacier is the largest field-observed glacier for estimating glacier-wide mass balance in the HK region. The mean annual-glacier-wide mass balance on Drang Drung Glacier is −0.74 ± 0.43 m w.e. a−1, corresponding to a mean ELA of 5134 m a.s.l. and AAR of 0.53 over September 2021–September 2023. The magnitude of mean annual db/dz of 0.62 m w.e. (100 m)–1 on Drang Drung Glacier resembles that observed on other Himalayan glaciers and those in the European Alps and other mid-latitude regions. An analysis of annual-glacier-wide mass balances and db/dz from 15 glaciers, including Drang Drung, in the HMA suggests that, generally, glaciers in dry and colder climates (western Himalaya, Tien Shan and Pamir Alay) show less mass wastage associated with gentle db/dz. Conversely, the glaciers in wet and warm climates (central Himalaya and southeast Tibetan Plateau) show steeper db/dz. However, there are exceptions, making it challenging to deduce the glaciers’ climatic conditions solely from this analysis.
Drang Drung Glacier in the Zanskar Range has been selected for integrated glaciological monitoring to serve as a benchmark glacier for process-based understanding in the northwest Himalayan region, where field-based monitoring of glaciers is scarce. In future, dedicated efforts will be made to increase the number of accumulation measurement sites. These preliminary in situ investigations on Drang Drung Glacier provide insights into the in situ mass balance of a large glacier and highlight the importance of accumulation measurements, motivating continued data collection and illustrating the value of direct field measurements.
Acknowledgements
MFA acknowledges the research grants from the Space Application Centre (SAC, ISRO), Ministry of Earth Sciences (MoES) through the project MOES/PAMC/H&C/131/2019-PC-II) and Science and Engineering Research Board (SERB) through the CRG/2020/004877. Also, thanks to the British Council (Listening to Ice COP26 project) and UNESCO (IGCP Project No. 672). Pléiades’ stereo-imagery of September 2020 was obtained through the Pléiades Glacier Observatory through Etienne Berthier. Thanks to the field assistants Sonu Kumar and Adhikari Ji, as well as the porters involved in the research expeditions on Drang Drung Glacier. AM acknowledges support from SERB through a National Postdoctoral Fellowship (grant no. PDF/2022/002160/EAS). Thanks to Patrick Wagnon, Emmanuel Thibert, Adina Racoviteanu and RAAJ Ramsankaran for their constructive suggestions on the manuscript. We sincerely thank Rijan Kayastha, the two anonymous reviewers, and the Editor Fanny Brun for their detailed and constructive reviews, which significantly improved the quality of the manuscript.
Author contributions
MFA conceptualized the study. MFA, AH, SS, HK, MKM, and MJ collected the field data. MFA did the analysis and wrote the paper with inputs from all coauthors.
Competing interests
Authors decleare no competing interests.


 Open access