


Introduction
Electoral participation is a long-researched phenomenon that cannot only indicate the state of democracy as well as the overall social mood in each country (Solijonov 2016), but through political socialization it can be crucial for the proper functioning of a political system (Putnam Reference Putnam2000; Kymlicka Reference Kymlicka2002; Hadjar and Beck Reference Hadjar and Beck2010; Solijonov 2016; Tambe Reference Tambe2016). One factor that could have a potential negative impact on turnout rates is the party system fragmentation. A number of studies (Blais and Carty Reference Blais and Carty1990; Blais and Dobrzynska Reference Blais and Dobrzynska1998; Jackman Reference Jackman1987; Norris Reference Norris2002; Blais Reference Blais2006) have already proved the assumption about the negative effect of party system fragmentation on voter turnout. These conclusions, however, are not consistent with subsequent meta-analyses, which indicate that the relationship between the number of parties and voter turnout is not as strong as it might initially appear (Smets and van Ham Reference Smets and van Ham2013; Cancela and Geys Reference Cancela and Geys2016; Stockemer Reference Stockemer2017). Therefore, if the findings of studies regarding the association between party system fragmentation and voter turnout are rather mixed, could there be more specific situations where the effect would prove stronger? What factors intervene in the association? May some individuals not be affected at all?
The research grounded in cognitive psychology implies that the decision-making process is influenced not solely by the quantity of options under consideration, namely, political parties, but also by the extent of their similarity to one another (Shugan Reference Shugan1980; Fasolo, et al. Reference Fasolo, Carmeci and Misuraca2009; Belabbes Reference Belabbes, Ruthven, Moshfeghi and Rasmussen Pennington2023). Additionally, the more similar the sub-attributes of the choices under consideration are, the more difficult the decision can be (Böckenholt et al. Reference Böckenholt, Albert, Aschenbrenner and Schmalhofer1991; Swait and Adamowicz Reference Swait and Adamowicz2001). Psychological research also imply that it is necessary to take into account the personality specificities of the individual concerned, as well as the political system and the wider context in which they live (Schaffner et al. Reference Schaffner, Streb and Wright2001; Kostadinova Reference Kostadinova2003; Cohen Reference Cohen2018).
Based on the postulates of cognitive psychology, the aim of this article is to analyze whether and in which cases fragmentation is related to voter turnout in European democracies. The aim is to investigate in more detail the possible negative effect of party system fragmentation through interaction with other individual and contextual variables that might point to instances when the fragmentation gains more substantial effect and where, on the contrary, its influence is marginal. Individual level data from the last wave of the European Social Survey (2020–2022), combined with country-level indicators and logistic models, have been used to investigate the association.
The paper proceeds as follows. In the first part, theoretical assumptions are introduced. Built on the theory of rational choice, the phenomenon of information overload and existing political science research regarding the effect of party system fragmentation on voter turnout, five hypotheses are formulated. The next part discusses data and methods used for analysis. In the analytical part of the paper, hypotheses are subjected to empirical testing using logistic regression models. Next, results are discussed in the context of previous research in the field as well as in the context of democratic political system functioning.
Effect of the number of running parties on voter decision-making
From perspective of cognitive psychology, as the number of options under consideration increases, the negative aspects that enter the decision-making process are amplified (Shafir et al. Reference Shafir, Simonson and Tversky1993).Footnote 1 All that takes up the decision-maker’s time, but also stresses his or her cognitive abilities and can potentially lead to cognitive overload.Footnote 2 This psychological paralysis is based on the assumption of limited cognitive abilities of decision-making individuals (Miller Reference Miller1956; Simon Reference Simon1957, Reference Simon1974; Payne Reference Payne1976; Malhotra Reference Malhotra1982). Once the number of variants exceeds a certain threshold, the decision-maker becomes confused and is unable to distinguish sufficiently between the different variants under consideration. This may lead to an attempt to escape a difficult decision utilizing the decision avoidance strategy (Malhotra Reference Malhotra1982; Samuelson and Zeckhauser Reference Samuelson and Zeckhauser1988; Iyengar and Lepper Reference Iyengar and Lepper2000; Iyengar et al. Reference Iyengar, Huberman, Jiang, Mitchell and Utkus2004; Ayal Reference Ayal2011). The more the voters find elections too complex, the more likely they are not to participate.
Some studies attribute the negative effects on electoral participation to the voter’s inability to sufficiently influence the formation of the government in fragmented party systems (Jackman Reference Jackman1987; Blais and Carty Reference Blais and Carty1990; Norris Reference Norris2002; Grofman and Selb Reference Grofman and Selb2010). Others draw attention to the information intensity of the electoral decision in the context of a larger number of running political parties (Kostadinova Reference Kostadinova2003; Geys and Heyndels Reference Geys and Heyndels2006; Taagepera et al. Reference Taagepera, Selb and Grofman2014; Cunow et al. Reference Cunow, Desposato, Janusz and Sells2023). Therefore, despite the fact that some studies point to a positive effect of a higher number of running parties (Seidle and Miller Reference Seidle and Miller1976; Dittrich and Johansen Reference Dittrich and Johansen1983; Hansen Reference Hansen1994), the overall negative effect of party system fragmentation can be expected, since the positive effects of multi-party systems on turnout, such as lower levels of political alienation and a more competitive political system, are outweighed by the negative effects of a fragmented system, which include a higher probability of coalition formation and increasing costs of information gain (Geys and Heyndels Reference Geys and Heyndels2006).
H1 As the number of running parties increases, the probability of participation for a given election decreases.
The overload caused by more options could be more significant for those individuals who approach the choice without significant partisan preferences (Cohen Reference Cohen2018). Personal identification with the party could potentially work as a kind of mental shortcut that could help the voters in their choice (Schaffner et al. Reference Schaffner, Streb and Wright2001). In the same vein, Brockington (Reference Brockington2004) concludes that people with a stronger partisanship tend to vote even in the case of a more fragmented party system.Footnote 3 The effect of a larger number of parties should therefore be most noticeable for those individuals who approach voting without a significant prior relationship with one of the candidates.
H2 The negative effect of fragmentation on electoral participation is stronger in individuals who do not declare a partisanship to a political party compared to people with some ties to a political party.
Following Kostadinova and Power’s (Reference Kostadinova and Power2007) research on European countries of the former communist bloc and the two previous hypotheses, the analysis also considers the factor of the division of Europe into Eastern and Western parts. The effect might not be limited to the experience with democratic systems, which is uninterrupted and noticeably longer in Western countries, but also the instability of party systems is consistently higher in Eastern European democracies than in Western Europe (Sikk Reference Sikk2005; Lane and Ersson Reference Lane and Ersson2007). Especially after transitions to democratic regimes, many of the post-communist countries have suffered from a lack of party tradition, party identification, and sufficiently institutionalized structures (Welsh Reference Welsh1994). The instability of the party systems in these countries leads to a disconnect between voters and parties, which can result in confusion and loss of determination to go to the polls (Kostadinova and Power Reference Kostadinova and Power2007). Moreover, their socialization in an authoritarian communist environment reduces the likelihood of voter turnout (Zagórski Reference Zagórski2021), post-communist citizens are less likely to vote (Kostadinova Reference Kostadinova2003), less politically engaged and more undemocratically oriented than their Western counterparts (Kirbiš, Reference Kirbiš2012). A negative effect in CEE countries can thus be expected not only because of the higher degree of instability of their party systems,Footnote 4 but also due to a weaker attachment to parties and to the democratic system itself, which are significantly weaker than in Western countries.
H3 The negative effect of increased party system fragmentation is stronger in individuals from the post-communist states of Central and Eastern Europe compared to individuals from Western Europe.
Apart from the number of options itself, the degree of similarity between the variants also appears to be crucial (Shugan Reference Shugan1980). It is generally assumed that the more similar the properties of all possibilities considered are, the more difficult the choice can potentially be (Böckenholt et al. Reference Böckenholt, Albert, Aschenbrenner and Schmalhofer1991; Swait and Adamowicz Reference Swait and Adamowicz2001; Fasolo et al. Reference Fasolo, Carmeci and Misuraca2009). As the similarity between the variants in their attributes increases, the decision-maker is more burdened with comparing the options and finds it more difficult to make a binding choice. According to Wilford (Reference Wilford2017), if voters decide in the context of higher political polarization, while also having fewer running parties, the turnout should be higher. Thus, the above hypothesized relationship between the number of parties running and voter non-participation could be complemented by the following hypothesis.
H4 The higher the degree of political polarization, the lower the effect of the fragmentation will be on voter participation.
Some expanding insight into the subject might then be provided by the assumptions of Cohen (Reference Cohen2018) about the dynamic nature of the relationship between the number of parties and voter turnout. From this perspective, it is relevant to consider the variability in the number of parties, i.e., to examine not only the number of parties that the voter is confronted with in a given election, but also the possible effect of a change in the number of parties standing compared to previous elections. That is, if there is a positive change, i.e., an increase in the number of candidates, compared to the previous election, there should also be an increase in the proportion of nonvoters, since a given election should be perceived as considerably more cognitively demanding compared to the previous one (Sundström, Reference Sundström1987; Grofman and Selb Reference Grofman and Selb2010; Cunow et al. Reference Cunow, Desposato, Janusz and Sells2021). In this case, the number of parties could be supplemented with a variable reflecting the change in the number of parties compared to the previous election.
H5 As the number of parties standing compared to the previous election increases, the probability of participation for a given election decreases.
Data and methods
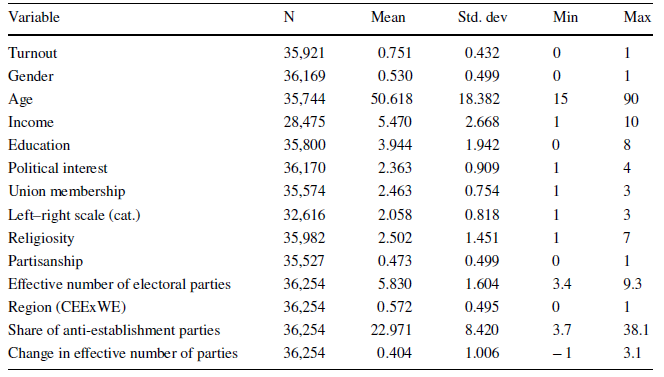
In order to test formulated hypotheses, a dataset from the Round 10 of European Social Survey (2020–2022) has been used (ESS ERIC 2023) from which democratic countries without enforced compulsory voting are selected for an analysis. For a country to be perceived as democratic, it has to be marked as “liberal” or “electoral democracy” in 2020 by Regimes of the World published by Varieties of Democracy (V-Dem) (Coppedge et al. Reference Coppedge, Gerring, Knutsen, Lindberg, Teorell, Altman, Angiolillo, Bernhard, Cornell, Fish, Fox, Gastaldi, Gjerløw, Glynn, Good God, Grahn, Hicken, Kinzelbach, Krusell, Marquardt, McMann, Mechkova, Medzihorsky, Natsika, Neundorf, Paxton, Pemstein, von Römer, Seim, Sigman, Staton, Sundström, Tannenberg, Tzelgov, Wiebrecht, Wig, Wilson and Ziblatt2025).Footnote 5 Also, countries with majoritarian and mixed electoral systems are excluded from the dataset because of different patterns of voters’ behavior (Simmons and Waterbury Reference Simmons and Waterbury2024; Endersby and Shaw Reference Endersby and Shaw2009), same as due to distinct aspects of party competition (Sartori Reference Sartori1999). Therefore, the total number of 36,254 respondents from 21 countriesFootnote 6 are included in the analysis.
The ESS dataset was extended by other variables important in terms of voter behavior. In this sense, several indicators of political and economic performance as well as variables pertaining to political settings have been considered. However, correlations between these indicators are quite strong, meaning that states with better political performance tend to have better economic performance and so on. Indicators of political and economic performance are generally higher in established Western democracies, while Central and Eastern Europe score lower. For this reason, part of Europe enters regression models as a control variable. Other indicators like perceived corruption index or indicators regarding economic performance are not included because of the problem of multicollinearity. Country level indicators that are added to the models are described below.
As the dependent variable is dichotomous with only two categories (did not vote/voted), logistic regressions have been used. For ease of interpretation, results in the tables are presented mainly in terms of changes in predicted probabilities. Three of the five hypotheses are conditional, presuming that the association between independent variable and dependent variable varies depending on values of other variables. To check whether the data support these assumptions, interaction terms have been added to the models (Brambor et al. Reference Brambor, Clark and Golder2006). To better understand the interactions, the results are visualized through the plots of predicted probabilities based on regression models.
To replace missing data, multiple imputation by chained equations have been used (Azur et al. Reference Azur, Stuart, Frangakis and Leaf2011). Scale independent variables and controls are standardized by dividing them by two standard deviations due to the comparability of coefficients (Gelman Reference Gelman2008).
Operationalization of variables
Dependent and independent variables
In terms of measuring voter turnout, the question on whether the respondent voted in the last national election has been included in the ESS. Respondents should have indicated if they voted, or they abstained from the vote. Therefore, the variable has two categories of voters and nonvoters and is modeled as a dependent variable in regression models.
In order to measure the main independent variable of the paper, namely, the party system fragmentation, the effective number of electoral parties (ENEP) from WHO GOVERNS database (Casal Bértoa 2024) has been used. The index captures the number of parties that are present in a country’s party system in a given election weighted according to their size. For a given country, ENEP from elections preceding ESS questioning has been added to the dataset. To evaluate the fifth hypothesis in which the effect of a change in a number of parties between elections is assumed, the change between two elections preceding the administration of ESS survey is also added.
The joint effect of the number of parties and their ideological distance on voter turnout has been assumed. Polarization is measured as the percentage of votes obtained by “anti-establishment” parties and comes from WHO GOVERNS database.Footnote 7 This approach is an established and recognized method of measuring political polarization (Powell Reference Powell1982; Pennings Reference Pennings, Pennings and Lane1998; Casal Bértoa and Rama Reference Casal Bértoa and Rama2021) and is consistent with existing research approaches.
The association between party system fragmentation and voter turnout may differ in different parts of Europe, depending on whether the country has an experience of communist rule. Therefore, a dichotomous variable dividing Europe into two regions (Western Europe and Eastern Europe) is added to the models with the category of Central and Eastern Europe to be the base category.
Finally, it is assumed that the effect of party system fragmentation may vary according to individual closeness to the political party. Partisanship is measured using a question that asked respondents if there is a particular political party they feel closer to than all the other parties, or that there is no such party. The dichotomous variable of partisanship enters the models with people without ties to a party to be the reference category.
Controls
In addition to the indicators mentioned above, a number of factors that are considered as determinants of voter turnout according to studies in the field are controlled in the analysis. Operationalization of controls as well as descriptive statistics of all variables is part of the Appendix.
The first set of control variables consists of sociodemographic indicators, namely, sex, age, education and income as all of them might be important in terms of the decision of voters to turnout (Lipset Reference Lipset1981; Seltzer et al. Reference Seltzer, Newman and Leighton1997; Blais Reference Blais2000). Also, age squared is added to the models (Blais et al. Reference Blais, Gidengil, Nevitte and Nadeau2004). Except for basic sociodemographic indicators, other factors that might be associated with voter turnout are religiosity in terms of religious service attendance (Macaluso and Wanat Reference Macaluso and Wanat1979) and trade union membership (Evans Reference Evans2004). Therefore, both of them are controlled in regression models.
According to previous research, the political attitudes of an individual may, too, matter in terms of electoral behavior. In this sense, especially political interest seems to be crucial (Almond and Verba Reference Almond and Verba1963). Above that, left/right-leaning of a respondent is controlled in regression models (Smets and van Ham Reference Smets and van Ham2013).
Results and discussion
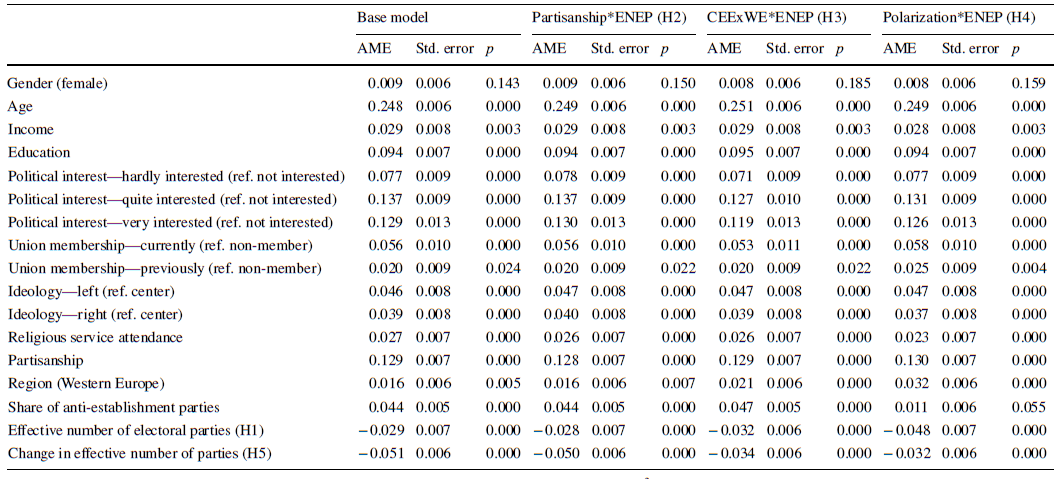
Table 1 presents the results of a regression analysis of electoral turnout in European democracies. More specifically, the results of four models are presented. The first model is a base model with all determinants of electoral turnout described above. The next three models then add interaction terms to check three conditional hypotheses of the paper. Results in the table are presented as average marginal effects. Therefore, values indicate the change in a predicted probability of an outcome (the turnout) for a change in the independent variables, holding all other variables as observed. Because all scale independent variables are standardised by dividing them by two standard deviations, coefficients are comparable in size.
Table 1 Results of logistic models of electoral turnout

N: 36,254. Imputations: 5. Predictors are standardised (2SD). AME, Average marginal effects. Pseudo R 2: 0.272 (base model).
When first looking at the results of the models, it is obvious that coefficients of most predictors are in the direction that should be expected based on the findings of the studies on the issue and almost all of them are statistically significant at a significance level of 0,05, but this may be attributable to the high number of cases in the dataset. In general, the probability of turnout is positively associated with income, education, political interest, union membership, partisanship, religious services attendance and party system polarization (measured as share of anti-establishment parties).
In terms of ideological leanings, positive association should be expected especially in the case of more conservative and right-leaning voters who may strongly perceive voting as one of their civic duties (Smets and van Ham Reference Smets and van Ham2013). Nevertheless, the probability of turnout of both people that place themselves on the left side of the spectrum and people that see themselves on the right side seems to be higher compared to center-leaning respondents. This may be due to higher political awareness of the people that have clear political preferences.
In terms of party system fragmentation and change in number of parties between elections, coefficients correspond to expectations outlined in a theoretical part of the paper as well. Both variables are negatively associated with the probability of turnout, meaning that an increase in both the number of electoral parties and overall growth in the number of parties between elections decrease the probability of turnout. However, when looking at the size of the coefficients, these are rather small compared to others in the model. More specifically, holding other variables at observed values, an increase in the level of fragmentation from minimum to maximum decreases the probability of turnout by only 0,029, on average, while an increase in the number of parties between elections decreases the probability of turnout by 0,051. The strongest predictors of turnout are rather individual characteristics such as age, education or political attitudes like political interest (being very interested in politics compared to absence of interest increases the probability of turnout by 0,129).
Regardless of weaker coefficient sizes compared to others, both the party system fragmentation and change in number of parties between last two elections seem to be related to individual-level turnout in an expected manner. This finding corresponds with the conclusions of previous studies and meta-analyses that have described the relationship as negative but rather weak (Blais and Carty Reference Blais and Carty1990; Norris Reference Norris2002; Blais Reference Blais2006; Smets and van Ham Reference Smets and van Ham2013; Cancela and Geys Reference Cancela and Geys2016; Stockemer Reference Stockemer2017). A higher number of electoral parties in a party system of a country as well as an increase in number of parties standing compared to previous elections (both factors that may hamper voter decision-making) may be associated with a lowered propensity of people to turn out. Therefore, it seems that data from European democracies correspond to assumptions formulated in hypotheses 1 and 5.
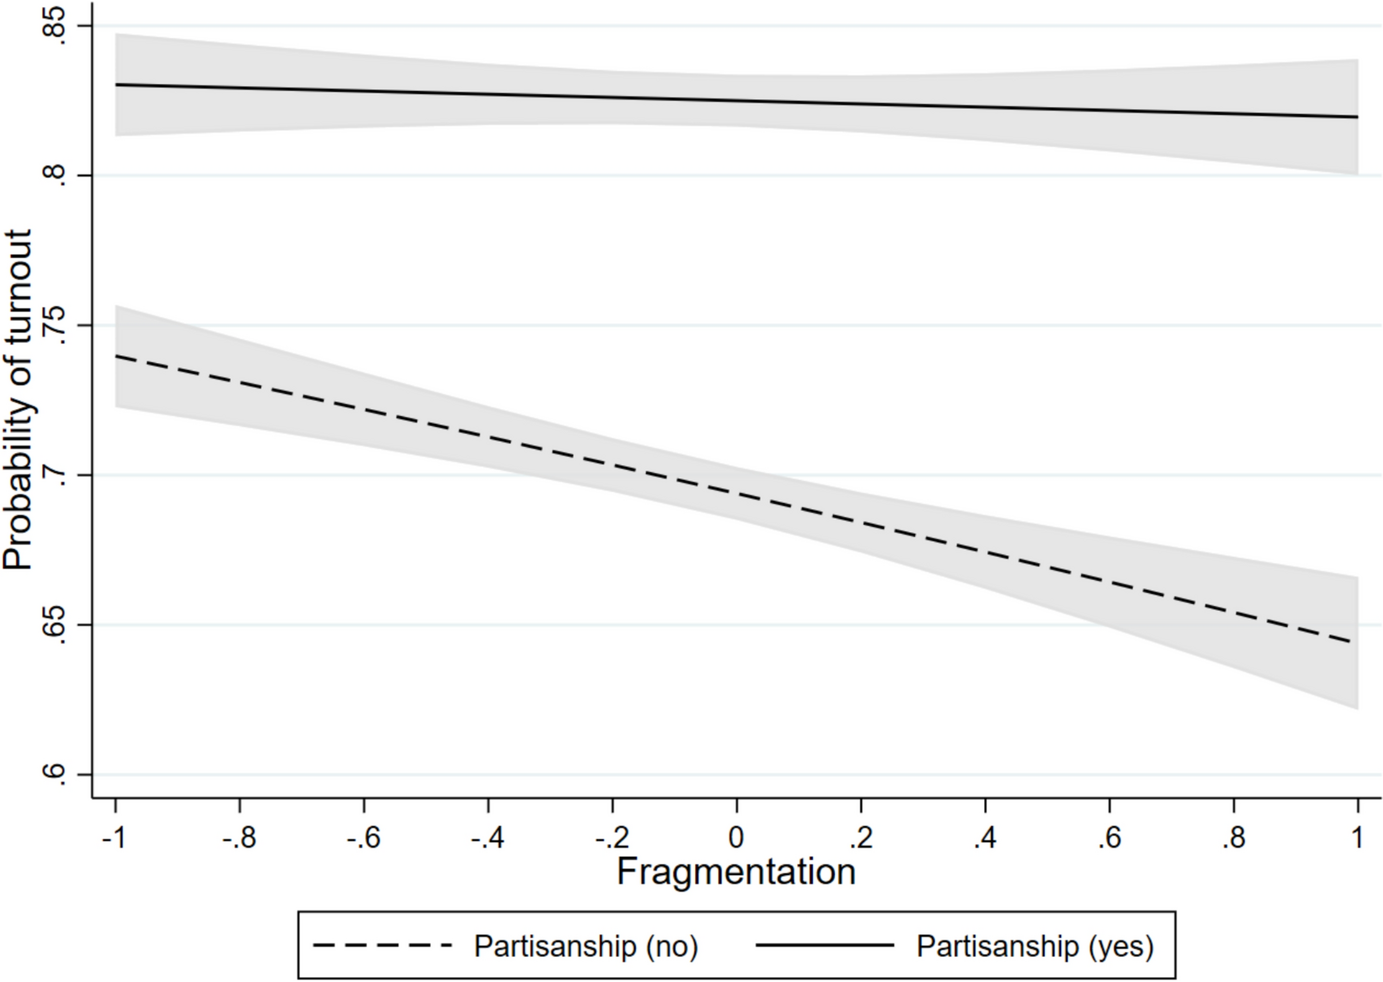
It is assumed that the effect of fragmentation should be stronger in people who do not feel closer to a particular political party compared to people who have some ties to a party. The interaction term was involved in a second model presented. For the clarification of interpretation, predicted probabilities based on this model are presented in Fig. 1.

Fig. 1 Predicted probability of turnout according to the levels of party system fragmentation and partisanship (H2)
Based on a plot, the predicted probability of turnout of people who do not feel closer to any political party decreases as the level of party system fragmentation increases with no significant change evident in the case of people with closer ties to a political party. Overall, the probability of turnout is higher for respondents who declare ties to some political party compared to respondents without party closeness regardless of the level of party system fragmentation. Party affiliation thus has the potential to mitigate the effect of a larger number of parties. To some extent, it can serve as a kind of shortcut that voters can use to simplify their decision-making (Jung Reference Jung2017).
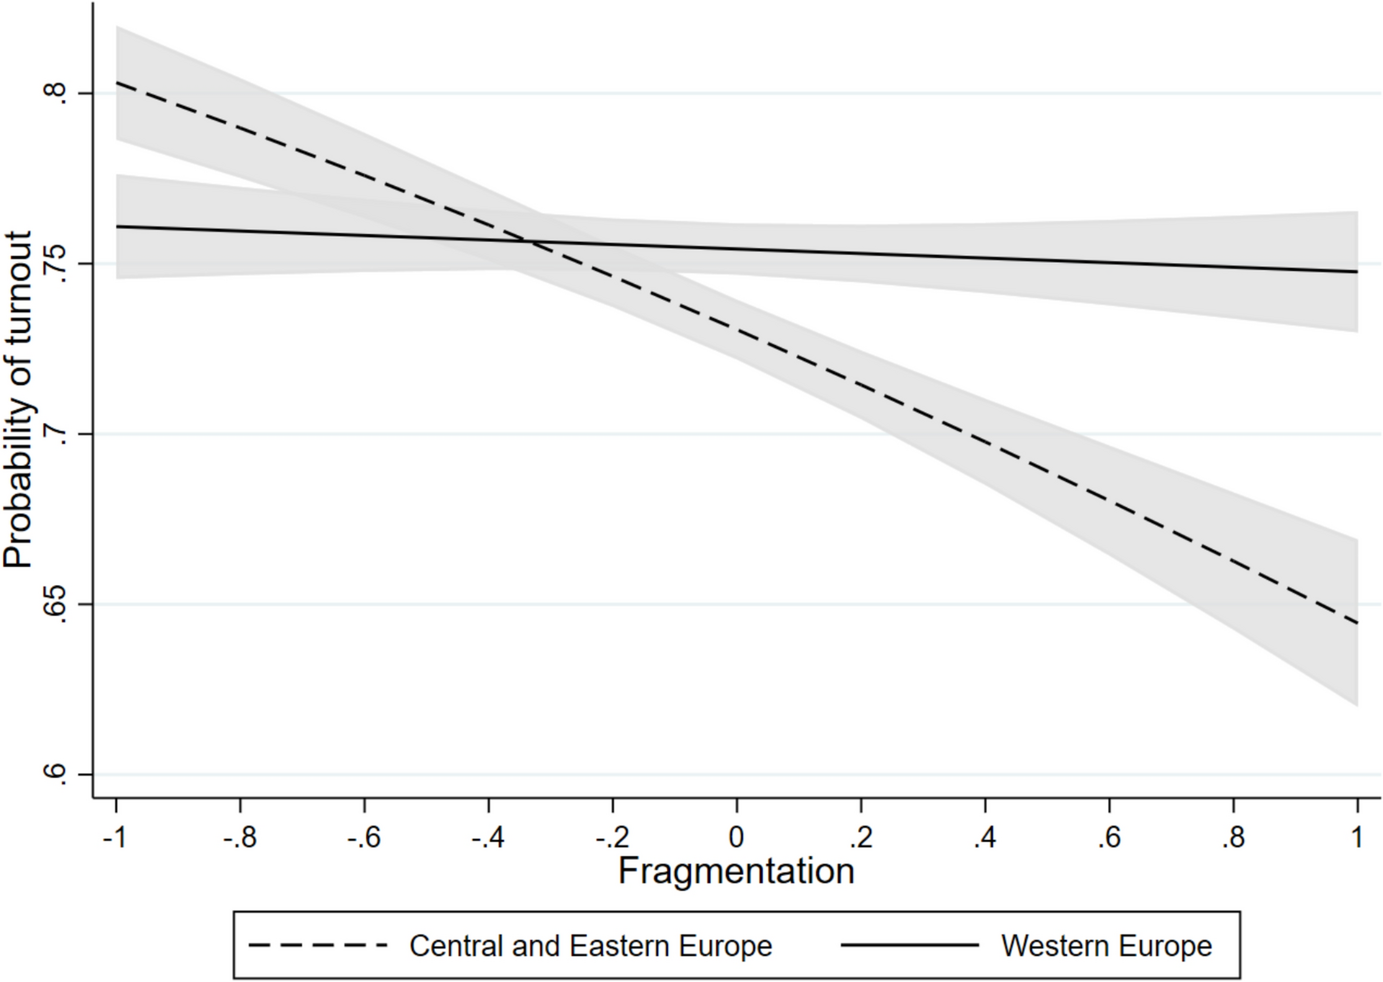
According to the third assumption, the effect of party system fragmentation might be stronger in citizens of post-communist countries compared to established Western European democracies. Again, results of a model 3 with the respective interaction term included are presented through the plot of probabilities in Fig. 2.

Fig. 2 Predicted probability of turnout according to the party system fragmentation and European region
As is apparent based on a plot, in post-communist countries of Central and Eastern Europe, the probability of turnout clearly decreases with increase in the level of party system fragmentation. While at low levels of fragmentation citizens from CEE countries report slightly higher probability of turnout compared to their Western European counterparts, as the party system fragmentation increases, their probability of turnout decreases. At high levels of fragmentation, the probability of citizens from post-communist countries to vote is significantly lower compared to Western Europeans living in a country with the same level of party system fragmentation. Therefore, party system fragmentation decreases the probability of turnout especially in cases of citizens from post-communist countries which is in line with theoretical expectations. The finding might reflect not only the instability of Central and Eastern Europe party systems, but also the higher levels of political sophistication of Western counterparts (Leighley Reference Leighley1995; Kostadinova and Power Reference Kostadinova and Power2007).
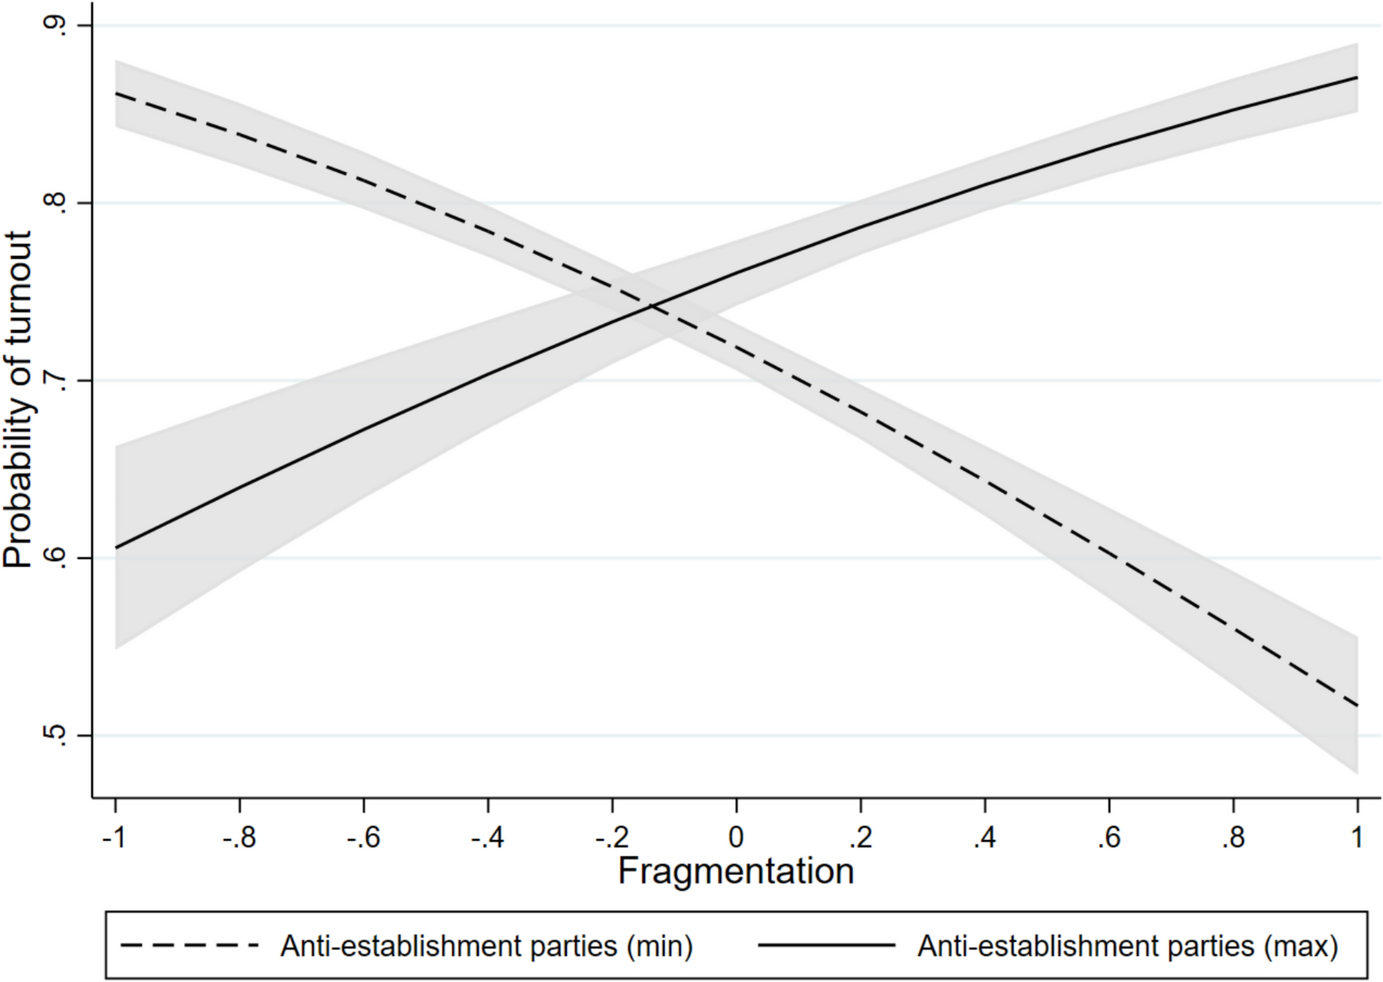
Based on theoretical expectation, closeness of variants may be of significance in terms of party system fragmentation and its effect on electoral turnout. In countries characterized by a high level of fragmentation, greater distance between parties may foster electoral turnout. To check whether data from European democracies confirm the assumption, predicted probabilities of voter turnout according to the level of party system fragmentation and political polarization are presented in Fig. 3.

Fig. 3 Predicted probability of turnout according to the level of party system fragmentation and their distance (political polarization)
The results of our analysis indicate the conditioning effect of polarization, measured as the share of anti-establishment parties, on the effect of fragmentation on voters’ behavior. When the level of polarization is low, the effect of fragmentation on voters’ turnout is negative, meaning the higher the fragmentation, the lower the propensity of voters to turn out. However, as the level of polarization increases, the effect of fragmentation goes in the opposite way and is positively associated with voter turnout. Or put differently, in contexts characterized by a high number of parties that are rather similar to each other, the probability of voter turnout decreases. However, as the distance between parties increases, the effect reverses, meaning that in this case fragmentation is associated with even higher turnout. It seems that a sufficient degree of variation between the options in this respect could, in some circumstances, mitigate the effect of a larger number of options. Thus, the negative effect might not be based primarily on the amount of information, but rather on the degree of confusion that comes with too similar options. Still, the results of our analysis seem to support theoretical expectations regarding the importance of difference of variants (political polarization) in terms of association between an increased number of variants (party system fragmentation) and the decision of voters to go to the polls.
However, there is still potential to take research on the impact of these variables even further. Future research may be extended by the use of a different way of measuring polarization, for example by including an aspect of the number of sub-attributes that each of the options presented include (Fasolo et al. Reference Fasolo, McClelland and Todd2007; Scheibehenne et al. Reference Scheibehenne, Greifeneder and Todd2010). The sub-aspects of each party could be defined as the policies that the parties promote in their election campaign. The distinctiveness of each option would then be compared based on the proximity of the parties’ positions on these policy issues.
Certain limits regarding the research design also should be noted. Use of cross-sectional data does not allow us to determine causality. Also, party system fragmentation is measured on aggregate level as a characteristic of a given country. For a more precise investigation of the influence of party system fragmentation and the associated information overload on electoral decision-making, it would be appropriate to use experimental research in which the assumed negative effect of these variables could be examined directly in a controlled environment. However, despite its limits, the results of the analysis provide important insights regarding citizen’s electoral decision-making in the context of different party offers, and create further perspectives for subsequent research.
Conclusion
Electoral participation is an extensively studied phenomenon that can indicate the state of democracy, quality of representative democracy as well as the overall social mood in a given country (Solijonov 2016; Tambe Reference Tambe2016). Low voter turnout may lead to a possible reduction in the legitimacy of the elected leadership and disrupt the process of political socialization (Kymlicka Reference Kymlicka2002; Hadjar and Beck Reference Hadjar and Beck2010). Thus, the non-participation in regular elections poses a rather significant threat to the proper functioning of political systems (Tambe Reference Tambe2016). Therefore, it is important to investigate factors that may exert a negative influence on voter participation in elections.
In this regard, the article focuses on the possible effect of party system fragmentation. Previous research on this phenomenon has focused primarily on the underlying link between fragmentation and voter turnout, yielding somewhat inconclusive results (Jackman Reference Jackman1987; Blais and Carty Reference Blais and Carty1990; Norris Reference Norris2002; Blais Reference Blais2006; Smets and van Ham Reference Smets and van Ham2013; Cancela and Geys Reference Cancela and Geys2016; Stockemer Reference Stockemer2017). The article extends existing knowledge by focusing on a more comprehensive and detailed approach describing the complex dynamics between voter turnout and party system fragmentation.
Aligned with previous meta-analyses, the findings are in accordance with the traditionally weak and negative association between party system fragmentation and voter participation. Also, an increase in the number of parties between elections seems to be negatively related to the probability of turnout. However, the article introduces a cognitive overload theory, and individual-level indicators to identify circumstances in which higher party system fragmentation may have substantial effects.
Partisanship can be viewed as a form of mental shortcut that voters can apply when trying to reduce the effect of a larger number of political parties. The effect of fragmentation is negative in post-communist states of Central and Eastern Europe compared to Western Europe, indicating that voters in Central and Eastern Europe may be more susceptible to the impact of strong party system fragmentation due to the unanchored nature of party systems and lower political sophistication. The results thus suggest that the number of variants may be important, especially in the context of newer democracies, where it is likely to have the potential to erode citizens’ decision to vote. The relationship between fragmentation and polarization, measured as the share of anti-establishment parties, has been confirmed by new data and a different methodology. Beyond the expected case where higher fragmentation and lower polarization lead to lower turnout, however, the analysis also suggests that at some point the effect of polarization can trump fragmentation, and high turnout can be observed even when fragmentation but also polarization is high. However, it is still rather an indirect inference. It would be useful for further research to take the issue of polarization to the party level and observe the effect of real differences between parties, for example, in the policies they represent, on voters’ decision-making.
In spite of this, findings make it possible to revitalize the effect of party system fragmentation on voter turnout and, given the above-mentioned conditions under which this variable tends to strengthen its negative effect, to place it alongside other factors that affect voter turnout. From another perspective, confirmation of the negative effect of the large number of running parties combined with the degree of similarity between the variants, may point to a suggestion that the catch all strategy, which is now being pursued by more and more parties (Moschonas Reference Moschonas, Cronin, Ross and Shoch2011) and which includes, among other things, a tendency toward political unification and centrism (Krouwel Reference Krouwel2003; Mainwaring and McGraw Reference Mainwaring and McGraw2018) may not be as advantageous as it might seem.
Appendix
Operationalization of controls
Gender is coded so that the 0 is a man and 1 is a woman. Therefore, men represent the reference category in models. Age is measured in years. Education corresponds to the international ISCED classification. Income is measured in deciles. To measure political interest, respondents were asked how interested in politics they are. The level of their interest should be indicated on a four-point scale with following options: very interested; quite interested; hardly interested; not at all interested. The variable is reverse-coded so that the higher the value, the higher the interest. The last category of an absence of interest is the reference category in models, meaning the coefficients of the other three categories mean comparison with the category of least politically interested. Ideological leanings of respondents were determined on a 11-point scale where 0 means left and 10 means right. The first five points of the scale were merged to a category of the left and last five points were merged to a category of right-leaning respondents. Respondents that chose the middle point on a scale form the category of center. In the models, the center respondents are the reference category which means that left-leaning and right-leaning respondents are compared to them in an analysis. Finally, religiosity is measured in terms of religious services attendance. More specifically, respondents indicated how often they attend religious services apart from special occasions on a 7-point scale from every day to never. The variable is reverse-coded so that the higher the value, the more frequent the religious services attendance.

Funding
Open access publishing supported by the institutions participating in the CzechELib Transformative Agreement. This publication was made possible thanks to targeted funding provided by the Czech Ministry of Education, Youth and Sports for specific research, granted to Palacký University Olomouc (IGA_FF_2022_066; Democracy in the shadow of authoritarian populism).
Declarations
Conflict of interest On behalf of all authors, the corresponding author states that there is no conflict of interest.


 Open access