

Introduction
Rules are on the rise. Across rich Western democracies, the stock of rules and regulation has expanded massively over the last decades. The major driver of this development is policy accumulation (Adam et al. Reference Adam, Hurka, Knill and Steinebach2019). Governments constantly adopt new policies and programmes to an ever‐growing stock of rules (Kaufmann & van Witteloostuijn Reference Kaufmann and van Witteloostuijn2012, Reference Kaufmann and van Witteloostuijn2018; Kosti & Levi‐Faur Reference Kosti and Levi‐Faur2019). In many instances, these developments reflect societal progress and modernization. New rules are adopted in order to tackle pressing problems, such as environmental pollution, unemployment, poverty or economic decline (Cingolani et al. Reference Cingolani, Thomsson and de Crombrugghe2015). As existing policies are dismantled or terminated only very rarely, rules and regulations continuously pile up over time. Even where deregulation attempts have led to the liberalization of markets and policy areas, this was typically accomplished with the help of more rather than fewer rules and regulations (Vogel Reference Vogel1996). Hence, rule growth is a common pattern shaping government activities in modern democracies, although dynamics of growth might vary across countries and policy sectors (Jennings et al. Reference Jennings, Schulz, Patient, Gravel and Yuan2005; Jakobsen & Mortensen Reference Jakobsen and Mortensen2015; Adam et al. Reference Adam, Knill and Fernandez‐i‐Marín2017).
If we assume that rules are adopted in response to new problems and societal demands, more rules should – on average – make our world a better place. For instance, we would expect that more environmental rules and regulation will improve the quality of our environment. Yet, this relationship has not been systematically examined so far. This research gap originates from a dominant research perspective that analyses the consequences of individual rules rather than adopting a macro‐perspective on the effects of entire bodies of rules and their growth over time. As a consequence, we know a lot about the effects of individual rules. There is a booming research industry analysing why some rules work while others do not, focusing on policy design as well as on factors affecting the implementation effectiveness of these policies. What is missing, however, is a macro‐perspective that allows for a proper assessment of the relationship between rule growth and the achievement of policy goals. In this article, we aim at filling this gap in the literature. Looking at the field of environmental policy, we examine the question whether more rules improve environmental quality and hence sectoral policy performance. We argue that an increasing stock of rules requires administrative capacity in order to be impactful, taking account of the fact that rules, and hence administrative implementation burdens, accumulate over time. Therefore, more rules alone do not lead to better policy performance. Instead, a country that wants to effectively improve environmental quality needs to ensure that implementation capacities keep up with the rise in rules.
We test our argument following a two‐step procedure. First, we assess the impact of rule growth on environmental policy performance by analysing time‐series cross‐sectional (TSCS) data for 13 advanced market economies from 1980 to 2010. We estimate the effect of environmental rule growth by using a new and encompassing measure for the stock of rules as well as a comprehensive indicator of general environmental policy performance. In line with our argument, we do not find a general and unconditional effect of rule growth on environmental quality. Second, we test for the effect of rule growth taking account of a country's administrative capacity. Here, we use two different proxies: (1) a broad and general measure of administrative capacity; and (2) a sector‐specific measure that concentrates on a country's institutional features in the area of environmental policy. Our analysis reveals that more rules do indeed improve environmental performance – but only if they are matched by a simultaneous expansion in administrative capacity. Accordingly, rules are a necessary, yet not sufficient condition for achieving sectoral policy objectives.
The contribution of this article is threefold. First, it discusses the literature on rule growth (March et al. Reference March, Schulz and Zhou2000; Jakobsen & Mortensen Reference Jakobsen and Mortensen2015). Whilst these studies focus on the causes of rule growth, we theorise and examine its consequences. Second, we combine the studies of rule growth with discussions about administrative capacities. While existing implementation studies take individual policies as a unit of analysis, our approach adopts a macro‐perspective on the linkage between rule stock and policy performance. Third, our study expands the literature that compares environmental performance across rich democracies (Jahn Reference Jahn2016a). Whilst these analyses have greatly improved our understanding of economic, political and institutional drivers of more general environmental performance indicators, they skip the stages of policy adoption and policy implementation. Incorporating these two crucial steps of the policy process can help us to specify the exact macro–micro–macro transitions that link national peculiarities to different levels of environmental performance.
The article is structured as follows. We start with a conceptual and theoretical discussion, arguing that administrative capacities are of central importance in order to understand the unexplored link between rule growth and policy performance. Afterwards, we provide empirical evidence for the area of environmental policy – a policy field where rule‐based regulation is of utmost importance (Jörgens et al. Reference Jörgens, Lenschow and Liefferink2014). Then, we test for the influence of administrative capacities on the proper functioning of environmental rules. The concluding section stresses the implications for policy making in an ever‐growing complex legislative environment and presents avenues for future research.
Rule growth and policy impact
Already Max Weber identified an expanding stock of rules as a central feature of modern societies and as indispensable for economic growth. Starting from Max Weber's finding that bureaucratic expansion and rule expansion feed off themselves (Weber Reference Weber1978: 271), a lively academic debate on the drivers and brakes of rule‐making dynamics has emerged over the last two decades (e.g. Levi‐Faur Reference Levi‐Faur2014; Jakobsen & Mortensen Reference Jakobsen and Mortensen2015; Toshkov et al. Reference Toshkov, Mäder and Rasmussen2018; Adam et al. Reference Adam, Hurka, Knill and Steinebach2019; Rasmussen et al. Reference Rasmussen, Reher and Toshkov2019). So far, however, we do not know much about the consequences of rule growth. Do more rules lead to better performance?
If we look for answers to this question, the literature on policy evaluation is the most obvious starting point. Typically, evaluation studies seek to establish causal linkages between a given policy and its impact (Pawson & Tilley Reference Pawson and Tilley1997; Sager Reference Sager2017). Although many studies examine potential causal effects of a single policy measure in a respective country (Knill & Tosun Reference Knill and Tosun2012), a growing body of work analyses the impact of a given policy measure from a comparative perspective. For instance, scholars have looked at the impact of social policies on poverty rates (Moller et al. Reference Moller, Bradley, Huber, Nielsen and Stephens2003; Scruggs & Allan Reference Scruggs and Allan2006), how gun regulation affects homicides and suicides (Hurka & Knill Reference Hurka and Knill2018), and whether raising top tax rates reduces inequality (Huber et al. Reference Huber, Huo and Stephens2017).
Yet, rather than analysing the aggregate impact of a given rule stock, evaluation studies typically assess the factors affecting the effectiveness of individual rules. It is well‐acknowledged that not every new policy achieves its objectives; that is, not every rule works as initially intended. First of all, rules might suffer from design problems, for example in the case of wrong assumptions about the cause‐effect relationships. There is also a bulk of studies on the choice of policy instruments; for example,. whether given policy goals should be achieved via detailed interventionist approaches or whether more flexible instruments that leave broad discretion for street‐level agents are more or less appropriate to enhance intended policy impacts (Goulder & Parry Reference Goulder and Parry2008; Cansino et al. Reference Cansino, Pablo‐Romero, Román and Yñiguez2010). Moreover, the implementation stage has been identified as a major inroad for ineffectiveness. While deficient implementation can arise from a range of factors, including non‐compliance on the side of involved stakeholders as well as discretionary rule application by street‐level bureaucrats (Thomann et al. Reference Thomann, Hupe and Sager2018), appropriate administrative arrangements for implementation (in terms of organizational structures, manpower and expertise) are generally considered a necessary condition for effective implementation (May Reference May, Peters and Pierre2012; Winter Reference Winter, Peters and Pierre2012; Steinebach Reference Steinebach2019).
We argue that these studies suffer from a potential blind spot: While we learn a lot about the extent to which a certain policy achieved its goals in various settings, potential trade‐offs with the impact achievements of other policies are neglected. For instance, the effective implementation of policy A might require the redistribution of administrative capacities, implying that policies B and C are implemented less effectively. This argument shifts our focus away from what exactly legislators do to target specific problems and how this translates into impacts, to studying impact of how much they do in an entire policy field. In other words, we need to assess the general effect of (growing) rule portfolios on policy impacts.
Some of these ‘biases’ have already been acknowledged in the literature. They can be found in the literatures on policy spill‐overs (Truelove et al. Reference Truelove, Carrico, Weber, Raimi and Vandenbergh2014) and policy mixes (Gunningham & Grabosky Reference Gunningham and Grabosky1998). Here, the argument is that policies rarely work ‘in isolation’ but mutually affect one another (Howlett & del Rio Reference Howlett and del Rio2015). However, these policy interactions are neither always negative nor always positive. Rather, there are some policies that are complementary while others are counterproductive (Fankhauser et al. Reference Fankhauser, Hepburn and Park2010). For example, introducing a charge for single‐use plastic bags can strengthen environmental identity (Poortinga et al. Reference Poortinga, Whitmarsh and Suffolk2013). This, in turn, can increase overall pro‐environmental actions (e.g., recycling, energy use etc.). Similarly, it is possible that a new regulation that puts a cost on air pollution might cause firms to change behaviour and increase water or soil pollution instead (Greenstone Reference Greenstone2003). Given these countervailing effects of policy interactions, it can be assumed that, on an aggregate level, negative and positive effects level each other out. There is no ex ante indication that can lead us to assume that policy interdependencies generally strengthen or weaken the marginal effect of new rules on policy performance.
While spill‐overs and policy mixes can thus generally be assumed to have no systematic (and unidirectional) impact on the relationship between rule growth and policy performance, this is not the case for administrative capacities. Rules intend to change the behaviour of the target group (policy outcome) in order to achieve a broader societal impact. Thus, it is necessary that citizens and businesses alter their actions so that a given objective, such as the reduction of environmental pollution, can be achieved. To ensure that citizens and businesses abide by the rules, their compliance must be continuously supervised, controlled and if necessary, enforced (Cohen & Shimshack Reference Cohen, Shimshack, Richards and van Zeben2017). The extent to which implementing authorities can carry out the respective activities depends on their human capacity (administrative and technical expertise) as well as on the financial, technical and organizational resources available (see Gerston Reference Gerston2010; Howlett & Ramesh Reference Howlett and Ramesh2016). In this sense, administrative capacity can be understood as ‘the capacity of [bureaucratic] intermediaries to carry out requisite actions, that foster increased commitment to policy goals, and that help to signal desired courses of action’ (May Reference May, Peters and Pierre2012: 288). It is almost a truism that in order to accomplish any kind of policy goal, the state needs the capacities to do so (Fukuyama Reference Fukuyama2013; Wu et al. Reference Wu, Ramesh and Howlett2015). This well‐established connection, however, becomes ever more relevant when moving beyond individual policies towards a macro‐perspective.
Even when acknowledging that different rules may have varying capacity implications, there is a high probability that any increase in administrative burden will negatively affect the level of administrative capacities that is on average available for each rule in the stock. In other words, if the adoption of new rules does not come along with corresponding expansions of implementation capacities, this should increase the probability that policy effectiveness is generally reduced. More rules might thus make things worse rather than better if they lead to administrative overload. When states accumulate policies, they run the danger of overburdening their public administration. Rule growth thus needs to be backed by appropriate administrative capacities in implementation.
When there is rule glut without proper adjustment of administrative capacities, two problems arise. First, new rules might be implemented deficiently – or even ignored completely (Adam et al. Reference Adam, Hurka, Knill and Steinebach2019). Implementers might simply not take the required actions, for example, the inspection of plants, facilities or products, to turn political decisions into practice and reality. This is equally true when looking at individual policies but could also be more prevalent in situations where much capacity is already taken up by a substantial stock of rules to be implemented. Second, taking the whole of the rule stock into account, the associated additional workload is likely to have negative consequences for the implementation of already existing rules. If the rules that need to be implemented and enforced grow faster than the administrative capacities, front‐line implementers must develop coping strategies to handle the increasing workload (Tummers et al. Reference Tummers, Bekkers, Vink and Musheno2015; Vedung Reference Vedung2015). A potential result might be that implementers opt for prioritization and only focus on those rules that are easy to control or only opt for inspecting a small portion of the target population. In sum, administrative overload, that is, a lack of sufficient administrative capacity, could stand in the way of translating policy outputs into outcomes, which should have a negative effect on policy impacts. If implementers face time and resource constraints, more rules might therefore actually not lead to better performance.
In short, taking a macro‐perspective on the linkage between rule growth and policy performance puts administrative capacities centre stage. Administrative overload should be the central impediment to a ‘the more the better’ logic of rule growth. Where administrative capacity cannot keep up with increasing legislative outputs, this should have dampening effects on overall policy performance. Conversely, sufficient administrative resources for the proper application and enforcement of environmental rules are a crucial prerequisite for effective implementation, and hence the achievement of policy targets.
In emphasizing administrative capacities, we do not mean to ignore that implementation effectiveness might be affected by many additional factors, such as underlying policy conflicts, problem ambiguity, and target group size and heterogeneity, as well as specific socio‐economic and problem conditions defining the local policy context (for overviews see, Matland Reference Matland1995; Winter Reference Winter, Peters and Pierre2012). While these might be of crucial importance to understand variation in implementation effectiveness of individual policies, we contend that none of them substantially challenges the relevance of administrative implementation capacities as a most basic requirement for proper rule application and enforcement.
Empirics
In theory, rule growth does not necessarily lead to improved performance in a given sector. Rather, it needs to be backed by sufficient administrative capacities to actually translate into policy impacts. Our empirical analysis scrutinises these two arguments in turn. In a first step, we look at whether ‘more’ is really ‘better’. Employing TSCS data, we look at whether environmental rule growth improves environmental quality. In a second step, we are interested in the role of administrative capacities at the nexus of rule growth and policy impact. The quantitative analysis spans over a period of three decades (1980–2010) and covers 13 advanced market economies, including 12 European Union member states (Austria, Belgium, Denmark, France, Germany, Ireland, Italy, the Netherlands, Portugal, Spain, Sweden and the United Kingdom) as well as Switzerland. While the issue of rule growth and its impact might be of equal relevance for all countries around the world, industrialized democracies have particular features that make them most suitable subjects of analysis. First, industrialized democracies have a comparatively long‐standing and comprehensive commitment to environmental concerns. Second, and contrary to more autocratic forms of government, governments in these countries cannot simply rely on the use of force and threat to make people comply with their rules (Wong Reference Wong2015). This makes administrative capacities key for understanding the environmental rule‐performance nexus.
We focus on environmental policy for two reasons: First, almost all developed democracies have accumulated a significant inventory of environmental rules and regulations over the last few decades (Sommerer & Lim Reference Sommerer and Lim2016), which renders the area a particularly relevant case for assessing whether, and under which conditions, rules make a real‐world difference. Second, for environmental rules to ‘work’ properly they must not only be well‐designed but also effectively applied and enforced (Gunningham Reference Gunningham2011). In contrast to other policy areas where governments can rely more strongly on non‐state actors, the highly technical nature of environmental rules requires at least some implementation capacities within the state's bureaucracy to ensure the proper application and enforcement of these rules. Environmental rules are thus perfectly suited to examine what happens if administrative capacities can(not) keep up with constant rule expansion.
The main challenge in assessing rule production in a policy field (here, environmental policy) in terms of its impacts (here, environmental quality) lies in comprehensively measuring policy outputs across countries. Hitherto, quantitative studies on rule growth either focus on subdimensions of specific policy fields (van Witteloostuijn & de Jong Reference van Witteloostuijn and de Jong2010; Kaufmann & van Witteloostuijn Reference Kaufmann and van Witteloostuijn2012), or restrict themselves to a single country (March et al. Reference March, Schulz and Zhou2000; Jakobsen & Mortensen Reference Jakobsen and Mortensen2015). We overcome these limitations by using a new, cross‐nationally comparable measurement of environmental rule portfolios as our independent variable. Our measure is based on fine‐grained coding of 12 environmental policy instruments (plus one residual category) which can potentially apply to any of 48 targets. The policy targets mostly represent pollutants like ozone, carbon dioxide or sulphur dioxide in the air, but also comprise other substances like lead content in gasoline, as well as environmental objects such as native forests. The policy instruments considered include, amongst others, bans, technological prescriptions, obligatory standards, prohibitions, and taxation (for a detailed presentation of both policy targets and instruments please consult Table A1 and A2 in the Supporting Information Appendix).
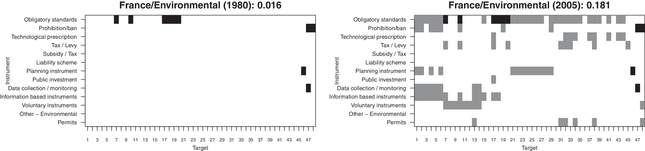
The differentiation between targets and instruments leaves us with a two‐dimensional portfolio space (Adam et al. Reference Adam, Knill and Fernandez‐i‐Marín2017). Based on this portfolio space, we can calculate our indicator for the environmental rule portfolio which can range from 0 (no policy instrument for any of the targets) to 1 (all policy instruments for all the targets). For illustrative purposes, Figure 1 shows the environmental rule portfolio of France in the years 1980 and 2005. The boxes marked in grey represent the new environmental rules added to the portfolio. In the respective time frame, the portfolio size grew from 0.016 (10 target‐instrument‐combinations divided by the total of possible target‐instrument‐combinations, i.e. 13 × 48) to 0.181 (113 target‐instrument‐combinations divided by the total of possible target‐instrument‐combinations, i.e. 13 × 48).

Figure 1. Exemplary rule portfolio France.
Our assessment of both environmental policy targets and instruments relies on a comprehensive data collection of all relevant national legal documents – laws, decrees and regulations – in the specific issue area under review. The pieces of legislation were collected through national legal repositories, secondary literature and scholarly analyses. Legislation emanating from subnational state levels was excluded from the data collection process as our focus lies on the comparison at the national level. Figure A1 in the Online Appendix visualises the development of environmental rule portfolios from 1980 to 2010.
Our central dependent variable is an aggregate measure of environmental policy performance taken from Jahn (Reference Jahn2016a) (for a general discussion of different environmental quality and performance indicators see Jahn Reference Jahn2016a: 94–95 and Fiorino Reference Fiorino2011). More specifically, we use the average of two environmental policy dimensions – general performance (covering waste and air pollution) as well as water pollution (covering pollution in rivers and lakes as well as fertilisers). In total, 11 standardised indicators are used to construct the final index. The index's scale ranges from 0 to 100. We rescale the index so that higher values indicate better environmental policy performance.
We add time trends as well as country fixed effects to our analyses to account for temporal dynamics and unobserved unit heterogeneity. Importantly, the country fixed effects approach changes our analytical focus. Without fixed effects, we investigate the pooled variance across all observations (within and between variance). When we include country fixed effects, we mainly look at changes over time (within variance). In other words, our data structure fundamentally changes once we control for country fixed effects. Therefore, we need to ensure that our empirical approach still matches our theoretical models (Plümper et al. Reference Plümper, Troeger and Manow2005). As we are mainly interested in the effect of rule growth on the development of environmental quality, our focus is on change over time. Hence, controlling for unobserved country heterogeneity via fixed effects is a suitable empirical strategy for our analysis.
To control for potential confounders, we include a battery of covariates in our models. These are gross domestic product (GDP) per capita (logged values), economic growth, economic openness measured via trade volume as a percentage of GDP, urban population share and the energy usage per capita. The respective data can be readily derived from either the organisation for economic co‐operation and development (OECD) or the World Bank. To account for political effects on environmental performance, we add a time‐varying corporatism index as well as an indicator which measures the ideology of the government position on a green‐growth scale. Data come from Jahn (Reference Jahn2016b). We rescale the government ideology variable so that positive values indicate positions further on the ‘green’ dimension, whereas negative values show a more ‘growth’ friendly position of the government. All variables are lagged by one year.
To make sure that our results are neither driven by our modelling decisions (Kittel & Winner Reference Kittel and Winner2005) nor by our choice of covariates (Lenz & Sahn Reference Lenz and Sahn2019), we expand our models stepwise. This means that we first run a minimal model which solely includes the environmental rule portfolio as our main independent variable. Afterwards, we subsequently add time trends, country fixed effects (FE) and our battery of covariates. We use panel corrected standard errors (PCSE) to account for heteroscedasticity (Beck & Katz Reference Beck and Katz1995). Furthermore, we apply a Prais–Winsten estimation which models first‐order autoregressive (AR(1)) disturbances in order to control for autocorrelation.
Results
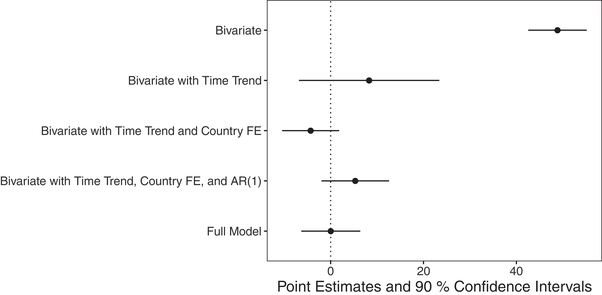
Figure 2 presents the results for the effect of environmental rule growth on environmental performance.Footnote 1 In the simple bivariate model, a larger rule portfolio seems to lead to better environmental performance indeed. However, this effect is solely driven by temporal dynamics. Both growing environmental rule stocks as well as improvements in environmental performance have been grand trends over time that have affected all countries alike. In other words, the bivariate relation is likely to be a spurious one. Further specifications of our models support this empirical expectation. As soon as we control for time dynamics, the coefficient becomes statistically insignificant. The effect stays statistically indistinguishable from zero for our full model that includes all controls, country fixed effects and AR(1) disturbances. These findings show strong support for our main argument that rule growth does not improve policy performance per se.Footnote 2

Figure 2. Effect of environmental rule portfolio on environmental performance.
Regarding our control variables (Table A3, Model 5), we find that greener governments are correlated with a better environmental performance. Furthermore, increasing levels of GDP as well as a higher national energy consumption lead to worse overall environmental quality. In addition, we find that a higher urban population share improves environmental performance. Corporatist structures are associated with a better environmental performance as well, although the coefficient is not statistically significantly.
In addition to our main models, we calculate several additional robustness checks (Table A4 in the Online Appendix). First, we estimate the full model but use year FE instead of time trends. Our results hold. Second, we include time trends, FE, and an additional lagged dependent variable. Again, we do not find a general effect of rule growth on environmental performance. Moreover, we use a jackknife procedure to ensure that our results are not driven by outliers. We also recalculate our models by using country‐clustered standard errors instead of PCSEs. Results stay robust. Furthermore, we check the robustness of our results by adding several additional covariates. We control for industry share as a percentage of GDP as well as for the share of renewable energy consumption as a percentage of total energy consumption (World Bank 2018). As data for both indicators are largely missing for the 1980s, adding them essentially means running a temporal subset analysis. This way, we can also check whether the lack of a general effect of environmental rule growth on environmental performance is driven by the choice of our observation period. The results are in line with our general findings: the environmental rule growth coefficient is not statistically significant when adding these additional covariates. Furthermore, our main finding also holds when restricting the observation period to the years 1980–1995 (Table A4, Model 7 in the Online Appendix).
Finally, our results might still be driven by endogeneity. This would be the case if governments levy environmental policies as a reaction to an ongoing trend of deteriorating environmental quality. In other words, rule growth might not be completely exogenous to environmental performance. If this is the case, we might not find an average effect of our environmental rule portfolio variable due to reverse causation. Although our approach of using country FE and time trends tries to address this problem, it cannot entirely discard the endogeneity issue due to a lack of random variation. Therefore, we run additional robustness checks using two‐stage least squares (2SLS) regressions. We take the degree to which central governments face institutional constraints to policy making as an instrument for our environmental rule growth variable. In particular, we use an index developed by Schmidt (Reference Schmidt1996) which ranges from 0 to 6, with higher values indicating more institutional veto points (Armingeon et al. Reference Armingeon, Wenger, Wiedemeier, Isler, Knöpfel, Weisstanner and Engler2019). Following Tsebelis (Reference Tsebelis2002) and Immergut (Reference Immergut1990) we would expect that governments facing more institutional constraints will produce fewer rules and regulations. At the same time, we have little reason to assume that institutional veto points affect environmental quality beyond their impact on environmental legislation. Table A5 in the Online Appendix shows the results of our 2SLS regression.Footnote 3 In line with our theoretical expectation, rule growth (as instrumented by the veto points) does not improve environmental performance in general.
Interaction models
In the first part of the quantitative analysis, we have seen that rule growth alone does not improve policy performance. As a second step, we now turn to scrutinizing the argument that rule growth needs to be accompanied by an expansion of administrative capacities to improve performance. However, measuring bureaucratic capacities in the sense described above is a tricky empirical endeavour. In terms of resources, should such an indicator solely focus on budgets and administrative headcount? And, if yes, which staff should be counted? How can a measurement account for administrative characteristics such as technological advancement, training or organisational structures?
In order to test for the conditioning effect of administrative capacity on the impact of rule growth, we opt for a different empirical approach here. We use two different proxies for bureaucratic capacity. The first one looks at administrative capacity from an aggregate perspective. In particular, we use a new measurement of the overall capacity of nation states developed by Hanson and Sigman (Reference Hanson and Sigman2019). In line with Skocpol (Reference Skocpol, Evans, Rueschemeyer and Skocpol1985), these authors conceptualise state capacity based on three main dimensions: ‘plentiful resources, administrative‐military control of a territory and loyal and skilled officials’ (Hanson & Sigman Reference Hanson and Sigman2019: 4). All three factors are crucial for bureaucratic capacity: without sufficient resources, states lack the fiscal means to sustain a comprehensive bureaucratic apparatus; without administrative control, governments lack governance authority to implement policies; and without a high quality bureaucratic workforce, public administration lacks the political competence and expertise to make policies work. Hanson and Sigman (Reference Hanson and Sigman2019) use a wide array of indicators and a Bayesian latent variable approach to measure the general capacity of nation states. Amongst others, these cover indicators such as a measurement for administrative efficiency (Adelman & Morris Reference Adelman and Morris1967), the International Country Risk Guide's ‘bureaucracy quality’ indicator, a novel indicator for a government's information capacity (Brambor et al. Reference Brambor, Goenaga, Lindvall and Teorell2019) and a measure for rigorous and impartial public administration (Coppedge et al. Reference Coppedge, Gerring, Knutsen, Lindberg, Teorell, Altman and Ziblatt2019). The resulting one‐dimensional indicator ranges from 0.6 to 2.4 with higher values representing higher levels of overall capacity. It is highly correlated (r2 = 0.90) with the government effectiveness indicator from the World Bank's Worldwide Governance Indicators (WGI), another widely used indicator for administrative capacity (World Bank 2017). However, the indicator by Hanson and Sigman (Reference Hanson and Sigman2019) has two crucial advantages. First, it is available for a longer time period than the government effectiveness indicator. Second, as Hanson and Sigman (Reference Hanson and Sigman2019) use a latent variable approach, their indicator is less vulnerable to aggregation rules.
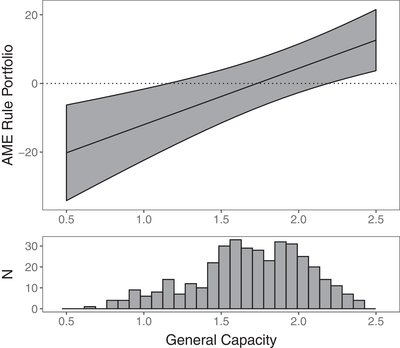
We let the variable interact with our indicator for environmental rule portfolio. In line with our argument, we expect that rule growth leads to better environmental performance in countries where bureaucratic capacities increase as well. Table A6 in the Online Appendix shows the regression results. Throughout all models, the interaction effect is positive and statistically significant. To interpret these results substantially, Figure 3 shows the interaction between environmental rule growth and the general capacity of the state to implement policies by plotting the average marginal effect of environmental rule growth (Brambor et al. Reference Brambor, Clark and Golder2005).Footnote 4 In line with Hainmueller and colleagues (Reference Hainmueller, Mummolo and Xu2020), we add a histogram showing the distribution of our moderating variable to the plot. This way, we ensure that we only interpret the interaction effect in areas of common support. The results are in line with our theoretical expectations: Rule growth only leads to better environmental performance when countries possess enough capacities to implement public policy. In countries where the development of overall bureaucratic quality is deficient, more rules alone do not improve environmental performance.

Figure 3. Average marginal effect of environmental rule portfolio conditional on overall state capacity.
It is important to keep in mind that this comprehensive indicator measures the overall capability of the state to implement its policies. However, it does not directly refer to sector‐specific implementation capacities of a country. Therefore, we run an additional set of interaction models in which we use a proxy for environmental bureaucratic capacities instead of the general capacity indicator. We take an indicator of environmental institutional capacity from Jahn (Reference Jahn2016a) which builds upon data collected by Tews and Jänicke (Reference Tews and Jänicke2005) as well as Busch and Jörgens (Reference Busch and Jörgens2005). This index combines information on different dimensions of institutional capacity such as the existence of specialized governmental institutions (environmental ministries or agencies), fundamental legal infrastructure (e.g. environmental information acts) and institutions for sustainable development (e.g. sustainability councils). Jahn's original index also includes various environmental instruments like CO2 taxes and ecolabels. However, as these policies are an integral part of our measure of environmental rule growth, we exclude them from the index. Although the presented index ‘only’ measures the institutionalisation of environmental matters, it should actually go hand in hand with other crucial dimensions of administrative capacity such as manpower and expertise. This is due to several reasons: First, a crucial dimension of administrative capacities is whether the implementing authorities possess sufficient analytical skills and operational knowledge on the subject matter as well as on the clients and conditions in the policy domain that they serve (Pattyn & Brans Reference Pattyn and Brans2015: 192; Peters Reference Peters2015: 220). All things equal, sectoral and specialized environmental agencies can be expected to be able to develop and acquire such expertise rather easily. Second, sustainability councils provide a ‘voice’ and venue for environmental matters. Environmental groups but also political actors from the bureaucracy can use this opportunity to highlight shortcomings while policy execution and enforcement and, if necessary, demand and advocate for additional administrative resources (Knill et al. Reference Knill, Steinbacher and Steinebach2019; Niestroy Reference Niestroy2005).
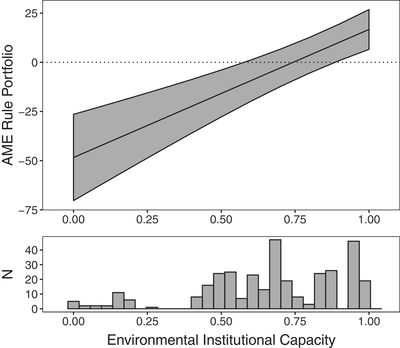
The index ranges from 0 to 1, with higher values indicating higher capacity. Again, we interact this proxy for environmental administrative capacity with our rule growth variable. The interaction effect is positive and statistically significant across different model specifications (Table A7 in the Online Appendix). Figure 4 plots the average marginal effects. We can see that environmental rule growth only improves environmental quality if countries possess enough environmental institutional capacity. Rule growth even has a negative effect on environmental performance for the lowest levels of capacity. However, this should be interpreted with caution as there are only few empirical observations with very low capacity levels.

Figure 4. Average marginal effect of environmental rule portfolio conditional on environmental institutional capacity.
Hainmueller et al. (Reference Hainmueller, Mummolo and Xu2020) recommend checking whether the linearity assumption holds for the interaction term. We follow their suggestion and plot local interaction effects which are based on Gaussian kernel reweighting (Figure A2 in the Online Appendix). In line with our previous findings, environmental rule growth only improves overall environmental quality when capacity (general capacity as well as environmental institutional capacity) is sufficiently high. Thus, our findings hold when we relax the linearity assumption of the interaction effect.
A recurrent argument in the literature on policy design and instrument choice is that not all policies and instrument choice require the same amount of administrative capacities to become effective. In this context, it has been argued that hierarchical forms of governmental intervention require especially encompassing administrative capacities due to their need for constant monitoring and enforcement. Market‐ and information‐based policy instruments, by contrast, are often considered to be somewhat self‐executing (Holzinger & Knoepfel Reference Holzinger, Knoepfel, Holzinger and Knoepfel2000; Howlett et al. Reference Howlett, Ramesh and Perl2009: 175). As a result, it might not only be the mere size of the rule stock that makes a difference but also its exact composition. While it is certainly true that policies somewhat vary regarding their capacity requirements, there is virtually no environmental policy that might become effective without proper enforcement. Even in cases such as carbon trading schemes, public authorities need to control the accuracy of the information provided by the plant operators.Footnote 5
Conclusion
Does rule growth affect policy performance? In order to answer this question, we have investigated the impact of rule growth in the area of environmental policy. Theoretically, we have argued that it requires a macro‐level perspective on rule growth which takes into account that rules and hence administrative implementation burdens accumulate over time. Based on these considerations, we have argued that more rules do not lead to better performance per se. Instead, impactful rule growth requires administrative capacities. If rule implementation capacities cannot keep up, more rules are less likely to improve performance. Overburdening implementing bodies via more rules and regulations might even worsen societal impacts. This would be the case if new rules not only lack encompassing implementation, but also lead to an obstruction of administrative workflows. As a consequence, implementation of those rules which are already in place might suffer as well. Our crucial contribution in this regard is to analyse policy development and policy implementation from an aggregate perspective, hence moving beyond the predominant study of individual policies. We have shown that an ever‐growing stock of rules might negatively affect the achievement of intended policy targets if burdens of rule implementation are not matched by corresponding increases in administrative capacities. To understand variation in policy performance across countries and sectors, we need to move beyond accounts of singular policies and their subsequent implementation.
Empirically, we have substantiated our argument with a quantitative analysis of the connection between rule growth and environmental policy performance for 13 advanced market economies from 1980 to 2010. In line with our theoretical expectations, the results did not show a general effect of environmental rule growth on performance. Doing ‘more’ is hence not necessarily ‘better’. However, drawing on both a general and a sector specific measurement of administrative capacity, we found support for our conjecture that environmental rule growth can be associated with improvements in environmental performance if it is matched by sufficient capacity.
Our analysis has important implications for the literature on comparative public policy. First, the study calls for further investigation of rule growth beyond the field of environmental policy. More research on the effect of growing rule stocks in other areas such as social policy, education or economic policy could greatly advance our knowledge about the relationship between rule growth and policy performance. Second, our study highlights the need to systematically investigate implementation capacities and their increase or decrease across countries and policy sectors. The precise assessment of these capacities and their structural variation (beyond simple head counts) continues to be important topic for future research.
Besides these indications for future research, some research limitations have to be acknowledged. First, highlighting the role of administrative capacities poses the question why bureaucratic means vary in the first place. Why do some countries expand the capacities of implementing bodies whilst others retrench them? Moreover, why do governments allow mismatches between administrative burden load and administrative resources to happen? Fiscal constraints, asymmetric information about structural implementation deficits, and even policy hypocrisy might serve as potential explanations in this regard. Second, our study is not designed to allow for the identification of tipping points; that is, the specification of constellations in which the marginal effect on policy performance of an additional rule turns negative unless administrative capacities are not expanded correspondingly. Third, it might be an important next step to engage in case studies in order to cross‐validate our quantitative findings and to more closely investigate the underlying causal processes linking rule growth, behavioural responses of implementation bodies considering administrative capacities and policy performance. In sum, implementation bodies are crucial for policy impact in an era of rule growth. Identifying the sources of administrative capacities is therefore central for our understanding of policy making in the 21st century.
Acknowledgements
This study was conducted within the research project ACCUPOL led by Christoph Knill and funded by an ERC Advanced Grant (No. 788941). We wish to thank Pirmin Bundi, Markus Hinterleitner, David Levi‐Faur, Yair Osheroff, participants at the ICPP4 2019 in Montreal, as well as the Editors of the European Journal of Political Research and three anonymous reviewers for their excellent comments and suggestions. Furthermore, we are grateful to Detlef Jahn for generously sharing his data.
Online Appendix
Additional supporting information may be found in the Online Appendix section at the end of the article:
Table A1: List of policy items
Table A2: Environmental policy instruments
Table A3: Main models
Table A4: Additional robustness checks
Table A5: 2SLS Models
Table A6: Interaction models general capacity
Table A7: Interaction models environmental institutional capacity
Table A8: Summary statistics
Figure A1: Development environmental rule portfolio
Figure A2: Average marginal effects allowing for non‐linear interaction effect with Kernel estimator


 Open access