


1. Introduction
Interdisciplinary understanding is an important foundation for producing robust scientific advice for policymakers and government officials on complex issues, such as climate change (Bammer et al., Reference Bammer, O'Rourke, O'Connell, Neuhauser, Midgley, Klein, Grigg, Gadlin, Elsum, Bursztyn, Fulton, Pohl, Smithson, Vilsmaier, Bergmann, Jaeger, Merkx, Vienni Baptista, Burgman and Richardson2020; Gluckman et al., Reference Gluckman, Bardsley and Kaiser2021). However, navigating the immense and rapidly expanding body of climate change literature, and identifying the most important developments is increasingly difficult, due to the sheer volume of yearly scholarly publications, and the diversity of topics and disciplinary perspectives (Callaghan et al., Reference Callaghan, Minx and Forster2020; Minx et al., Reference Minx, Callaghan, Lamb, Garard and Edenhofer2017). In this paper, we identify key recent advances across diverse research areas on climate change, spanning natural and social sciences. We refer to these as ‘new insights’, selected on the grounds of their scientific evidence-base, novelty, and policy relevance, and anchored on the most recent peer-reviewed literature (Bustamante et al., Reference Bustamante, Roy, Ospina, Achakulwisut, Aggarwal, Bastos, Broadgate, Canadell, Carr, Chen, Cleugh, Ebi, Edwards, Farbotko, Fernández-Martínez, Frölicher, Fuss, Geden, Gruber and Zscheischler2023; Schaeffer et al., Reference Schaeffer, Schipper, Ospina, Mirazo, Alencar, Anvari, Artaxo, Biresselioglu, Blome, Boeckmann, Brink, Broadgate, Bustamante, Cai, Canadell, Cardinale, Chidichimo, Ditlevsen, Eicker and Ziervogel2025). This year, the synthesis is built on the collective effort of 75 researchers, based on input from more than 150 experts across the world. This paper has a dual purpose. First, it offers entry-points to enhance cross- and inter-disciplinary understanding among climate change researchers with very different domains of expertise. Second, it grounds the scientific messages highlighted in an annual science-policy report titled ‘10 New Insights in Climate Science,’ which is shared with all the Party delegations to the United Nations Framework Convention on Climate Change (UNFCCC).
Before presenting this year's 10 insights, the Introduction offers a concise account of the state of the climate system and greenhouse gas (GHG) emissions in 2024, key outcomes of the 29th Conference of the Parties (COP29), and expectations leading into the COP30. We expand briefly on the rationale behind the 10 New Insights in Climate Science initiative, and explain how it is intended to contribute to more scientifically informed discussions at COP30 and beyond.
1.1. State of the climate system and GHG emissions
Key climate indicators continue to exhibit trends inconsistent with stabilising the climate system. In the first months of 2025, the World Meteorological Organization (WMO) confirmed that 2024 was the warmest year on record, with an average temperature of 1.55°C (± 0.13°C) above pre-industrial levels (C3S, 2025a; WMO, 2025). While this does not signify a breach of the 1.5°C long-term warming limit of the Paris Agreement, it is a stark sign of how close we are to that. The year 2024 also brought record-breaking ocean-heat content and sea-level rise, exceptional glacier mass loss, and Antarctic sea ice reached its second-lowest extent on record (C3S, 2025a; WMO, 2025). The rise of global temperature has intensified extreme weather events, including heatwaves, droughts, wildfires, storms, and floods, potentially having caused tens or even hundreds of thousands of human deaths and displaced millions (Otto et al., Reference Otto, Giguere, Clarke, Barnes, Zachariah, Merz, Philip, Kew, Pinto and Vahlberg2024). And yet, despite the impacts already felt and the impending risks, anthropogenic GHG emissions further increased throughout 2023 and 2024 (Forster et al., Reference Forster, Smith, Walsh, Lamb, Lamboll, Cassou, Hauser, Hausfather, Lee, Palmer, von Schuckmann, Slangen, Szopa, Trewin, Yun, Gillett, Jenkins, Matthews, Raghavan and Zhai2025; Friedlingstein et al., Reference Friedlingstein, O'Sullivan, Jones, Andrew, Hauck, Landschützer, Le Quéré, Li, Luijkx, Olsen, Peters, Peters, Pongratz, Schwingshackl, Sitch, Canadell, Ciais, Jackson, Alin and Zeng2025). As a direct result of this, atmospheric concentrations of GHGs continue their steady rise (C3S, 2025a; NOAA-GML, 2025).
At present, global mitigation action remains insufficient to achieve climate goals. Full implementation of the current nationally determined contributions (NDCs) would only reduce global emissions by 5.9% (3.2–8.6) by 2030, relative to 2019 levels (UNFCCC, 2024), and lead to warming of 2.6°C (1.9–3.6) by the end of the century (UNEP, 2024). In contrast, keeping the planet below 2°C warming (relative to the pre-industrial average) following a least-cost pathway requires a 28% reduction in global emissions (or 42% for 1.5°C) by 2030 (UNEP, 2024). These figures underscore the importance of rapidly “closing the gaps” on ambition and implementation in the new NDCs, submitted as part of the third cycle of commitments in order to achieve the 2035 targets.
Unfortunately, the third cycle of NDC submissions is progressing slowly. By the February 2025 deadline originally set by the UNFCCC, only 16 of 195 Parties had submitted the required updated NDCs. Among these 16, only a few major economies, such as the United Kingdom, Brazil, and the United Arab Emirates, submitted updates. The United States submitted its NDC in December 2024, but its withdrawal from the Paris Agreement will take legal effect at the end of January 2026. The UNFCCC extended the deadline to September 2025, which is the cutoff date for inclusion in the UNFCCC's annual NDC synthesis report, the official assessment of global progress toward the Paris Agreement goals to be presented at COP30 in Belém, Brazil (UNDP, 2025). As of September 19, only 37 Parties had submitted the updated NDCs, while major emitters, including China, India, the European Union, and Russia had not (Climate Watch, 2025; UNFCCC, 2025a). This lack of momentum is one of the biggest challenges at the moment for climate diplomacy.
1.2. From Baku to belém
Key outcomes from COP29 in Baku, Azerbaijan, include the adoption of the New Collective Quantified Goal (NCQG) on climate finance, and an agreement on the framework for international carbon markets (Article 6 of the Paris Agreement) (Goldberg, Reference Goldberg2025; Kessler & Vallejo, Reference Kessler and Vallejo2024; Waskow et al., Reference Waskow, Larsen, Robinson, Alayza, Boehm, Srouji, Chakrabarty, Swaby, Warszawski, Garcia, Carter, Cogswell, Gerholdt, Molesworth, Yaakov, Nilsson, McCoshan, Elliott, Null and Layke2024) (see Note S7 for a brief explanation of terms related to the UNFCCC process). However, the climate finance goal of $300 billion annually by 2035 is widely regarded as insufficient given the identified needs (Bhattacharya et al., Reference Bhattacharya, Songwe, Soubeyran and Stern2024). The Baku–Belém Roadmap to realise the $1.3 trillion aspirational goal is the main process to address the shortcomings, but it faces some highly contentious and unfinished items for operationalisation, including the sources (public-provided vs. private-mobilised funding), kind (grant- vs. loan-based), allocation (Adaptation and Loss & Damage), and accountability (standards for tracking and reporting) (Alayza & Larsen, Reference Alayza and Larsen2025). Progress on the Mitigation agenda at COP29 was minimal. At COP30, the expectation is to resolve issues regarding the “ambition cycle” structure, the role of the Mitigation Work Programme (MWP) going forward, and the implementation of the Global Stocktake (GST) outcome on transitioning away from fossil fuels. Aspects of the Paris Agreement rulebook still pending include carbon markets (e.g., technical guidance to prevent double-counting and the verification of removal projects), adaptation (e.g., inclusion of indicators on ‘means of implementation’), and just transition (e.g., global framework). But with almost all negotiations for the Paris Agreement finally completed, and scientific evidence showing there is no time to be wasted if the goals are to be reached, the focus is now firmly on effective implementation.
1.3. The ‘10 new insights in climate science’
Despite challenges, recent findings suggest that in most countries, people continue to trust scientists and support their increased engagement in public discourse and policymaking (Cologna et al., Reference Cologna, Mede, Berger, Besley, Brick, Joubert, Maibach, Mihelj, Oreskes, Schäfer, van der Linden, Abdul Aziz, Abdulsalam, Shamsi, Aczel, Adinugroho, Alabrese, Aldoh, Alfano and Zwaan2025). Science has a critical role in informing policymaking and governance, including the implementation of climate commitments at international, national, and sub-national levels. The Intergovernmental Panel on Climate Change (IPCC) is the cornerstone of the science–policy interface on climate change. IPCC Assessment Reports reflect and, to a large extent, produce the scientific consensus. However, given their comprehensiveness and procedural demands, these assessment reports have a multi-year production cycle. The cut-off dates for inclusion of literature in the most recent Assessment Report (AR6) were in 2020 and 2021; hence, research published after 2021 will only be reflected in the reports of the next IPCC cycle (AR7), the first of which is expected to be published in 2028. Therefore, complementary synthesis and communication efforts are needed to share the emerging scientific advances more rapidly.
The 10 New Insights in Climate Science initiative responds to this need by curating and synthesising key messages across diverse fields of climate change research based on the latest peer-reviewed literature, on a yearly basis. It offers a thematically broad selection of scientific messages, in a format that is accessible to non-experts. The ultimate purpose is to support the timely uptake of new scientific evidence in policy processes and international governance spaces.
A ‘new insight’ refers to a recent advance in climate change research, based on new evidence or analysis that significantly updates existing understanding of climate processes, impacts, or possible solutions. An insight can also highlight an emerging area of research or a novel concept that is gaining attention and is seen as an important future direction for the field.
For a more detailed account of the positioning of this initiative in the broader science–policy landscape for climate change, in particular its complementary character to the IPCC reports, see Schaeffer et al. (Reference Schaeffer, Schipper, Ospina, Mirazo, Alencar, Anvari, Artaxo, Biresselioglu, Blome, Boeckmann, Brink, Broadgate, Bustamante, Cai, Canadell, Cardinale, Chidichimo, Ditlevsen, Eicker and Ziervogel2025).
1.4. Method
Every cycle of the 10 New Insights in Climate Science incorporates lessons from the previous year, resulting in a progressively more robust process for the selection and development of insights. The process (SM1) described further builds directly on the one described by Bustamante et al. (Reference Bustamante, Roy, Ospina, Achakulwisut, Aggarwal, Bastos, Broadgate, Canadell, Carr, Chen, Cleugh, Ebi, Edwards, Farbotko, Fernández-Martínez, Frölicher, Fuss, Geden, Gruber and Zscheischler2023). In January, an open call for expert input was distributed as an online questionnaire (SM2), primarily making use of the partners' institutional networks with global reach. The main question that respondents answer is ‘What key recent advance in climate change research do you think should be highlighted for policymakers?’ Respondents are also asked to provide references to recent peer-reviewed publications (i.e., 2024 or 2025) that support their suggested key research advance.
The call for expert input was open between 9 January and 5 February 2025 (4.5 weeks) and received responses from 154 individuals (SM3), totaling 179 suggestions. The suggestions or ‘entries’ collected were screened by at least two team members based on predefined inclusion/exclusion criteria (SM4). When necessary, project coordinators conducted one additional round of screening to come to a final decision. This year, 56 entries met the inclusion criteria. After merging the closely related entries, the list was reduced to 44 themes and coded using a thematic framework based on all previous ‘10 New Insights’ editions. This list was complemented with a literature scan (SM5) of impactful papers in climate change research published in the same period (2024 and the first months of 2025), which yielded 27 additional themes. The final list of 71 themes (SM6) was then evaluated in a three-stage process by our editorial board, consisting of 23 leading international climate change researchers from various disciplines. First, the 71 themes were categorised into four broad categories: (i) the Earth system, (ii) Impacts, (iii) Actions, and (iv) Barriers. The editorial board members then individually prioritised 4–20 themes (1–5 per category) that they considered most relevant overall. Second, building on the outcomes of the individual prioritisation of themes, the editorial board members gathered virtually for an initial 90-minute workshop to deliberate and collectively prioritise the themes, leading to a preliminary set of candidate insights. At a second workshop, the final set of insights was approved. For more details on the process, see Bustamante et al. (Reference Bustamante, Roy, Ospina, Achakulwisut, Aggarwal, Bastos, Broadgate, Canadell, Carr, Chen, Cleugh, Ebi, Edwards, Farbotko, Fernández-Martínez, Frölicher, Fuss, Geden, Gruber and Zscheischler2023) and Schaeffer et al. (Reference Schaeffer, Schipper, Ospina, Mirazo, Alencar, Anvari, Artaxo, Biresselioglu, Blome, Boeckmann, Brink, Broadgate, Bustamante, Cai, Canadell, Cardinale, Chidichimo, Ditlevsen, Eicker and Ziervogel2025).
2. Results
The 10 new insights featured this year begin with an explanation of the geophysical processes and remaining uncertainties behind the record-warm years of 2023/2024 (Insight 1), with an additional examination of the acceleration of warming in the oceans and impacts on marine heatwaves (Insight 2). We then highlight the latest evidence of strain on land carbon sinks, highlighting recent changes on the Northern Hemisphere sinks (Insight 3). Continuing on biosphere–climate interactions, we also synthesise new evidence on the direct effect of biodiversity loss on climate change (Insight 4). The next three insights focus on three distinct types of climate impacts: groundwater depletion (Insight 5), global incidence of dengue (Insight 6), and labour productivity and income loss (Insight 7). The final three insights focus on distinct and complementary approaches and instruments to mitigation, their potential, and limitations. Starting with strategic considerations for scaling CDR in the context of overshoot (Insight 8), carbon credit markets and associated integrity challenges (Insight 9), and the lessons on effective policy mixes for emissions reductions (Insight 10). After this ‘Results’ section, the insights are summarised into clusters of messages, and with links to discussions happening ahead of and in preparation for COP30.
Insight 1. Explaining the record warm years 2023/2024 – evidence, uncertainty, and remaining questions
Since 2023, global surface temperatures have shattered previous records, more likely than not surpassing 1.5°C above pre-industrial levels in 2024 and remaining elevated into 2025 (Forster et al., Reference Forster, Smith, Walsh, Lamb, Lamboll, Cassou, Hauser, Hausfather, Lee, Palmer, von Schuckmann, Slangen, Szopa, Trewin, Yun, Gillett, Jenkins, Matthews, Raghavan and Zhai2025; WMO, 2025). While the shift from La Niña to El Niño was expected to warm the planet, the intensity, global extent, and persistence of the heat were unprecedented (Min, Reference Min2024).
The unexpected level of global warmth (Schmidt, Reference Schmidt2024) coincided with an elevated Earth Energy Imbalance (EEI) (Forster et al., Reference Forster, Smith, Walsh, Lamb, Lamboll, Cassou, Hauser, Hausfather, Lee, Palmer, von Schuckmann, Slangen, Szopa, Trewin, Yun, Gillett, Jenkins, Matthews, Raghavan and Zhai2025; Mauritsen et al., Reference Mauritsen, Tsushima, Meyssignac, Loeb, Hakuba, Pilewskie, Cole, Suzuki, Ackerman, Allan, Andrews, Bender, Bloch-Johnson, Bodas-Salcedo, Brookshaw, Ceppi, Clerbaux, Dessler, Donohoe and Zelinka2025). EEI is the difference between energy input from absorbed sunlight (shortwave radiation) and output in the form of infrared (longwave) radiation to space, such that an elevated positive EEI results in a greater heating rate and so an acceleration of global warming (Forster et al., Reference Forster, Storelvmo, Armour, Collins, Dufresne, Frame, Lunt, Mauritsen, Palmer, Watanabe, Wild, Zhang, Masson-Delmotte, Zhai, Pirani, Connors, Péan, Berger, Caud, Chen, Goldfarb, Gomis, Huang, Leitzell, Lonnoy, Matthews, Maycock, Waterfield, Yelekçi, Yu and Zhou2021; Minière et al., Reference Minière, von Schuckmann, Sallée and Vogt2023). Observed increases in EEI since 2000 and peaking in 2023 have been dominated by reducing reflection of sunlight from the planet as a whole (reduced planetary albedo) that was associated with diminished coverage of ice and less reflective clouds over the oceans (Allan & Merchant, Reference Allan and Merchant2025; Goessling et al., Reference Goessling, Rackow and Jung2025; Loeb, Ham, et al., Reference Loeb, Ham, Allan, Thorsen, Meyssignac, Kato, Johnson and Lyman2024; Tselioudis et al., Reference Tselioudis, Rossow, Bender, Oreopoulos and Remillard2024, Reference Tselioudis, Remillard, Jakob and Rossow2025). The role of feedbacks to warming (involving ice, cloud, and water vapour), declining aerosol particulate pollution, internal ocean variability and other factors in driving the planetary darkening remain debated (Hansen et al., Reference Hansen, Kharecha, Sato, Tselioudis, Kelly, Bauer, Ruedy, Jeong, Jin, Rignot, Velicogna, Schoeberl, von Schuckmann, Amponsem, Cao, Keskinen, Li and Pokela2025; Hodnebrog et al., Reference Hodnebrog, Myhre, Jouan, Andrews, Forster, Jia, Loeb, Olivié, Paynter, Quaas, Raghuraman and Schulz2024; Raghuraman et al., Reference Raghuraman, Paynter, Ramaswamy, Menzel and Huang2023). Here, we assess recent evidence on how unusual the level of warmth in 2023/2024 was in the context of climate variability, the role of the elevated EEI in explaining this warmth and what factors explain the elevated EEI, which has implications for the rate of climate change over the coming decades.
Accounting for the long-term warming caused by GHG increases, the margin by which the annual average ocean warmth April 2023 to March 2024 broke the previous annual record was found to occur only once in about 500 years or longer (Terhaar et al., Reference Terhaar, Burger, Vogt, Frölicher and Stocker2025), and the September 2023 margin just once in about 2000 years (Rantanen & Laaksonen, Reference Rantanen and Laaksonen2024) when considering variability based on observations and simulations. A large jump in global temperatures was made more likely by the transition from a prolonged La Niña phase to an El Niño, a situation that applied in 2023/2024 but also 1976/1977 (Raghuraman et al., Reference Raghuraman, Soden, Clement, Vecchi, Menemenlis and Yang2024). However, while a clear consensus is still missing, the recent temperature surge is only marginally reconcilable with the long-term warming trend combined with internal variability, particularly given that the 2023/2024 El Niño was not as strong as previous ones (Cattiaux et al., Reference Cattiaux, Ribes and Cariou2024; Xie et al., Reference Xie, Miyamoto, Zhang, Kosaka, Liang and Lutsko2025). This emphasises a need to investigate other contributing factors and to scrutinise changes in Earth's energy budget.
The substantial warming from 2022 to 2023 is physically determined by how much heat was absorbed by Earth's surface layers.The EEI reached 1.9 Wm−2 during mid-2022 to mid-2023, more than double the 2006–2020 average (Allan & Merchant, Reference Allan and Merchant2025; Kuhlbrodt et al., Reference Kuhlbrodt, Swaminathan, Ceppi and Wilder2024; von Schuckmann et al., Reference von Schuckmann, Minière, Gues, Cuesta-Valero, Kirchengast, Adusumilli, Straneo, Ablain, Allan, Barker, Beltrami, Blazquez, Boyer, Cheng, Church, Desbruyeres, Dolman, Domingues, García-García and Zemp2023) and at the upper level of what is expected from detailed modelling (Hodnebrog et al., Reference Hodnebrog, Myhre, Jouan, Andrews, Forster, Jia, Loeb, Olivié, Paynter, Quaas, Raghuraman and Schulz2024). Only around 15–20% of this increased EEI contributed to heating of the atmosphere and land, and to a lesser extent melting of ice (Allan & Merchant, Reference Allan and Merchant2025; Minobe et al., Reference Minobe, Behrens, Findell, Loeb, Meyssignac and Sutton2025). The remainder increased ocean heating (Cheng et al., Reference Cheng, Abraham, Trenberth, Boyer, Mann, Zhu, Wang, Yu, Locarnini, Fasullo, Zheng, Li, Zhang, Wan, Chen, Wang, Feng, Song, Liu and Lu2024). The magnitude of sea surface warming can only be reconciled with this ocean heating if concentrated in shallower upper-most ocean layers (England et al., Reference England, Li, Huguenin, Kiss, Sen Gupta, Holmes and Rahmstorf2025; Guinaldo et al., Reference Guinaldo, Cassou, Sallée and Liné2025; Li, Huang, et al., Reference Li, Huang, Liu, Ding, He and Xie2024) or through redistribution of heat from the subsurface 100–300 m ocean layer to the upper 100 m layer during the transition to El Niño in 2023, which added to the greater heating from above due to a larger EEI (Allan & Merchant, Reference Allan and Merchant2025; Min, Reference Min2024; Minobe et al., Reference Minobe, Behrens, Findell, Loeb, Meyssignac and Sutton2025) (see Insight 2). Research confirms that EEI increases since 2000 are dominated by greater absorption of sunlight, and associated primarily with reduced reflectivity over cloudy regions of the ocean (Allan & Merchant, Reference Allan and Merchant2025; Goessling et al., Reference Goessling, Rackow and Jung2025; Loeb, Ham, et al., Reference Loeb, Ham, Allan, Thorsen, Meyssignac, Kato, Johnson and Lyman2024).
Figure 1 shows factors contributing to extra warming in 2023 and 2024, additional to the average annual rise caused mainly by rising greenhouse gases. A moderate additional heating from the 11-year solar cycle, which was slightly stronger and earlier than expected (P. M. Forster et al., Reference Forster, Smith, Walsh, Lamb, Lamboll, Cassou, Hauser, Hausfather, Lee, Palmer, von Schuckmann, Slangen, Szopa, Trewin, Yun, Gillett, Jenkins, Matthews, Raghavan and Zhai2025), contributed extra warming (Goessling et al., Reference Goessling, Rackow and Jung2025; Hansen et al., Reference Hansen, Kharecha, Sato, Tselioudis, Kelly, Bauer, Ruedy, Jeong, Jin, Rignot, Velicogna, Schoeberl, von Schuckmann, Amponsem, Cao, Keskinen, Li and Pokela2025; Merchant et al., Reference Merchant, Allan and Embury2025). The effect of the Hunga Tonga undersea volcanic eruption that peaked in early 2022 is now considered small since warming from water vapour injected into the normally dry stratosphere was offset by cooling from greater reflection of sunlight by sulfate aerosol particles also emitted (Gupta et al., Reference Gupta, Mittal, Fauria, Bennartz and Kok2025; Jenkins et al., Reference Jenkins, Smith, Allen and Grainger2023; Schoeberl et al., Reference Schoeberl, Wang, Taha, Zawada, Ueyama and Dessler2024; Stenchikov et al., Reference Stenchikov, Ukhov and Osipov2025; Stocker et al., Reference Stocker, Steiner, Ladstädter, Foelsche and Randel2024) (Figure 1). Effects from other volcanoes and wildfire (Yu et al., Reference Yu, Portmann, Peng, Liu, Zhu, Asher, Bai, Lu, Bian, Mills, Schmidt, Rosenlof and Toon2023), or reduced Sahara dust in June 2023 (Francis et al., Reference Francis, Fonseca, Nelli and Yarragunta2024) are also considered small at the global scale. A larger influence on the elevated EEI and associated warming is expected from reductions in sulfate aerosol pollution originating from different sources (Figure 1), primarily through the subsequent influence on clouds, which can explain a considerable part of the increase in EEI in 2001–2019 (Hodnebrog et al., Reference Hodnebrog, Myhre, Jouan, Andrews, Forster, Jia, Loeb, Olivié, Paynter, Quaas, Raghuraman and Schulz2024).

Figure 1. Estimates of contributing factors to the anomalous global mean temperatures in 2023 and 2024 (residual components), adding to the annual warming effect from increasing radiative forcing dominated by rising greenhouse gases (left-side pink bar: 0.026 [0.02–0.04]°C/yr, as assessed by Forster et al., Reference Forster, Smith, Walsh, Lamb, Lamboll, Hall, Hauser, Ribes, Rosen, Gillett, Palmer, Rogelj, von Schuckmann, Trewin, Allen, Andrew, Betts, Borger, Boyer and Zhai2024 for 2010–2019). The actual residual for each year (green dashed line) is the difference between the annual global mean temperature in 2023 and 2024, and a 20-year trend (LOESS smoothed, with green fading area hinting at the uncertainties). Individual residual components (vertical bars) indicate the specific contributions for each of the 2 years (uncertainty bars nominally represent the 95% confidence level). The residual data displayed are from WMO (2025), see Figure 12 therein and associated discussion for details (cf. Forster et al. (Reference Forster, Smith, Walsh, Lamb, Lamboll, Cassou, Hauser, Hausfather, Lee, Palmer, von Schuckmann, Slangen, Szopa, Trewin, Yun, Gillett, Jenkins, Matthews, Raghavan and Zhai2025) made a similar analysis). It is important to note that the data shown are only indicative and represent preliminary estimates. References discussed in the main text provide more information on each component; these references are, however, not necessarily the same as used by WMO (2025) for deriving the temperature contributions.
First, regulations implemented in 2020 reduced sulfur emissions from international shipping by ∼80% and the resulting reduction in sulfate aerosol particles led to a heating effect due to less sunlight being reflected, particularly through aerosol effects on clouds (Forster et al., Reference Forster, Smith, Walsh, Lamb, Lamboll, Hall, Hauser, Ribes, Rosen, Gillett, Palmer, Rogelj, von Schuckmann, Trewin, Allen, Andrew, Betts, Borger, Boyer and Zhai2024; Gettelman et al., Reference Gettelman, Christensen, Diamond, Gryspeerdt, Manshausen, Stier, Watson-Parris, Yang, Yoshioka and Yuan2024; Hansen et al., Reference Hansen, Kharecha, Sato, Tselioudis, Kelly, Bauer, Ruedy, Jeong, Jin, Rignot, Velicogna, Schoeberl, von Schuckmann, Amponsem, Cao, Keskinen, Li and Pokela2025; Jordan & Henry, Reference Jordan and Henry2024; Quaglia & Visioni, Reference Quaglia and Visioni2024; Skeie et al., Reference Skeie, Byrom, Hodnebrog, Jouan and Myhre2024; Yoshioka et al., Reference Yoshioka, Grosvenor, Booth, Morice and Carslaw2024; Yuan et al., Reference Yuan, Song, Oreopoulos, Wood, Bian, Breen, Chin, Yu, Barahona, Meyer and Platnick2024; Zhang et al., Reference Zhang, Chen, Gryspeerdt, Yamaguchi and Feingold2025). There is a potentially large regional temperature change induced by the sulfur cap, especially over the mid-latitude oceans in the Northern Hemisphere (Gettelman et al., Reference Gettelman, Christensen, Diamond, Gryspeerdt, Manshausen, Stier, Watson-Parris, Yang, Yoshioka and Yuan2024). The sulfur cap is mostly estimated to have a moderate effect on global surface warming based on a variety of methods (Gettelman et al., Reference Gettelman, Christensen, Diamond, Gryspeerdt, Manshausen, Stier, Watson-Parris, Yang, Yoshioka and Yuan2024; Hansen et al., Reference Hansen, Kharecha, Sato, Tselioudis, Kelly, Bauer, Ruedy, Jeong, Jin, Rignot, Velicogna, Schoeberl, von Schuckmann, Amponsem, Cao, Keskinen, Li and Pokela2025; Jordan & Henry, Reference Jordan and Henry2024; Quaglia & Visioni, Reference Quaglia and Visioni2024; Watson-Parris et al., Reference Watson-Parris, Wilcox, Stjern, Allen, Persad, Bollasina, Ekman, Iles, Joshi, Lund, McCoy, Westervelt, Williams and Samset2025; Yoshioka et al., Reference Yoshioka, Grosvenor, Booth, Morice and Carslaw2024; Yuan et al., Reference Yuan, Song, Oreopoulos, Wood, Bian, Breen, Chin, Yu, Barahona, Meyer and Platnick2024) (Figure 1).
Second, there was a pronounced decline in land-based anthropogenic aerosol emissions in recent decades (Insight 2 in Schaeffer et al., Reference Schaeffer, Schipper, Ospina, Mirazo, Alencar, Anvari, Artaxo, Biresselioglu, Blome, Boeckmann, Brink, Broadgate, Bustamante, Cai, Canadell, Cardinale, Chidichimo, Ditlevsen, Eicker and Ziervogel2025). Rapid aerosol emission reductions over East Asia since their peak in the early 2000s have significantly contributed to global warming during 2010–2023 (Samset et al., Reference Samset, Wilcox, Allen, Stjern, Lund, Ahmadi, Ekman, Elling, Fraser-Leach, Griffiths, Keeble, Koshiro, Kushner, Lewinschal, Makkonen, Merikanto, Nabat, Narazenko, O'Donnell and Westervelt2025), and to record high sea surface temperatures in the Northeast Pacific in 2010–2020 that were potentially amplified by cloud feedback responses to the warming (Wang et al., Reference Wang, Zheng, Cai, Han, Xie, Kang, Geng, Liu, Wang, Wu, Xiang and Zhou2024). While extra absorbed sunlight associated with declining East Asian aerosol is physically linked with the long-term warming trend, their contribution to the level of global warmth in 2023/2024 is less obvious (Figure 1). More recently, however, the reduction of aerosol emissions in areas where pollution has already been somewhat mitigated, such as East Asia, or over the still moderately pristine open ocean, is thought to have a larger effect on reducing the reflectiveness of clouds than previously believed (Hansen et al., Reference Hansen, Kharecha, Sato, Tselioudis, Kelly, Bauer, Ruedy, Jeong, Jin, Rignot, Velicogna, Schoeberl, von Schuckmann, Amponsem, Cao, Keskinen, Li and Pokela2025; H. Jia & Quaas, Reference Jia and Quaas2023).
Several uncertainties remain when it comes to the causes and implications of the record heat since 2023. Aerosol–cloud interactions and cloud feedbacks display a large diversity across model simulations (Forster et al., Reference Forster, Storelvmo, Armour, Collins, Dufresne, Frame, Lunt, Mauritsen, Palmer, Watanabe, Wild, Zhang, Masson-Delmotte, Zhai, Pirani, Connors, Péan, Berger, Caud, Chen, Goldfarb, Gomis, Huang, Leitzell, Lonnoy, Matthews, Maycock, Waterfield, Yelekçi, Yu and Zhou2021; Zelinka et al., Reference Zelinka, Smith, Qin and Taylor2023), and the inability of coarse-resolution global models to adequately represent ship tracks adds to the uncertainty in estimates of climate impacts of the sulfur cap (Gettelman et al., Reference Gettelman, Christensen, Diamond, Gryspeerdt, Manshausen, Stier, Watson-Parris, Yang, Yoshioka and Yuan2024). A more robust quantification of the cloud feedback, including how circulation-induced shrinking of cloud zones contributes (Tselioudis et al., Reference Tselioudis, Remillard, Jakob and Rossow2025), can inform to what extent global warming is accelerating by these effects. EEI observations from Clouds and the Earth's Radiant Energy System (CERES) since 2000 are essential for modelling initiatives proposed to disentangle forcings and feedbacks and to improve models (Schmidt et al., Reference Schmidt, Andrews, Bauer, Durack, Loeb, Ramaswamy, Arnold, Bosilovich, Cole, Horowitz, Johnson, Lyman, Medeiros, Michibata, Olonscheck, Paynter, Raghuraman, Schulz, Takasuka and Ziehn2023) yet are at risk due to aging satellites (Loeb, Doelling, et al., Reference Loeb, Doelling, Kato, Su, Mlynczak and Wilkins2024; Mauritsen et al., Reference Mauritsen, Tsushima, Meyssignac, Loeb, Hakuba, Pilewskie, Cole, Suzuki, Ackerman, Allan, Andrews, Bender, Bloch-Johnson, Bodas-Salcedo, Brookshaw, Ceppi, Clerbaux, Dessler, Donohoe and Zelinka2025).
In summary, new insights add to evidence that a combination of cloud feedback responses to global warming and reduced reflection of sunlight by clouds in response to declining aerosol emissions have plausibly contributed to the long-term increase in the absorption of sunlight by the planet since 2000. The exact relative importance of these drivers or the additional role of internal ocean variability in contributing to Earth's growing energy imbalance have not been established, yet are essential for reducing the range in climate sensitivity estimates (Goessling et al., Reference Goessling, Rackow and Jung2025) with low climate sensitivity models recently found being unable to reproduce observed EEI trends (Myhre et al., Reference Myhre, Hodnebrog, Loeb and Forster2025). Combined with rising GHG levels, this extra planetary heating and a redistribution of heat in the upper ocean associated with a transition from an extended La Niña to El Niño in 2023 were instrumental in explaining the record global warmth in 2023/2024. Current levels of global temperature are consistent with a continued acceleration of global warming (Samset et al., Reference Samset, Zhou, Fuglestvedt, Lund, Marotzke and Zelinka2023) and suggest that surpassing the 1.5oC threshold above pre-industrial conditions is practically inevitable (Bevacqua et al., Reference Bevacqua, Schleussner and Zscheischler2025; Insight 1 in Bustamante et al., Reference Bustamante, Roy, Ospina, Achakulwisut, Aggarwal, Bastos, Broadgate, Canadell, Carr, Chen, Cleugh, Ebi, Edwards, Farbotko, Fernández-Martínez, Frölicher, Fuss, Geden, Gruber and Zscheischler2023; Cannon, Reference Cannon2025) yet highlights the importance of massive cuts in GHG emissions are for limiting further warming and associated impacts on societies and ecosystems.
Insight 2. Sea surface warming is accelerating and marine heatwaves are intensifying
The global average temperature of the ocean surface serves as a key indicator of climate change. Record-breaking levels of global mean sea surface temperature were recorded in April 2023 and monthly records were then continuously set for over a year until June 2024 (Cheng et al., Reference Cheng, Abraham, Trenberth, Reagan, Zhang, Storto, Von Schuckmann, Pan, Zhu, Mann, Zhu, Wang, Yu, Locarnini, Fasullo, Huang, Graham, Yin, Gouretski and Gues2025; Terhaar et al., Reference Terhaar, Burger, Vogt, Frölicher and Stocker2025). As the largest sink for Earth's accumulating heat, the ocean sets the pace for global warming, and, as new analysis outlined below shows (Merchant et al., Reference Merchant, Allan and Embury2025), that pace is accelerating. That is, the warming trend underneath internal and solar variability has been faster over the last 10–15 years compared to previous decades. Impacts on ocean life have been widespread, often severe and in some cases likely irreversible (Smith et al., Reference Smith, Sen Gupta, Burrows, Filbee-Dexter, Hobday, Holbrook, Malan, Moore, Oliver, Thomsen, Wernberg, Zhao and Smale2025).
The global mean sea surface temperature for 2024 was 0.6°C warmer than a baseline of 1981 to 2019 (Cheng et al., Reference Cheng, Abraham, Trenberth, Reagan, Zhang, Storto, Von Schuckmann, Pan, Zhu, Mann, Zhu, Wang, Yu, Locarnini, Fasullo, Huang, Graham, Yin, Gouretski and Gues2025), slightly warmer than for 2023, and about 0.9°C warmer than preindustrial (C3S, 2025b). Temperatures exceeded the previous records set in 2015–2016 by 0.25°C on average between April 2023 and March 2024 (Terhaar et al., Reference Terhaar, Burger, Vogt, Frölicher and Stocker2025). Given a long-term warming trend, it is not unexpected that El Niño years break records, but the magnitude of exceedance is large given that the El Niño of 2023–2024 was not particularly intense. The probability of the observed exceptional global exceedance assuming a steady linear warming trend has been shown to be low (about 1 in 500 years (Terhaar et al., Reference Terhaar, Burger, Vogt, Frölicher and Stocker2025)). Driven by the Earth's energy accumulation over the past decade (see Insight 1), acceleration of the underlying warming trend is physically plausible and is now statistically detectable (Merchant et al., Reference Merchant, Allan and Embury2025). Acceleration of global mean sea surface temperature is consistent with accelerations in the storage of heat in the ocean (Cheng et al., Reference Cheng, Abraham, Trenberth, Reagan, Zhang, Storto, Von Schuckmann, Pan, Zhu, Mann, Zhu, Wang, Yu, Locarnini, Fasullo, Huang, Graham, Yin, Gouretski and Gues2025; von Schuckmann et al., Reference von Schuckmann, Minière, Gues, Cuesta-Valero, Kirchengast, Adusumilli, Straneo, Ablain, Allan, Barker, Beltrami, Blazquez, Boyer, Cheng, Church, Desbruyeres, Dolman, Domingues, García-García and Zemp2023) and contributes to accelerating sea level rise, both of which are well-established.
The rise in global ocean temperature is accompanied by an increasing incidence of marine heatwaves (MHWs), which last days to months (Cael et al., Reference Cael, Burger, Henson, Britten and Frolicher2024). Based on a fixed baseline (K. E. Smith et al., Reference Smith, Sen Gupta, Burrows, Filbee-Dexter, Hobday, Holbrook, Malan, Moore, Oliver, Thomsen, Wernberg, Zhao and Smale2025) for MHW detection (Box 1), the persistence of MHWs has increased by about one week over the past four decades (Capotondi et al., Reference Capotondi, Rodrigues, Gupta, Benthuysen, Deser, Froelicher, Lovenduski, Amaya, Le Grix, Xu, Hermes, Holbrook, Martinez-Villalobos, Masina, Roxy, Schaeffer, Schlegel, Smith and Wang2024; Lee et al., Reference Lee, Song, Choi, Cho and Marshall2025). MHW intensity has increased across 65% of the global ocean during 2000–2016 compared to 1982–1998, and over this period, annual number of MHW days has risen by 54% (Oliver et al., Reference Oliver, Donat, Burrows, Moore, Smale, Alexander, Benthuysen, Feng, Sen Gupta, Hobday, Holbrook, Perkins-Kirkpatrick, Scannell, Straub and Wernberg2018). An exceptionally extreme, near-basin-scale marine heatwave was experienced in the North Atlantic in 2023 (England et al., Reference England, Li, Huguenin, Kiss, Sen Gupta, Holmes and Rahmstorf2025). These changes are in part driven by weakening interaction between the upper and the deeper ocean, as the upper waters warm faster and become relatively more buoyant (England et al., Reference England, Li, Huguenin, Kiss, Sen Gupta, Holmes and Rahmstorf2025). Climate models consistently project further increases in both the frequency and intensity of MHWs under continued global warming (Cael et al., Reference Cael, Burger, Henson, Britten and Frolicher2024; Deser et al., Reference Deser, Phillips, Alexander, Amaya, Capotondi, Jacox and Scott2024; Frölicher et al., Reference Frölicher, Fischer and Gruber2018).
Box 1. Definition of Marine Heatwaves
Marine heatwaves (MHWs) are periods of abnormally high sea surface temperatures that persist for days to months or even longer and can extend across thousands of square-kilometers. MHWs are commonly defined as sea water temperatures exceeding the 90th percentile relative to a baseline climatology for at least five consecutive days (Hobday et al. Reference Hobday, Alexander, Perkins, Smale, Straub, Oliver, Benthuysen, Burrows, Donat, Feng, Holbrook, Moore, Scannell, Sen Gupta and Wernberg2016). These events can occur at the surface or subsurface and have wide-ranging ecological, biogeochemical, and socioeconomic impacts (Smith et al., Reference Smith, Sen Gupta, Burrows, Filbee-Dexter, Hobday, Holbrook, Malan, Moore, Oliver, Thomsen, Wernberg, Zhao and Smale2025).
MHWs are not purely a surface phenomenon, but also occur in the sub-surface where the majority of fish live and diurnally migrate (Sun et al., Reference Sun, Li, Jing, Hu and Zhang2023). Heatwaves in the sub-surface layer can be more intense than their surface counterparts, and most do not co-occur with surface heatwaves (He et al., Reference He, Zhan, Feng, Gong, Cai and Zhan2024; Köhn et al., Reference Köhn, Vogt, Muennich and Gruber2024). Sub-surface MHWs are often caused by ocean eddies and are intensifying more rapidly (0.1–1°C per decade) than the rise in mean state temperature (around 0.1°C per decade) under global warming (Guo et al., Reference Guo, Gao, Zhang, Cai, Chen, Leung, Zscheischler, Thompson, Davis, Qu, Gao and Wu2024; Köhn et al., Reference Köhn, Vogt, Muennich and Gruber2024). Despite growing recognition of the ecological importance of subsurface MHWs, the scarcity of observations presents a challenge to gaining a full understanding of their dynamics and impacts (Le Grix et al., Reference Le Grix, Burger and Frölicher2025; S. Li & Hu, Reference Li and Hu2024).
Oceanic warming is of concern on land and in the oceans themselves. The weather and seasons experienced by human populations are strongly determined by the warmth of the ocean (Armour et al., Reference Armour, Proistosescu, Dong, Hahn, Blanchard-Wrigglesworth, Pauling, Jnglin Wills, Andrews, Stuecker, Po-Chedley, Mitevski, Forster and Gregory2024; Samset et al., Reference Samset, Lund, Fuglestvedt and Wilcox2024). Exceptional sea surface temperatures tend to strengthen European heatwaves (Berthou et al., Reference Berthou, Renshaw, Smyth, Tinker, Grist, Wihsgott, Jones, Inall, Nolan, Berx, Arnold, Blunn, Castillo, Cotterill, Daly, Dow, Gómez, Fraser-Leonhardt, Hirschi and Worsfold2024) and to increase the likelihood for Atlantic, Caribbean and Pacific hurricanes to intensify (Choi et al., Reference Choi, Park, Kim and Lee2024; Radfar, Moftakhari, et al., Reference Radfar, Moftakhari and Moradkhani2024). Several studies linked MHWs and extreme weather events like hurricanes, cyclones, flooding, and atmospheric heatwaves (Berthou et al., Reference Berthou, Renshaw, Smyth, Tinker, Grist, Wihsgott, Jones, Inall, Nolan, Berx, Arnold, Blunn, Castillo, Cotterill, Daly, Dow, Gómez, Fraser-Leonhardt, Hirschi and Worsfold2024; Choi et al., Reference Choi, Park, Kim and Lee2024; Radfar, Foroumandi, et al., Reference Radfar, Foroumandi, Moftakhari, Moradkhani, Foltz and Gupta2024; Ripple et al., Reference Ripple, Wolf, Gregg, Rockstroem, Mann, Oreskes, Lenton, Rahmstorf, Newsome, Xu, Svenning, Pereira, Law and Crowther2024). Higher economic costs of MHWs were evident, including US$7.5–8.5 billion recovery costs from Cyclone Gabrielle, fuelled by a MHW; US$1.4 billion loss from the closure of the Peruvian anchovy fishery following a species range shift (Figure 2); and ongoing closures or reduced quotas in North American fisheries following MHWs (Harrington et al., Reference Harrington, Dean, Awatere, Rosier, Queen, Gibson, Barnes, Zachariah, Philip, Kew, Koren, Pinto, Grieco, Vahlberg, Snigh, Heinrich, Thalheimer, Li, Stone and Otto2023; Smith et al., Reference Smith, Sen Gupta, Burrows, Filbee-Dexter, Hobday, Holbrook, Malan, Moore, Oliver, Thomsen, Wernberg, Zhao and Smale2025). A warmer ocean surface also reduces the uptake of carbon dioxide from the atmosphere: Li, Burger, et al. (Reference Li, Burger, Raible and Frölicher2024) estimate a global net reduction of 8% during MHWs over 1990–2019, reducing nature's mitigation of human carbon emissions.

Figure 2. The impacts of the exceptional marine heatwaves in 2023–2024 and the period of occurrence of the warmest sea surface temperature (relative to the seasonal normal) in the satellite record since 1985. Dataset: ESA Climate Change Initiative Sea Surface Temperature v3 (Embury et al., Reference Embury, Merchant, Good, Rayner, Høyer, Atkinson, Block, Alerskans, Pearson, Worsfold, McCarroll and Donlon2024). ‘Year of occurrence’ refers to the year of warmest sea surface temperature (relative to the seasonal average) in the satellite record since 1985.
Across 2023 and 2024, various impacts of MHWs were reported (Smith et al., Reference Smith, Sen Gupta, Burrows, Filbee-Dexter, Hobday, Holbrook, Malan, Moore, Oliver, Thomsen, Wernberg, Zhao and Smale2025). New research shows MHW-associated declines in foundation species like macroalgae, seagrass and corals in many coastal ecosystems globally (Smith et al., Reference Smith, Aubin, Burrows, Filbee-Dexter, Hobday, Holbrook, King, Moore, Gupta, Thomsen, Wernberg, Wilson and Smale2024), highlighted in Figure 2. In 2024, the fourth global coral bleaching event (i.e., a stress response whereby the symbiotic zooxanthellae which give corals their colour are lost due to thermal stress) was declared (Reimer et al., Reference Reimer, Peixoto, Davies, Traylor-Knowles, Short, Cabral-Tena, Burt, Pessoa, Banaszak, Winters, Moore, Schoepf, Kaullysing, Calderon-Aguilera, Wörheide, Harding, Munbodhe, Mayfield, Ainsworth and Voolstra2024). In the tropical Atlantic, where corals are considered more resilient to bleaching, massive bleaching events have occurred in response to increases in frequency and intensity of MHWs over the last two decades (Rodrigues, Neto, et al., Reference Rodrigues, Neto, Vieira and Longo2025). In the Mediterranean, MHWs worsened outbreaks of disease, causing mortality events in fish and shellfish (Kersting et al., Reference Kersting, García-Quintanilla, Quintano, Estensoro and Ortega-Villaizan2024; Nikolaou et al., Reference Nikolaou, Papadimitriou, Kiourani and Katsanevakis2024), and satellite observations identified shifts in the size and biomass of phytoplankton linked to MHWs in eastern boundary upwelling systems, in the western Baltic Sea and South Atlantic (Cahill et al., Reference Cahill, Chrysagi, Vortmeyer-Kley and Graewe2024; Rodrigues, Artana, et al., Reference Rodrigues, Artana, Neto, Frolicher, Keenlyside, Hobday, Burger, Bernardo and Araujo2025; Zhan et al., Reference Zhan, Feng, Zhang, Shen, Zhan and He2024).
The responses of marine species can be variable and often depend on where within a species' geographic range the MHW occurs, complicating efforts to predict and interpret biological impacts (Fredston et al., Reference Fredston, Cheung, Frolicher, Kitchel, Maureaud, Thorson, Auber, Merigot, Palacios-Abrantes, Palomares, Pecuchet, Shackell and Pinsky2023; Smith et al., Reference Smith, Aubin, Burrows, Filbee-Dexter, Hobday, Holbrook, King, Moore, Gupta, Thomsen, Wernberg, Wilson and Smale2024). Trophic models indicate that at the community scale, MHWs significantly reduce biomass across all consumer levels, with higher trophic levels most affected (Guibourd de Luzinais et al., Reference Guibourd de Luzinais, Gascuel, Reygondeau and Cheung2024), altering ecosystem structure and function (Gomes et al., Reference Gomes, Ruzicka, Crozier, Huff, Brodeur and Stewart2024). Some ‘wins’ were reported, with corals bred for heat tolerance demonstrating resistance to bleaching (Miller et al., Reference Miller, Mendoza Quiroz, Lachs, Banaszak, Chamberland, Guest, Gutting, Latijnhouwers, Sellares-Blasco, Virdis, Villalpando and Petersen2024), and conservation efforts showed some potential for preserving endangered species (Hobday et al., Reference Hobday, Spillman, Allnutt, Coleman, Bailleul, Blamey, Brodie, Chandrapavan, Hartog, Maynard, Mundy, Plaganyi, Seaborn, Smith and Stuart-Smith2024).
Widespread impacts driven by MHWs are occurring more often and more intensely than previously reported (Smith et al., Reference Smith, Aubin, Burrows, Filbee-Dexter, Hobday, Holbrook, King, Moore, Gupta, Thomsen, Wernberg, Wilson and Smale2024). Sharing of successful intervention strategies may reduce or delay impacts to some industries and ecosystem services supported by the oceans (Hobday et al., Reference Hobday, Burrows, Filbee-Dexter, Holbrook, Sen Gupta, Smale, Smith, Thomsen and Wernberg2023; Smith et al., Reference Smith, Sen Gupta, Burrows, Filbee-Dexter, Hobday, Holbrook, Malan, Moore, Oliver, Thomsen, Wernberg, Zhao and Smale2025). Ultimately, mitigating future ecological, economic and societal losses will depend on rapid measures to reduce GHG emissions and limit ocean warming (Frölicher et al., Reference Frölicher, Fischer and Gruber2018; Hoegh-Guldberg et al., Reference Hoegh-Guldberg, Skirving, Dove, Spady, Norrie, Geiger, Liu, De La Cour and Manzello2023; Smith et al., Reference Smith, Burrows, Hobday, King, Moore, Sen Gupta, Thomsen, Wernberg and Smale2023).
Insight 3. Permafrost and boreal forests show signs of strain, raising concerns about the global land carbon sink
While the fraction of anthropogenic GHG emissions absorbed by the global natural land carbon sink – whose magnitude partly determines Earth's contribution to offsetting anthropogenic emissions — has remained stable at around 30% (Friedlingstein et al., Reference Friedlingstein, O'Sullivan, Jones, Andrew, Hauck, Landschützer, Le Quéré, Li, Luijkx, Olsen, Peters, Peters, Pongratz, Schwingshackl, Sitch, Canadell, Ciais, Jackson, Alin and Zeng2025) on decadal time scales, signs of strain are emerging. In addition to the well-known long-term carbon loss from tropical systems due to deforestation and forest degradation (Gatti et al., Reference Gatti, Basso, Miller, Gloor, Gatti Domingues, Cassol, Tejada, Aragão, Nobre, Peters, Marani, Arai, Sanches, Corrêa, Anderson, Von Randow, Correia, Crispim and Neves2021, Carle et al., Reference Carle, Bauman, Evans, Coughlin, Binks, Ford, Bradford, Nicotra, Murphy and Meir2025), carbon stored in boreal forest and permafrost ecosystems also shows signs of strain. However, these signals are often driven by noisy disturbances linked to changing climatic and land-use stresses — disturbances whose long term effects on the carbon sink are still not fully understood. For example in 2023 significantly less carbon was absorbed by land ecosystems compared to the previous year, driven predominantly by drought and warming-related losses from tropical ecosystems and fire-related losses in boreal forests (Ke et al., Reference Ke, Ciais, Sitch, Li, Bastos, Liu, Xu, Gui, Bian, Goll, Xi, Li, O'Sullivan, de Souza, Friedlingstein and Chevallier2024). The decline adds to concerns that increasing trends in the drivers of carbon sink loss – including wildfires, droughts, heatwaves, and permafrost thaw – are weakening the natural land carbon sink and threaten to overwhelm possible growth gains from higher CO2 concentration in the near future. If the land sink weakens, a larger fraction of human emissions will remain in the atmosphere, meaning lower cumulative GHG emissions would lead to higher warming than previously estimated (Burton et al., Reference Burton, Kelley, Burke, Mathison, Jones, Betts, Robertson, Teixeira, Cardoso and Anderson2024). Here we will look at the evidence of short and long-term changes in the global natural carbon sink on land, with a focus on emerging vulnerability in northern, extratropical land ecosystems.
The Global Carbon Project estimate of the natural land carbon sink (excluding emissions from land use and land-use change) in 2023 was 2.3 ± 1 GtC/yr, well below the 2022 La Niña-induced strong sink of 3.9 ± 1 GtC/yr, or the 2014–2023 average of 3.2 ± 0.9 GtC/yr (Friedlingstein et al., Reference Friedlingstein, O'Sullivan, Jones, Andrew, Hauck, Landschützer, Le Quéré, Li, Luijkx, Olsen, Peters, Peters, Pongratz, Schwingshackl, Sitch, Canadell, Ciais, Jackson, Alin and Zeng2025). This decline occurred in a year with strong El Niño conditions and record-breaking high temperatures – the global average was 1.48°C above pre-industrial levels – and reflects a strong negative response of terrestrial ecosystems to extreme events (Byrne et al., Reference Byrne, Liu, Bowman, Pascolini-Campbell, Chatterjee, Pandey, Miyazaki, van der Werf, Wunch, Wennberg, Roehl and Sinha2024; Ke et al., Reference Ke, Ciais, Sitch, Li, Bastos, Liu, Xu, Gui, Bian, Goll, Xi, Li, O'Sullivan, de Souza, Friedlingstein and Chevallier2024). However, comparing changes in the land carbon sink across studies is difficult due to variations in model ensembles, assumptions, and included processes. For example, the notably lower land carbon sink value reported by Ke et al. (Reference Ke, Ciais, Sitch, Li, Bastos, Liu, Xu, Gui, Bian, Goll, Xi, Li, O'Sullivan, de Souza, Friedlingstein and Chevallier2024) partly results from including land-use emissions of about 1 ± 0.7 GtC/yr in 2023, which lowered the overall mean land carbon sink compared to Friedlingstein et al. (Reference Friedlingstein, O'Sullivan, Jones, Andrew, Hauck, Landschützer, Le Quéré, Li, Luijkx, Olsen, Peters, Peters, Pongratz, Schwingshackl, Sitch, Canadell, Ciais, Jackson, Alin and Zeng2025), alongside differences in vegetation model ensembles. After accounting for land-use emissions and uncertainty ranges, the two studies' results roughly align.
Interannual variability in the land carbon sink is expected, with large drops in the land carbon sink having occurred in the past (Figure 3A), usually in conjunction with El Niño years, followed by a recovery. Indeed, the global natural land sink rebounded somewhat in early 2024 (Friedlingstein et al., Reference Friedlingstein, O'Sullivan, Jones, Andrew, Hauck, Landschützer, Le Quéré, Li, Luijkx, Olsen, Peters, Peters, Pongratz, Schwingshackl, Sitch, Canadell, Ciais, Jackson, Alin and Zeng2025; Ke et al., Reference Ke, Ciais, Sitch, Li, Bastos, Liu, Xu, Gui, Bian, Goll, Xi, Li, O'Sullivan, de Souza, Friedlingstein and Chevallier2024). Whether a long-term decline is underway may depend on whether the record warmth and widespread extremes of 2023–24 reflect typical variability layered on long-term warming, or mark a deeper shift in the climate system (the confluence of factors, in addition to rising atmospheric GHG concentrations, leading to the anomalous warmth in 2023–24 are discussed in Insight 1).

Figure 3. Temporal evolution of the global land carbon sink and associated uncertainties from 1960 to 2023 and recent changes in live biomass in northern ecosystems. (A) Global CO2 flux (GtC/yr) is shown. Positive values indicate an increase in the land carbon sink. The dark line represents the annual mean net fluxes, with the shaded area denoting ± 1 standard deviation uncertainty. The red dot shows the projected land carbon sink for 2024 with associated uncertainty. Data are from the Global Carbon Budget 2024 (Friedlingstein et al., Reference Friedlingstein, O'Sullivan, Jones, Andrew, Hauck, Landschützer, Le Quéré, Li, Luijkx, Olsen, Peters, Peters, Pongratz, Schwingshackl, Sitch, Canadell, Ciais, Jackson, Alin and Zeng2025). (B) Annual variations in live biomass carbon stocks, expressed as the difference from 2010 values in northern ecosystems. Data available from X. Li et al. (Reference Li, Ciais, Fensholt, Chave, Sitch, Canadell, Brandt, Fan, Xiao, Tao, Wang, Albergel, Yang, Frappart, Wang, Bastos, Maisongrande, Qin, Xing and Wigneron2025).
In 2023, above average amounts of carbon were released to the atmosphere from multiple terrestrial biomes, but with different drivers and underlying temporal dynamics. The largest carbon release came from tropical ecosystems, which declined by 58% (from 2.8 GtC/yr to 1.2 GtC/yr) between 2022 and 2023 (Friedlingstein et al., Reference Friedlingstein, O'Sullivan, Jones, Andrew, Hauck, Landschützer, Le Quéré, Li, Luijkx, Olsen, Peters, Peters, Pongratz, Schwingshackl, Sitch, Canadell, Ciais, Jackson, Alin and Zeng2025). This decline was driven primarily by El-Nino-influenced warming and drying, leading to reduced vegetation productivity in water-limited Sahel and southern Africa (Botía et al., Reference Botía, Dias-Junior, Komiya, van der Woude, Terristi, de Kok, Koren, van Asperen, Jones, D'Oliveira, Weber, Marques-Filho, Toro, Araújo, Lavric, Walter, Li, Wigneron, Stocker and Bastos2025; Gui et al., Reference Gui, Wang, Jin, Wang, Deng, Li, Tian, Wang, Chen, Wang and Piao2024), as well as reduced vegetation carbon uptake in the Amazon region (Botía et al., Reference Botía, Dias-Junior, Komiya, van der Woude, Terristi, de Kok, Koren, van Asperen, Jones, D'Oliveira, Weber, Marques-Filho, Toro, Araújo, Lavric, Walter, Li, Wigneron, Stocker and Bastos2025). The estimate of the tropical land carbon sink may be affected by misrepresentation of phosphorus limitation in many vegetation models, which would imply that the true decline was even larger (O'Sullivan et al., Reference O'Sullivan, Sitch, Friedlingstein, Luijkx, Peters, Rosan, Arneth, Arora, Chandra, Chevallier, Ciais, Falk, Feng, Gasser, Houghton, Jain, Kato, Kennedy, Knauer and Zaehle2024).
Providing equivalent estimates for northern extra-tropical ecosystems is particularly challenging for 2023 because of the dominant influence of extreme wildfire emissions (Jones, Kelley, et al. Reference Jones, Kelley, Burton, Di Giuseppe, Barbosa, Brambleby, Hartley, Lombardi, Mataveli, McNorton, Spuler, Wessel, Abatzoglou, Anderson, Andela, Archibald, Armenteras, Burke, Carmenta and Xanthopoulos2024; Byrne et al., Reference Byrne, Liu, Bowman, Pascolini-Campbell, Chatterjee, Pandey, Miyazaki, van der Werf, Wunch, Wennberg, Roehl and Sinha2024). Current vegetation models used to produce the estimates, systematically underrepresent such intense high-latitude fire seasons, (Hantson et al., Reference Hantson, Arneth, Harrison, Kelley, Prentice, Rabin, Archibald, Mouillot, Arnold, Artaxo, Bachelet, Ciais, Forrest, Friedlingstein, Hickler, Kaplan, Kloster, Knorr, Lasslop and Yue2016; Hantson, Kelley, et al., Reference Hantson, Kelley, Arneth, Harrison, Archibald, Bachelet, Forrest, Hickler, Lasslop, Li, Mangeon, Melton, Nieradzik, Rabin, Prentice, Sheehan, Sitch, Teckentrup, Voulgarakis and Yue2020) meaning that model-based estimates would have failed to capture the unusually large carbon release from the 2023 Canadian fires. These models have also been shown to systematically underestimate the northern land carbon sink by ∼1 GtC (O'Sullivan et al., Reference O'Sullivan, Sitch, Friedlingstein, Luijkx, Peters, Rosan, Arneth, Arora, Chandra, Chevallier, Ciais, Falk, Feng, Gasser, Houghton, Jain, Kato, Kennedy, Knauer and Zaehle2024), not least due to misrepresentation of regrowth rates after fire. Nonetheless, observational evidence points to significant release of carbon from wildfires in the Canadian boreal forests in 2023 (0.65 ± 0.08 GtC) (Byrne et al., Reference Byrne, Liu, Bowman, Pascolini-Campbell, Chatterjee, Pandey, Miyazaki, van der Werf, Wunch, Wennberg, Roehl and Sinha2024; Friedlingstein et al., Reference Friedlingstein, O'Sullivan, Jones, Andrew, Hauck, Landschützer, Le Quéré, Li, Luijkx, Olsen, Peters, Peters, Pongratz, Schwingshackl, Sitch, Canadell, Ciais, Jackson, Alin and Zeng2025), which contributed to record-breaking fire emissions in boreal forests globally in 2023 (Jones, Kelley, et al., 2024). These disturbance-driven fluxes, which have also emerged during recent Arctic fire seasons, make it difficult to constrain northern land-sink behaviour during years with exceptional high-latitude fire activity.
Although it is difficult to quantify the net northern extra-tropical land carbon sink in any single year, long-term assessments and evidence from individual disturbance processes suggest the land carbon sink in northern extra-tropical ecosystems – long considered more resilient to climate change than tropical forests – is showing signs of weakening. Although still a net carbon sink, recent studies using both empirical and model-based approaches indicate a longer-term flattening off or even decline over the past few decades (Friedlingstein et al., Reference Friedlingstein, O'Sullivan, Jones, Andrew, Hauck, Landschützer, Le Quéré, Li, Luijkx, Olsen, Peters, Peters, Pongratz, Schwingshackl, Sitch, Canadell, Ciais, Jackson, Alin and Zeng2025; Ke et al., Reference Ke, Ciais, Sitch, Li, Bastos, Liu, Xu, Gui, Bian, Goll, Xi, Li, O'Sullivan, de Souza, Friedlingstein and Chevallier2024; Virkkala et al., Reference Virkkala, Rogers, Watts, Arndt, Potter, Wargowsky, Schuur, See, Mauritz, Boike, Bret-Harte, Burke, Burrell, Chae, Chatterjee, Chevallier, Christensen, Commane, Dolman and Natali2025). In the most recent decade, increasing drought-related tree mortality, insect outbreaks and wildfires have driven a shift from growth to decline in live carbon biomass (X. Li et al., Reference Li, Ciais, Fensholt, Chave, Sitch, Canadell, Brandt, Fan, Xiao, Tao, Wang, Albergel, Yang, Frappart, Wang, Bastos, Maisongrande, Qin, Xing and Wigneron2025) (a significant component of the land carbon sink; see Figure 3B) in northern extra-tropical land ecosystems, even without considering changes that occurred in 2023. This trend shift may be a sign of accelerating carbon transfer from vegetation to the atmosphere (X. Li et al., Reference Li, Ciais, Fensholt, Chave, Sitch, Canadell, Brandt, Fan, Xiao, Tao, Wang, Albergel, Yang, Frappart, Wang, Bastos, Maisongrande, Qin, Xing and Wigneron2025) and an indication of growing instability in northern extra-tropical land ecosystems (Romanou et al., Reference Romanou, Hegerl, Seneviratne, Abis, Bastos, Conversi, Landolfi, Kim, Lerner, Mekus, Otto-Bliesner, Pausata, Pinto and Suarez-Guiterrez2024).
Carbon uptake in boreal forests – one key biome within northern extra-topical land ecosystems – has declined significantly in recent decades due to fires, as well as insect outbreaks, drought and abnormal heat-induced mortality (Ramage et al., Reference Ramage, Kuhn, Virkkala, Voigt, Marushchak, Bastos, Biasi, Canadell, Ciais, López-Blanco, Natali, Olefeldt, Potter, Poulter, Rogers, Schuur, Treat, Turetsky, Watts and Hugelius2024; Virkkala et al., Reference Virkkala, Rogers, Watts, Arndt, Potter, Wargowsky, Schuur, See, Mauritz, Boike, Bret-Harte, Burke, Burrell, Chae, Chatterjee, Chevallier, Christensen, Commane, Dolman and Natali2025; Jones et al., Reference Jones, Veraverbeke, Andela, Doerr, Kolden, Mataveli, Pettinari, Le Quéré, Rosan, Van Der Werf, Van Wees and Abatzoglou2024). When additionally including emissions from land-use change and management, average annual carbon uptake in boreal forests – including in live biomass, soils, dead wood and litter – decreased by 36% between the decade 2010 and 2019 and the previous two decades (Pan et al., Reference Pan, Birdsey, Phillips, Houghton, Fang, Kauppi, Keith, Kurz, Ito, Lewis, Nabuurs, Shvidenko, Hashimoto, Lerink, Schepaschenko, Castanho and Murdiyarso2024). At the global level, this large loss was compensated by increases in carbon sinks in tropical regrowth and temperate forests, keeping the global forest carbon sink stable on average (Pan et al., Reference Pan, Birdsey, Phillips, Houghton, Fang, Kauppi, Keith, Kurz, Ito, Lewis, Nabuurs, Shvidenko, Hashimoto, Lerink, Schepaschenko, Castanho and Murdiyarso2024).
Thirty percent of the Arctic-boreal zone as a whole, which covers both the boreal biome and the treeless tundra, has become a net source of CO2. Furthermore, evidence suggests that the Tundra biome alone is no longer a net CO2 sink (Ramage et al., Reference Ramage, Kuhn, Virkkala, Voigt, Marushchak, Bastos, Biasi, Canadell, Ciais, López-Blanco, Natali, Olefeldt, Potter, Poulter, Rogers, Schuur, Treat, Turetsky, Watts and Hugelius2024; Virkkala et al., Reference Virkkala, Rogers, Watts, Arndt, Potter, Wargowsky, Schuur, See, Mauritz, Boike, Bret-Harte, Burke, Burrell, Chae, Chatterjee, Chevallier, Christensen, Commane, Dolman and Natali2025). Whether or not these regions have become a net carbon sink would require a full GHG inventory (including CO₂, CH4, and N₂O), which is not currently available. However, for the northern permafrost region, which covers ca. 65% of the Arctic-boreal zone, a full GHG inventory allows for calculation of the land carbon sink. Characterised by perennially frozen soils and home to Earth's largest soil carbon pool, its carbon uptake capacity is undergoing profound, warming-induced changes. Having acted as a carbon sink for decades, the most recent budgets identify the northern permafrost region as a net carbon source of 0.14 Gt C/yr (−0.51, 0.83; 95% confidence interval) over short decadal time scales (2000-2020) (Hugelius et al., Reference Hugelius, Ramage, Burke, Chatterjee, Smallman, Aalto, Bastos, Biasi, Canadell, Chandra, Chevallier, Ciais, Chang, Feng, Jones, Kleinen, Kuhn, Lauerwald, Liu and Zheng2024; Ramage et al., Reference Ramage, Kuhn, Virkkala, Voigt, Marushchak, Bastos, Biasi, Canadell, Ciais, López-Blanco, Natali, Olefeldt, Potter, Poulter, Rogers, Schuur, Treat, Turetsky, Watts and Hugelius2024). This shift is partly due to emissions from inland waters, fires, and abrupt permafrost thaw (Ramage et al., Reference Ramage, Kuhn, Virkkala, Voigt, Marushchak, Bastos, Biasi, Canadell, Ciais, López-Blanco, Natali, Olefeldt, Potter, Poulter, Rogers, Schuur, Treat, Turetsky, Watts and Hugelius2024; Virkkala et al., Reference Virkkala, Rogers, Watts, Arndt, Potter, Wargowsky, Schuur, See, Mauritz, Boike, Bret-Harte, Burke, Burrell, Chae, Chatterjee, Chevallier, Christensen, Commane, Dolman and Natali2025).
Understanding the long-term fate of the land carbon sink, in particular in northern extra-tropical ecosystems, remains a challenge. Much depends on the impact of extreme events on the land carbon sink in general. While additional emissions from wildfires – not least in the boreal region (Corning et al. Reference Corning, Krasovskiy, Kiparisov, San Pedro, Viana and Kraxner2024) – are expected to reach up to 5% of the remaining carbon budget for 2°C (Burton et al., Reference Burton, Kelley, Burke, Mathison, Jones, Betts, Robertson, Teixeira, Cardoso and Anderson2024), aerosol emissions from fires may indeed reduce future warming (Blanchard-Wrigglesworth et al., Reference Blanchard-Wrigglesworth, DeRepentigny and Frierson2025). Furthermore, the amount of carbon remaining in the atmosphere or reabsorbed by the land surface after events like fires and droughts depends on the pace and extent of recovery, which remain uncertain (Hamilton et al., Reference Hamilton, Kasoar, Bergas-Massó, Dalmonech, Hantson, Lasslop, Voulgarakis and Wells2024; Martínez-García et al., Reference Martínez-García, Nilsson, Laudon, Lundmark, Fransson, Wallerman and Peichl2024; O'Sullivan et al., Reference O'Sullivan, Sitch, Friedlingstein, Luijkx, Peters, Rosan, Arneth, Arora, Chandra, Chevallier, Ciais, Falk, Feng, Gasser, Houghton, Jain, Kato, Kennedy, Knauer and Zaehle2024).
Because of, and not despite these uncertainties, as global temperatures continue to rise, the capacity of land ecosystems to buffer climate change cannot be taken for granted. Strengthening this understanding is not just a scientific priority – it provides a critical foundation for credible climate policy.
Insight 4. Climate change and biodiversity loss reinforce one another
Climate change and biodiversity loss are two of the most pressing and interlinked environmental challenges that humanity is facing (Pfenning-Butterworth et al., Reference Pfenning-Butterworth, Buckley, Drake, Farner, Farrell, Gehman, Mordecai, Stephens, Gittleman and Davies2024; Pörtner et al., Reference Pörtner, Scholes, Arneth, Barnes, Burrows, Diamond, Duarte, Kiessling, Leadley, Managi, McElwee, Midgley, Ngo, Obura, Pascual, Sankaran, Shin and Val2023). Multiple studies have demonstrated the potential impact of climate change on biodiversity from local to global scales, with 3–6 million (or more) animal and plant species threatened, even under intermediate climate change scenarios (Wiens & Zelinka, Reference Wiens and Zelinka2024). However, increasing evidence suggests that a loss of biodiversity also impacts climate change, thereby contributing to a destabilising feedback directly impacting global climate stability. Experimental and observational studies have consistently found that higher plant diversity on lands can increase ecosystem functioning, including carbon storage, and these effects grow stronger over time (see Table 1 for mechanisms; (O'Connor et al., Reference O'Connor, Gonzalez, Byrnes, Cardinale, Duffy, Gamfeldt, Griffin, Hooper, Hungate, Paquette, Thompson, Dee and Dolan2017; S. S. Wang et al., Reference Wang, Isbell, Deng, Hong, Dee, Thompson and Loreau2021)).
Table 1. Mechanisms behind the biodiversity-carbon storage relationship

Because higher plant diversity leads to greater biomass within a place over time, loss of plant diversity from climate and land-use change can lead to biomass stock loss, and therefore carbon emissions (Lange et al., Reference Lange, Eisenhauer, Sierra, Bessler, Engels, Griffiths, Mellado-Vázquez, Malik, Roy, Scheu, Steinbeiss, Thomson, Trumbore and Gleixner2015; Mori et al., Reference Mori, Dee, Gonzalez, Ohashi, Cowles, Wright, Loreau, Hautier, Newbold, Reich, Matsui, Takeuchi, Okada, Seidl and Isbell2021). Weiskopf et al. (Reference Weiskopf, Isbell, Arce-Plata, Di Marco, Harfoot, Johnson, Lerman, Miller, Morelli, Mori, Weng and Ferrier2024) found that projected global plant species loss could lead to the emission of 7-145 PgC in the coming decades (Figure 4). Although the uncertainty range is large, the high-end estimates constitute a substantial portion of the remaining carbon budget before warming exceeds 1.5 or 2°C (Canadell et al., Reference Canadell, Monteiro, Costa, Cotrim da Cunha, Cox, Eliseev, Henson, Ishii, Jaccard, Koven, Lohila, Patra, Piao, Rogelj, Syampungani, Zaehle, Zickfe, Masson-Delmotte, Zhai, Pirani, Connors, Péan, Berger, Caud, Chen, Goldfarb, Gomis, Huang, Leitzell, Lonnoy, Matthews, Maycock, Waterfield, Yelekçi, Yu and Zhou2023). Similarly, Mori et al. (Reference Mori, Dee, Gonzalez, Ohashi, Cowles, Wright, Loreau, Hautier, Newbold, Reich, Matsui, Takeuchi, Okada, Seidl and Isbell2021) found that conserving tree diversity through climate change mitigation could correspond to 2–3 Gt C per year in reduced emissions.

Figure 4. Additional plant diversity loss and resulting carbon loss, under a very high emissions scenario. Long-term loss of vascular plant species richness due to climate change and land use change, projected by 2050 (A), expressed as additional percentage loss under a high emissions scenario (RCP8.5) relative to a low emissions scenario (RCP2.6). Reductions in vegetation carbon within the remaining habitat, attributable to plant biodiversity loss (B), expressed as additional carbon loss [kg/m2] under high emissions scenario (RCP8.5) relative to a low emissions scenario (RCP2.6). Adapted from Weiskopf et al. (Reference Weiskopf, Isbell, Arce-Plata, Di Marco, Harfoot, Johnson, Lerman, Miller, Morelli, Mori, Weng and Ferrier2024).
Although the role of plant diversity on ecosystem functioning is well established, the strength of the relationship can vary across biomes and environmental conditions. Large-scale analyses, for example, have shown stronger biodiversity-productivity relationships in less productive ecosystems (García-Palacios et al., Reference García-Palacios, Gross, Gaitán and Maestre2018; Liang et al., Reference Liang, Crowther, Picard, Wiser, Zhou, Alberti, Schulze, McGuire, Bozzato, Pretzsch, De-miguel, Paquette, Hérault, Scherer-Lorenzen, Barrett, Glick, Hengeveld, Nabuurs, Pfautsch and Reich2016; Paquette & Messier, Reference Paquette and Messier2011). Similarly, Spohn et al. (Reference Spohn, Bagchi, Biederman, Borer, Bråthen, Bugalho, Caldeira, Catford, Collins, Eisenhauer, Hagenah, Haider, Hautier, Knops, Koerner, Laanisto, Lekberg, Martina, Martinson and Yahdjian2023) found that the effects of plant diversity on soil organic carbon storage were stronger at drier sites. To reduce uncertainties regarding carbon release associated with biodiversity loss, further research across distinct biomes is needed to clarify the ecological mechanisms underlying variations in the biodiversity–carbon storage relationship along environmental gradients and differences in species and plant functional composition.
As an example, while tree diversity can enhance carbon sequestration and carbon retention in agroforestry systems (Ma et al., Reference Ma, Chen, Bork, Carlyle and Chang2020), it remains less clear if increasing plant diversity within cropland agroecosystems can have a similar effect. A recent study that evaluated a large field trial that manipulated plant diversity by combining undersown species with a cereal crop (i.e., barley) showed that increasing plant diversity within agroecosystems can also increase the carbon retention potential in soils (Domeignoz-Horta et al., Reference Domeignoz-Horta, Cappelli, Shrestha, Gerin, Lohila, Heinonsalo, Nelson, Kahmen, Duan, Sebag, Verrecchia and Laine2024), without compromising productivity. This confirms previous studies suggesting that manipulating plant diversity can enhance plant productivity and positively influence the associations between microorganisms, increasing microbial growth efficiency, which is considered a driver of soil carbon storage (Lange et al., Reference Lange, Eisenhauer, Sierra, Bessler, Engels, Griffiths, Mellado-Vázquez, Malik, Roy, Scheu, Steinbeiss, Thomson, Trumbore and Gleixner2015; Tao et al., Reference Tao, Huang, Hungate, Manzoni, Frey, Schmidt, Reichstein, Carvalhais, Ciais, Jiang, Lehmann, Wang, Houlton, Ahrens, Mishra, Hugelius, Hocking, Lu, Shi and Luo2023).
While uncertainties exist, plant–animal interactions and ecosystem functions, for instance, through trophic chains, can potentially alter vegetation structure and plant species composition, which in turn can affect above and belowground biomass (Back et al., Reference Back, Pérez-Postigo, Geitner and Arneth2025; Bello et al., Reference Bello, Crowther, Ramos, Morán-López, Pizo and Dent2024; Brodie et al., Reference Brodie, Bello, Emer, Galetti, Luskin, Osuri, Peres, Stoll, Villar and López2025; Török et al., Reference Török, Bullock, Jiménez-Alfaro and Sonkoly2020). For example, simulation studies show that elephants in African forests increase aboveground biomass by promoting high wood-density trees and dispersing seeds of large trees (Berzaghi et al., Reference Berzaghi, Bretagnolle, Durand-Bessart and Blake2023, Reference Berzaghi, Longo, Ciais, Blake, Bretagnolle, Vieira, Scaranello, Scarascia-Mugnozza and Doughty2019), whereas in African savannas, remote sensing and ground experiments indicate that reduced herbivores resulted in higher biomass (Back et al., Reference Back, Pérez-Postigo, Geitner and Arneth2025). In tropical systems, defaunation could reduce carbon storage up to 26%, primarily driven by population declines in animal-dispersed tree species (Brodie et al., Reference Brodie, Bello, Emer, Galetti, Luskin, Osuri, Peres, Stoll, Villar and López2025). In the Brazilian Atlantic Forest, a study quantified that frugivores can potentially enhance carbon recovery in fragmented forest landscapes when at least 40% forest cover remains (Bello et al., Reference Bello, Crowther, Ramos, Morán-López, Pizo and Dent2024). Climate change may disproportionately affect specialised guilds, such as frugivores, especially in the tropics (Mendoza & Araújo, Reference Mendoza and Araújo2025). Independent of these species interactions, evidence demonstrating the role of terrestrial animals as contributors to climate solutions is limited and remains contested (Duvall et al., Reference Duvall, le Roux, Pearson, Roman, Malhi and Abraham2024).
Animals can also impact carbon storage in the oceans. For example, due to their large size, whales can sequester carbon as biomass, which then sinks to the ocean floor after death, promoting carbon sequestration (Durfort et al., Reference Durfort, Mariani, Tulloch, Savoca, Troussellier and Mouillot2022; Pearson et al., Reference Pearson, Savoca, Costa, Lomas, Molina, Pershing, Smith, Villaseñor-Derbez, Wing and Roman2024). The recovery of baleen whale populations and their nutrient recycling services could enhance productivity and help restore ecosystem functions lost during 20th-century whaling (Savoca et al., Reference Savoca, Czapanskiy, Kahane-Rapport, Gough, Fahlbusch, Bierlich, Segre, Di Clemente, Penry, Wiley, Calambokidis, Nowacek, Johnston, Pyenson, Friedlaender, Hazen and Goldbogen2021). However, the carbon benefits associated with this recovery are increasingly threatened by climate change (Durfort et al., Reference Durfort, Mariani, Tulloch, Savoca, Troussellier and Mouillot2022; Tulloch et al., Reference Tulloch, Plagányi, Brown, Richardson and Matear2019).
While knowledge gaps remain, multidisciplinary and transdisciplinary approaches to understand the social, ecological, and physical processes involving biodiversity loss and climate change through carbon uptake, release and protection are critical in assessing the entire destabilising feedback mechanisms. Because of such feedback, meeting the targets of the Kunming–Montreal Global Biodiversity Framework can directly contribute to countries' Nationally Determined Contributions under the UNFCCC by reducing biodiversity-loss-driven carbon debt. Recognising and acting upon the interdependence between biodiversity conservation and restoration and effective climate mitigation would improve our ability to meet the climate and biodiversity policy targets. Despite the importance of biodiversity to store carbon, many existing natural climate-solution initiatives focus on ecosystem extent and cover, such as forested areas, rather than quality and composition (Mori, Reference Mori2020; Seddon et al., Reference Seddon, Turner, Berry, Chausson and Girardin2019), which could lower effectiveness as carbon sinks. Likewise, many conservation efforts focus on species, often charismatic ones, rather than maintaining species interactions and their role for ecosystem function (Tobias et al., Reference Tobias, Bullock, Dicks, Forester and Razgour2025). Maintaining and restoring diverse ecosystems while considering Indigenous and traditional knowledge and livelihoods can be effective actions towards achieving sustainability in the face of multiple global crises (Levis et al., Reference Levis, Flores, Campos-Silva, Peroni, Staal, Padgurschi, Dorshow, Moraes, Schmidt, Kuikuro, Kuikuro, Wauja, Kuikuro, Kuikuro, Fausto, Franchetto, Watling, Lima, Heckenberger and Clement2024; Razanatsoa et al., Reference Razanatsoa, Andriantsaralaza, Holmes, Rakotonarivo, Ratsifandrihamanana, Randriamiharisoa, Ravaloharimanitra, Ramahefamanana, Tahirinirainy and Raharimampionona2021) and therefore contributing to both biodiversity and climate agreements. Considering Indigenous Peoples and Local Communities can allow for location-specific and biome-specific analyses to inform local policies and contribute to global goals.
Insight 5. Accelerating depletion of groundwater
Groundwater is the second-largest freshwater resource after the polar caps and vital for almost half of the world's population. It anchors water and food security for millions of people, particularly in places with erratic rainfall patterns. Most of the pumped groundwater is used for irrigation, and the United Nations' Food and Agriculture Organization estimates a 30% increase in irrigated agriculture, especially in developing countries, in the coming decades. With the prediction of drier summers and less evenly distributed rainfall in many areas across the world, our reliance on groundwater as a stable resource will become even more important (UNESCO, 2022).
At the beginning of the 20th century, global groundwater withdrawal increased roughly proportional to population. However, since around 1960, groundwater withdrawal rates have tripled from approximately 312 km3/year to over 1,000 km3/year, while the global population has only increased by a factor of 2.6 (Wada & Bierkens, Reference Wada and Bierkens2014). This divergence indicates that factors beyond population growth, are increasingly contributing to groundwater use. Current projections suggest that food production must increase by 60% to feed an estimated 10 billion people by 2050, likely resulting in the expansion of irrigated land and a growing demand for groundwater (UNESCO, 2022).
Groundwater serves as a critical buffer against the impacts of climate change on agriculture, enabling the cultivation of water-demanding crops, such as alfalfa or avocados, with multiple harvests per year in arid regions like Arizona or Chile (Ford, Reference Ford2022; Sommaruga & Eldridge, Reference Sommaruga and Eldridge2021). However, Bhattarai et al. (Reference Bhattarai, Lobell, Balwinder-Singh, Kustas, Pokhrel and Jain2023) caution that using groundwater as an adaptation strategy to counteract warming temperatures may lead to increased irrigation withdrawals, thereby accelerating depletion rates in already stressed groundwater zones like those in India. While climate change plays a significant role in altering irrigation needs, socio-economic drivers such as the intensification of agriculture and changes in dietary preferences are at least equally important in driving long-term groundwater depletion trends. Consequently, groundwater availability will be a major challenge for Earth's growing and increasingly prosperous population in the 21st century.
Traditionally, our understanding of groundwater levels has been derived from drilled wells and the inspection of geological records, allowing a direct analysis of local properties (Ross, Reference Ross and Finkl1984).
The launch of the Gravity Recovery and Climate Experiment (GRACE) satellite mission in 2002 marked a turning point in global groundwater observations, enabling the visualisation of Groundwater Storage (GWS) anomalies based on changes in Earth's gravitational pull (Rodell & Famiglietti, Reference Rodell and Famiglietti2002). GRACE revealed significant groundwater declines across key agricultural zones worldwide with a monthly resolution (Li et al., Reference Li, Rodell, Kumar, Beaudoing, Getirana, Zaitchik, de Goncalves, Cossetin, Bhanja, Mukherjee, Tian, Tangdamrongsub, Long, Nanteza, Lee, Policelli, Goni, Daira, Bila and Bettadpur2019, Reference Li, Beaudoing and Rodell2020). For instance, between 2003 and 2024, groundwater declines of 0.26 cm/year and 1 cm/year were observed in the Central Valley and the southern High Plains of the USA, respectively. Notable declines of 0.66 cm/yr and 0.44 cm/yr were also observed in northwestern India and the North China Plain during the same period.
While GRACE has revolutionised global groundwater monitoring, recent studies have highlighted its limitations, including its coarse spatial resolution, a relatively short time period, and the difficulty distinguishing different water storage components (i.e., groundwater, soil moisture, and snow water storages) (Shamsudduha & Taylor, Reference Shamsudduha and Taylor2020). Bridging the gap between local groundwater measurements and remote-sensing observations is crucial for actionable management, especially in vulnerable regions with limited well observations, like sub-Saharan Africa. Here, groundwater supplies 75% of drinking water but faces climate-driven depletion (Kuang et al., Reference Kuang, Liu, Scanlon, Jiao, Jasechko, Lancia, Biskaborn, Wada, Li, Zeng, Guo, Yao, Gleeson, Nicot, Luo, Zou and Zheng2024). The International Groundwater Resources Assessment Centre (IGRAC), founded in 2003 by UNESCO and WMO, aims to consolidate global information on groundwater. However, national data-sharing policies and varying data formats have made compiling a global well database challenging.
Jasechko et al. (Reference Jasechko, Seybold, Perrone, Fan, Shamsudduha, Taylor, Fallatah and Kirchner2024) compiled over 170,000 groundwater-level time series from 40 countries, encompassing nearly 300 million observations. This dataset spans 40 years, allowing comparison of trends in 1693 aquifers worldwide between the early 21st century and the last two decades of the 20th century. Beyond confirming with in situ data that groundwater decline is indeed widespread, the analysis observed that in almost half of the declining aquifer systems worldwide, the pace at which groundwater levels drop accelerated relative to the decline during 1980–2000. Over 80% of all aquifers experiencing accelerated declines are located in cultivated drylands where precipitation has declined over the past decades, and agricultural land use has intensified (Box 2.1).
Recent work by Kuang et al. (Reference Kuang, Liu, Scanlon, Jiao, Jasechko, Lancia, Biskaborn, Wada, Li, Zeng, Guo, Yao, Gleeson, Nicot, Luo, Zou and Zheng2024) showed that groundwater is a dynamic and climate-sensitive component of the global water cycle, revealing critical shifts in its behaviour under anthropogenic pressures. Their study highlights that global groundwater recharge (12,000–17,000 km3/yr) is increasingly destabilised by climate change. These shifts in hydrological regimes disrupt groundwater recharge dynamics, particularly in snowmelt-dependent basins, where earlier peak flows reduce infiltration and exacerbate storage losses. Simultaneously, droughts diminish recharge rates, and intense rainfall often fails to percolate due to soil compaction or rapid runoff (Kuang et al. (Reference Kuang, Liu, Scanlon, Jiao, Jasechko, Lancia, Biskaborn, Wada, Li, Zeng, Guo, Yao, Gleeson, Nicot, Luo, Zou and Zheng2024). Many arid regions are projected to experience significant declines in recharge due to decreased precipitation and higher evapotranspiration (Figure 5A).

Figure 5. Impact of climate change on terrestrial water fluxes (A). Climate change directly and indirectly impacts groundwater resources: Precipitation (P) decreases in many regions around the world, while only a few will see a slight increase. Rising temperatures (T) under global warming affect evapotranspiration (ET), additionally reducing groundwater recharge (R) (Condon et al., Reference Condon, Atchley and Maxwell2020). As a consequence, groundwater levels decline. Additionally, climate change puts pressure on agricultural food production, leading to higher groundwater use for irrigation (W). Declining groundwater levels have severe consequences beyond water availability; (B) Deeper water tables lead to increased extraction costs for drilling wells (Jasechko & Perrone, Reference Jasechko and Perrone2021) and ultimately for wells running dry; (C) streams lose water to their surrounding aquifer, (D) saltwater intrudes into coastal aquifers, and land subsides (E).
Groundwater decline not only impacts water availability but also leaves empty pore space behind (Figure 5E). As a result, the land above subsides, which poses an imminent threat to both agricultural land (Haghshenas Haghighi & Motagh, Reference Haghshenas Haghighi and Motagh2024) and urban communities in megacities such as Bangkok, Shanghai, Jakarta, or Manila (Ao et al., Reference Ao, Hu, Tao, Hu, Wang, Li, Wang, Hu, Liang, Xiao, Yusup, Qi, Ran, Fang, Chang, Zeng, Fu, Xue, Wang and Fang2024; Wu et al., Reference Wu, Wei and D'Hondt2022) (see Box 2.2). While land subsidence is by far the largest socio-economic threat associated with groundwater decline (Ao et al., Reference Ao, Hu, Tao, Hu, Wang, Li, Wang, Hu, Liang, Xiao, Yusup, Qi, Ran, Fang, Chang, Zeng, Fu, Xue, Wang and Fang2024), coastal regions are additionally threatened by seawater intrusion into coastal aquifers (Jasechko et al., Reference Jasechko, Perrone, Seybold, Fan and Kirchner2020; Seibert et al., Reference Seibert, Greskowiak, Oude Essink and Massmann2024) (Figure 5D). Small islands are particularly vulnerable, as freshwater lenses floating above seawater can easily become salinised due to over-pumping, reduced recharge, and storm surges – all of which may intensify with climate change (Bakker et al., Reference Bakker, Miller, Morgan and Werner2017). Once an aquifer is contaminated, it can take decades to replenish it with clean freshwater (Lu & Werner, Reference Lu and Werner2013).
While climate change and population growth are inevitable, declining groundwater levels often result from water wastage and unsustainable groundwater withdrawal, which can be mitigated through improved irrigation methods and better water management (Bierkens & Wada, Reference Bierkens and Wada2019). Kuang et al. (Reference Kuang, Liu, Scanlon, Jiao, Jasechko, Lancia, Biskaborn, Wada, Li, Zeng, Guo, Yao, Gleeson, Nicot, Luo, Zou and Zheng2024), for example, advocate for policies that address transboundary governance and Managed Aquifer Recharge (MAR), which currently offsets less than 10% of global extraction. This approach acknowledges the interdependence of groundwater, surface water, and the ecosystems that depend on them. Such integrated strategies are crucial for mitigating cascading impacts on biodiversity and human water security in an era of accelerating climate change. A decentralised water governance approach is often considered more effective due to its flexibility, adaptability, and ability to engage stakeholders while accounting for complex social-ecological systems (Box 2).
Sustainable groundwater futures can be achieved by urgent action through efficient irrigation, inclusive governance, and climate-resilient policies to balance human needs with ecosystem health in an increasingly water-stressed world. Long-term monitoring of groundwater resources and integrating stakeholders into groundwater sustainability plans and policy-making decisions are key to ensuring improved outcomes of sustainable groundwater management plans. For example, Perrone et al. (Reference Perrone, Rohde, Hammond Wagner, Anderson, Arthur, Atume, Brown, Esaki-Kua, Gonzalez Fernandez, Garvey, Heidel, Jones, Khosrowshahi Asl, Munill, Nelson, Ortiz-Partida and Remson2023) analysed 108 plans under California's Sustainable Groundwater Management Act, revealing that most plans fail to comprehensively include stakeholders, leaving many unprotected from groundwater depletion. However, when stakeholders were actively engaged, their needs were better addressed. This underscores the importance of groundwater resource monitoring, inclusive policy-making, and the integration of diverse stakeholders for the long-term sustainability of groundwater.
Box 2. Managing groundwater in the face of drought and decline
2.1 Droughts and Aquifers running dry:
• Places like California's Central Valley, the southern High Plains, and southeast Spain have seen severe and more frequent droughts in recent decades (Chen et al., Reference Chen, Brun, Buri, Fatichi, Gessler, McCarthy, Pellicciotti, Stocker and Karger2025). Some Ogallala Aquifer fringes have already run dry, and its southern part will have insufficient water for irrigation within the next 2 to 3 decades (Haacker et al., Reference Haacker, Kendall and Hyndman2016; Rodell et al., Reference Rodell, Famiglietti, Wiese, Reager, Beaudoing, Landerer and Lo2018).
2.2 Declining water levels leave subsiding land behind:
• Jakarta, for example, is the fastest-sinking capital, subsiding at several centimeters per year, almost an order of magnitude larger than the rate of sea-level rise (Oelsmann et al., Reference Oelsmann, Marcos, Passaro, Sanchez, Dettmering, Dangendorf and Seitz2024). Today, 40% of Jakarta already lies below sea level, exacerbating the threat of rising sea levels andincreasing its vulnerability to flooding. Sea level rise has mainly been seen as a result of melting pole caps, but ∼10–27% of sea level rise (0.82 ± 0.13 mm/yr by 2050) may be indirectly linked to groundwater depletion (Wada et al., Reference Wada, Lo, Yeh, Reager, Famiglietti, Wu and Tseng2016)
2.3 A sign of hope: Success stories of Integrated Management Policies and Strategies for Water Security:
A. China's groundwater restoration efforts have achieved remarkable progress following the implementation of the Regulations on Groundwater Management (2021), the country's first specialised administrative regulation in this domain. Guided by this policy, the Ministry of Water Resources and the Ministry of Natural Resources conducted a nationwide reassessment of overexploited groundwater zones, analysing data from 34,929 monitoring wells with contributions from over 2,000 experts. Results reveal a 51% reduction (88,300 km2) in severely overexploited areas compared to 2015, alongside a significant decrease in extraction volumes.
B. In Kansas, US, the Local Enhanced Management Areas (LEMAs) framework was established in 2012 to enable groundwater management districts (GMDs) to implement targeted water-use reductions in depleted zones of the Ogallala Aquifer. This approach has achieved withdrawal reductions of up to 35% in some areas while maintaining net farming profitability (Whittemore et al., Reference Whittemore, James and Butler2018).
C. In California, home to the critically depleted Central Valley aquifer, the Sustainable Groundwater Management Act (SGMA) was enacted in 2014 to address groundwater overdrafts and promote sustainable irrigation practices. This legislation empowers local agencies to form Groundwater Sustainability Agencies (GSAs) tasked with developing Groundwater Sustainability Plans (GSPs) that balance extraction and recharge, prevent undesirable outcomes such as land subsidence and water quality degradation, and ensure long-term water reliability.
D. India's participatory groundwater management program, Atal Bhujal Yojana (ABY) (Annexures in: Khanduja et al., Reference Khanduja, Chaturvedi, Jain and Bassi2023), promotes community-driven conservation across highly depleted states through decentralised governance, incentivised participation, and collaboration between state and grassroots institutions. The program has demonstrated some promising outcomes, including strengthened institutional capacity at the local level, active youth engagement, and increased awareness of sustainable agricultural practices. In recent years, some notable cases of increased adoption of micro-irrigation techniques and crop diversification have also been observed, reflecting growing momentum toward efficient groundwater use in agriculture.
Insight 6. Climate-driven increase in global dengue – observed and projected
Dengue fever, the most common mosquito-borne viral disease, has surged over the past 2 years to the largest global outbreak ever recorded, with 14.2 million cases reported in 2024 (WHO, 2025b). Dengue outbreaks do not occur with equal intensity in all world regions each year. This general increase is in part driven by climate change and thermal anomalies (Barcellos et al., Reference Barcellos, Matos, Lana and Lowe2024), which facilitate shifts in range, resulting in a net increase in favorable conditions for mosquitoes. Dengue or breakbone fever is caused by an RNA virus from the genus Flavivirus. It consists of four serotypes with limited cross-immunity, which means that people can get dengue up to four times. While an estimated 75–80% of first-time dengue cases are mild or asymptomatic (and thus underreported), subsequent dengue infections can increase the risk of more severe forms of dengue fever, including dengue hemorrhagic fever (DHF), which can be fatal. Climate change, in conjunction with urbanisation, population growth, and human mobility, is overwhelmingly creating more favorable conditions for mosquitoes, increasing the geographic range, seasonality, and intensity of dengue transmission (Childs et al., Reference Childs, Lyberger, Harris, Burke and Mordecai2025; de Souza & Weaver, Reference de Souza and Weaver2024), while few areas are seeing reductions in suitability (Ryan et al., Reference Ryan, Carlson, Mordecai and Johnson2019). About half of the world's population is now at risk of dengue, with an estimated 100–400 million infections occurring each year (WHO, 2025a). Mosquitoes that carry dengue virus can also carry Zika, chikungunya, and yellow fever viruses (Lim et al., Reference Lim, Shearer, Sewalk, Pigott, Clarke, Ghouse, Judge, Kang, Messina, Kraemer, Gaythorpe, de Souza, Nsoesie, Celone, Faria, Ryan, Rabe, Rojas, Hay and Brady2025).
Dengue fever projections indicate even steeper increases by 2050 and 2100 (Feng et al., Reference Feng, Ma, Qin, Zhao, Liu, Wang and Cheng2024; Messina et al., Reference Messina, Brady, Golding, Kraemer, Wint, Ray, Pigott, Shearer, Johnson, Earl, Marczak, Shirude, Davis Weaver, Gilbert, Velayudhan, Jones, Jaenisch, Scott, Reiner and Hay2019; Ryan et al., Reference Ryan, Carlson, Mordecai and Johnson2019). Dengue outbreaks are capable of overwhelming health-care systems and disrupting economies (Oliveira et al., Reference Oliveira, Itria and Lima2019; Paz-Bailey et al., Reference Paz-Bailey, Adams, Deen, Anderson and Katzelnick2024; Shepard et al., Reference Shepard, Undurraga, Halasa and Stanaway2016), making the mosquitoes that carry dengue important to control. Warmer weather facilitates the geographic and seasonal spread of the mosquito and the growth of the virus, and changing climatic conditions are affecting the transmission of many infectious diseases of public health concern, including dengue (Semenza & Paz, Reference Semenza and Paz2021; Semenza et al., Reference Semenza, Rocklöv and Ebi2022). Climatic suitability for the transmission of dengue by Aedes albopictus and Aedes aegypti increased by 46.3% and 10.7% respectively, between 1951–1960 and 2014–2023 (Figure 6) (Romanello et al., Reference Romanello, Walawender, Hsu, Moskeland, Palmeiro-Silva, Scamman, Ali, Ameli, Angelova, Ayeb-Karlsson, Basart, Beagley, Beggs, Blanco-Villafuerte, Cai, Callaghan, Campbell-Lendrum, Chambers, Chicmana-Zapata and Costello2024). A recent climate-health detection and attribution study suggested climate change was responsible for up to 40% of dengue cases in some countries in the Americas (Childs et al., Reference Childs, Lyberger, Harris, Burke and Mordecai2025).

Figure 6. Climate Suitability for dengue transmission (left; adopted from Romanello et al. (Reference Romanello, Walawender, Hsu, Moskeland, Palmeiro-Silva, Scamman, Ali, Ameli, Angelova, Ayeb-Karlsson, Basart, Beagley, Beggs, Blanco-Villafuerte, Cai, Callaghan, Campbell-Lendrum, Chambers, Chicmana-Zapata and Costello2024)). Global expansion and redistribution of dengue transmission risk (number of months of thermal transmission suitability) with climate change (adapted and modified to CMIP6 projections from Ryan et al. (Reference Ryan, Carlson, Mordecai and Johnson2019)).
Moreover, the official figure of reported cases in 2024 is an underestimation of the true global burden (WHO, 2025b). In the Americas, over 13 million cases were reported (PAHO, 2025), most cases were in Brazil, where 17 cities declared states of emergency. In the USA, there was a health alert announced with local transmission in California, Florida, and Texas, while Puerto Rico had a health emergency declared for dengue (CDC, 2025).
Beyond rising numbers, dengue's expansion involves shifts in transmission patterns and geography. Climate change and human activity have driven the redistribution of mosquito vectors, altering habitats and facilitating the spread of dengue, malaria, and Zika into previously unaffected areas (Abbasi, Reference Abbasi2025; Segala et al., Reference Segala, Guido, Stroffolini, Masini, Cattaneo, Moro, Motta, Gobbi, Nicastri, Vita, Iatta, Otranto, Locantore, Occa, Putoto, Saracino and Di Gennaro2025). Some Aedes species will fly over a kilometer to bite a human over another species (Gubler, Reference Gubler1998). Aedes aegypti, the primary dengue vector in the Americas, thrives in hotter climates and has expanded through tropical and subtropical regions. It is well adapted to human environments, breeding in small amounts of water, which makes it difficult to control. Aedes albopictus, the ‘Asian tiger mosquito’, has extended its range into temperate areas like Europe, aided by global trade and its ability to survive colder winters. It will bite during the daytime, becoming an issue in schoolyards. However, the mere presence of these mosquitoes does not immediately lead to new dengue cases. Further complicating responses is that there is often a lag between their introduction and sustained transmission, complicating public understanding and response efforts.
In Europe, climate is now the strongest predictor of arbovirus (i.e., those transmitted by arthropods, primarily mosquitoes and ticks) outbreaks, with hotter summers significantly increasing the risk, particularly in urban and semi-urban settings (Farooq et al., Reference Farooq, Segelmark, Rocklöv, Lillepold, Sewe, Briet and Semenza2025). The region has seen a steady rise in both imported and local dengue cases, with 2024 marking all-time highs – over 200 locally transmitted cases in Italy and 85 in France (Arulmukavarathan et al., Reference Arulmukavarathan, Gilio, Hedrich, Nicholas, Reuland, Sheikh, Staub, Trüb and Schlagenhauf2024). Since 2000, Europe has recorded more than 45,000 dengue cases, both imported and locally transmitted, highlighting its growing vulnerability (Hedrich et al., Reference Hedrich, Bekker-Nielsen Dunbar, Grobusch and Schlagenhauf2025). There have been 38 autochthonous dengue outbreaks (cases that were acquired locally) in the EU with a total of 579 cases (Farooq et al., Reference Farooq, Segelmark, Rocklöv, Lillepold, Sewe, Briet and Semenza2025).
Other places around the world are also experiencing dengue, where it was not present before. Nepal, in particular, observed cases across March–November in 2023, indicating more distributed peaks, with hotspots observed not limited to the city of Kathmandu, but across the country at different altitudes, suggesting ecological and climatic factors may no longer be effective barriers (Bhandari et al., Reference Bhandari, Blackburn and Ryan2024). The number of cases in Africa was nine times higher in 2023 than in 2019. In several of the countries reporting these increased cases, surveillance, monitoring, and control are further complicated by ongoing conflict, larger numbers of displaced persons, and climate factors (Mercy et al., Reference Mercy, Youm, Aliddeki, Faria, Kebede and Ndembi2024). Under-reporting of dengue is also likely, as cases may be misclassified as malaria in countries endemic for both (Mercy et al., Reference Mercy, Youm, Aliddeki, Faria, Kebede and Ndembi2024), not all countries have monitoring systems to track widespread outbreaks accurately, and countries where dengue is not common may not suspect dengue.
Dengue's spread is not inevitable. While mosquito control remains the cornerstone of intervention (notably Singapore's control measures to prevent mosquito larvae from growing), other approaches are being explored, including the use of Wolbachia bacteria to suppress dengue transmission in mosquitoes (Safaei et al., Reference Safaei, Derakhshan-sefidi and Karimi2025). However, concerns remain about the sustainability of these strategies, as with decreasing exposure to dengue, the susceptibility of the population increases, raising questions about their long-term reliability.
A variety of vector control methods have proven effective (Sebastianelli et al., Reference Sebastianelli, Spiller, Carmo, Wheeler, Nowakowski, Jacobson, Kim, Barlevi, Cordero, Colón-González, Lowe, Ullo and Schneider2024). Vaccines have been developed, but are not yet widespread or universally recommended, making surveillance and early-warning systems key components of prevention and intervention in a changing world. While climate change creates conditions conducive to transmission, global travel and trade also play key roles in introducing both mosquitoes and the virus to new regions (Harish et al., Reference Harish, Colón-González, Moreira, Gibb, Kraemer, Davis, Reiner, Pigott, Perkins, Weiss, Bogoch, Vazquez-Prokopec, Saide, Barbosa, Sabino, Khan, Faria, Hay, Correa-Morales and Brady2024). Travelers can unknowingly transport dengue to areas with susceptible mosquito populations, fueling outbreaks (Yan et al., Reference Yan, Mackay and Stone2024), as previously found in Florida, USA (F. K. Jones et al., Reference Jones, Morrison, Santiago, Rysava, Zimler, Heberlein, Kopp, Saunders, Baudin, Rico, Mejía-Echeverri, Taylor-Salmon, Hill, Breban, Vogels, Grubaugh, Paul, Michael, Johansson and Stanek2024). Surveillance systems that track infections in travelers (e.g., phone apps leveraging traveller self-reporting) have become valuable early-warning tools (Lovey et al., Reference Lovey, Hedrich, Grobusch, Bernhard and Schlagenhauf2024; Taylor-Salmon et al., Reference Taylor-Salmon, Hill, Paul, Koch, Breban, Chaguza, Sodeinde, Warren, Bunch, Cano, Cone, Eysoldt, Garcia, Gilles, Hagy, Heberlein, Jaber, Kassens, Colarusso and Grubaugh2024), especially for countries with weaker health monitoring. As the world faces the continued expansion of Aedes-transmitted diseases, a combination of robust public health interventions, innovative vector control strategies, and enhanced surveillance will help stay ahead of this growing threat.
Insight 7. Global labour productivity and income loss due to climate change
Estimates of the economic costs of climate change are crucial for informing decisions about mitigation and adaptation measures. These estimates can reveal important channels through which climate change can impact the economy, identify risks across regions, sectors, and demographics, as well as highlight issues related to justice and equity, and motivate emission mitigation.
A key insight of recent years is the prominent role of labour productivity as a channel through which climate change impacts the economy (Figure 7A,7B). While consistent definitions for heat stress that account for variables beyond temperature (e.g., humidity) are still emerging, there is a clear consensus that climate change will bring large increases in future exposure and impacts (Dasgupta et al., Reference Dasgupta, Robinson, Shayegh, Bosello, Park and Gosling2024). Additional global warming of 1°C is set to expose over 800 million people in tropical regions to unsafe levels of heat stress which would reduce working hours by 50% (Masuda et al., Reference Masuda, Parsons, Spector, Battisti, Castro, Erbaugh, Game, Garg, Kalmus, Kroeger, Mishra, Shindell, Tigchelaar, Wolff and Vargas Zeppetello2024). Such effects reduce the overall productivity and supply of labour to economic markets, with a recent review concluding that 3°C of warming would cause effective labour in high-exposure sectors across the entirety of the African and Asian continents to decline by 33% and 25%, respectively, with low-exposure sectors facing smaller but substantial effects (Dasgupta et al., Reference Dasgupta, Robinson, Shayegh, Bosello, Park and Gosling2024). High-exposure sectors are mainly those consisting of outdoor work such as agriculture and construction, where impacts are particularly large (Nelson et al., Reference Nelson, Vanos, Havenith, Jay, Ebi and Hijmans2024). Importantly, impacts on labour can then become amplified along supply chains. Sun et al. (Reference Sun, Zhu, Wang, Duan, Lu, Yin, Tan, Zhang, Zhao, Cai, Wang, Hu, Tao and Guan2024) found that by 2060, the indirect losses via global trade and supply chains would account for 12–43% of the expected global economic losses from heat stress, with different effects across regions and sectors. Importantly, there are large global inequalities to exposure of labour to heat extremes, with global trade enabling developed countries to benefit from imports produced in increasingly heat-exposed developing countries (Li et al., Reference Li, Meng, Geng, Tong, Gao, Yamano, Lim, Guilhoto, Uno and Chen2025).

Figure 7. Impacts of climate change on labour and global gross domestic product (GDP): projected loss of effective labour (combination of labour supply and productivity changes) under a 2oC (A) and 3oC (B) increase in global mean temperature relative to preindustrial levels (Dasgupta et al., Reference Dasgupta, Robinson, Shayegh, Bosello, Park and Gosling2024), and; range of impacts on global GDP at 2oC (C) and 3oC (D) of global warming from structural and statistical modeling estimates from the literature, measured in terms of annual percent global GDP loss relative to GDP without additional climate change (Morris et al., Reference Morris, Rose, Reilly, Gurgel, Paltsev and Schlosser2025).
Since labour is a major component of aggregate economic productivity, impacts of climate change on labour have serious consequences for the global economy and the loss of global incomes due to climate change. Recent studies have found that for a high-emissions scenario (RCP8.5), labour productivity loss from heat could result in annual global gross domestic product (GDP) losses of 1.4–2.6% (Dasgupta et al., Reference Dasgupta, Robinson, Shayegh, Bosello, Park and Gosling2024), and up to 2.9–4.5% annually if also accounting for health costs and supply chain disruptions due to climate impacts on labour (Sun et al., Reference Sun, Zhu, Wang, Duan, Lu, Yin, Tan, Zhang, Zhao, Cai, Wang, Hu, Tao and Guan2024). Mitigation to RCP2.6 or RCP1.9 levels could reduce the annual GDP reductions due to labour impacts to only 0.1–0.8% (Dasgupta et al. Reference Dasgupta, Robinson, Shayegh, Bosello, Park and Gosling2024, Sun et al., Reference Sun, Zhu, Wang, Duan, Lu, Yin, Tan, Zhang, Zhao, Cai, Wang, Hu, Tao and Guan2024).
While understanding of the important role of climate change impacts on labour productivity has improved in recent years, estimates of the aggregate economic impacts of climate change from all possible impact channels remain wide, although a consensus of negative impacts on global incomes is clear (Figure 7C, 7D) and important new developments have been made in recent years. First, it is increasingly clear that estimates vary based on the method employed, with a divergence between “structural” and “statistical” modeling approaches (Box 3) (Morris et al., Reference Morris, Rose, Reilly, Gurgel, Paltsev and Schlosser2025; Rose et al., Reference Rose, Diaz, Carleton, Drouet, Guivarch, Méjean, Piontek, Pörtner, Roberts, Tignor, Poloczanska, Mintenbeck, Alegría, Craig, Langsdorf, Löschke, Möller, Okem and Rama2022). Statistical approaches benefit from their ability to capture the aggregate effects of a range of sectoral impact mechanisms and their interactions, but they consequently provide less insight into the relative role of those mechanisms. Furthermore, their sensitivity to model specification and extrapolation of historical relationships into quite different potential futures have been sources of widespread debate. On the other hand, structural models offer mechanistic clarity by explicitly enumerating specific impact chains, but rely on model and parameter assumptions and struggle to capture all the relevant impact channels. These different approaches are therefore likely not directly comparable (Rose et al., Reference Rose, Diaz, Carleton, Drouet, Guivarch, Méjean, Piontek, Pörtner, Roberts, Tignor, Poloczanska, Mintenbeck, Alegría, Craig, Langsdorf, Löschke, Möller, Okem and Rama2022) and should be treated as different lines of evidence rather than as interchangeable substitutes. This finding is already spurring research efforts to better understand and reconcile differences in methods and thereby reduce uncertainties.
Furthermore,statistical estimates of aggregate economic impacts have undergone major revisions in recent years, which have typically increased estimates of the costs of climate change over time (Tol, Reference Tol2023). First, recent work has highlighted the role of additional climate hazards, including extremes and variability of temperature and precipitation (Callahan & Mankin, Reference Callahan and Mankin2022, Reference Callahan and Mankin2023; Kotz et al., Reference Kotz, Levermann and Wenz2022, Reference Kotz, Wenz, Stechemesser, Kalkuhl and Levermann2021; Waidelich et al., Reference Waidelich, Batibeniz, Rising, Kikstra and Seneviratne2024) in addition to only average temperatures. Second, a complementary research strand has highlighted the global nature of climate shocks, finding that incorporating metrics of global temperature into empirical work more than doubles estimates from prior findings (Bilal & Känzig, Reference Bilal and Känzig2024; Neal et al., Reference Neal, Newell and Pitman2025). Third, constraints on the persistence of impacts on economic growth have found at least partially persistent effects (Bastien-Olvera et al., Reference Bastien-Olvera, Conte, Dong, Briceno, Batker, Emmerling, Tavoni, Granella and Moore2024), resolving a source of prior discrepancies and supporting estimates of larger overall impacts.
While these insights have advanced the understanding of the economic impacts of climate change, there are some persistent knowledge gaps. Foremost is understanding the discrepancies in estimates from different methodological approaches. In particular, why structural models do not reproduce the impacts observed by statistical models in historical data, as discussed above. Relatedly, while advances have highlighted several key impact categories, such as heat stress and labour, other climate impacts have yet to be widely included, particularly climate extremes such as drought, tropical storms and wildfires. Similarly, the costs of impacts on non-market’ sectors (e.g., biodiversity, crime and conflict, migration) remain largely omitted due to challenges in their monetisation, despite some recent advances for ecosystem services (Bastien-Olvera et al., Reference Bastien-Olvera, Conte, Dong, Briceno, Batker, Emmerling, Tavoni, Granella and Moore2024). More attention to the effects of compounding climate hazards and their cascading effects across systems is also needed. Finally, the role of adaptation remains a large source of uncertainty, as statistically observed responses to weather may change under fundamentally different future socioeconomic and climate conditions. Evidence exists for successful adaptation against heat-related mortalities (Carleton et al., Reference Carleton, Jina, Delgado, Greenstone, Houser, Hsiang, Hultgren, Kopp, McCusker, Nath, Rising, Rode, Seo, Viaene, Yuan and Zhang2022), but other sectors show much less clear evidence of adaptation occurring historically (Burke & Emerick, Reference Burke and Emerick2016; Burke et al., Reference Burke, Zahid, Martins, Callahan, Lee, Avirmed, Heft-Neal, Kiang, Hsiang and Lobell2024; Callahan, Reference Callahan2025). A more concerted focus to understand and integrate adaptive responses is needed in both statistical and structural models to better understand the aggregate costs of climate change (Wei & Aaheim, Reference Wei and Aaheim2023).
The new insights over recent years on global labour productivity and income loss due to climate change strengthens the case for mitigation (Glanemann et al., Reference Glanemann, Willner and Levermann2020), can help direct the focus of adaptation efforts, and can help anticipate loss and damage (Callahan, Reference Callahan2025). Some important commonalities have arisen across approaches. First, heat impacts on labour are a critical impact channel, providing guidance for adaptation strategies. Second, advances in statistical approaches, particularly in accounting for further climate hazards and global effects, have increased estimates of the economic cost of climate change. Third, the economic costs of climate change vary substantially by region, sector and demographic, with a growing consensus that lower-income countries face the highest economic losses due to climate change, due to their higher dependence on climate-sensitive industries, lower adaptive capacity, and location in more vulnerable regions. Recognising these vulnerabilities will allow for the design of policies that not only mitigate economic losses, but also foster resilient, equitable systems capable of withstanding future climatic shocks. This is important for global policy discussions and action related to climate justice. Finally, domestic economies are impacted by climate change directly as well as indirectly via global trade effects driven by climate impacts that occur in other parts of the world. In a world that is interconnected by global supply chains and already experiencing a growing number of climate extreme events, it becomes increasingly important to design policy and business strategies toward proactive supply chain resilience and international cooperation to mitigate the economic impacts and address transboundary risks.
Box 3. History of estimating the aggregate economic impacts of climate change
Attempts to estimate the global aggregate economic impacts of climate change date back to the early 1990s when William Nordhaus pioneered the development of a “climate damage function” relating changes in global average temperature to dollars lost in the economy (Nordhaus, Reference Nordhaus1993). Within his structural climate-economic model (DICE), Nordhaus used a macroeconomic model component to add up estimates of damages from different climate impact categories, which were informed by existing studies and expert elicitation. He estimated a 1.33% loss in global output for 3°C of global average warming. Following estimates from DICE, similar cost-benefit integrated assessment models (IAMs) have found global GDP losses due to 3°C of warming in the range of −3% (net benefits) to 5% (e.g. Tol, Reference Tol2002; Rose et al., Reference Rose, Diaz and Blanford2017). Efforts to use more complex ‘structural’, or ‘process-based’, economic models, such as economy-wide computable general equilibrium (CGE) models, to estimate the economic impacts of climate change via different impact categories have found similar levels of global GDP loss (Dellink et al., Reference Dellink, Lanzi and Chateau2019; Kompas et al., Reference Kompas, Pham and Che2018; Roson & Mensbrugghe, Reference Roson and Mensbrugghe2012; Takakura et al., Reference Takakura, Fujimori, Hanasaki, Hasegawa, Hirabayashi, Honda, Iizumi, Kumano, Park, Shen, Takahashi, Tamura, Tanoue, Tsuchida, Yokoki, Zhou, Oki and Hijioka2019), though they include different subsets of climate impact channels. While inclusion of a more comprehensive set of impact channels in these models would increase estimates of aggregate economic climate impacts, inclusion of additional adaptive responses would offset some of those increases, and further research is needed along both of those dimensions.
Beginning in the early 2010s, an alternative approach emerged using statistical methods to estimate the impacts of climate change on aggregate economic output directly from historical data. These are commonly referred to as “statistical,” “econometric” or “empirical” estimates. An early effort (Dell et al., Reference Dell, Jones and Olken2012) used country-level data and found strong effects of warming on economic growth in poor nations. Subsequent studies with different approaches have offered new insights into the distribution and drivers of damages (Bilal & Känzig, Reference Bilal and Känzig2024; Burke et al., Reference Burke, Hsiang and Miguel2015, Reference Burke, Alampay Davis and Diffenbaugh2018; Kahn et al., Reference Kahn, Mohaddes, Ng, Pesaran, Raissi and Yang2021; Kalkuhl & Wenz, Reference Kalkuhl and Wenz2020; Neal et al., Reference Neal, Newell and Pitman2025; Pretis et al., Reference Pretis, Schwarz, Tang, Haustein and Allen2018). These approaches have typically found much larger estimates of the economic impacts of climate change compared to structural approaches, in some recent cases leading to very large impacts, for example of more than 30% global GDP losses with 2°C warming, and 50% with 3°C warming (Bilal & Känzig, Reference Bilal and Känzig2024; Burke et al., 2015, 2018; Neal et al., Reference Neal, Newell and Pitman2025).
Insight 8. Carbon dioxide removal needs to be safely and significantly scaled to tackle hard-to-abate emissions and climate risks
Achieving the Paris Agreement's climate objectives requires scaling up carbon dioxide removal (CDR) alongside deep and sustained emissions reductions (Riahi et al., Reference Riahi, Schaeffer, Arango, Calvin, Guivarch, Hasegawa, Jiang, Kriegler, Matthews, Peters, Rao, Robertson, Sebbit, Steinberger, Tavoni, van Vuuren, Shukla, Skea, Slade, Khourdajie, van Diemen, McCollum, Pathak, Some, Vyas, Fradera, Belkacemi, Hasija, Lisboa, Luz and Malley2023). However, CDR deployment faces risks and uncertainties. Recent integrated assessment modelling (IAM) evidence shows: (1) CDR scale-up is limited by sustainability constraints, implying that it may only be sufficient to compensate for the most hard-to-abate emissions; (2) a ‘preventive’ CDR capacity would help address to address overshoot and to hedge against physical climate uncertainties; and (3) national plans do not yet reflect a level of CDR scale-up consistent with the Paris Agreement temperature goal (Figure 8).

Figure 8. Assessments of the emissions and CDR gap. A stylised sketch of the possible scenario pathways that reach net-zero CO₂ and GHG emissions. Emissions reductions and CDR are needed to limit warming. CDR can compensate for “residual emissions” and allow net negative GHG emissions to be reached to address overshoot; however, it will be limited by land area and other sustainability constraints (A). This implies the need for faster and deeper emissions reductions, reserving CDR to compensate only residual emissions from ‘critical needs’. A ‘preventative CDR capacity’ may be required to address unexpected Earth system responses (B). This implies even stronger efforts on emissions reductions and/or potential sustainability conflicts from CDR deployment. As it stands, there is a gap between country proposals for scaling CDR and conservative levels of CDR in scenarios (C). To take into account the need for a preventative CDR capacity, countries would need to strengthen pledges and implementation for reductions and CDR scaling. (A, B, and C, based on (Lamb, Schleussner et al., Reference Schleussner, Ganti, Lejeune, Zhu, Pfleiderer, Prütz, Ciais, Frölicher, Fuss, Gasser, Gidden, Kropf, Lacroix, Lamboll, Martyr, Maussion, McCaughey, Meinshausen, Mengel and Rogelj2024).
CDR involves extracting CO₂ from the atmosphere and storing it in geological sinks, the biosphere, or products (S. M. Smith et al., Reference Smith, Geden, Gidden, Lamb, Nemet, Minx, Buck, Burke, Cox, Edwards, Fuss, Johnstone, Müller-Hansen, Pongratz, Probst, Roe, Schenuit, Schulte and Vaughan2024). ‘Conventional’ CDR methods (Box 4) include afforestation/reforestation and forest management practices and are widely used, while ‘novel’ CDR methods (Box 4) such as Bioenergy with Carbon Capture and Storage (BECCS), Direct Air Carbon Capture and Storage (DACCS), enhanced weathering, carbon mineralisation, or biochar, are technically feasible but not yet scaled up (see Box 4 for key CDR terms). Current CDR deployment levels are low at 2 Gt CO₂/yr and comprise primarily conventional CDR. Furthermore, overall net emissions from land-use and forestry are about 4.4 Gt CO₂/yr, meaning that emissions from deforestation and peat fires still significantly outweigh CDR in the land sector (Forster et al., Reference Forster, Smith, Walsh, Lamb, Lamboll, Hall, Hauser, Ribes, Rosen, Gillett, Palmer, Rogelj, von Schuckmann, Trewin, Allen, Andrew, Betts, Borger, Boyer and Zhai2024; Friedlingstein et al., Reference Friedlingstein, O'Sullivan, Jones, Andrew, Hauck, Landschützer, Le Quéré, Li, Luijkx, Olsen, Peters, Peters, Pongratz, Schwingshackl, Sitch, Canadell, Ciais, Jackson, Alin and Zeng2025; S. M. Smith et al., Reference Smith, Geden, Gidden, Lamb, Nemet, Minx, Buck, Burke, Cox, Edwards, Fuss, Johnstone, Müller-Hansen, Pongratz, Probst, Roe, Schenuit, Schulte and Vaughan2024).
A key purpose of CDR is to compensate for future ‘residual emissions’ (Box 4), and thus allow countries and other sub-national or private entities to achieve net zero emissions targets by a given date, e.g., 2050 (Figure 8A). Residual emissions will remain because it may not be possible to eliminate all sources of emissions, especially those that are ‘hard-to-abate’ (Box 4) due to high mitigation costs and limited substitution options, such as emissions from livestock, international aviation or some heavy industry (Box 4) (Edelenbosch et al., Reference Edelenbosch, Hof, van den Berg, de Boer, Chen, Daioglou, Dekker, Doelman, den Elzen, Harmsen, Mikropoulos, van Sluisveld, Stehfest, Tagomori, van Zeist and van Vuuren2024; Fuhrman et al., Reference Fuhrman, Speizer, O'Rourke, Peters, McJeon, Monteith, Aldrete Lopez and Wang2024; Lamb, Schleussner et al., Reference Schleussner, Ganti, Lejeune, Zhu, Pfleiderer, Prütz, Ciais, Frölicher, Fuss, Gasser, Gidden, Kropf, Lacroix, Lamboll, Martyr, Maussion, McCaughey, Meinshausen, Mengel and Rogelj2024). However, emissions in these sectors could be brought down to low levels via demand-side measures (Creutzig et al., Reference Creutzig, Roy, Devine-Wright, Díaz-José, Geels, Grubler, Maïzi, Masanet, Mulugetta, Onyige, Perkins, Sanches-Pereira, Weber, Shukla, Skea, Slade, Al Khourdajie, van Diemen, McCollum, Pathak, Some, Vyas, Fradera, Belkacemi, Hasija, Lisboa, Luz and Malley2022; Edelenbosch et al., Reference Edelenbosch, Hof, van den Berg, de Boer, Chen, Daioglou, Dekker, Doelman, den Elzen, Harmsen, Mikropoulos, van Sluisveld, Stehfest, Tagomori, van Zeist and van Vuuren2024).
The interplay between CDR and residual emissions can be observed in IAM scenarios (Ganti et al., Reference Ganti, Gasser, Bui, Geden, Lamb, Minx, Schleussner and Gidden2024; Shindell & Rogelj, Reference Shindell and Rogelj2025). For example, in C2 scenarios (1.5°C scenarios with high overshoot, see Box 4), CDR deployment needs reach 13 Gt CO₂/yr averaged over 2050–2100, with a standard deviation of 3–4 Gt CO₂/yr, across 81 scenarios (Shindell & Rogelj, Reference Shindell and Rogelj2025). This CDR balances 13 Gt CO₂e/yr residual emissions of CO₂, N₂O, and F-gases (Box 4) averaged over this period, though late in the century, CDR needs often reach levels of > 15 Gt CO₂e/yr or even > 20 Gt CO₂e/yr, becoming substantially larger than the residual long-lived GHG emissions. A slightly smaller average of 10 Gt CO₂/yr CDR is deployed over 2050-2100 in C1 (1.5°C scenarios with no or limited overshoot) or C3 (2°C with no or limited overshoot) scenarios.
While results are highly model-dependent, deployment of CDR at the levels envisioned in IAMs implies large sustainability risks. Conventional CDR will compete for other land uses such as food production and biodiversity protection, while novel CDR could entail additional, significant energy and material demands (Iisd et al., 2020; Perkins et al., Reference Perkins, Alexander, Arneth, Brown, Millington and Rounsevell2023) (Figure 8B). For example, Gidden et al. (Reference Gidden, Roe, Ganti, Gasser, Hasegawa, Lamb, Ochi, Strefler, Vaughan, Smith, Geden, Gidden, Lamb, Nemet, Minx, Buck, Burke, Cox, Edwards, Fuss, Johnstone, Müller-Hansen, Pongratz, Probst, Roe, Schenuit, Schulte and Vaughan2024) find that “more sustainable C1-C3 scenarios” which take into account these considerations have lower overall CDR deployment levels and more stringent and deep emissions reductions in the near-term.
Given the sustainability constraints facing CDR, in order to achieve long-term temperature decline it is essential to minimise economy-wide emissions, such that achievable CDR capacity is able to compensate for ‘residual emissions’, i.e. from sectors that are truly hard-to-abate and serve critical needs (Figure 8C). Despite this, many IAM scenarios deploy CDR to compensate for emissions that are relatively easier to abate, such as the power sector where cost-effective alternatives are readily available (Lamb, Reference Lamb2024; Shindell & Rogelj, Reference Shindell and Rogelj2025). Similarly, requires an adjustment consistent with the limited supply of CDR (Arendt, Reference Arendt2024; Shindell & Rogelj, Reference Shindell and Rogelj2025).
A second key purpose of CDR is to aim for long-term global temperature decline after overshoot (Reisinger et al., Reference Reisinger, Fuglestvedt, Pirani, Geden, Jones, Maharaj, Poloczanska, Morelli, Johansen, Adler, Betts and Seneviratne2025). Commonly, exploration of CDR needs in emission pathways focuses on median warming outcomes (i.e., 50% chance to limit warming to 1.5°C in 2100, for example, in IPCC 2022). However, to comprehensively assess overshoot risks and CDR requirements for warming reversal, uncertainties in Earth system feedbacks must also be considered. Schleussner et al. (Reference Schleussner, Ganti, Lejeune, Zhu, Pfleiderer, Prütz, Ciais, Frölicher, Fuss, Gasser, Gidden, Kropf, Lacroix, Lamboll, Martyr, Maussion, McCaughey, Meinshausen, Mengel and Rogelj2024) establish that hundreds of gigatonnes of additional CDR, beyond those already allocated in emission pathways, may be required to compensate for stronger-than-expected Earth System feedbacks. They estimate that for a 1.5°C no-overshoot pathway, the cumulative CDR requirements to compensate for a high warming outcome (with a 1-in-4 chance of occurring) would be as much as 400 Gt CO2 by 2100, an approximate doubling of CDR needs compared to IPCC AR6 WGIII scenarios.
Given the importance of CDR for meeting climate goals, it is increasingly important to evaluate national plans for implementing and scaling CDR activities. Lamb et al. (Reference Lamb, Schleussner, Grassi, Smith, Gidden, Geden, Runge-Metzger, Vaughan, Nemet, Johnstone, Schulte and Minx2024) explored how countries are planning for CDR in their Nationally Determined Contributions and Long-Term Low-Emission Development Strategies under the Paris Agreement. They found that countries plan minimal additions of 0.05 to 0.53 Gt CO₂/yr by 2030 in their NDCs, using conventional CDR methods. By 2050, long-term strategies suggest additions of 1.5 to 1.9 Gt CO₂/yr, potentially including novel CDR methods (Figure 8C, 8D). However, these plans fall short of the levels needed to limit warming to 1.5°C, even in scenarios focusing on reducing demand and limiting CDR dependence. This indicates an emerging “CDR gap” between country plans and future deployment levels in IAMs, which themselves are uncertain and are strongly conditional on achieving emissions reductions. The CDR gap highlights the importance of more ambitious commitments, early policy support for CDR, and strengthened emissions reductions, especially with a view to minimising residual emissions.
Despite the critical role of CDR, there are limited dedicated deployments, finance and policies to support its large-scale implementation (Fuss et al., Reference Fuss, Johnstone, Höglund, Walsh, Smith, Geden, Gidden, Lamb, Nemet, Minx, Buck, Burke, Cox, Edwards, Fuss, Johnstone, Müller-Hansen, Pongratz, Probst, Roe, Schenuit, Schulte and Vaughan2024; Schenuit et al., Reference Schenuit, Buck, Geden, Hofbauer, Odeh, Schell, Sugiyama, Zheng, O., Geden, Gidden, Lamb, Minx, Buck, Burke, Cox, Edwards, Fuss, Johnstone, Müller-Hansen, Pongratz, Probst, Roe, Schenuit, Schulte and Vaughan2024). Without robust and comprehensive policy action on CDR in the near term, achieving the several gigatonne CO₂ removal required by mid-century to limit warming to 1.5°C will be challenging (Nemet et al., Reference Nemet, Gidden, Greene, Roberts, Lamb, Minx, Smith, Geden and Riahi2023). Effective policies would include funding for research, development, and demonstration projects across multiple CDR pathways (RMI, 2023), as a diverse portfolio of CDR solutions that makes use of a wide range of resource inputs will be necessary to address sustainability constraints and justice concerns (Bezos Earth Fund and RMI, 2024; Maesano et al., Reference Maesano, Mitchell-Larson, Clark-Sutton and Pike2025). Policies could also include incentives for commercial-scale deployment, as well as regulatory support for high-quality monitoring, reporting and verification. Furthermore, implementing ambitious emissions reduction policies, alongside measures to scale up CDR, minimising residual emissions from hard-to-abate sectors, and reducing energy demand would improve the odds of equitably and safely limiting global warming. Importantly, policies will be most effective if they consider regional constraints, equity, fairness, and procedural justice. This means ensuring that the burden of CDR, including the costs of financing, but also the distribution of benefits, is fairly shared across societies and generations, and between countries. Responsibilities for sharing the burden of preventative CDR can be based on equity and fairness principles (Ganti et al., Reference Ganti, Gasser, Bui, Geden, Lamb, Minx, Schleussner and Gidden2024).
At COP28, discussions emphasised the need for global commitments to scale CDR technologies alongside emission reductions. An important first step is to strengthen net emission reduction pledges in the NDCs while increasing transparency and clarity on the role of CDR in meeting these targets (Lamb, Schleussner et al., Reference Schleussner, Ganti, Lejeune, Zhu, Pfleiderer, Prütz, Ciais, Frölicher, Fuss, Gasser, Gidden, Kropf, Lacroix, Lamboll, Martyr, Maussion, McCaughey, Meinshausen, Mengel and Rogelj2024). While sustainability risks associated with CDR deployment at scale exist and warrant careful consideration in policies and pledges going forward, they must also be balanced against the risks of inaction – risks that will disproportionately affect vulnerable populations (Pörtner et al., Reference Pörtner, Roberts, Adams, Adelekan, Adler, Adrian, Aldunce, Ali, Bednar-Friedl, Begum, Bezner Kerr, Biesbroek, Birkmann, Bowen, Caretta, Carnicer, Castellanos, Cheong, Chow, Zaiton Ibrahim, Pörtner, Roberts, Poloczanska, Mintenbeck, Tignor, Alegría, Craig, Langsdorf, Löschke, Möller, Okem, Pörtner, Roberts, Tignor, Poloczanska, Mintenbeck, Alegría, Craig, Langsdorf and Rama2022; Romanello et al., Reference Romanello, Walawender, Hsu, Moskeland, Palmeiro-Silva, Scamman, Ali, Ameli, Angelova, Ayeb-Karlsson, Basart, Beagley, Beggs, Blanco-Villafuerte, Cai, Callaghan, Campbell-Lendrum, Chambers, Chicmana-Zapata and Costello2024). Rapidly scaling up carbon dioxide removal to eventually achieve net-negative emissions will be critical to mitigating the severe impacts of climate change.
Box 4. Definitions of key CDR terms
Conventional CDR: Well-established methods of carbon dioxide removal that have been widely implemented and validated over time such as afforestation and reforestation or improved forest management, soil carbon sequestration, peatlands and wetlands restorations, and more.
F-gases: Industrial chemicals containing fluorine that are also greenhouse gases.
Novel CDR: Emerging and innovative technologies that are still in the early stages of development and deployment including biochar, bioenergy with carbon capture and storage (BECCS), direct air capture and carbon storage (DACCS), enhanced weathering and mineralisation, and more.
Residual emissions: The gross emissions that are compensated by CDR at the point of net-zero CO2.
Hard-to-Abate: Economic activities that are difficult to mitigate, typically defined in terms of higher abatement costs relative to other sectors.
Negative Emissions: removing more CO₂ through anthropogenic activities than is emitted.
Overshoot: Temporary exceedance of global warming levels, before global temperatures are brought back down below through mitigation efforts and CDR technologies.
Insight 9. Carbon credit markets – Persistent integrity challenges and emerging responses
Markets for carbon credits allow a variety of actors to generate revenue by implementing climate change mitigation activities, for example, those involving improved forest management or renewable energy deployment. Carbon credits are traded in diverse settings, including voluntary markets where entities or individuals purchase credits to “offset” their emissions; regulated markets such as emissions-trading schemes that legally require companies to reduce emissions, and mechanisms under the UNFCCC that allow countries to transfer emissions reductions (Trouwloon et al., Reference Trouwloon, Streck, Chagas and Martinus2023). Voluntary markets dominate this landscape, accounting for 76% of the nearly 250 million credits retired in 2024 (World Bank, 2025a).
Following rising demand from decarbonisation ambitions in government and company policies, credit issuances grew from approximately 200 million in 2020 to 350 million in 2021, but have since dropped consistently, sliding to 290 million in 2024 (World Bank, 2025a). This drop reflects persistent concerns about the quality of carbon credits and growing uncertainty about their role in voluntary climate action (Mikolajczyk & Díaz, Reference Mikolajczyk and Díaz2024; Mikolajczyk et al., Reference Mikolajczyk, Díaz and Perpignan2025). This section presents new evidence of persisting challenges in voluntary and compliance markets, demonstrating that carbon credits are not a reliable substitute for fossil-fuel cuts, and explores emerging responses and unresolved issues.
Evidence of quality issues on the supply side of carbon credit markets has accumulated. While the effectiveness of carbon credits relies heavily on sound decisions by individual project developers, recent work shows how standards and methodologies in carbon crediting mechanisms systematically undermine climate change mitigation effectiveness (Probst et al., Reference Probst, Toetzke, Kontoleon, Díaz Anadón, Minx, Haya, Schneider, Trotter, West, Gill-Wiehl and Hoffmann2024). Particularly, flexibility allowing project developers to select favorable data or make unrealistic assumptions (Gill-Wiehl et al., Reference Gill-Wiehl, Kammen and Haya2024; Probst et al., Reference Probst, Toetzke, Kontoleon, Díaz Anadón, Minx, Haya, Schneider, Trotter, West, Gill-Wiehl and Hoffmann2024), along with issues like adverse selection, outdated data, or inappropriate methodologies, all undermine the integrity of carbon credits. An analysis of nearly one billion tons of carbon credits – around one-fifth of all issued – found that less than 16% represented actual emission reductions (Figure 9) (Probst et al., Reference Probst, Toetzke, Kontoleon, Díaz Anadón, Minx, Haya, Schneider, Trotter, West, Gill-Wiehl and Hoffmann2024). Many project types, including wind power in China and improved forest management in the USA, showed no statistically significant climate benefits. Similarly, others, like cookstove and deforestation avoidance projects, achieved lower emission reductions than claimed (Figure 9). These findings highlight systemic flaws in how credits have been generated, verified, and sold.

Figure 9. Results from Probst et al., Reference Probst, Toetzke, Kontoleon, Díaz Anadón, Minx, Haya, Schneider, Trotter, West, Gill-Wiehl and Hoffmann2024 analysing 972 MT CO₂ credits issued across the globe. Panel (A) (left) illustrates the emissions reductions achieved. Less than 16% of credits are estimated to have met their emission reduction targets, while at least 84% did not. 16% is estimated as an upper bound as not all sources of over-crediting were analysed by the reviewed studies in Probst et al. (Reference Probst, Toetzke, Kontoleon, Díaz Anadón, Minx, Haya, Schneider, Trotter, West, Gill-Wiehl and Hoffmann2024). Panel (B) (right) shows a comparison of the Offset Achievement Ratio (OAR), which is the emission reduction likely achieved relative to the quantity of carbon credits issued to the projects examined in the reviewed studies. (Modified from Probst et al., Reference Probst, Toetzke, Kontoleon, Díaz Anadón, Minx, Haya, Schneider, Trotter, West, Gill-Wiehl and Hoffmann2024).
Evidence of low-quality carbon credits has mostly concerned “avoidance” projects such as forest conservation and renewable energy. However, recent studies highlight how nature-based removal approaches, including afforestation and soil management, also overestimate carbon sequestration (Macintosh et al., Reference Macintosh, Butler, Larraondo, Evans, Ansell, Waschka, Fensham, Eldridge, Lindenmayer, Gibbons and Summerfield2024) and lack additionality (i.e., benefits beyond a baseline scenario) (Barbato & Strong, Reference Barbato and Strong2023). Besides, upscaling natural sinks to counterbalance emissions from fossil fuels faces innate limitations such as slow absorption rates, increasing reversal risks from wildfires (Byrne et al., Reference Byrne, Liu, Bowman, Pascolini-Campbell, Chatterjee, Pandey, Miyazaki, van der Werf, Wunch, Wennberg, Roehl and Sinha2024; Dooley et al., Reference Dooley, Nicholls and Meinshausen2022), and the unavailability of suitable land (Naef et al., Reference Naef, Friggens and Njeukam2025). Despite optimistic assumptions about terrestrial absorption in IPCC assessed models and national decarbonisation plans, there is thus considerably less capacity for further land-based emissions removals than previously assumed (Deprez et al., Reference Deprez, Leadley, Dooley, Williamson, Cramer, Gattuso, Rankovic, Carlson and Creutzig2024; Roebroek et al., Reference Roebroek, Duveiller, Seneviratne, Davin and Cescatti2023). Collectively, these recent findings suggest that nature-based carbon removals cannot reliably substitute for cuts in fossil-fuel emissions (Allen et al., Reference Allen, Frame, Friedlingstein, Gillett, Grassi, Gregory, Hare, House, Huntingford, Jenkins, Jones, Knutti, Lowe, Matthews, Meinshausen, Meinshausen, Peters, Plattner, Raper and Zickfeld2025) or resolve the fundamental quality issues associated with avoidance credits.
Recent work reveals that quality problems are also influenced by demand-side dynamics. Trencher et al. (Reference Trencher, Nick, Carlson and Johnson2024) analysed carbon credits purchased by the 20 largest corporate buyers for voluntary purposes between 2020 and 2023, finding that most companies have consistently relied on low-quality, low-cost avoidance credits with a high risk of overstating emission reductions. With most credits originating from aged projects that started issuing credits a decade or more earlier, corporate offset spending has largely failed to support new investments in climate mitigation.
While carbon credits are often linked to claims about net-zero or carbon neutrality, including products, services, and operations (Trouwloon et al., Reference Trouwloon, Streck, Chagas and Martinus2023), most companies do not explicate how they use offsets in GHG accounting (Green et al., Reference Green, Hale and Arceo2024). A perennial concern is that reliance on offsetting could delay or weaken decarbonisation if companies prioritised credit purchases and diverted funds away from internal decarbonisation and fossil fuel phase-out initiatives. An earlier analysis of net-zero strategies by oil majors (Trencher et al., Reference Trencher, Blondeel and Asuka2023) supports concerns about a ‘delay effect’, revealing the use of carbon credits to legitimise the continued production and consumption of conventional fossil fuels. Stolz and Probst (Reference Stolz and Probst2024) find that while carbon credits are unlikely to eliminate internal decarbonisation efforts for most companies, they could divert considerable funds within large polluters like airlines.
Carbon credit projects have been continuously criticised for failing to realise or systematically quantify socioeconomic and environmental non-carbon benefits (NCB) (Nantongo et al., Reference Nantongo, Vatn and Soka2024; Theresia et al., Reference Theresia, Atmadja and Lieberherr2025). Nantongo et al. (Reference Nantongo, Vatn and Soka2024) suggest that adequate project design can help reduce carbon emissions while simultaneously improving social welfare. However, other studies underscore inherent tradeoffs between project success and equity in forest carbon initiatives, revealing how efforts to reduce carbon emissions disproportionately benefit more affluent or environmentally destructive communities (Pande, Reference Pande2024), while upfront and transaction costs are entry barriers for small-scale projects (Roy & Bhan, Reference Roy and Bhan2024). Although more funding is needed to effectively address global deforestation, especially in tropical regions, and to secure critical non-carbon benefits like biodiversity (Buma et al., Reference Buma, Gordon, Kleisner, Bartuska, Bidlack, DeFries, Ellis, Friedlingstein, Metzger, Morgan, Novick, Sanchirico, Collins, Eagle, Fujita, Holst, Lavallee, Lubowski, Melikov and Hamburg2024; Jones, Reference Jones2024), these challenges highlight the limitations of using carbon credits as the primary funding vehicle.
Carbon market actors are responding to these problems in multiple ways. Initiatives like the Integrity Council for Voluntary Carbon Markets (ICVCM) have established governance and quality benchmarks. Several carbon credit rating services provide customers with detailed project-specific insights about relative credit quality, including co-benefits (Wawrzynowicz et al., Reference Wawrzynowicz, Krey and Samaniego2023). Though impacts are still uncertain, research suggests there is growing voluntary demand for higher-quality credits (Berends et al., Reference Berends, Curtis, Lee, Macedo, Mclsaac, Velazquez, Erol, Josyula and Garg2025). To address demand-side concerns, standard-setters such as Science-Based Targets initiative and the Voluntary Carbon Markets Integrity initiative have stressed that carbon credits should not substitute direct decarbonisation. This has bolstered ongoing calls for a paradigm shift, under which carbon credits would be used to provide additional ‘contributions’ to global mitigation efforts, rather than offset emissions (Blanchard et al., Reference Blanchard, Anderegg and Haya2024). Nominally, this could alleviate concerns about delay effects.
Some governments have begun to respond with regulations and guidance. Under the EU Corporate Sustainability Reporting Directive (the implementation of which has now been delayed) (Toms et al., Reference Toms, Benson, Lau and Naseem2025), large companies would be required to elucidate the quality of carbon credits they use and explain how their use does not impede decarbonisation efforts. In 2024, the US government (under a previous administration) issued a statement endorsing similar principles. Similar efforts are underway in other jurisdictions. The biggest test lies ahead under Article 6 of the Paris Agreement, where policymakers are establishing international standards that could set a quality benchmark for all carbon credit markets. Paying close attention to the unresolved quality challenges of existing standards could help ensure the world's largest nascent quasi-compliance market avoids the same pitfalls and works to accelerate climate action rather than undermine it.
Insight 10. Policy mixes outperform standalone measures in advancing emissions reductions
Identifying effective climate policies is critical for guiding impactful interventions. Jurisdictions around the world are pursuing a wide range of climate policies to reduce GHG emissions. From an economic perspective, the standard principle has been that one policy instrument should be employed to address each market failure (Tinbergen, Reference Tinbergen1952), for example a carbon price to internalise climate damages, R&D funding to address knowledge spillovers, and other incentives to overcome lock-in and network externalities (Bennear & Stavins, Reference Bennear and Stavins2007; Stiglitz et al., Reference Stiglitz, Barrett and Kaufman2023). Yet, few jurisdictions have implemented an explicit carbon price near the social cost of carbon (Rennert et al., Reference Rennert, Errickson, Prest, Rennels, Newell, Pizer, Kingdon, Wingenroth, Cooke, Parthum, Smith, Cromar, Diaz, Moore, Müller, Plevin, Raftery, Ševčíková, Sheets and Anthoff2022; World Bank, 2025b), let alone adopted a coordinated policy mix to address all market failures. In practice, the complex mix of policy instruments in place today has historically developed across years, successive governments, and jurisdictional levels, at times resulting in policy overlap with limited coordination (Howlett & Rayner, Reference Howlett and Rayner2007; Kern et al., Reference Kern, Kivimaa and Martiskainen2017; Scott et al., Reference Scott, Rhodes and Hoicka2023). Interactions between policies can alter their total emissions impact to be more, or less, than the sum of its parts (Fischer, Reference Fischer2010; van den Bergh et al., Reference van den Bergh, Castro, Drews, Exadaktylos, Foramitti, Klein, Konc and Savin2021; Ye et al., Reference Ye, Wu, Yan, Li, Zheng, Zhou and Wang2024). For example, simulations of residential heating in France suggest that the combination of bans on gas boilers and a subsidy scheme may increase the likelihood of carbon neutrality while reducing overall system costs and addressing distribution issues (Escribe & Vivier, Reference Escribe and Vivier2025). Complementarities between policies may arise along different pathways due to spatial, temporal, or functional relationships (Trencher & van der Heijden, Reference Trencher and van der Heijden2019). For example, possible explanations for complementarities include that individual policies may have a limited scope and are subject to rebound effects (Gillingham et al., Reference Gillingham, Kotchen, Rapson and Wagner2013) and thus require additional instruments such as pricing to overcome those (Dimanchev & Knittel, Reference Dimanchev and Knittel2023; van den Bergh et al., Reference van den Bergh, Castro, Drews, Exadaktylos, Foramitti, Klein, Konc and Savin2021). Additionally, policy mixes can address a multitude of market failures (Blanchard et al., Reference Blanchard, Gollier and Tirole2023), increase overall policy stringency (Meckling et al., Reference Meckling, Kelsey, Biber and Zysman2015) and maximise credibility, shaping the expectations of consumers and investors (Dolphin et al., Reference Dolphin, Pahle, Burtraw and Kosch2023). Identifying which instruments and policy combinations are most effective at contributing additional emissions reductions and managing trade-offs across additional policy objectives represents a rapidly developing area of climate policy research.
A global, systematic ex-post evaluation of 1500 climate policy measures implemented across 41 countries over the last two decades shows: emission reductions on a magnitude that matches zero-emissions targets are possible – but need to be scaled (Stechemesser et al., Reference Stechemesser, Koch, Mark, Dilger, Klösel, Menicacci, Nachtigall, Pretis, Ritter, Schwarz, Vossen and Wenzel2024). This comprehensive, empirical assessment of climate policy identified 63 large emissions reductions leading to an average emissions cut of 19% with total emission reductions between 0.6 billion and 1.8 billion metric tonnes CO₂ (Stechemesser et al., Reference Stechemesser, Koch, Mark, Dilger, Klösel, Menicacci, Nachtigall, Pretis, Ritter, Schwarz, Vossen and Wenzel2024). These successful cases form a collective evidence base of country-specific experiences to learn from, and can all be explored in detail through a complementary online tool. The empirical evidence shows that carefully designed combinations of policy measures may perform better than stand-alone instruments in many instances (Figure 10A). A number of popular instruments – such as bans, building codes, energy efficiency mandates, and subsidies – are either only ever detected in policy mixes or have smaller average effect sizes if they are associated as stand-alone policy with a large emissions reduction. Comparing the effect sizes of policy mixes that combine non-price-based instruments with taxation or reduced fossil fuel subsidies as opposed to mixes without pricing elements shows that pricing is often the complement that enables large emission reductions (Figure 10A, black bars). Taxation further stands out as the only instrument that causes large emission reductions as a stand-alone policy (Stechemesser et al., Reference Stechemesser, Koch, Mark, Dilger, Klösel, Menicacci, Nachtigall, Pretis, Ritter, Schwarz, Vossen and Wenzel2024).

Figure 10. Results from Stechemesser et al. (Reference Stechemesser, Koch, Mark, Dilger, Klösel, Menicacci, Nachtigall, Pretis, Ritter, Schwarz, Vossen and Wenzel2024) comparing effective policy mixes. Panel (A) compares the average size of the emissions reduction if a policy instrument was successful individually vs in a policy mix. For non-price-based policies, the black thick line indicates the average effect size of a mix with a given policy instrument and pricing instruments. Policy mixes often result in greater reduction effects compared to stand-alone implementations. Pricing instruments (taxation or reduced fossil fuel subsidies) are part of successful mixes with popular subsidy schemes and regulatory tools such as bans, building codes and energy efficiency mandates. Panel (B) provides further details on the variation in effective policy mixes across sectors, country contexts, and stages of economic development. For each circle area, the percentage indicates which share of successful interventions in this sector was made up by a specific individual policy type or a specific combination of policy types. (Redrawn from Stechemesser et al., Reference Stechemesser, Koch, Mark, Dilger, Klösel, Menicacci, Nachtigall, Pretis, Ritter, Schwarz, Vossen and Wenzel2024).
While policy combinations can outperform standalone instruments, effective mixes vary by sector, country context, and stage of economic development (Figure 10B) (Stechemesser et al., Reference Stechemesser, Koch, Mark, Dilger, Klösel, Menicacci, Nachtigall, Pretis, Ritter, Schwarz, Vossen and Wenzel2024). Desirable policy packages must be tailored to the characteristics of targeted actors, technologies, and institutional capacity (Cocker, Reference Cocker2025). Effective implementation requires iterative learning and adjustment. This includes robust governance structures, systems for data collection, transparency, monitoring, and ongoing policy evaluation – key elements for ensuring that policies remain effective over time and responsive to changing conditions (Armitage et al., Reference Armitage, Bakhtian and Jaffe2024; Edmondson et al., Reference Edmondson, Flachsland, Aus Dem Moore, Koch, Koller, Gruhl and Brehm2025). Such coordination and evaluation can be a particular challenge in jurisdictions where climate policy is implemented across multiple jurisdictions and scales (Scott et al., Reference Scott, Rhodes and Hoicka2023).
There is no one-size-fits-all policy mix to effectively reduce GHG emissions. However, empirical and theoretical evidence on interaction effects of frequently used policy instruments is emerging, providing key lessons for policymakers. For example, Dimanchev and Knittel (Reference Dimanchev and Knittel2023) develop a framework for evaluating policy interactions and tradeoffs and demonstrate that even a modest carbon price can significantly enhance the cost-effectiveness of the policy mix when paired with a performance standard. They also show that this relationship is non-linear, with diminishing marginal returns as reliance on pricing increases. The importance of pricing is supported by observed emissions trajectories, where Stechemesser et al. (Reference Stechemesser, Koch, Mark, Dilger, Klösel, Menicacci, Nachtigall, Pretis, Ritter, Schwarz, Vossen and Wenzel2024) find that a key characteristic of successful cases of large emission reductions within developed economies is the integration of tax and price incentives in well-designed policy mixes. While carbon pricing often encounters political resistance, the use of performance standards has expanded with greater public support and policy durability (Meckling et al., Reference Meckling, Sterner and Wagner2017; Rhodes et al., Reference Rhodes, Scott and Jaccard2021). These findings suggest that well-designed policy mixes can leverage the strengths of different instruments to balance trade-offs across multiple policy objectives.
The type and design of policy instruments fundamentally shape how they interact with others in the policy mix (Perino et al., Reference Perino, Ritz and Van Benthem2019). For instance, when additional policies overlap with a fixed-quantity instrument (e.g., emissions cap), they may not achieve additional emissions reductions because the total quantity of allowances is unchanged (Gerlagh et al., Reference Gerlagh, Heijmans and Rosendahl2023). This waterbed effect occurs when overlapping policies reduce demand for emissions allowances without altering the total limit set by the cap (Rosendahl, Reference Rosendahl2019). Therefore, fixed-quantity instruments must incorporate design mechanisms to dynamically adjust the cap in response to market conditions reflecting lower demand (Heijmans, Reference Heijmans2023; Willner & Perino, Reference Willner and Perino2022). The European Union Emission Trading Scheme's Market Stability Reserve is one such design innovation that can help mitigate the waterbed effect by automatically reducing the supply of allowances as other policies reduce demand (Borghesi et al., Reference Borghesi, Pahle, Perino, Quemin and Willner2023; Perino et al., Reference Perino, Willner, Quemin and Pahle2022). Without accounting for these interaction effects, additional policies may even increase total emissions by shifting emissions toward unregulated sources, sectors, and facilities (Scott, Reference Scott2024). Unlike fixed-quantity instruments, fixed-price instruments, such as a carbon tax, maintain their price incentive regardless of overlapping policies. When paired with other policies, additional emissions reductions are more likely because the incentive from the price signal remains unchanged providing a cumulative incentive for emissions reductions (Scott, Reference Scott2024).
In an increasingly complex climate policy environment, a growing body of research emphasises the importance for policymakers to consider interactions and combined effects of climate policies to reduce GHG emissions. Climate policies do not exist in isolation and therefore cannot be effectively evaluated in isolation. It is important to account for interactions in the climate policy mix, both to promote policy combinations that generate positive synergies and to avoid negative or offsetting effects (van den Bergh et al., Reference van den Bergh, Castro, Drews, Exadaktylos, Foramitti, Klein, Konc and Savin2021). Leveraging available evidence from policy mixes used in practice provides an opportunity to learn from where observed structural breaks in emissions trajectories have occurred (see, for example, the tool: Climate Policy Explorer (PIK 2024)).
Finally, climate policy mixes rarely pursue emissions reductions alone. In practice, they are often designed, or evolve, to achieve multiple policy objectives including cost effectiveness, distributional equity, innovation, energy security, and political feasibility (Edmondson et al., Reference Edmondson, Flachsland, Aus Dem Moore, Koch, Koller, Gruhl and Brehm2025; Goulder & Parry, Reference Goulder and Parry2008; Grubb et al., Reference Grubb, Poncia, Drummond, Neuhoff and Hourcade2023). The implementation of policies is further influenced by policy acceptance, for which policy sequencing may play a critical role. For example, recent evidence shows that the perceived effectiveness of prior policy-induced benefits is related to more public support for higher carbon prices across sectors (Linsenmeier et al., Reference Linsenmeier, Mohommad and Schwerhoff2022; Meckling et al., Reference Meckling, Sterner and Wagner2017; Montfort et al., Reference Montfort, Fesenfeld, Stadelmann-Steffen and Ingold2023). Future research is needed to extend the knowledge base on how policy combinations and interactions alter outcomes across multiple objectives and perform dynamically over time (Bhardwaj et al., Reference Bhardwaj, Axsen, Kern and McCollum2020; Cocker, Reference Cocker2025; Z. Jia et al., Reference Jia, Liu and Lin2024; Scott, Reference Scott2025). Designing effective combinations thus requires understanding sector-specific interactions, managing trade-offs, and adapting instruments to jurisdictional needs – pointing to a critical opportunity to close both the emissions gap and the emerging knowledge gap on policy effectiveness.
3. Discussion
The year 2025 marks a critical moment for global climate governance: 10 years since the adoption of the Paris Agreement and the midpoint of the ‘crucial decade’ for climate action. Despite prior global commitments, climate indicators continue to worsen. This review paper is part of a scientist-led initiative intended to improve interdisciplinary understanding across the broad and diverse research community working on climate change, thereby equipping the community to produce more robust scientific advice for policymakers and government officials. This paper also provides the basis for the scientific messages of a science-policy report which will be shared with all the Party delegations to the UNFCCC ahead of COP30 in Belém.
In this section, we synthesise and connect the 10 insights, presenting them as three interlinked clusters of messages: Earth system processes, Severe climate impacts, and Enhancing mitigation.
3.1. Earth system processes
The first cluster of insights is focused on advances in scientific understanding of Earth system processes and what these mean in terms of a possible acceleration of global warming. The first two insights synthesise multiple lines of evidence to provide an explanation of the geophysical processes underlying the record warm years of 2023 and 2024 (Insight 1), and the acceleration of ocean warming (Insight 2). These insights clearly convey that 2023 and 2024 were not simply additional gradual steps in the warming trend of the past five decades, but rather the constitute a significant surge, driven by a combination of long-term GHG forcing, other forcings including the recent change in aerosols loading, internal variability, and feedback processes leading to an elevated Earth energy imbalance (EEI) (Forster et al., Reference Forster, Smith, Walsh, Lamb, Lamboll, Cassou, Hauser, Hausfather, Lee, Palmer, von Schuckmann, Slangen, Szopa, Trewin, Yun, Gillett, Jenkins, Matthews, Raghavan and Zhai2025, Reference Forster, Smith, Walsh, Lamb, Lamboll, Hall, Hauser, Ribes, Rosen, Gillett, Palmer, Rogelj, von Schuckmann, Trewin, Allen, Andrew, Betts, Borger, Boyer and Zhai2024; Hodnebrog et al., Reference Hodnebrog, Myhre, Jouan, Andrews, Forster, Jia, Loeb, Olivié, Paynter, Quaas, Raghuraman and Schulz2024; Loeb, Doelling, et al., Reference Loeb, Doelling, Kato, Su, Mlynczak and Wilkins2024; Merchant et al., Reference Merchant, Allan and Embury2025; Min, Reference Min2024). Record global sea surface temperatures were driven by accelerated ocean heat uptake and the EEI (Merchant et al., Reference Merchant, Allan and Embury2025). As the largest sink for Earth's accumulating heat, the ocean sets the pace for global warming, and that pace may be accelerating (Terhaar et al., Reference Terhaar, Burger, Vogt, Frölicher and Stocker2025; von Schuckmann et al., Reference von Schuckmann, Minière, Gues, Cuesta-Valero, Kirchengast, Adusumilli, Straneo, Ablain, Allan, Barker, Beltrami, Blazquez, Boyer, Cheng, Church, Desbruyeres, Dolman, Domingues, García-García and Zemp2023).
The sustained inadequacy of global mitigation efforts is now reflected in what appears to be an acceleration of global warming, which implies that even larger efforts will be required to minimise the magnitude and duration of overshoot of the + 1.5°C limit goal (Bustamante et al., Reference Bustamante, Roy, Ospina, Achakulwisut, Aggarwal, Bastos, Broadgate, Canadell, Carr, Chen, Cleugh, Ebi, Edwards, Farbotko, Fernández-Martínez, Frölicher, Fuss, Geden, Gruber and Zscheischler2023). Climate models face significant challenges in reconciling the 2023–2024 warming surge, reflecting both well-documented limitations in representing aerosol–cloud interactions and the extreme statistical rarity of the observed temperature anomalies (Rantanen & Laaksonen, Reference Rantanen and Laaksonen2024; Terhaar et al., Reference Terhaar, Burger, Vogt, Frölicher and Stocker2025). While updated model experiments incorporating recent forcings are still emerging, the magnitude of the warming suggests that either known feedback processes are stronger than currently modeled, or additional mechanisms may be contributing to accelerated warming.
Climate-biosphere processes also have direct impacts on global warming. We highlight the state of land carbon sinks, with a focus on the Northern Hemisphere (Insight 3) and the relationship between biodiversity loss and climate change (Insight 4). Concerns about the response of natural carbon sinks to additional climate change (Bustamante et al., Reference Bustamante, Roy, Ospina, Achakulwisut, Aggarwal, Bastos, Broadgate, Canadell, Carr, Chen, Cleugh, Ebi, Edwards, Farbotko, Fernández-Martínez, Frölicher, Fuss, Geden, Gruber and Zscheischler2023) continue to grow. The record temperatures and extreme weather events across multiple biomes resulted in a sharp decline in the global land carbon sink in 2023 (Friedlingstein et al., Reference Friedlingstein, O'Sullivan, Jones, Andrew, Hauck, Landschützer, Le Quéré, Li, Luijkx, Olsen, Peters, Peters, Pongratz, Schwingshackl, Sitch, Canadell, Ciais, Jackson, Alin and Zeng2025; Ke et al., Reference Ke, Ciais, Sitch, Li, Bastos, Liu, Xu, Gui, Bian, Goll, Xi, Li, O'Sullivan, de Souza, Friedlingstein and Chevallier2024). The effect of long-term CO2 fertilisation (which enhances land sinks), is now being offset by intensifying disturbances (fire, drought, insect outbreaks). As a result, important changes are being documented, not only on tropical regions but also in high-latitude ecosystems, which in the past have been more stable: Boreal forests are becoming carbon sources (Byrne et al., Reference Byrne, Liu, Bowman, Pascolini-Campbell, Chatterjee, Pandey, Miyazaki, van der Werf, Wunch, Wennberg, Roehl and Sinha2024; Virkkala et al., Reference Virkkala, Rogers, Watts, Arndt, Potter, Wargowsky, Schuur, See, Mauritz, Boike, Bret-Harte, Burke, Burrell, Chae, Chatterjee, Chevallier, Christensen, Commane, Dolman and Natali2025) and permafrost regions potentially are already net GHG sources (Hugelius et al., Reference Hugelius, Ramage, Burke, Chatterjee, Smallman, Aalto, Bastos, Biasi, Canadell, Chandra, Chevallier, Ciais, Chang, Feng, Jones, Kleinen, Kuhn, Lauerwald, Liu and Zheng2024; Ramage et al., Reference Ramage, Kuhn, Virkkala, Voigt, Marushchak, Bastos, Biasi, Canadell, Ciais, López-Blanco, Natali, Olefeldt, Potter, Poulter, Rogers, Schuur, Treat, Turetsky, Watts and Hugelius2024). Furthermore, the problem extends beyond the terrestrial biosphere, as carbon uptake in oceans is also reduced by marine heatwaves (Li, Huang, et al., Reference Li, Huang, Liu, Ding, He and Xie2024). Biodiversity loss in itself can have a direct effect on carbon storage and sequestration (Brodie et al., Reference Brodie, Bello, Emer, Galetti, Luskin, Osuri, Peres, Stoll, Villar and López2025; Domeignoz-Horta et al., Reference Domeignoz-Horta, Cappelli, Shrestha, Gerin, Lohila, Heinonsalo, Nelson, Kahmen, Duan, Sebag, Verrecchia and Laine2024; Weiskopf et al., Reference Weiskopf, Isbell, Arce-Plata, Di Marco, Harfoot, Johnson, Lerman, Miller, Morelli, Mori, Weng and Ferrier2024). Given that climate change is a primary driver of biodiversity loss, these processes might underpin a destabilising feedback further amplifying climate change. The recognition of this link reinforces the call for joint governance for these two interrelated global environmental crises (Boran & Pettorelli, Reference Boran and Pettorelli2024; Bustamante et al., Reference Bustamante, Roy, Ospina, Achakulwisut, Aggarwal, Bastos, Broadgate, Canadell, Carr, Chen, Cleugh, Ebi, Edwards, Farbotko, Fernández-Martínez, Frölicher, Fuss, Geden, Gruber and Zscheischler2023). In particular, meeting the targets of the Kunming–Montreal Global Biodiversity Framework (KMGBF) can be synergistic with the Paris Agreement goal to limit global warming, by reducing biodiversity-loss-driven carbon debt. Together, these four insights reinforce that rapid GHG emissions reductions are increasingly important, as further delays are expected to make climate stabilisation much harder due to Earth system responses.
3.2. Severe climate impacts
This cluster of insights focuses on different types of climate-related impacts affecting water security, human health, livelihoods, and productivity. These impacts are already being observed, and adaptation efforts must be significantly upscaled to reduce their socioeconomic consequences. However, there are limits to adaptation (Martin et al., Reference Martin, Boakye, Boyd, Broadgate, Bustamante, Canadell, Carr, Chu, Cleugh, Csevár, Daoudy, de Bremond, Dhimal, Ebi, Edwards, Fuss, Girardin, Glavovic, Hebden and Zhao2022), and in the absence of ambitious mitigation action these impacts will become increasingly more severe.
• Groundwater depletion has accelerated globally (Insight 5) due to intensified agricultural landscapes with rising irrigation demands (Bhattarai et al., Reference Bhattarai, Lobell, Balwinder-Singh, Kustas, Pokhrel and Jain2023; Jasechko et al., Reference Jasechko, Seybold, Perrone, Fan, Shamsudduha, Taylor, Fallatah and Kirchner2024), compounded by shifts in precipitation patterns, reduced snowmelt infiltration, and intensified droughts that disrupt aquifer recharge (Kuang et al., Reference Kuang, Liu, Scanlon, Jiao, Jasechko, Lancia, Biskaborn, Wada, Li, Zeng, Guo, Yao, Gleeson, Nicot, Luo, Zou and Zheng2024).
• The rising incidence of dengue (Childs et al., Reference Childs, Lyberger, Harris, Burke and Mordecai2025; Mercy et al., Reference Mercy, Youm, Aliddeki, Faria, Kebede and Ndembi2024), driven by the enhanced habitat suitability for the vector mosquito due to climate change (Insight 6), has led to longer transmission seasons and an expanded geographical range into temperate regions and higher-altitude areas (Bhandari et al., Reference Bhandari, Blackburn and Ryan2024; Farooq et al., Reference Farooq, Segelmark, Rocklöv, Lillepold, Sewe, Briet and Semenza2025).
• Heat stress impacts economic growth, primarily through labour productivity loss (Insight 7). Revised econometric estimates that incorporate nonlinear feedbacks and global interdependencies reveal substantially higher economic costs associated with climate change than previously understood (Dasgupta et al., Reference Dasgupta, Robinson, Shayegh, Bosello, Park and Gosling2024; Masuda et al., Reference Masuda, Parsons, Spector, Battisti, Castro, Erbaugh, Game, Garg, Kalmus, Kroeger, Mishra, Shindell, Tigchelaar, Wolff and Vargas Zeppetello2024).
The acceleration of climate change described in the previous cluster (particularly Insight 1) would further amplify these impacts. Moreover, in some regions, these impacts are likely to exacerbate each other. For example, the expansion of vector-borne diseases into previously unaffected areas can worsen labor productivity losses (Marczell et al., Reference Marczell, García, Roiz, Sachdev, Towle, Shen, Sruamsiri, da Silva and Hanley2024). Similarly, reduced freshwater availability affects irrigation and agricultural livelihoods (Ingrao et al., Reference Ingrao, Strippoli, Lagioia and Huisingh2023), as well as increasing risk of gastrointestinal diseases and other public health problems (Maslin et al., Reference Maslin, Ramnath, Welsh and Sisodiya2025). Together, these three insights shed light on critical and urgent adaptation needs as communities across the world confront the climate-related impacts of a planet approaching a + 1.5°C temperature overshoot.
3.3. Enhancing mitigation action
The final cluster of insights focuses on three areas where scientific and technical knowledge is crucial for designing effective policies for more rapid emissions reductions, while minimising socioeconomic and environmental trade-offs: scaling-up CDR (Insight 8), addressing integrity challenges in carbon credit markets (Insight 9), and designing policy mixes for effective emissions reductions (Insight 10). This cluster also illustrates the importance of interdisciplinary analysis for critically assessing different narratives that shape political debates regarding climate action.
Scaling CDR is needed in all pathways compatible with the Paris Agreement, as a complement to deep and sustained GHG emissions reductions (Rogelj et al., Reference Rogelj, Shindell, Jiang, Fifita, Forster, Ginzburg, Handa, Kheshgi, Kobayashi, Kriegler, Mundaca, Séférian, Vilariño, Masson-Delmotte, Zhai, Pörtner, Roberts, Skea, Shukla, Pirani, Moufouma-Okia, Péan, Pidcock, Connors, Matthews, Chen, Zhou, Gomis, Lonnoy, Maycock, Tignor and Waterfield2018). Insight 8 synthesises the key requirements and constraints that make the safe scale-up of CDR a pressing governance issue. Yet, current national plans fall far short from the best available estimates of what is needed to achieve climate goals, creating a substantial “CDR gap” (Lamb, Reference Lamb2024; Lamb, Gasser, et al., Reference Lamb, Gasser, Roman-Cuesta, Grassi, Gidden, Powis, Geden, Nemet, Pratama, Riahi, Smith, Steinhauser, Vaughan, Smith and Minx2024). The vast majority of CDR capacity currently deployed is land-based, but scaling these methods has inherent sustainability constraints, due to competition for land and other resources (Deprez et al., Reference Deprez, Leadley, Dooley, Williamson, Cramer, Gattuso, Rankovic, Carlson and Creutzig2024; Perkins et al., Reference Perkins, Alexander, Arneth, Brown, Millington and Rounsevell2023). While novel CDR deployment is beginning to grow, its appropriate role is as a complement for direct mitigation efforts, offsetting hard-to-abate emissions, rather than substituting for emissions reductions in sectors where decarbonisation options are readily available (Bustamante et al., Reference Bustamante, Roy, Ospina, Achakulwisut, Aggarwal, Bastos, Broadgate, Canadell, Carr, Chen, Cleugh, Ebi, Edwards, Farbotko, Fernández-Martínez, Frölicher, Fuss, Geden, Gruber and Zscheischler2023; Deprez et al., Reference Deprez, Leadley, Dooley, Williamson, Cramer, Gattuso, Rankovic, Carlson and Creutzig2024; Shindell & Rogelj, Reference Shindell and Rogelj2025). In the context of the impending temperature overshoot, CDR will also be necessary to achieve net-negative emissions and eventually bring temperatures back within the Paris Agreement temperature range.
Voluntary carbon markets (VCMs) are expanding in anticipation of stricter compliance schemes, such as the Internationally Transferred Mitigation Outcomes, under Article 6 of the Paris Agreement. However, evidence points to systemic flaws that undermine the integrity of VCMs, resulting in low-quality credits (Insight 9). A substantial majority of projects either lack additionality or overestimate carbon sequestration (Allen et al., Reference Allen, Frame, Friedlingstein, Gillett, Grassi, Gregory, Hare, House, Huntingford, Jenkins, Jones, Knutti, Lowe, Matthews, Meinshausen, Meinshausen, Peters, Plattner, Raper and Zickfeld2025; Probst et al., Reference Probst, Toetzke, Kontoleon, Díaz Anadón, Minx, Haya, Schneider, Trotter, West, Gill-Wiehl and Hoffmann2024). Researchers have also raised concerns about a “delay effect” by corporate actors who rely on predominantly low-quality offsets instead of pursuing direct decarbonisation (Mikolajczyk et al., Reference Mikolajczyk, Díaz and Perpignan2025; Stolz & Probst, Reference Stolz and Probst2024; Trencher et al., Reference Trencher, Nick, Carlson and Johnson2024). Furthermore, the impact of extreme weather events and other ecological disturbances on the stability of land carbon sinks (Insight 3), constitutes an additional challenge to the durability of storage in land-based CDR approaches (Insight 8) and the reliability of associated carbon credits (Insight 9).
To close the ‘CDR gap’ and address the systemic integrity flaws in VCMs, comprehensive policy frameworks are suggested in the literature. For CDR, this includes combining regulatory standards, public investment, and pricing mechanisms to ensure safe and effective scaling (Fuss et al., Reference Fuss, Johnstone, Höglund, Walsh, Smith, Geden, Gidden, Lamb, Nemet, Minx, Buck, Burke, Cox, Edwards, Fuss, Johnstone, Müller-Hansen, Pongratz, Probst, Roe, Schenuit, Schulte and Vaughan2024; Schenuit et al., Reference Schenuit, Buck, Geden, Hofbauer, Odeh, Schell, Sugiyama, Zheng, O., Geden, Gidden, Lamb, Minx, Buck, Burke, Cox, Edwards, Fuss, Johnstone, Müller-Hansen, Pongratz, Probst, Roe, Schenuit, Schulte and Vaughan2024). For VCMs, recent initiatives are emerging to improve integrity of carbon credits by establishing quality benchmarks, legitimate crediting and rating systems, and stronger regulations (Jones, Reference Jones2024; Pande, Reference Pande2024; Theresia et al., Reference Theresia, Atmadja and Lieberherr2025). The latest science emphasises that both CDR and carbon credits can be appropriately integrated as additional contributions to mitigation efforts, rather than as substitutes for direct emissions reductions, a principle firmly embedded in IPCC reports (Rogelj et al., Reference Rogelj, Shindell, Jiang, Fifita, Forster, Ginzburg, Handa, Kheshgi, Kobayashi, Kriegler, Mundaca, Séférian, Vilariño, Masson-Delmotte, Zhai, Pörtner, Roberts, Skea, Shukla, Pirani, Moufouma-Okia, Péan, Pidcock, Connors, Matthews, Chen, Zhou, Gomis, Lonnoy, Maycock, Tignor and Waterfield2018). One concrete policy recommendation from the European Scientific Advisory Board on Climate Change, is to set separate legally-binding targets for emission reductions, permanent removals and temporary removals (ESABCC, 2025). CDR and VCM are related, but distinct and complementary elements as part of comprehensive mitigation strategies, but their potential is best understood in the context of their limitations.
Nearly four decades after climate policies started to be introduced, climate mitigation has matured as a policy field. Despite the challenges, many jurisdictions have achieved substantial emission reductions, with little or no evidence of substantial negative impacts on social and economic development (Freire-González et al., Reference Freire-González, Padilla Rosa and Raymond2024; Lamb et al., Reference Lamb, Grubb, Diluiso and Minx2022). Insight 10 synthesises key lessons stemming from ongoing experimentation with policy instruments and systematic analyses of ‘what works’ (H. Pearson, Reference Pearson2024; Stechemesser et al., Reference Stechemesser, Koch, Mark, Dilger, Klösel, Menicacci, Nachtigall, Pretis, Ritter, Schwarz, Vossen and Wenzel2024). In particular, evidence shows that carefully designed combinations of policy measures often outperform stand-alone measures, resulting in larger emissions reductions, especially when these include carbon pricing or reduced subsidies for fossil fuels (Dimanchev & Knittel, Reference Dimanchev and Knittel2023; Stechemesser et al., Reference Stechemesser, Koch, Mark, Dilger, Klösel, Menicacci, Nachtigall, Pretis, Ritter, Schwarz, Vossen and Wenzel2024). Importantly, which policy mixes are most effective, vary by sector and national context (Cocker, Reference Cocker2025; Stechemesser et al., Reference Stechemesser, Koch, Mark, Dilger, Klösel, Menicacci, Nachtigall, Pretis, Ritter, Schwarz, Vossen and Wenzel2024). For more on this growing area of policy-relevant research, see What Works Climate Solutions (WWCS, 2025), a scientist-led initiative for international collaboration focused on systematic review and synthesis of effective climate policies.
3.4. Expectations for COP30 and 2026
Insights 1–4 highlight Earth system-level dynamics that appear beyond the control of any governance body; a challenge that afflicts all global or ‘planetary commons’ (Rockström et al., Reference Rockström, Kotzé, Milutinović, Biermann, Brovkin, Donges, Ebbesson, French, Gupta, Kim, Lenton, Lenzi, Nakicenovic, Neumann, Schuppert, Winkelmann, Bosselmann, Folke, Lucht and Steffen2024). The sense of detachment and lack of agency that this situation engenders is what the the Brazilian COP30 Presidency tried to overcome putting forward the framing and strategy of a Global Mutirão, a collective effort, integrating local actions into a unified global movement to reinvigorate multilateralism (COP30 President-Designate, 2025a, 2025b, 2025c). To operationalise this strategy, four “Leadership Circles” were proposed, intended to complement formal negotiations, generate political momentum, enhance inclusivity, and bridge gaps in implementation. One of these circles is led by the UN Secretary-General and the Brazilian President, and is designed to complement the technical Global Stocktake (GST) with an ethical and values-based assessment of climate action and implementation gaps. This Global Ethical Stocktake aims to drive ambitious NDCs that implement GST outcomes, supporting the ‘UAE Consensus’ to transition away from fossil fuels and tripling renewables (UNFCCC, 2023).
The severity of impacts illustrated on Insights 5–7, especially in the context of looming risks of an accelerating dynamic suggested by Insights 1–4, underscore arguments for ambitious climate action raised by some Parties to the UNFCCC. On mitigation, key tasks at after COP29 revolve around defining the structure of the ‘Ambition Cycle’, providing guidance for Parties to implement the GST outcomes, and defining the role and mandate of the Mitigation Work Programme (MWP) after 2025 [See Note S7 for a brief explanation of these terms]. These issues, especially the first two, are core elements of how the Paris Agreement was originally designed, and addressing them successfully is an important step for course correction.
Forests and their role in stabilising the climate featured prominently in the lead-up to COP30, something that is well supported by Insights 3 and 4. In this regard, another outcome of the GST featured prominently in the lead up to COP30 given its centrality to achieving Paris Agreement temperature goals is the halting and reversing deforestation and forest degradation by 2030. Brazil's flagship initiative is the long-announced Tropical Forests Forever Facility (TFFF), a mechanism to provide long-term, predictable funding for tropical forest conservation through payments for verified deforestation reduction and forest restoration. Moreover, The COP30 Presidency has repeatedly emphasised its vision to “address, in a comprehensive and synergetic manner, the interlinked global crises of climate change and biodiversity loss in the broader context of achieving the [Sustainable Development Goals]” (COP30 President-Designate, 2025d). One of the ‘Leadership Circles’ will convene former UNFCCC COP presidents (from COP21 to COP29) alongside current Presidents of the other Rio Conventions (UNCBD and UNCDD), creating a unique opportunity for advancing towards the integration of the Convention agendas (Bustamante et al., Reference Bustamante, Roy, Ospina, Achakulwisut, Aggarwal, Bastos, Broadgate, Canadell, Carr, Chen, Cleugh, Ebi, Edwards, Farbotko, Fernández-Martínez, Frölicher, Fuss, Geden, Gruber and Zscheischler2023) and a closer collaboration between the IPCC and IPBES (Pörtner et al., Reference Pörtner, Scholes, Agard, Archer, Bai, Barnes, Burrows, Chan, Cheung, Diamond, Donatti, Duarte, Eisenhauer, Foden, Gasalla, Handa, Hickler, Hoegh-Guldberg, Ichii and Ngo2021, Reference Pörtner, Scholes, Arneth, Barnes, Burrows, Diamond, Duarte, Kiessling, Leadley, Managi, McElwee, Midgley, Ngo, Obura, Pascual, Sankaran, Shin and Val2023).
On Adaptation, COP30 saw the conclusion of work on indicators for the Global Goal on Adaptation (GGA). The expert groups on the UAE-Belém Work Programme refined an initial list of over 9000 potential indicators down to 100 globally applicable indicators to inform decisions regarding adaptation progress measurement (UNFCCC, 2025b). Some of which connect directly to insights 5–7:
• Groundwater availability: Under target 9(a) “Significantly reducing climate-induced water scarcity and enhancing climate resilience to water-related hazards”: Change in water stress levels over time (Indicator 9a01), Change in water-use efficiency over time (Indicator 9a02), and Proportion of bodies of water with good ambient water quality (Indicator 9a08).
• Dengue incidence: Under target 9(c) ‘Attaining resilience against climate change related health impacts, promoting climate-resilient health services and significantly reducing climate-related morbidity and mortality’: Change in the incidence of climate-sensitive infectious diseases (Indicator 9c02) and Early Warning Systems [in health] (Indicator 9c08) is directly tied to managing outbreaks related to climate impacts.
• Labour productivity: Also under target 9(c): Change in the annual rate of reported heat-related occupational injuries and deaths (Indicator 9c03). As well as indicators under other targets: on vulnerable labour force (Indicator 9f04), and on labour and agricultural income (Indicator 9b09).
Other priorities on the Adaptation agenda include strengthening implementation mechanisms of National Adaptation Plans (NAPs), clarifying the role of the ‘Baku Adaptation Roadmap’, and securing adaptation finance at adequate levels.
The COP30 Presidency aimed to position this as an ‘implementation COP’, implying a focus on assessing why existing climate commitments are not being fully implemented. Discussions on the need for COP reforms for this new “post-negotiation phase” will continue after Belém. Inevitably, climate finance will remain front and centre. At COP29, an aspirational goal was set to scale climate finance for developing countries to 1.3 trillion USD annually by 2035. The ‘Baku to Belém Roadmap’ has the purpose of defining how to achieve this goal, laying out clear actions, milestones, and yearly targets. Beyond finance, much of the necessary political and technical work to accelerate implementation has to be focused on the NDCs and NAPs. There is a rich knowledge base on available climate policy instruments and a wealth of lessons to design and successfully implement ambitious policy mixes (Insight 10). The Climate Policy Explorer (PIK, 2024), which helps to make the outcomes of the WWCS (2025) more accessible, is an example of a tool to make this knowledge more accessible for policymakers, and could be gainfully shared with the Parties.
Finally, Insights 8 and 9 highlight opportunities to improve implementation and accountability: integrity and credibility in VCMs, and closing the ‘CDR gap’. Moving forward, developments around Articles 4, 5, and 6 of the Paris Agreement (on Mitigation, LULUCF, and carbon markets, respectively) should stress the role of CDR as complementary to, rather than a substitute for, deep emissions cuts. Both the NDCs and corporate disclosures should transparently distinguish emissions reductions from actual removals, removal projects from ‘avoidance’ projects, and between CDR types, storage durability, and social and environmental safeguards, and alignment with the ongoing operationalisation of Article 6. For this purpose, technical work could be requested to the Subsidiary Bodies (SBSTA and SBI) to develop guidance for NDCs, as well as protocols for MRV (Measurement, Reporting, Verification) for removals. Parties could formally recognise and give preference to high-integrity credits, such as those following Core Carbon Principles (CCPs, developed by the Integrity Council for the Voluntary Carbon Market, ICVCM) [See Note S7].
Together, these 10 insights illustrate the rapidly evolving and increasingly concerning state of the climate, emphasising the importance of scientific evidence in informing policy and guiding a course correction. Advancing the alignment between scientific knowledge and decision-making stands out as the central priority of the 10 New Insights in Climate Science by disseminating recent findings and fostering trust in science to inspire more informed policy responses and advance climate action.
Supplementary material
The supplementary material for this article can be found at https://doi.org/10.1017/sus.2025.10043.
Acknowledgements
A special thanks to Elsa Wikander and Jerker Lokrantz from Azote for their excellent work on Figures 1–10. Any use of trade, firm, or product names is for descriptive purposes only and does not imply endorsement by the U.S. Government.
Author contributions
A.B., W.B., M.B., D.C., P.C., K.E., P.F., S.F., N.G., M.H., S.J., F.K., S.K., S.L., Å.P., H.P., J.Ro, R.R., R.S.-R., P.S., Y.S., T.S., and D.T. constituted the editorial board, selected the insights, and provided initial guidance on the outlines. D.O. and P. M. led the overall writing. Investigation and writing for each insight: R.P.A., H.F.G., Ø.H, M.A.M. (insight 1); Y.J.C., T.L.F., Q.H., S.H., C.J.M., K.E.S. (insight 2); G.H., D.I.K., P.K., S.R., J.Ra., L.W., A.M.V. (insight 3); L.A.D., A.H., G.G.M., A.S.M., E.R., S.R.W. (insight 4); S.B., N.B., J.L., H.J.S. (insight 5); N.H., S.J.R., J.C.S., G.B.S. (insight 6); M.K., V.M., J.M., A.C.R., S.Z. (insight 7); W.F.L., C.N.M., C.F.S., D.T.S., H.C.W. (insight 8); D.J.B., N.K., B.S.P., S.I.-T., G.P.T. (insight 9); W.A.S., A.S., S.H.L.S. (insight 10). Additional investigation and writing, as well as coordination for each insight: M.A.M. (insight 1), S.H. (insight 2), L.W. (insight 3), A.H. (insight 4), S.B. (insight 5), G.B.S. (insight 6), A.C.R. (insight 7), H.C.W. (insight 8), N.K. (insight 9), S.H.L.S. (insight 10). D.O. and P.M. coordinated the overall process.
Financial support
This work was supported by the Research Councils UK (RCUK) National Centre for Earth Observation (R.P.A., grants NE/R016518/1 and NE/Y006216/1; C.J.M., grant NE/RO16518/1); Divecha Centre for Climate Change (S.B.); U.S. Geological Survey South Central Climate Adaptation Science Center (N.B. grant G24AC00439.; Korea Meteorological Administration Research and Development Program (Y.J.C., grant RS-2024-00404973); National Natural Science Foundation of China (Q.H., grants 42,276,186 and 42,276,027); European Space Agency (S.H.); Schmidt Sciences CALIPSO project and the Swedish Research Council VR (G.H., grant 2022-04839); Marie Curie Postdoctoral Fellowship (M.K., grant 101,148,359); European Union ERC-2020-SyG ‘GENIE’ (W.F.L., grant 951,542); Japan Science and Technology Agency (A.S.M., grant JPMJRS23I4); Environment Research and Technology Development Fund of the Environmental Restoration and Conservation Agency, provided by the Ministry of the Environment of Japan (A.S.M., grant JPMEERF20234002); Swedish Academy of Science/Formas (J.Ra, grant FR-2021/0004); European Union Horizon Europe Programme (S.F.,UPTAKE project grant 101,081,521; J.Ra., ILLUQ project grant 101,133,587; C.F.S., SPARCCLE project grant 101,081,369; J.C.S., IDAlert project grant 101,057,554 and BEPREP project grant 101,060,568); University Research Council Accredited Research Groupings JRF Awards (E.R.); Kubota Corporation and The University of Tokyo university–corporate collaboration agreement (G.B.S.); Werner Siemens Foundation (A.H.S.); and Zhejiang Provincial Natural Science Foundation (S.Z., grant LQN25D050002). A.M.V. acknowledges funding catalysed by the TED Audacious Project (Permafrost Pathways) and the Gordon and Betty Moore Foundation (grant 8414). S.J.R. was supported by the U.S. National Science Foundation (CIBR: VectorByte: A Global Informatics Platform for studying the Ecology of Vector-Borne Diseases, grant DBI 2,016,265; and APPEX, the NSF Center for the Analysis and Prediction of Pandemic Expansion, grant DBI 2,412,115). Any opinions, findings, and conclusions or recommendations expressed in this material are those of the author(s) and do not necessarily reflect the views of the National Science Foundation.
OA Funding statement
Open access funding provided by Max Planck Society.
Competing interest
Three of the co-authors hold editorial positions at Global Sustainability. S.J. is a Deputy Editor, G.S. is a Section Editor and J.R. is a member of the Advisory Board. None of these authors were involved in the review of this manuscript or have any influence over editorial decisions regarding its outcome.
Data availability
All potential additional resources such as data, materials and protocols (if not referenced in the paper or provided in the Supplementary material) can be requested via email to the corresponding author.
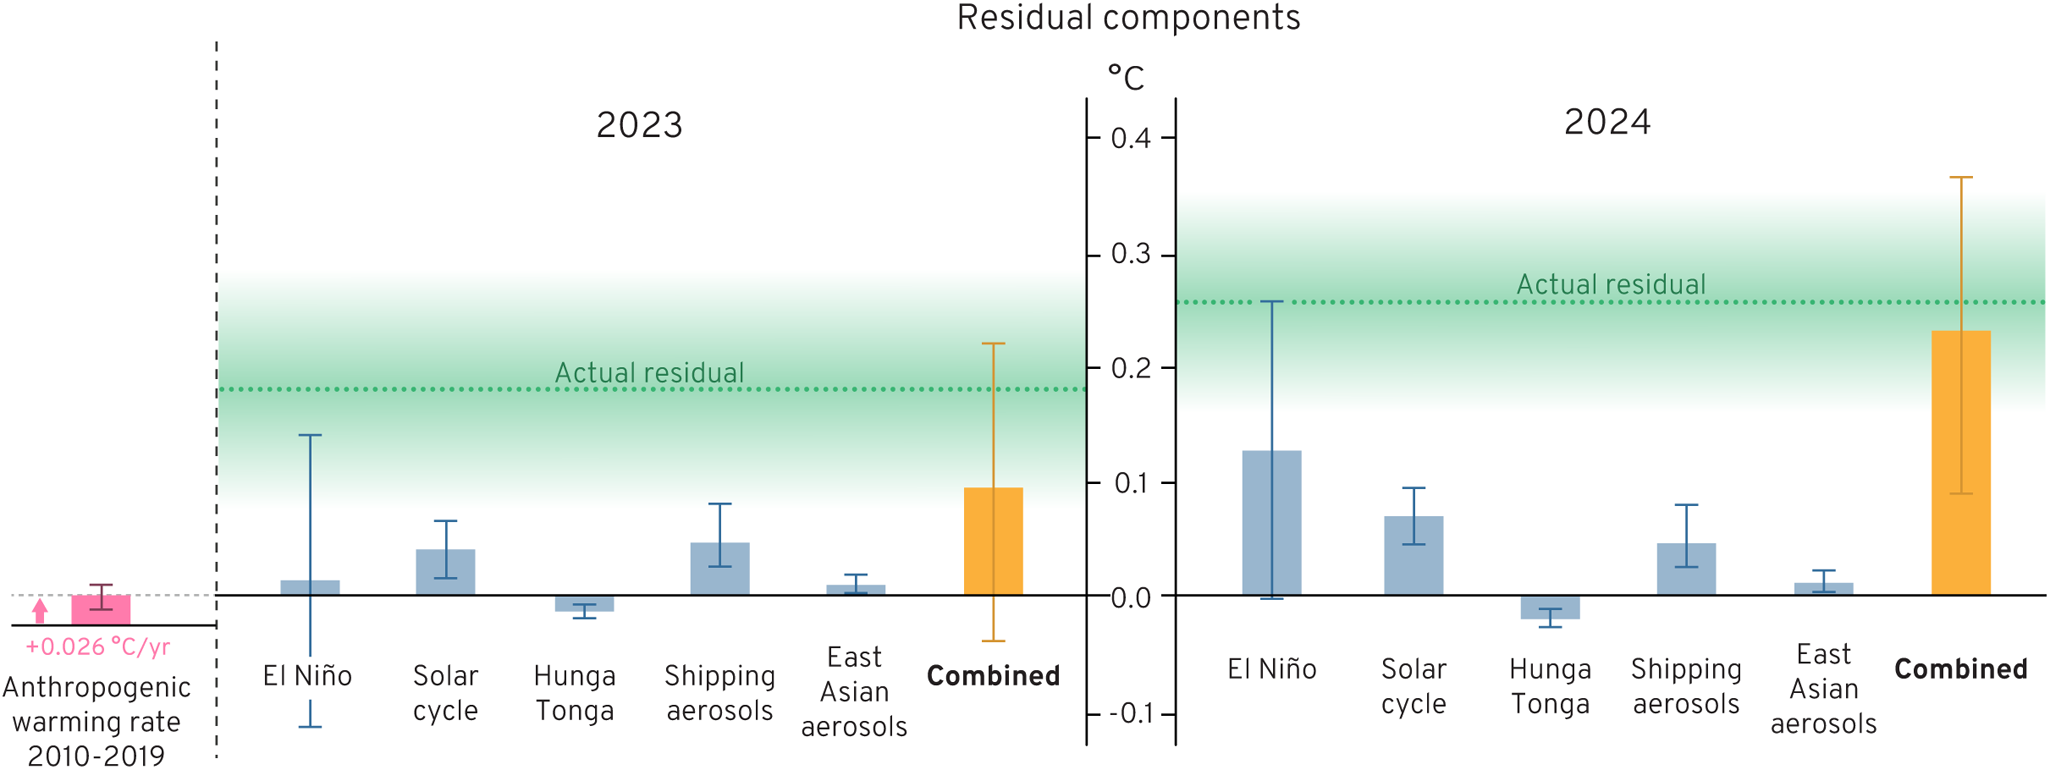
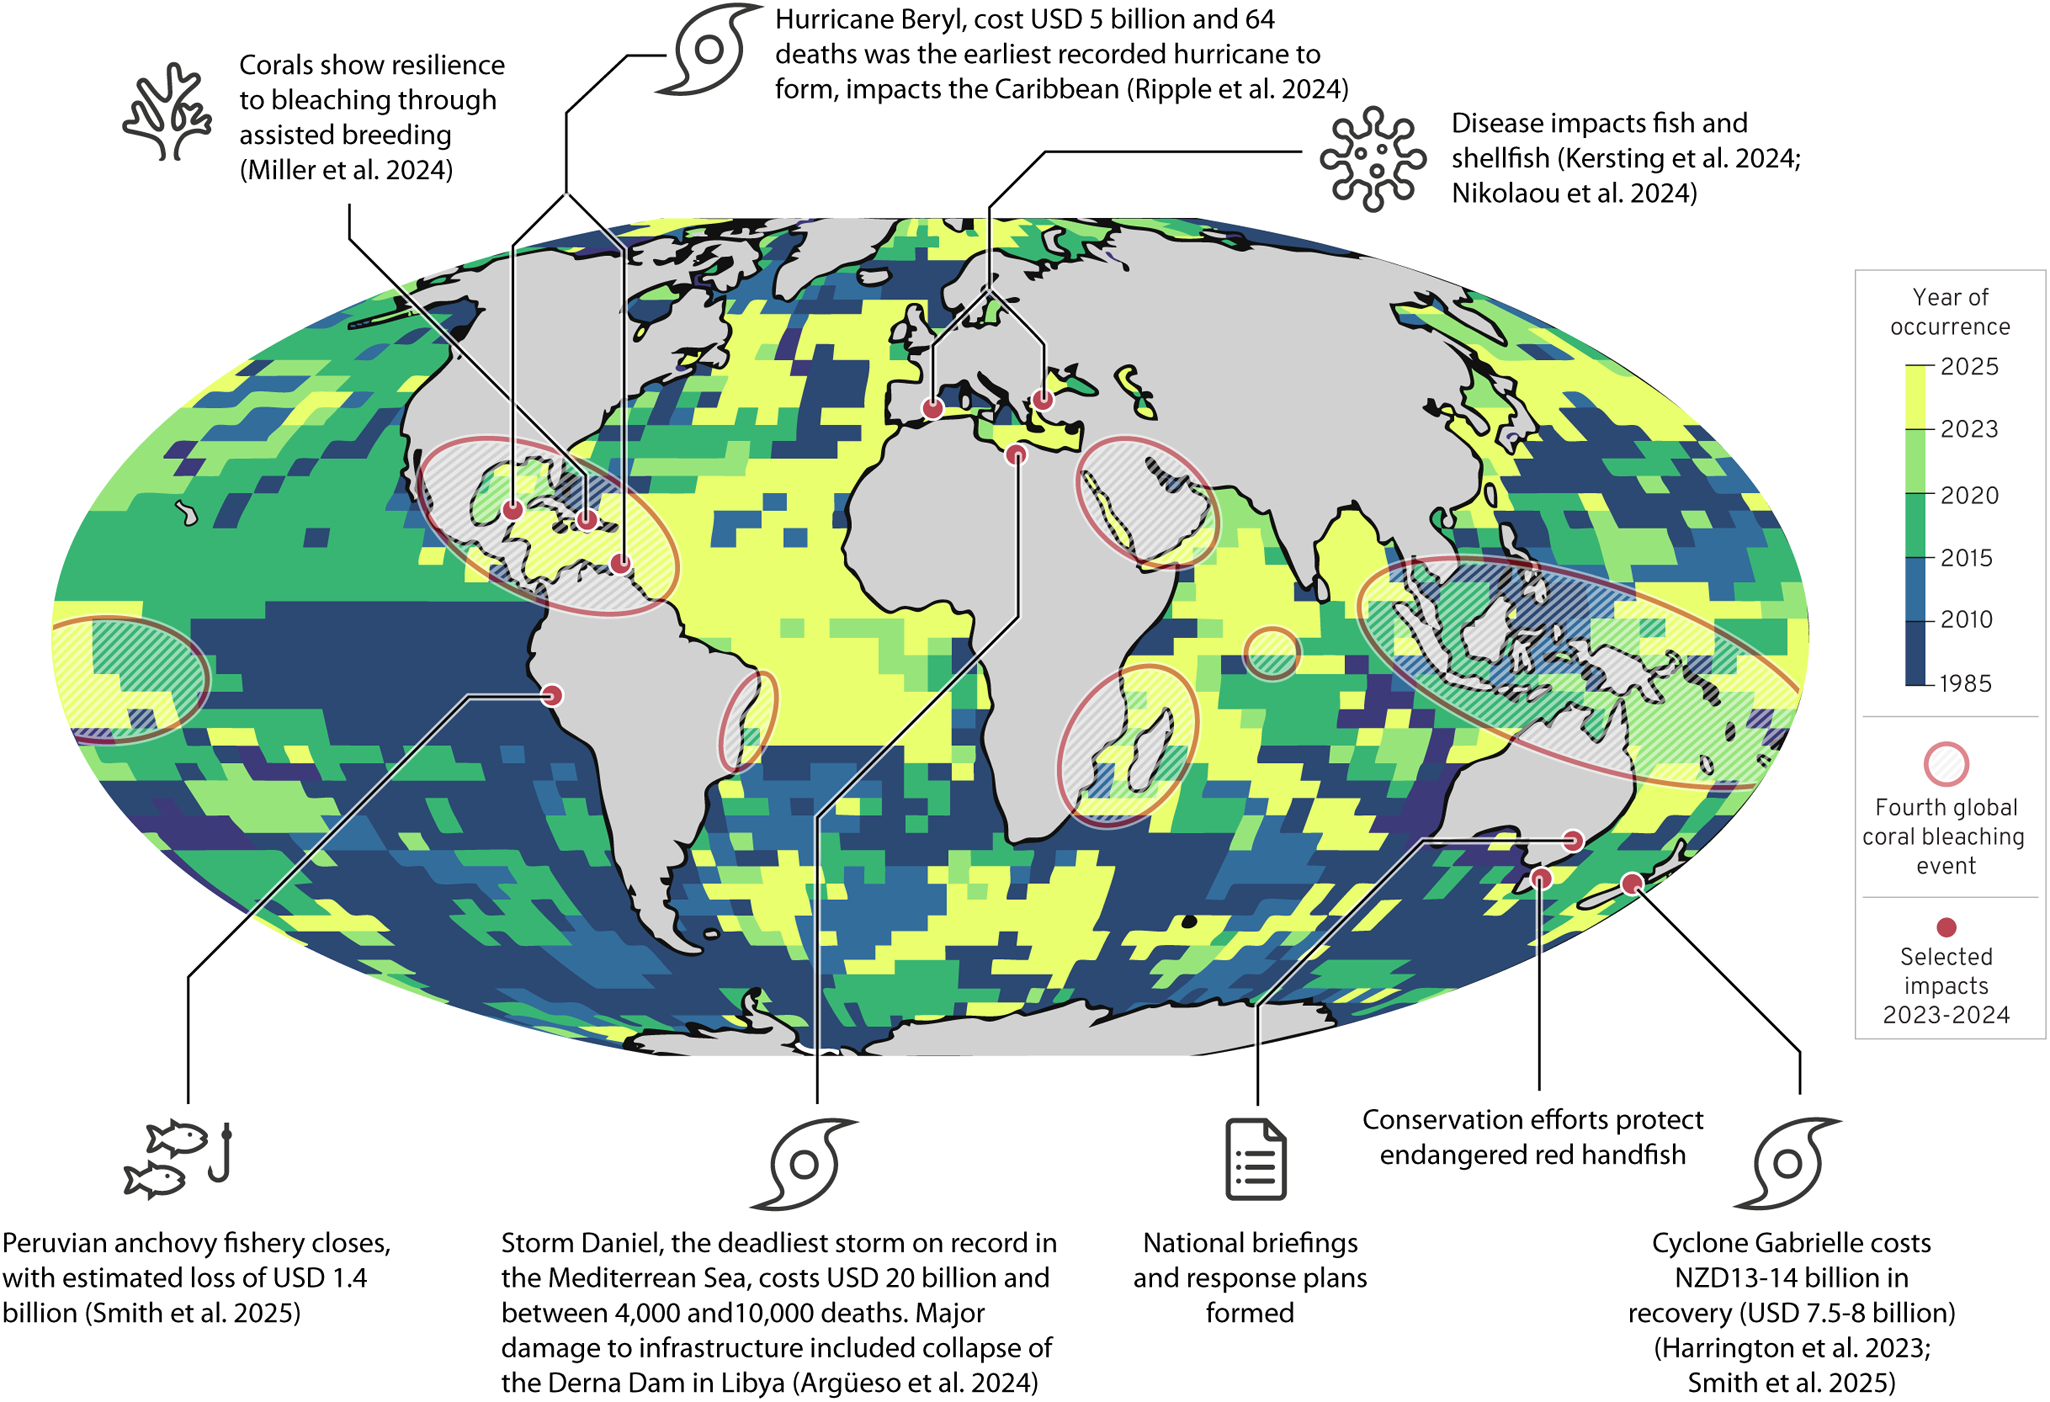
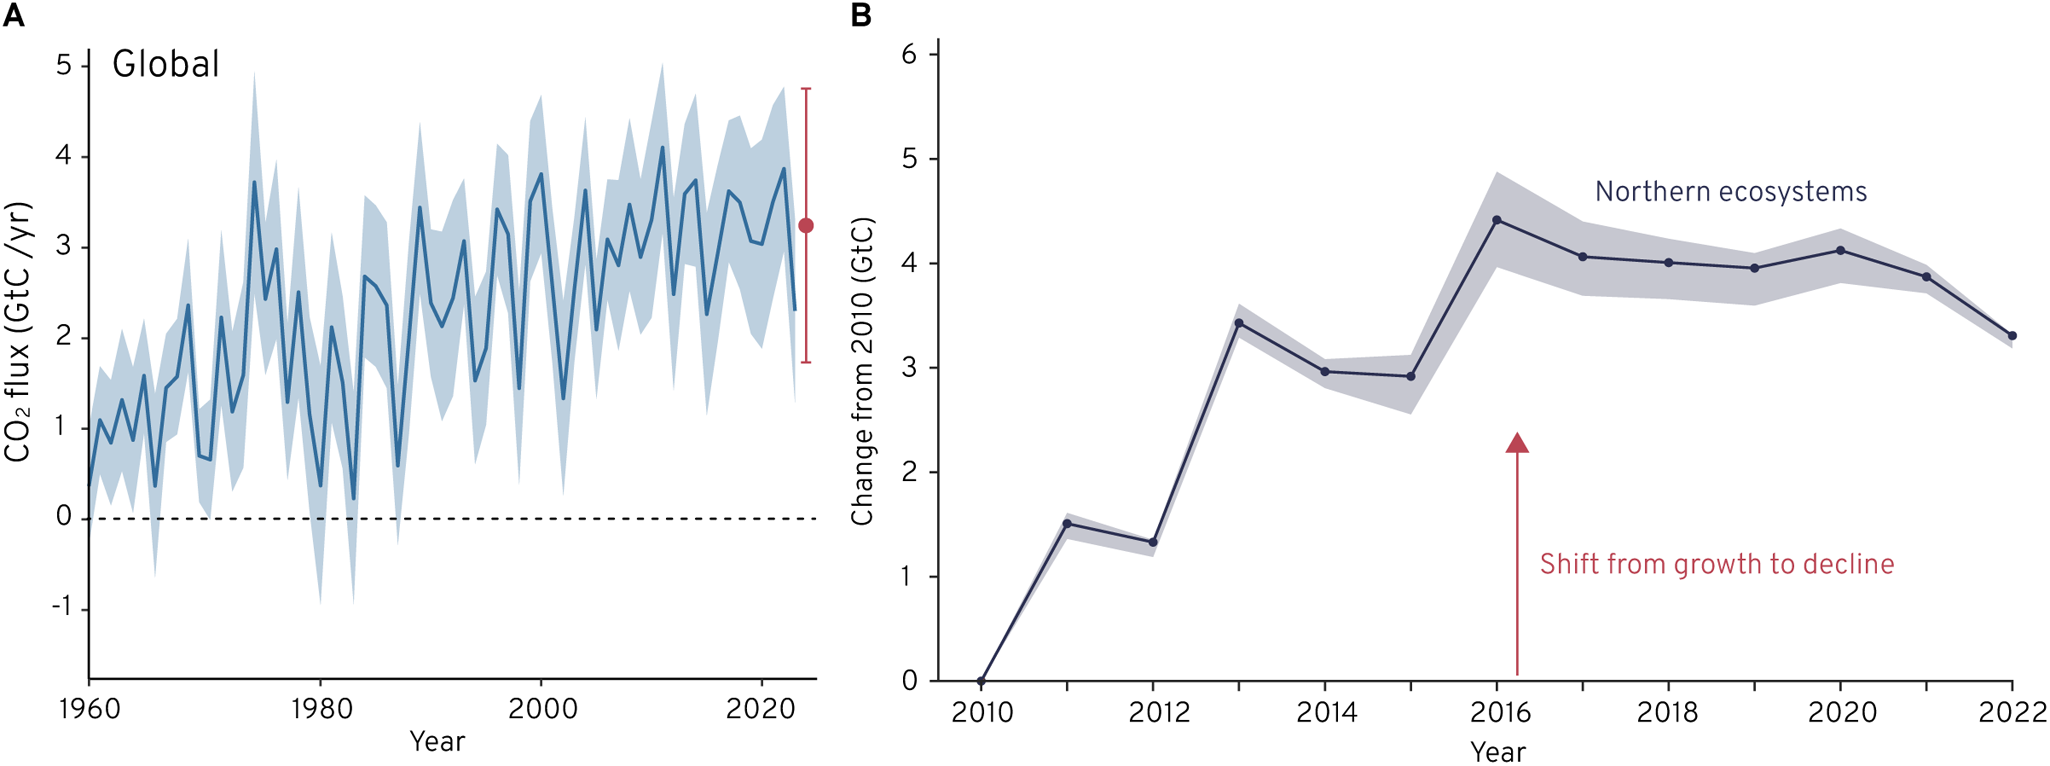
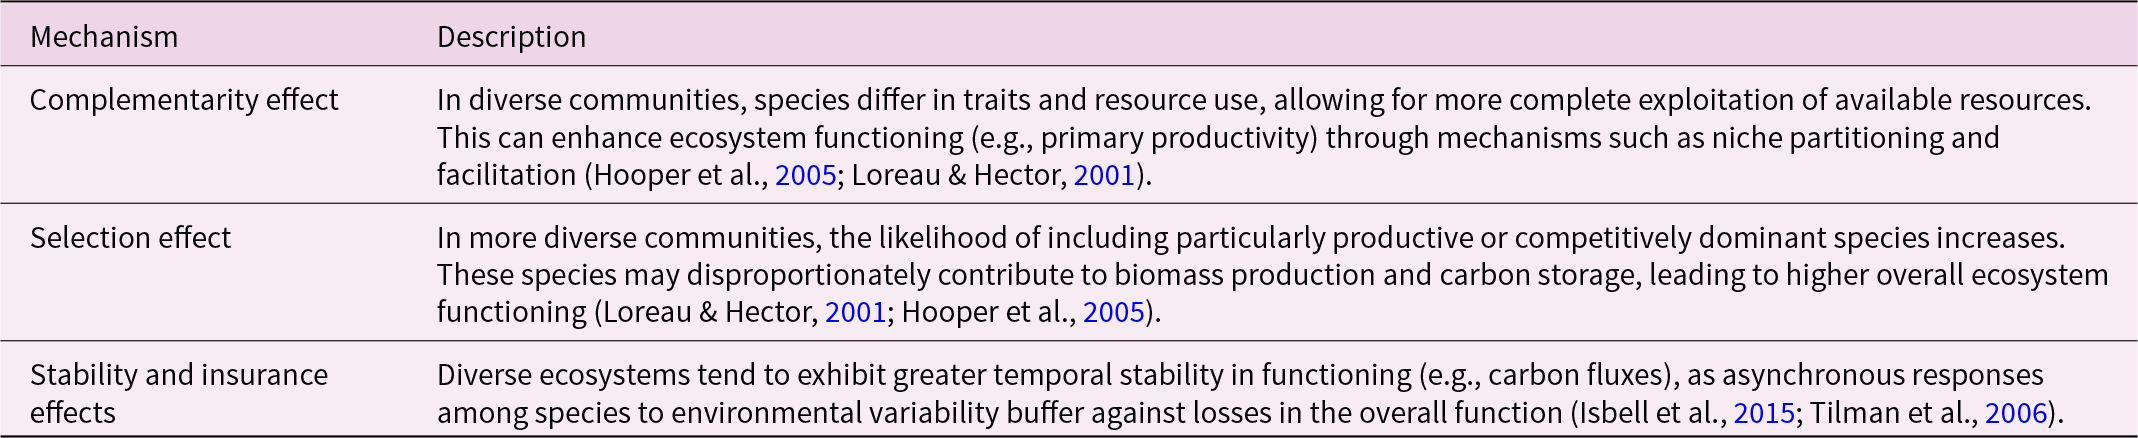
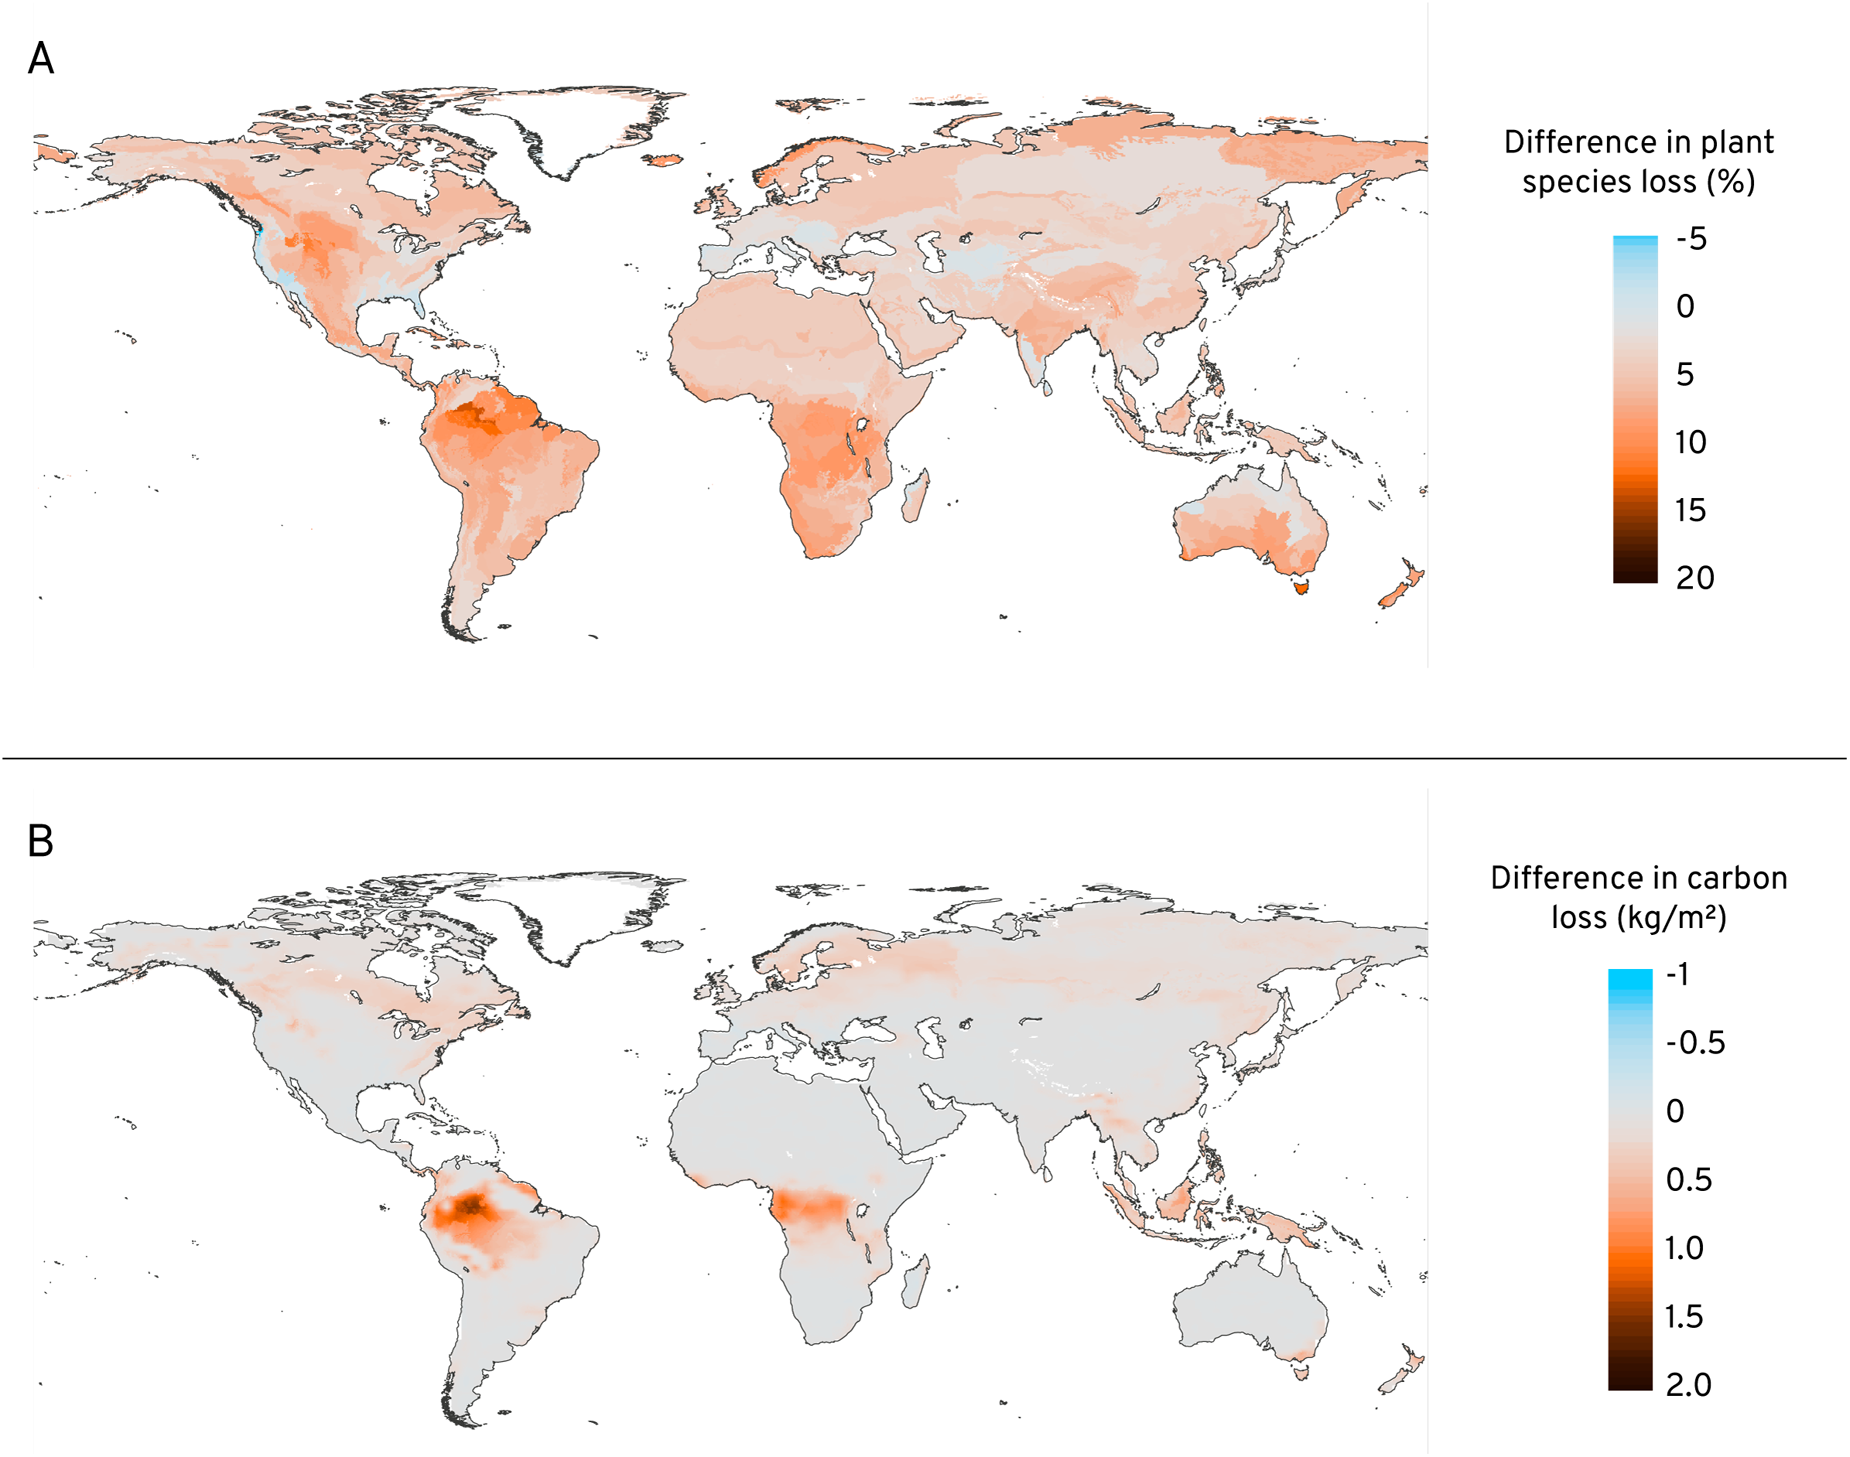
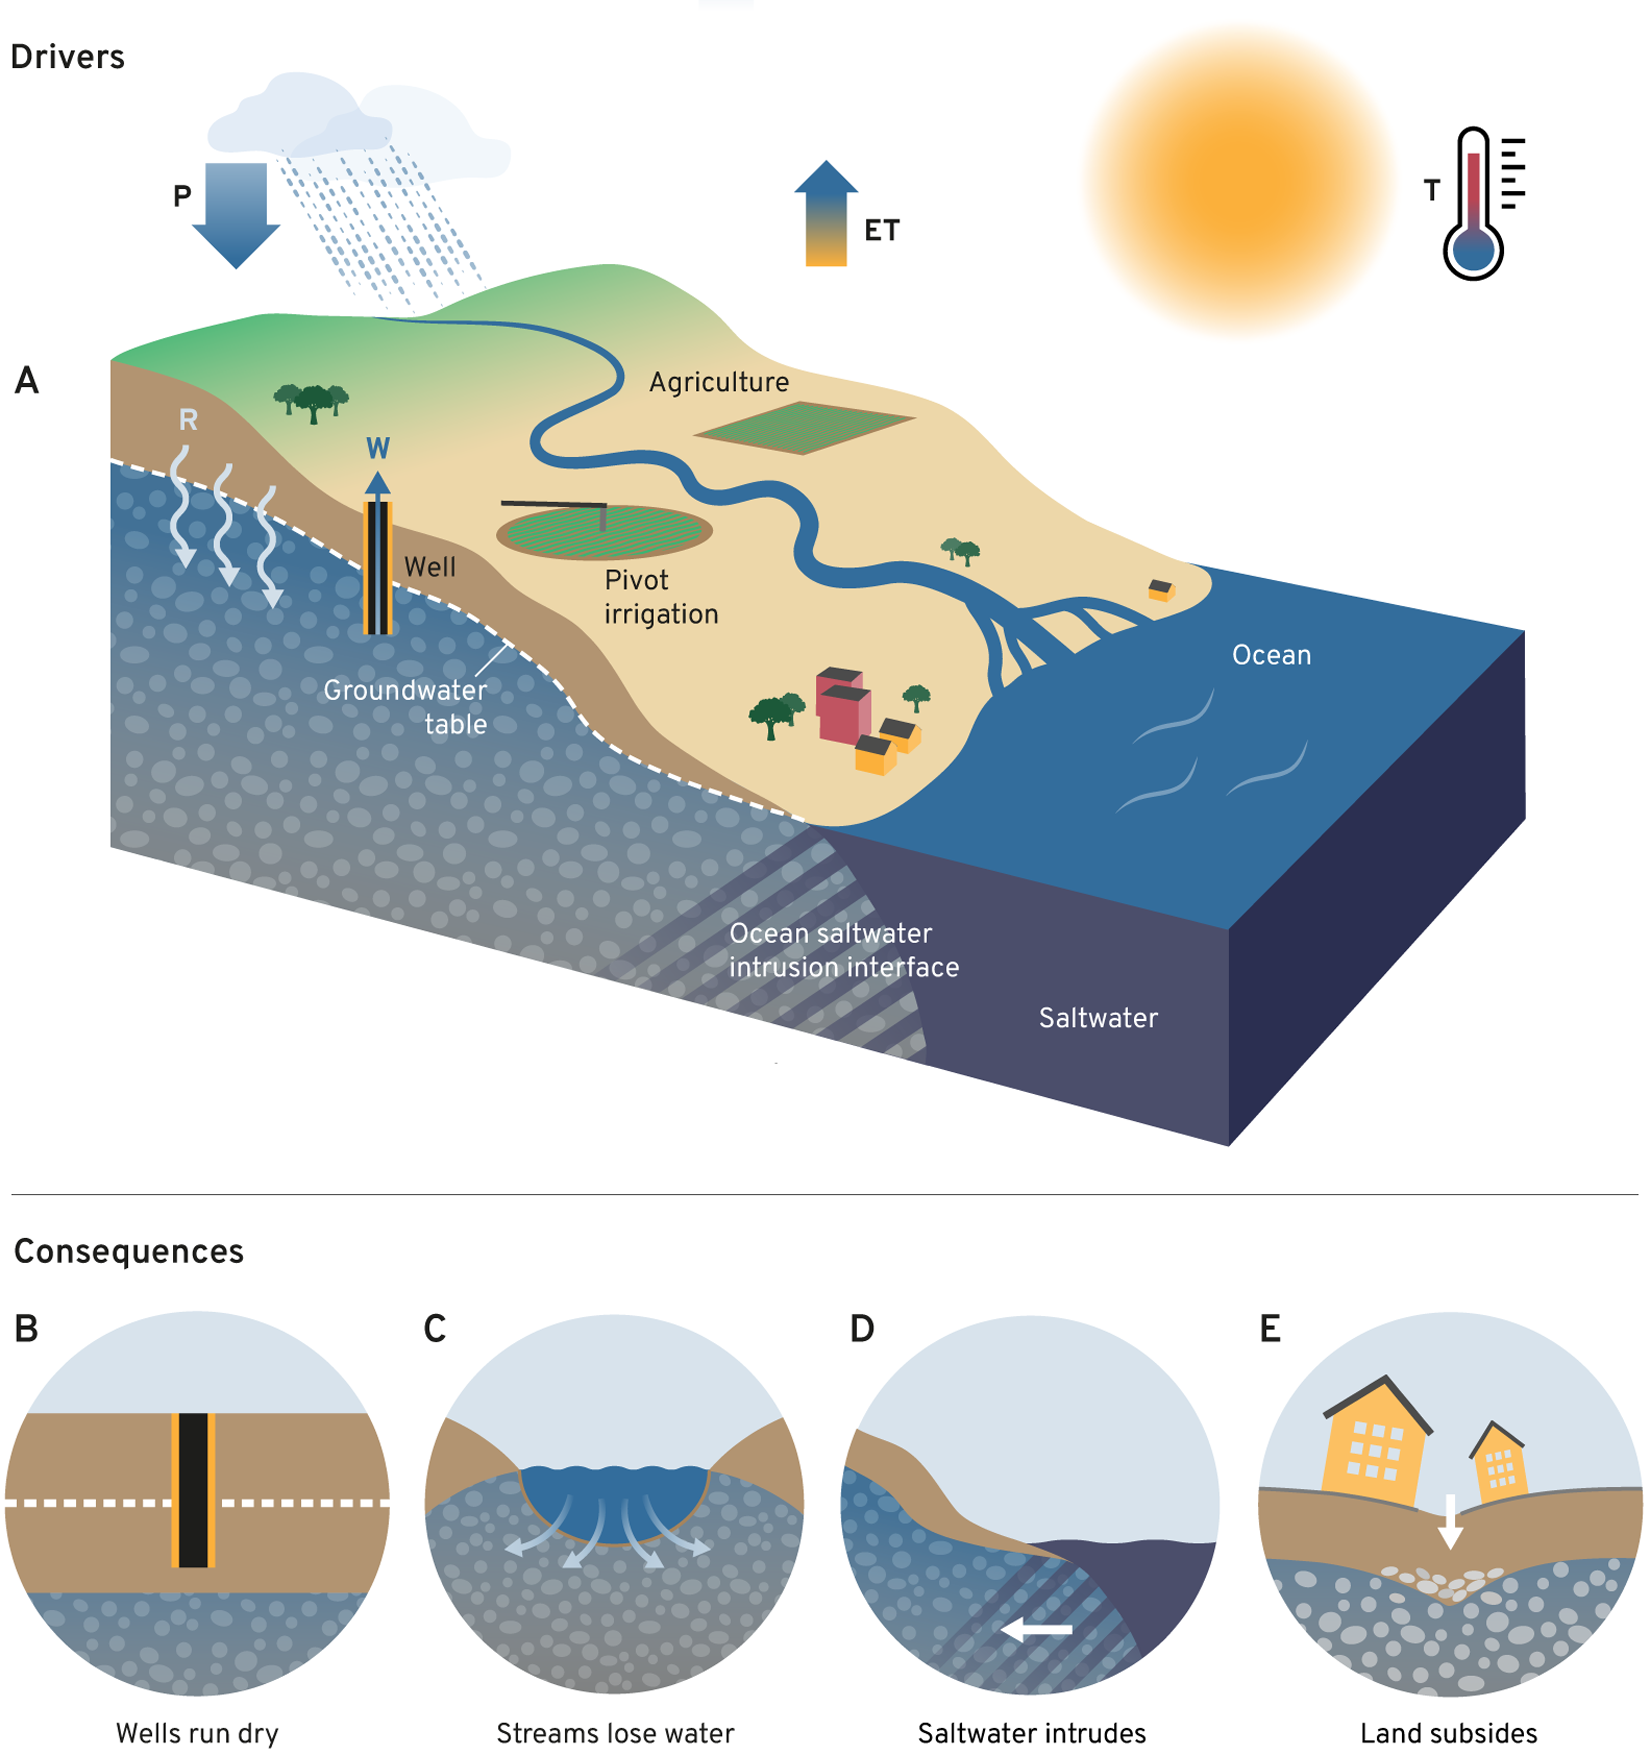
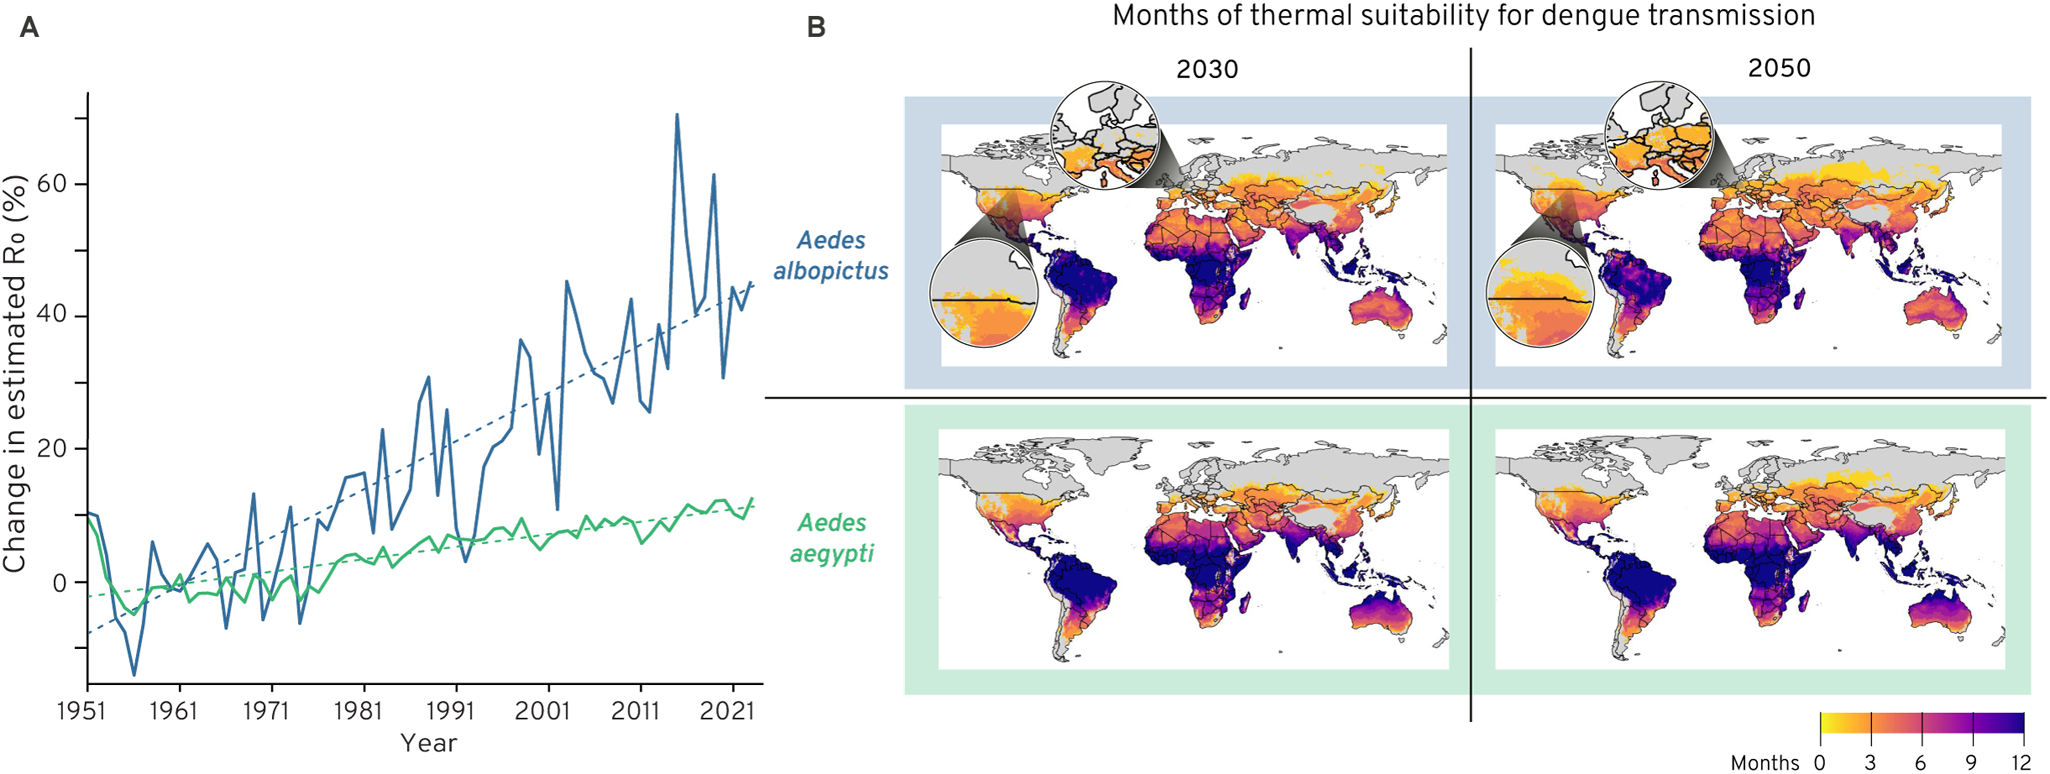
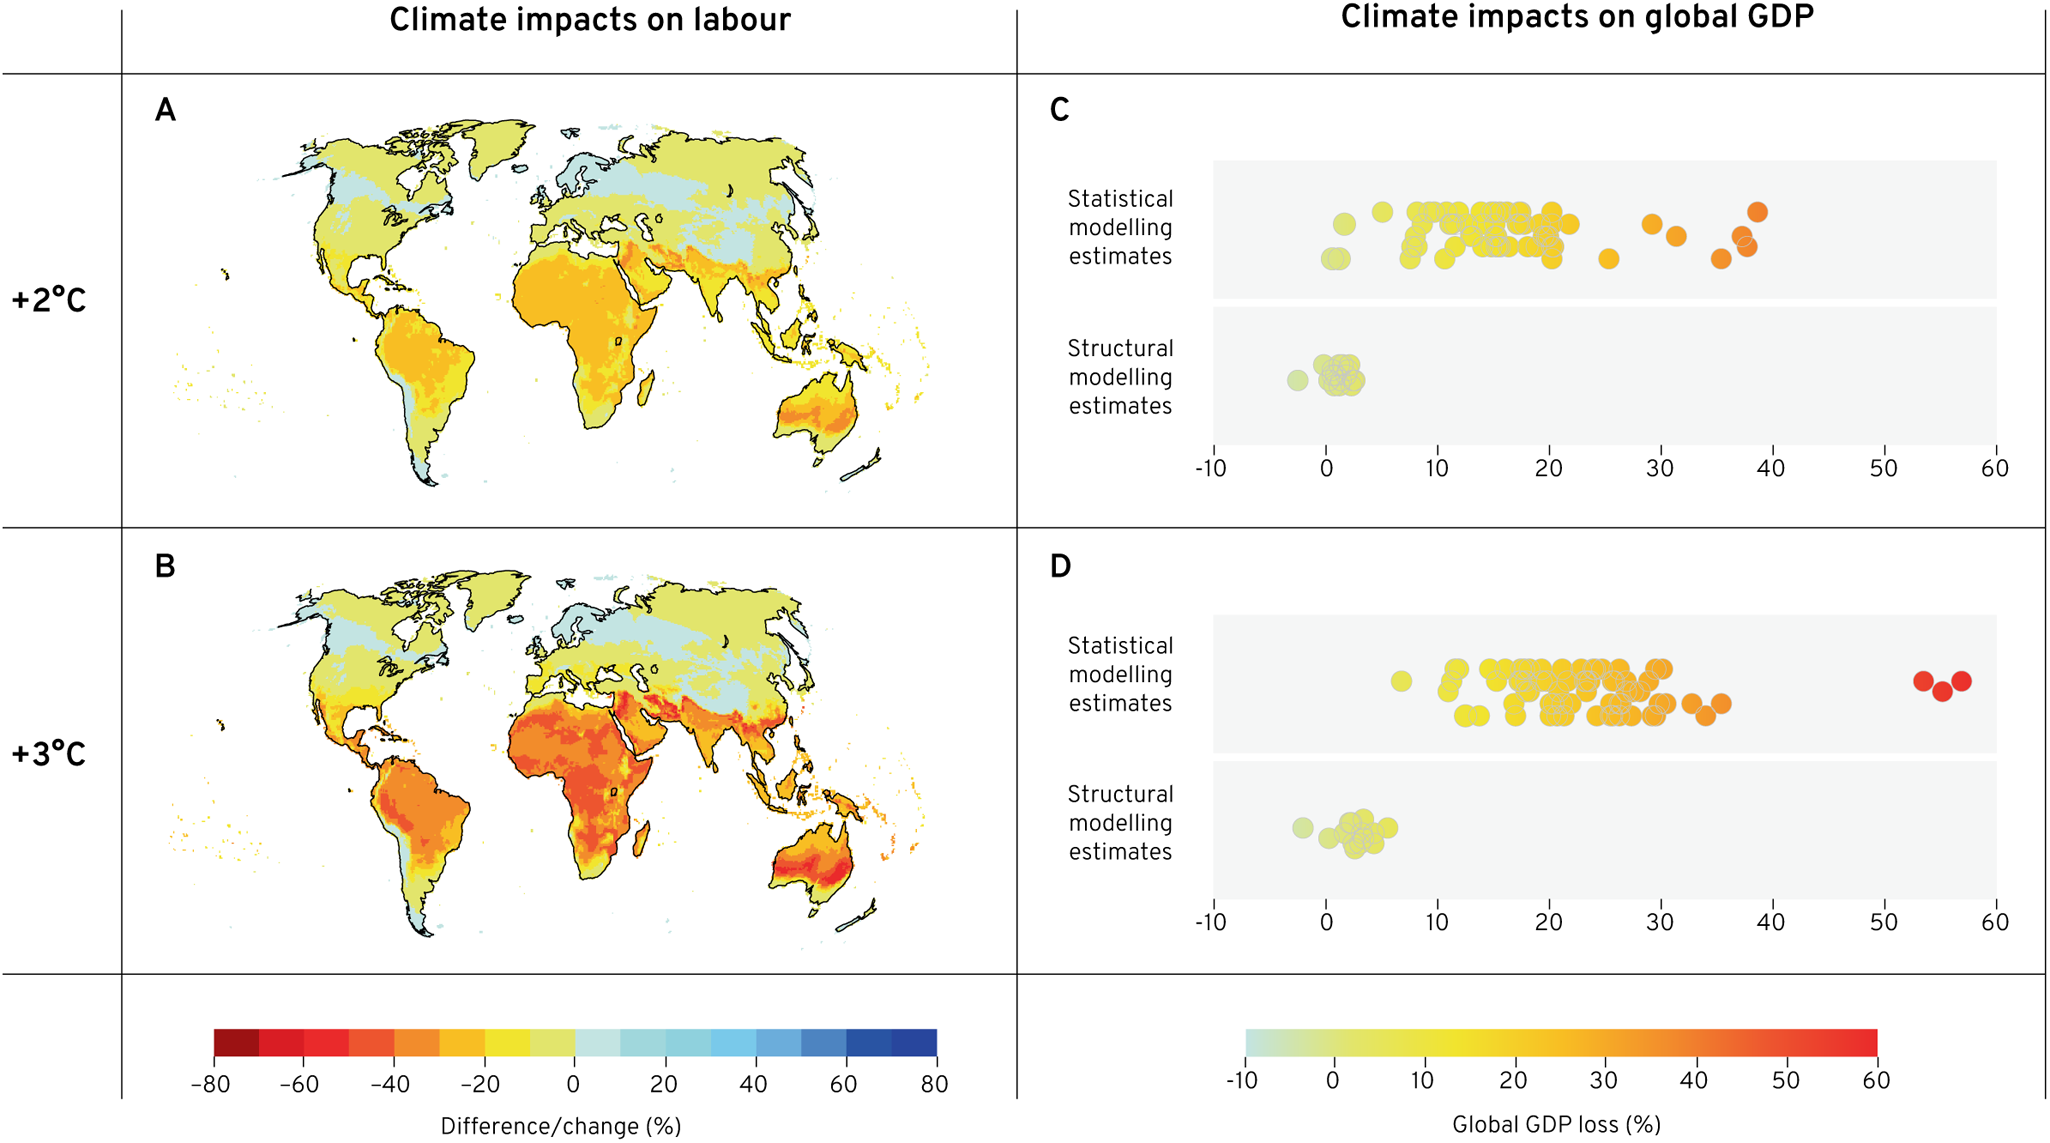
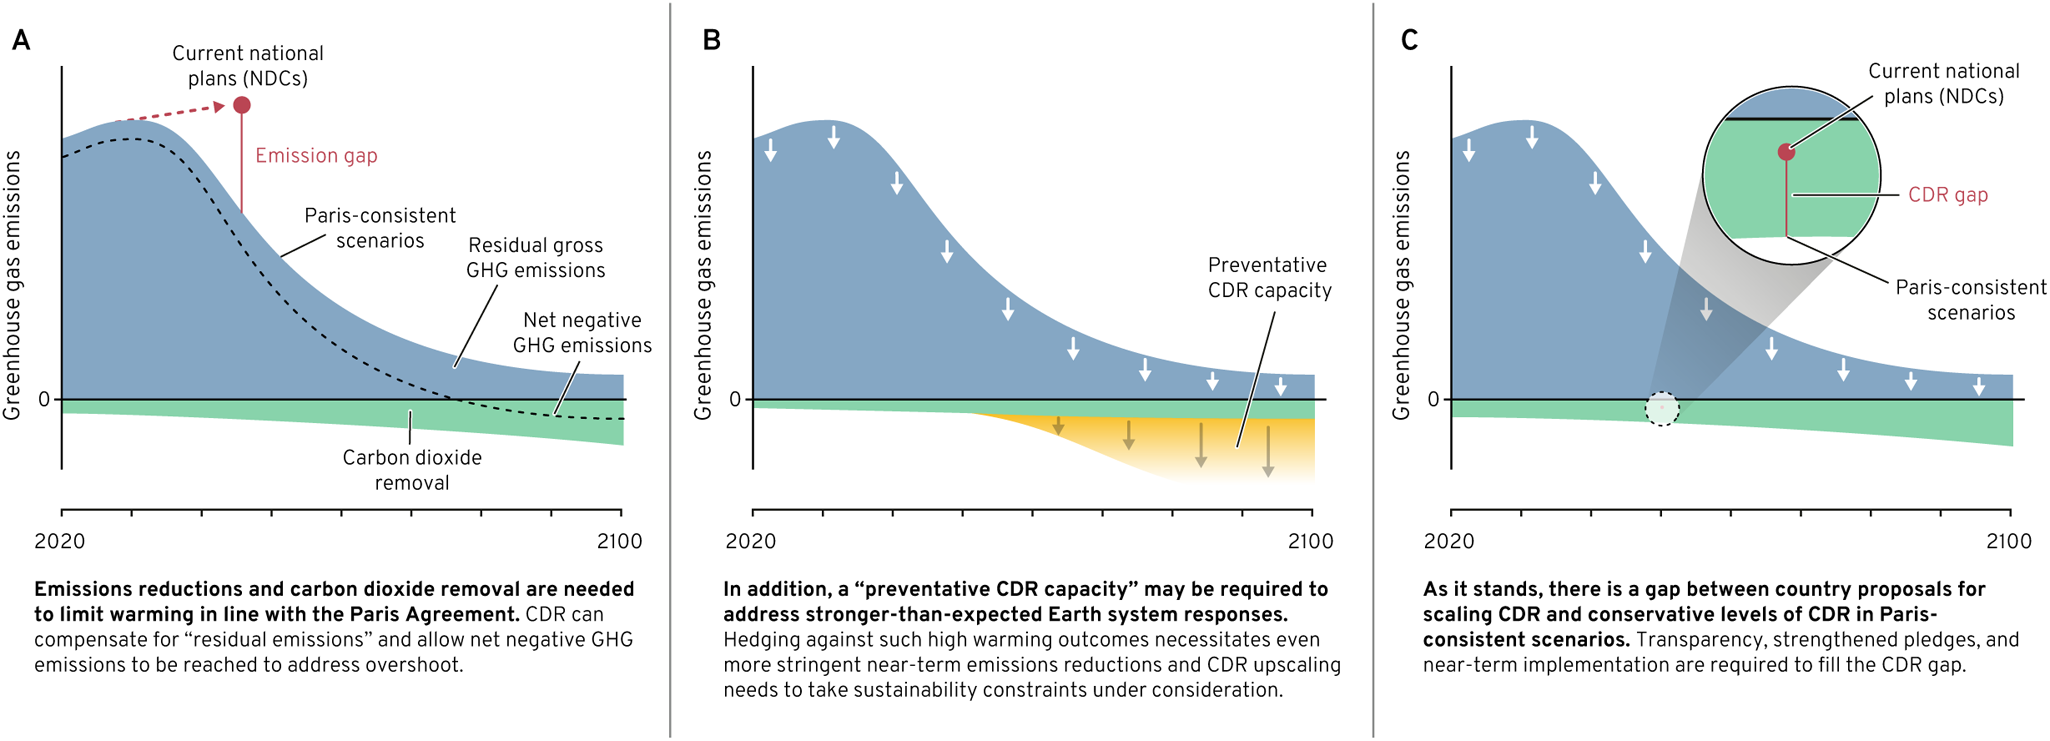
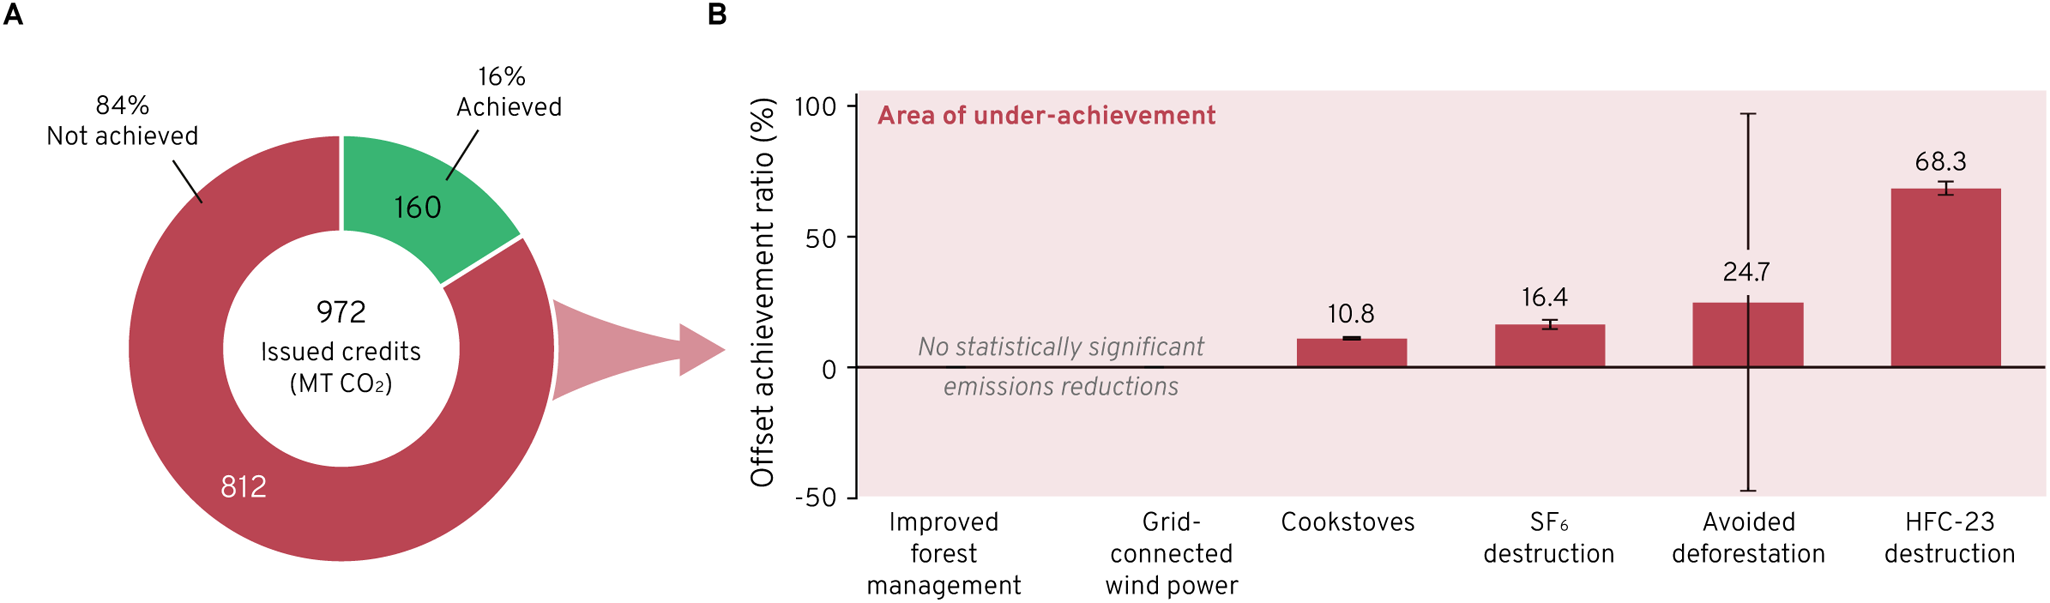
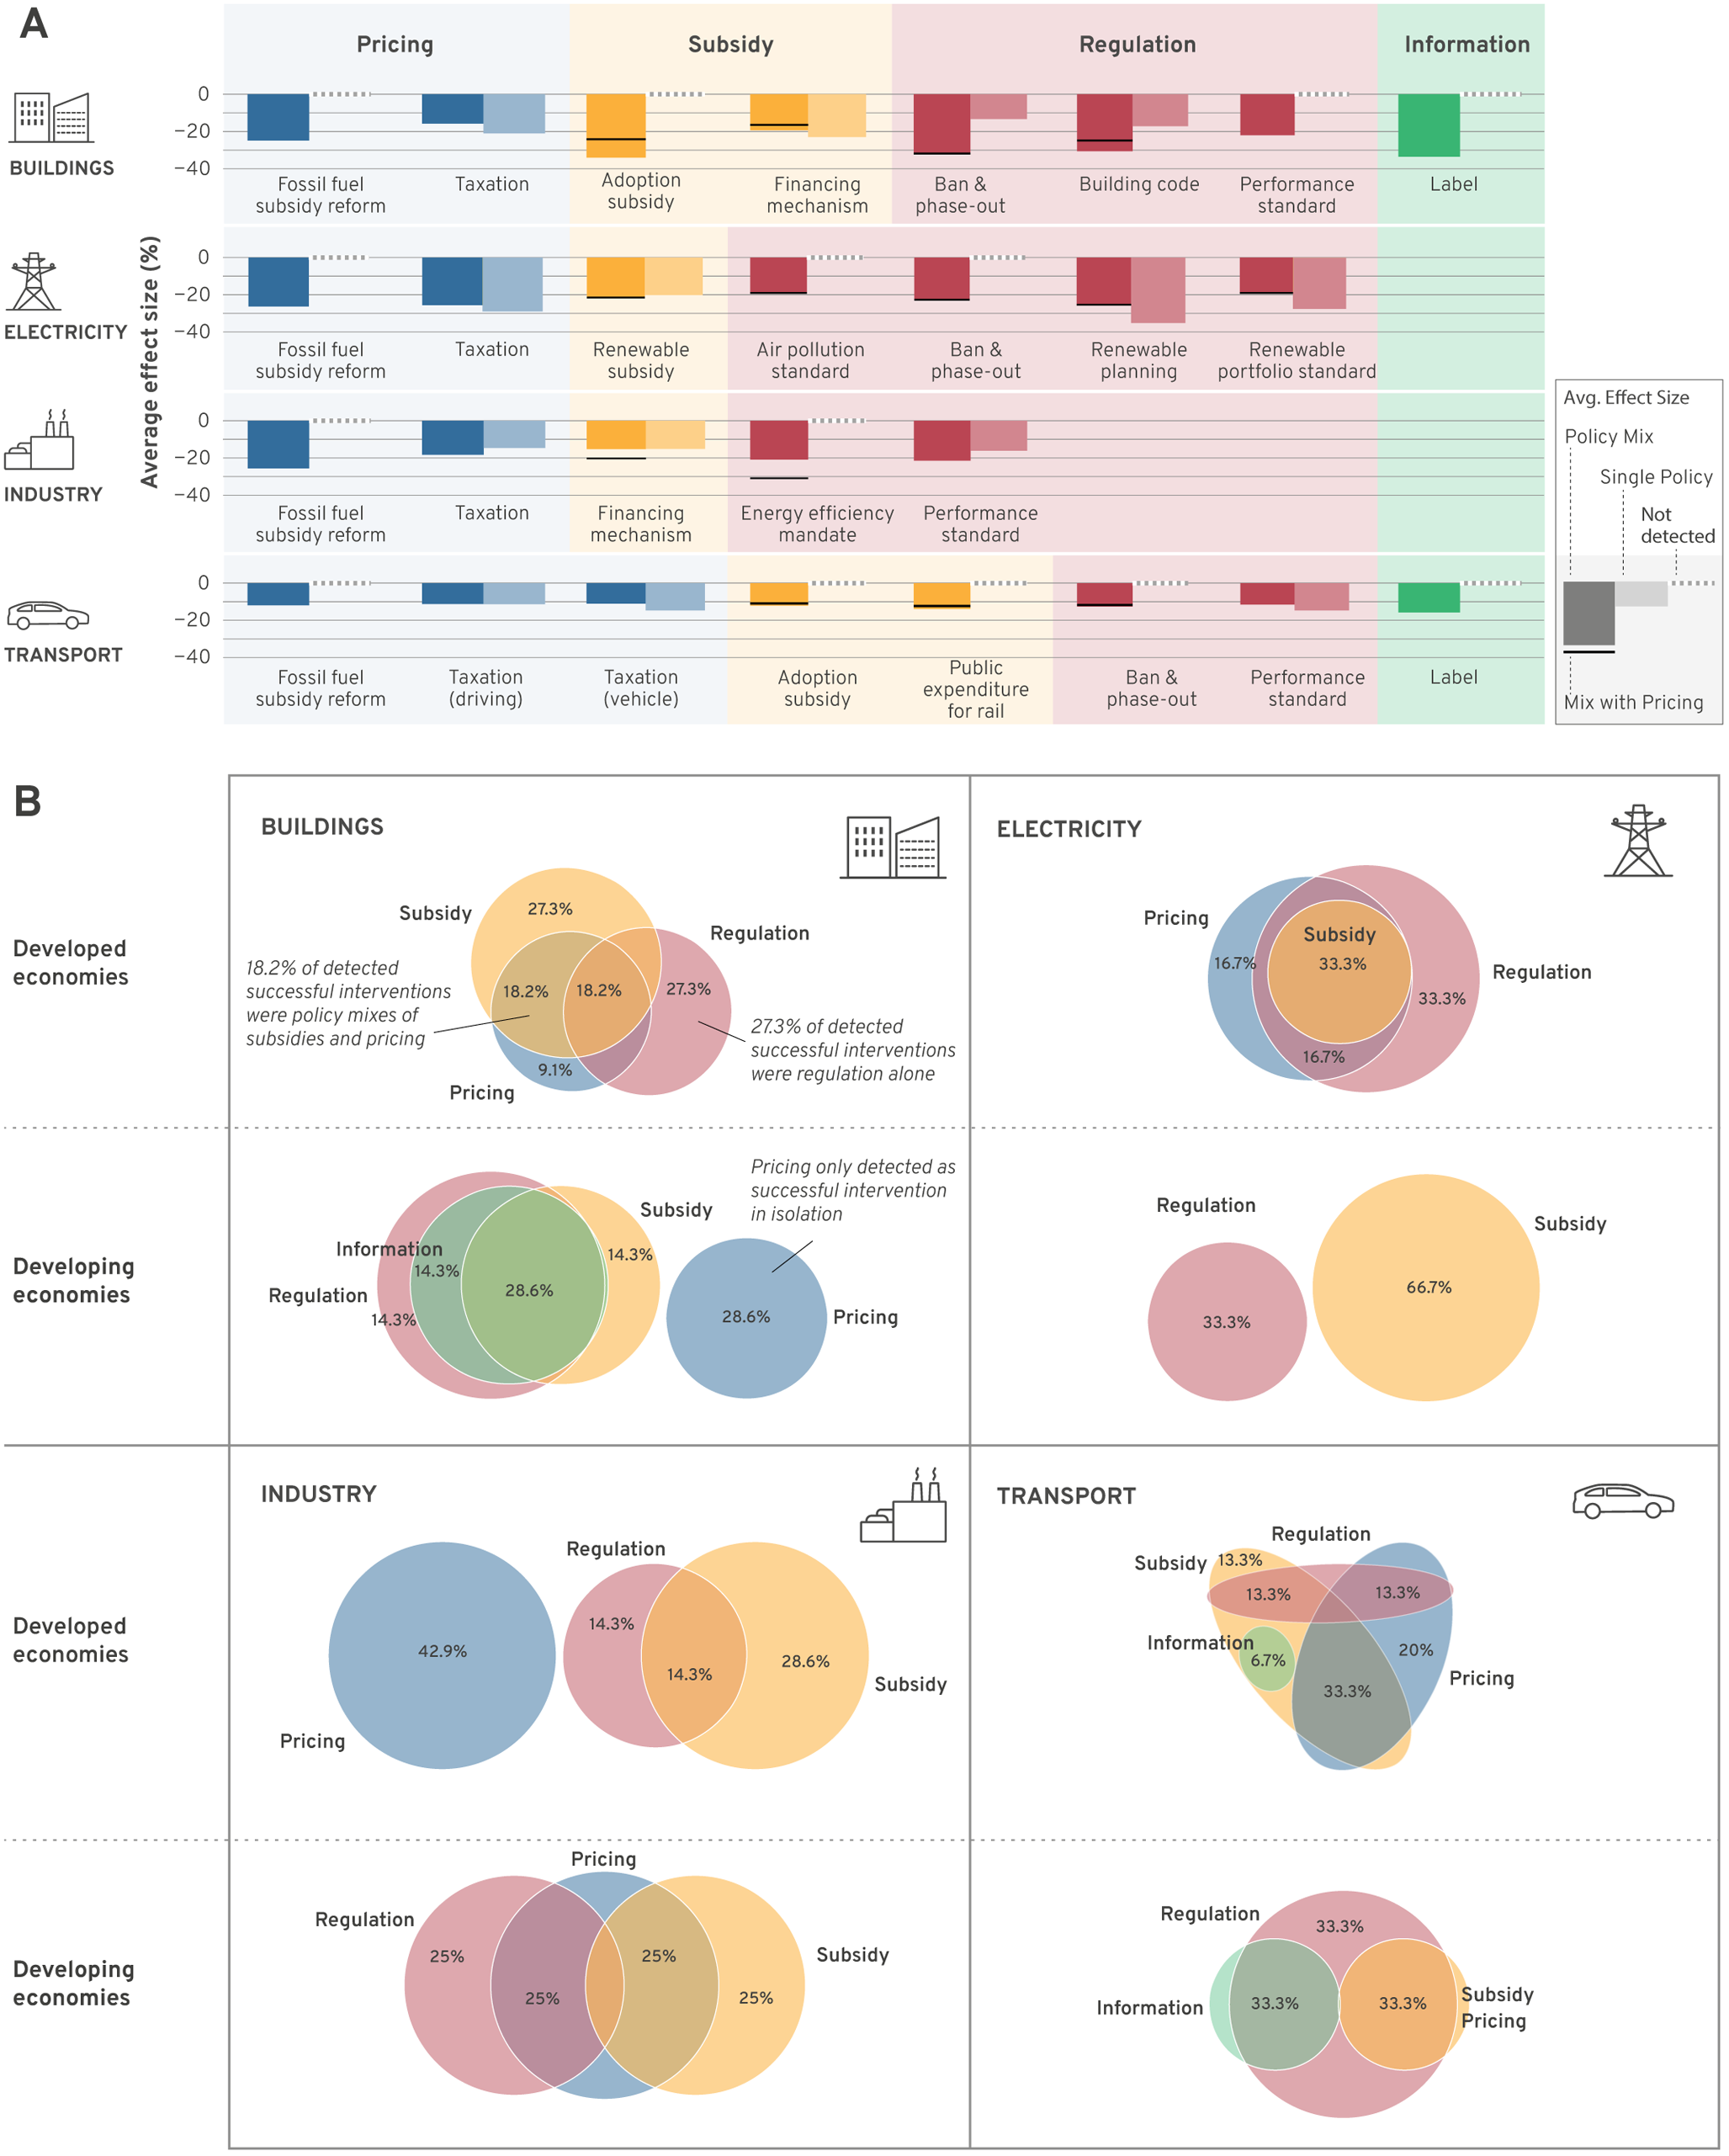


 Open access