


Introduction
Cherts are dense, very hard, fine-grained sedimentary rocks, mainly composed of microcrystalline or cryptocrystalline siliceous mineral phases making up >90% of their composition; cherts commonly contain visible fossils of diatoms, radiolarians and sponge spicules, and vary in colour, from white to black. Cherts can have a uniform texture and a relatively simple mineral composition, although their formation process can be extremely complex. Chert outcrops are often found intercalated with host formations such as limestone, and they typically occur as beds or nodules. Stratified cherts are primarily linked to inorganic and/or biogenically induced precipitation (Kuma et al., Reference Kuma, Hasegawa, Yamamoto, Yoshida, Whiteside, Katsuta and Ikeda2019), whereas nodular cherts form by complex interactions between depositional processes and diagenetic alteration (Shen et al., Reference Shen, Ma, Ye, Lang, Pei, Zhou, Zhang and Yang2018; Dong et al., Reference Dong, Xu, Wen, Chen, Fu, Zhong, Wang, Zhu and Cui2020; Lampropoulou et al., Reference Lampropoulou, Xanthopoulou, Wojtaszek-Kalaitzidi, Petrounias, Zoumpouli, Iliopoulos and Kalaitzidis2022). Cherts are common in the geological record, from the Precambrian to the Quaternary (Boggs, Reference Boggs2009; Tucker, Reference Tucker2001), but are not abundant. Chert deposits are resistant to diagenetic changes over time, making them valuable records of environmental (Adachi et al., Reference Adachi, Yamamoto and Sugisaki1986; Murchey and Jones, Reference Murchey and Jones1992; Murray, Reference Murray1994) and diagenetic (Shen et al., Reference Shen, Ma, Ye, Lang, Pei, Zhou, Zhang and Yang2018; Tatzel et al. Reference Tatzel, von Blanckenburg, Oelze, Schuessler and Bohrmann2015) sedimentary processes when they were formed. The SiO2 is believed to be either entirely of biological origin or to occur as a result of hydrothermal activity (Maliva et al., Reference Maliva, Knoll and Simonson2005; Shen et al., Reference Shen, Ma, Ye, Lang, Pei, Zhou, Zhang and Yang2018). From the Archean Eon to the Palaeoproterozoic (4000 Ma to 1600 Ma), chert precipitated abiotically from seawater to the ocean floor (Maliva et al., Reference Maliva, Knoll and Simonson2005). During the Mesoproterozoic and Neoproterozoic eras (1600 Ma to 541 Ma), cherts formed in carbonate beds. Biogenic cherts emerged in the late Proterozoic, marked by the presence of siliceous sponge spicules (Brasier et al., Reference Brasier, Green and Shields1997; Maliva et al., Reference Maliva, Knoll and Simonson2005). From the Precambrian to the Silurian (635 Ma to 443.8 Ma), cherts contained fossils replaced by silica, coinciding with the abundance and diversity of siliceous sponges (Gehling and Rigby, Reference Gehling and Rigby1996; Kidder and Erwin, Reference Kidder and Erwin2001). During the Cenozoic (66 Ma to present), marine planktons changed from radiolarians to diatoms and there was also more carbonate precipitation and less CO2 in the atmosphere and ocean compared to earlier periods (Westacott et al., Reference Westacott, Planavsky, Zhao and Hull2021). Cenozoic cherts precipitated more frequently during glacial periods (Arthur and Sageman, Reference Arthur and Sageman1994; Kidder and Erwin, Reference Kidder and Erwin2001).
Silica, at atmospheric pressure, exists as several polymorphs. Quartz, tridymite and cristobalite undergo two changes with temperature: inversion and re-conversion. Inversion involves minor structural changes without breaking bonds, occurring almost instantly and is reversible; this reaction happens during the low- (α) to high- (β) temperature transformation of each siliceous phase. Re-conversion, however, involves breaking Si–O–Si bonds and restructuring of the Si–O tetrahedra; this reaction is also reversible, but involves significant structural reorganisation and occurs at an extremely slow rate. The stability ranges of these forms have been studied extensively; one of the earliest and most cited studies is by Fenner (Reference Fenner1913), who proposed the following transformation sequence:
 \begin{equation}\mathop {\text{Quartz}}\limits^{870^\circ {\textrm{C}}} \to {\text{Tridymite}} \to \mathop {\text{Cristobalite}}\limits^{1470^\circ {\textrm{C}}} \end{equation}
Pure quartz transforms into cristobalite at between 1470 and 1710°C (Mackenzie, Reference Mackenzie1960). However, this transformation in natural silica minerals has been observed at a lower temperature range of 1100–1600°C (Schneider et al., Reference Schneider, Majdic and Vasudevan1986). Contrary to Fenner’s proposal, Stevens et al. (Reference Stevens, Hand and Sharp1997) argued that tridymite is not a stable phase in the pure silica system, although cristobalite may form first. The structure of tridymite depends on the origin of the samples (Silvi et al., Reference Silvi, D’Arco, Saunders and Dovesi1991). The stacking disorder of tridymite can result in line broadening, different reflection profiles, reflections shift, and changes in the intensity of XRD reflections (Graetsch and Flörke, Reference Graetsch and Flörke1991). Tridymite and cristobalite can coexist individually or be intergrown in the same crystal (Nukui and Flörke, Reference Nukui and Flörke1987; Thompson and Wennemer, Reference Thompson and Wennemer1979). Several authors (Chaklader, Reference Chaklader1963; Chaklader and Roberts, Reference Chaklader and Roberts1961) suggested that quartz passes through an amorphous transition phase before transforming into cristobalite. Kuellmer and Poe (Reference Kuellmer and Poe1964) found no pronounced amorphous phase below 1550°C and showed that the transformation was through highly fragmented quartz with high-temperature dislocation content. Chaklader (Reference Chaklader1961) and Stoch et al. (Reference Stoch, Łaczka and Wacławska1985) found that impurities such as Al3+ catalyse the transformation of quartz and the formation of cristobalite considerably.
In comparison, Shoval et al. (Reference Shoval, Erez, Kirsh, Deutsch, Kochavi and Yadin1989) demonstrated by XRD that heating chert to 1000°C for 1 h formed a small amount of cristobalite, and at higher temperatures, or with a longer heating time, more of the cristobalite phase was formed. According to Shoval et al. (Reference Shoval, Champagnon and Panczer1997), cherts are rocks rich in crystalline defects, which serve as nucleation sites, allowing early quartz–cristobalite transformation.
Moganite is a polymorph of silica and a very common component of microcrystalline silica rocks (Flörke et al., Reference Flörke, Flörke and Giese1984). Heaney (Reference Heaney1995), based on the frequency of occurrence of moganite and its associations, established that moganite disappears with age as it is very rare or absent in pre-Cretaceous rocks. Parthasarathy et al. (Reference Parthasarathy, Kunwar and Srinivasan2001) demonstrated that moganite is also a common mineral in hydrothermal environments. Several authors (Heaney and Post, Reference Heaney and Post2001; Heaney et al., Reference Heaney, Mckeown and Post2007) indicated a phase transition of monoclinic-to-orthorhombic moganite between 296 and 316°C, whereas between 900 and 1000°C it transformed to cristobalite (Flörke et al., Reference Flörke, Flörke and Giese1984; Miehe and Graetsch, Reference Miehe and Graetsch1992).
It is well known that heat treatment is a process used in ancient times to modify the properties of lithic raw materials in order to improve their knapping quality (i.e. suitability for making tools). This technique was practiced in southern Africa during the Middle Stone Age (Brown et al., Reference Brown, Marean, Herries, Jacobs, Tribolo, Braun, Roberts, Meyer and Bernatchez2009; Mourre et al., Reference Mourre, Villa and Henshilwood2010; Porraz et al., Reference Porraz, Texier, Archer, Piboule, Rigaud and Tribolo2013); it is also known from the European Upper Palaeolithic, Mesolithic and Neolithic (Bordes, Reference Bordes1969; Binder, Reference Binder1984; Tiffagom, Reference Tiffagom1998; Léa, Reference Léa2005; Eriksen, Reference Eriksen and Kind2006), and from the American Palaeo-Indian period (Crabtree and Butler, Reference Crabtree and Butler1964; Wilke et al., Reference Wilke, Flenniken and Ozbun1991). In this investigation, the thermal behaviour of several cherts of different ages and compositions was investigated in order to establish possible differences between them. From a geological point of view, the objective was to establish possible differences between the cherts response to heat treatment and their origin and age.
Experimental
Materials
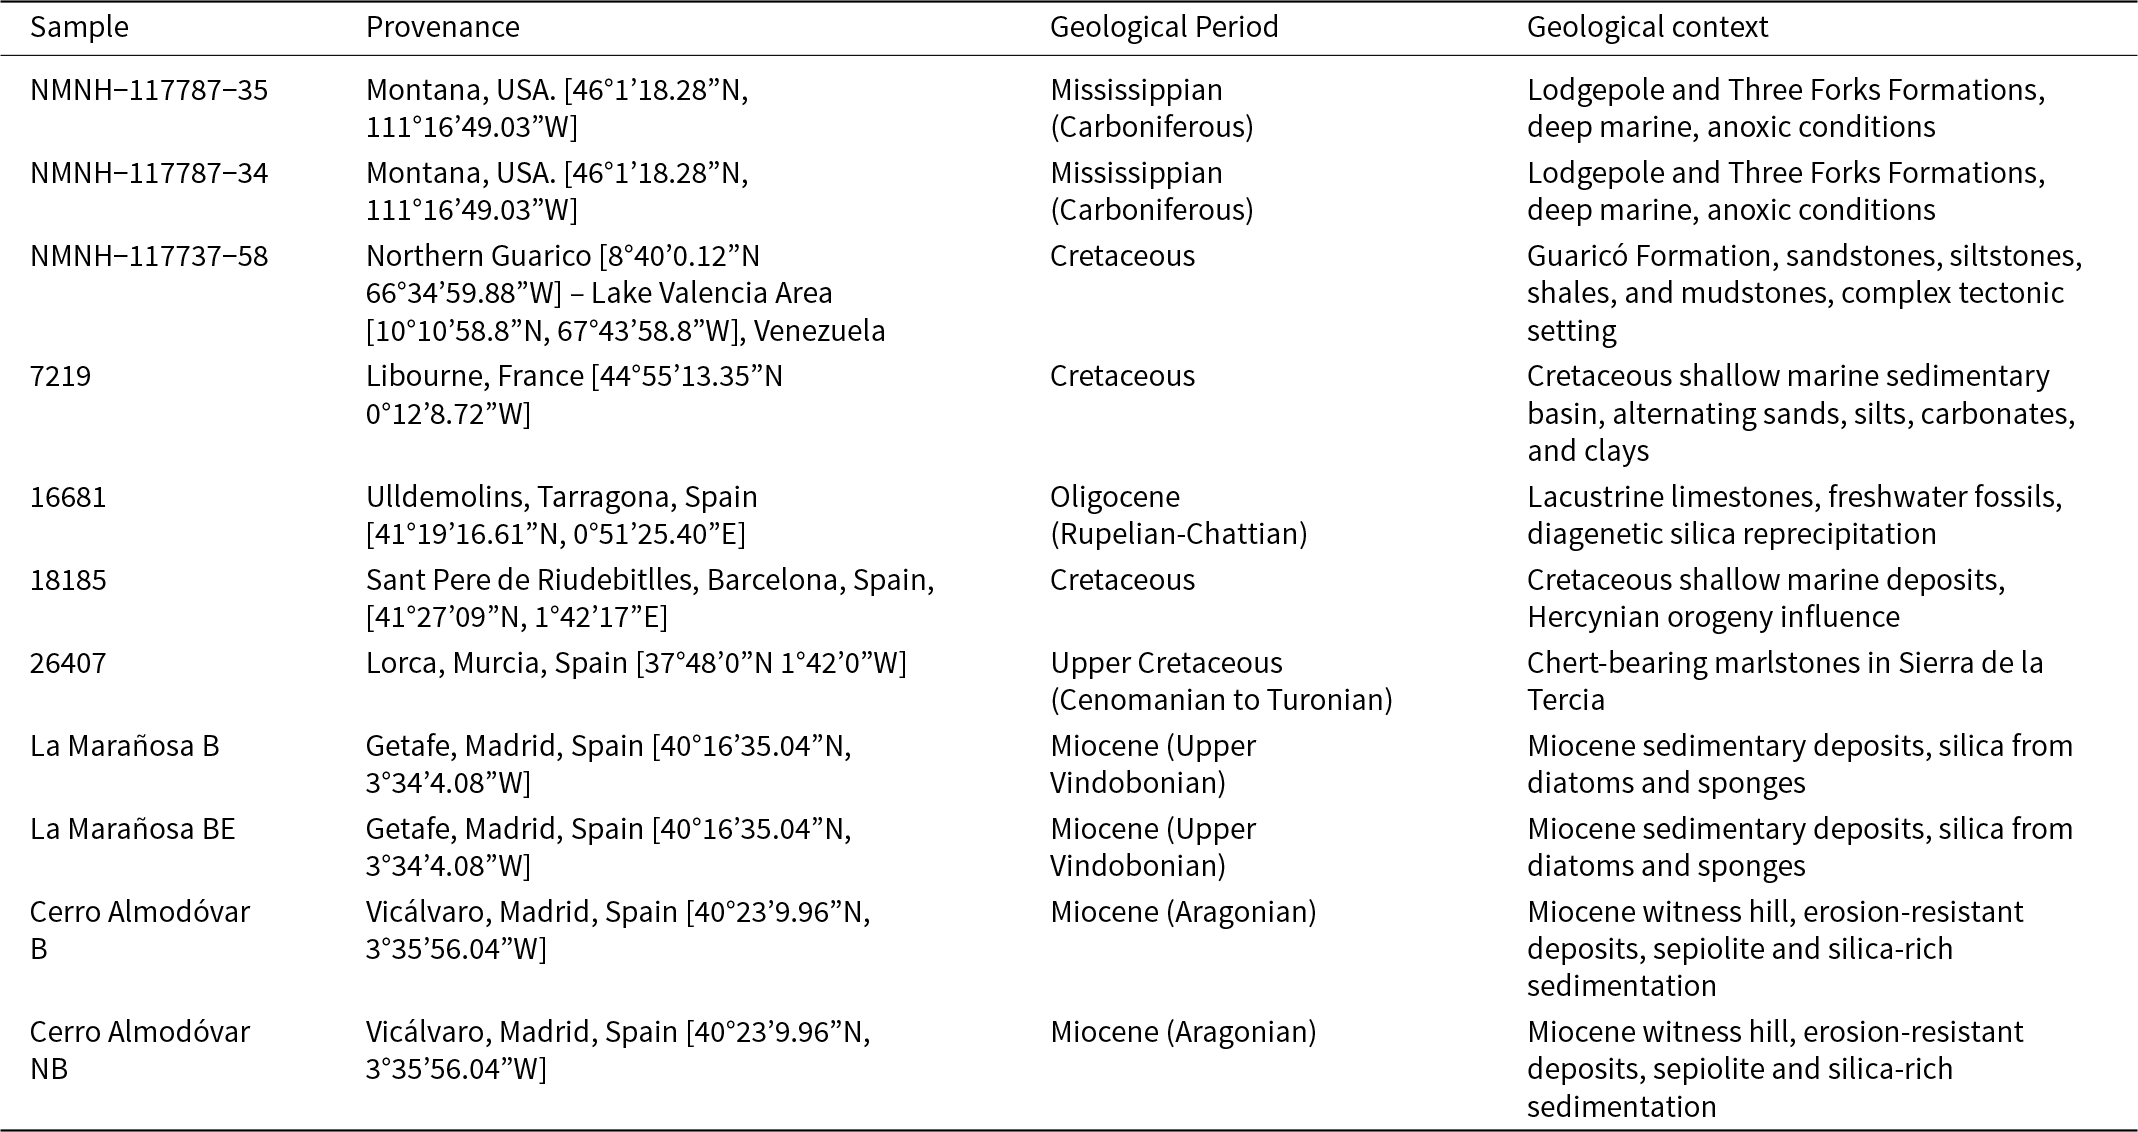
Eleven chert samples from different provenances and geological periods were selected for heat treatment and analysis. A summary of the provenance, geological period and geological context of the cherts investigated is given in Table 1 and described in detail below.
Table 1. Summary of the provenance, geological period and geological context of the 11 cherts investigated

Chert samples NMNH-117787-35 and NMNH-117787-34 are from Montana, USA (Mississippian period). The chert there appears in two formations: (1) the Lodgepole formation, which has a significant chert content, especially in its lower sections where chert-rich organic black shales predominate; and (2) the Three Forks formation, where shale and dolomite units are interbedded with chert-rich levels, particularly in the deeper, more stable areas of the sedimentary basin during the Early Mississippian period. The chert deposition was in relatively deep and anoxic marine settings. The distribution of chert in these formations is variable and is influenced by the palaeogeography and sedimentary dynamics of the area during the Mississippian (Borski, Reference Borski2015).
Sample NMNH-117737-58 is from the area between Lake Valencia (Lago Tacarigua) and Guaricó in the Llano Central of Venezuela. In the surrounding areas of the lake, several different rock formations (Tinaco Complex and Fillita de Tucutunemo), including igneous and metamorphic rocks, can be found. Both units are cut by faults (Manrique and La Victoria) which, in turn, affect the Jurassic and Cretaceous rocks. These rocks are testimony to the complex geological history of the region, with a predominance of thrust faults. The sub-basin is associated with the Guaricó fault system, which overlies Cretaceous and Tertiary rocks, creating a complex tectonic framework. The soils of this region belong to the Guaricó Formation, which consists mainly of thin layers of sandstones and siltstones, alternating with layers of shales and mudstones (USGS, 2006).
Sample 7219 is from Libourne which is located in Cretaceous sedimentary deposits at the confluence of the Isle and Dordogne rivers in France. During the Cretaceous, the region was covered by shallow seas. This environment favoured the accumulation of marine sediments, the formation of characteristic sedimentary rocks and the preservation of marine fossils. This Basin (65,000 km2) was filled gradually with sediments over the past 250 million years. It includes alternating layers of sand, silt, carbonates and clays.
Sample 16681 is from the Ulldemolins Complex formation (Tarragona, Spain), which has been determined to be from the Rupelian-Chattian (Oligocene). This formation was deposited in continental lacustrine environments, not in shallow seas (Roqué and Terradas, Reference Roqué and Terradas2016). The Ulldemolins chert has the following characteristics. It occurs in the form of nodules within limestones. It contains fossils of freshwater organisms such as gastropods, ostracods, carophyceans and fish. It was formed in a marginal sedimentary basin disconnected from the Ebro basin, on the Pyrenean overriding bed. The silica probably originated from the dissolution of the remains of siliceous freshwater organisms or from silica-rich groundwater inputs. The diagenetic processes of dissolution and reprecipitation of the silica led to the formation of the nodules of chert within the lacustrine limestones (IGME, 1973a).
Sample 18185 is from Sant Pere de Riudebitlles, located in the Alt Penedès region of Barcelona, Spain, which has an interesting and varied geology. The region is characterised by sedimentary formations that originated mainly during the Cretaceous. These formations include limestones, marls and chert, which were formed in shallow-marine environments. The terrain of Sant Pere de Riudebitlles is influenced by the fluvial activity of the river Bitlles, which has contributed to the formation of alluvial terraces and fluvial deposits. These deposits are rich in sedimentary materials that have been transported and deposited by the river over time. In addition, the region shows evidence of the Hercynian orogeny, a tectonic event that affected much of Europe during the Palaeozoic. This orogeny left a base of metamorphic and magmatic rocks on which the more recent sedimentary layers were deposited (IGME, 1972a).
Sample 26407 is from upper Cretaceous (Cenomanian to Turonian) chert-bearing marlstones in the region of Lorca, Murcia (Spain), which are found in several geological formations. One of the prominent areas is the Sierra de la Tercia, north of Lorca (IGME, 1972b).
Samples ‘La Marañosa B’ and ‘La Marañosa BE’ are from La Marañosa, located in the municipality of San Martín de la Vega, near Getafe (Madríd, Spain) and are from the Miocene (Upper Vindobonian) (IGME, 1973b).
Samples ‘Cerro Almodóvar B’ and ‘Cerro Almodóvar NB’ are from Cerro Almodóvar located in the district of Vicálvaro in Madrid, Spain. This location is an impressive hill that stands out in the surrounding plain due to its resistance to erosion. This hill was formed during the Miocene (Aragonian) through sedimentary and chemical processes. During the Miocene, the regions of San Martín de la Vega and Cerro Almodóvar were influenced by sedimentary environments that favoured the formation of chert and other minerals such as sepiolite. Chert was formed from the accumulation of the remains of silica-rich marine organisms, such as diatoms and sponges, which were compacted and transformed into nodules through diagenesis processes (IGME, 1986).
Heat treatment
All eleven samples were heated. The standard heat treatment (without XRD) was carried out in a Carbolite CWF 12/23 furnace (Área de Cristalografía y Mineralogía, Universidad de Oviedo) with a heating ramp at a controlled rate of 5°C/min until reaching 1000°C, this temperature was maintained for 48 h, and then cooling was carried out at the same rate. Temperature calibration is tested periodically with certified equipment by Carbolite factory-qualified personnel.
For in situ XRD during heating, an Anton Paar HTK1200N chamber was used with a PANalytical X’Pert Pro MPD diffractometer detailed below. This was used for two of the samples, Cerro Almodóvar B and La Marañosa BE, which were heated to 1000°C at a controlled rate of 5°C/min. It was maintained for 48 h, and then cooling was carried out at the same rate.
Characterisation
Characterisation of the samples was carried out using X-ray fluorescence, XRD and Raman spectroscopy, to determine compositions and crystalline structures. The characterisations were performed at room temperature apart from the in situ XRD during heat treatment.
The wt.% oxides of the chert samples NMNH-117787-35, NMNH-117787-34, NMNH-117737-58, 7219, 18185 and 26407 were from Uribe-Zorita et al. (Reference Uribe-Zorita, Álvarez-Lloret, Bottura and Marcos2023). The compositions of the other cherts were obtained using XRF (Shimadzu EDX-720 instrument) following the same methodology as described in Uribe-Zorita et al. (Reference Uribe-Zorita, Álvarez-Lloret, Bottura and Marcos2023).
X-ray diffraction patterns of the samples before and after heating were recorded using a PANalytical X´Pert Pro MPD diffractometer. The PANalytical X’Pert MPD Pro was configured in Bragg-Brentano geometry with fixed, primary divergence and anti-scatter slits of 1° and 2° aperture, respectively. Diffraction patterns were recorded at 40 mA and 45 kV (CuKα radiation; λ = 1.5418 Å) on scanning mode over the range 5–86°2θ at an angular velocity of 0.22°/s by a solid state PIXcell detector. Prior to analysis, X-ray radiation was monochromatised using a large Ni filter.
The Anton Paar HTK 1200N heating chamber was calibrated using a periclase (MgO) sample, analysing its linear thermal expansion coefficient from room temperature to 1000°C. That device was coupled to a PANalytical X´Pert Pro MPD diffractometer and an XRD pattern was recorded every 100°C, at stabilised temperatures (300°C, 700°C and 1000°C; the stabilisation time was 50 h) by continuous scanning at 0.08°/s over the angular range between 15 and 85°2θ. The samples, 0.5 g each, were ground in an agate mortar prior to analysis to obtain the powder XRD patterns for the starting and heat-treated samples. The software used to identify the mineral phases was X’Pert HighScore Plus 2.2d (2.24) 2008.
Raman spectra were obtained using a JASCO NRS-5100 spectrometer (Jasco Inc. MD, Easton, USA) equipped with a charge-coupled device detector (Andor DU 420) and coupled to an Olympus optical microscope. For the Raman spectroscopy, the samples were excited using a diode laser (λ = 785 nm) kept at 500 mW. Spectra were acquired between 100 and 800 cm–1 with a resolution of 1 cm–1, exposure time 10 s with 10 accumulations. Spectra smoothing was performed using SYSTAT version 13 (Systat Software, Inc., San Jose CA, USA).
Results
X-ray fluorescence
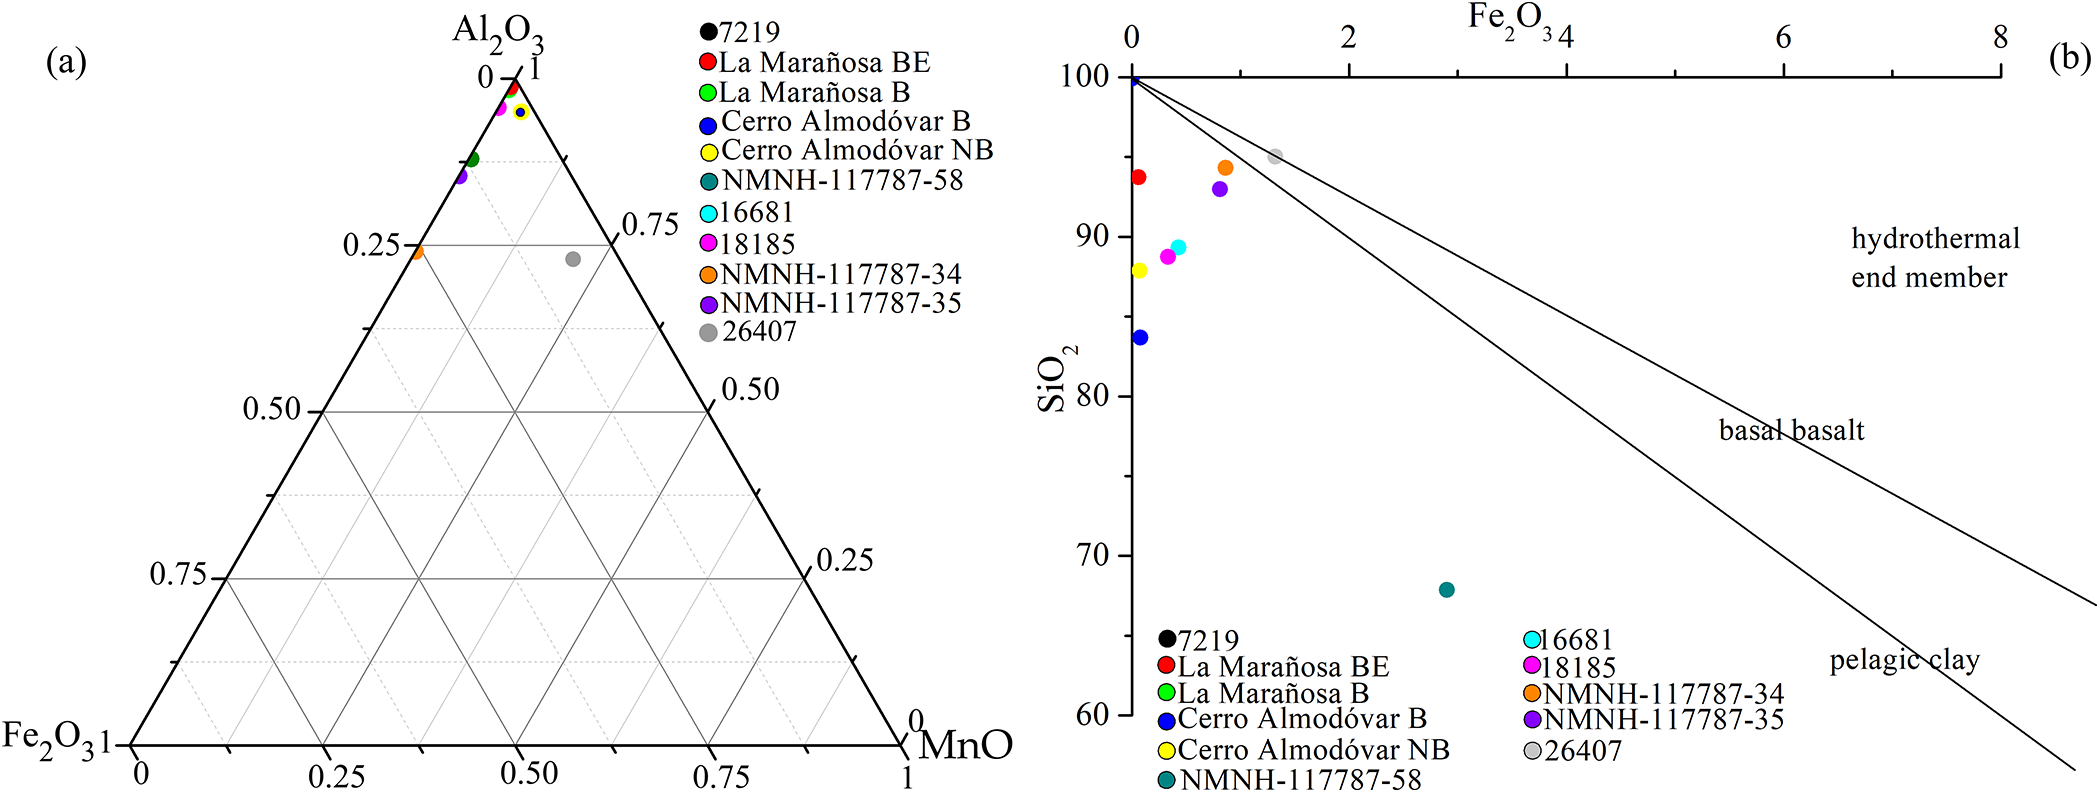
The composition expressed in terms of oxides (wt.%) and their corresponding mass loss on ignition (L.O.I.) values are listed in Supplementary Material Table S1. The standard deviation was <0.3 for SiO2, <0.5 for Al2O3, <0.1 for MgO and <0.005 for the other oxides analysed. In relation to silica content, the analysed cherts can be differentiated into those with >99% SiO2 (7219 and Cerro Almodóvar B), those with 90–95% (NMNH-117787-35, NMNH-117787-34, 26407 and La Marañosa B), and those with 80–90% (16681, 18185, Cerro Almodóvar NB and La Marañosa BE); NMNH-117737-58 is an outlier with only 67.87% SiO2. The Al–Fe–Mn diagram for the cherts investigated (Fig. 1a) and the representation of SiO2 vs. total iron as Fe2O3 (Fig. 1b) both indicate that the majority of these cherts are composed exclusively of biogenic silica. Notably, they fall below the pelagic clay line, reinforcing their unique composition. An exception is the sample 26407, which may have resulted from the mixing of basaltic materials and silica (Adachi et al., Reference Adachi, Yamamoto and Sugisaki1986; Yamamoto, 1987). The unusual composition exhibited by chert NMNH-117787-58, of low silica content and high alumina content, is clearly reflected by its position in Fig. 1b.

Figure 1. (a) Al2O3–Fe2O3–MnO (wt.%) diagram showing the composition of the cherts; and (b) plot of SiO2 vs. total iron as Fe2O3. The composition of pelagic clay is from Turekian and Wedepohl (Reference Turekian and Wedepohl1961); the compositions of the basalt and the hydrothermal end-member were taken from Adachi et al. (Reference Adachi, Yamamoto and Sugisaki1986).
X-ray diffraction
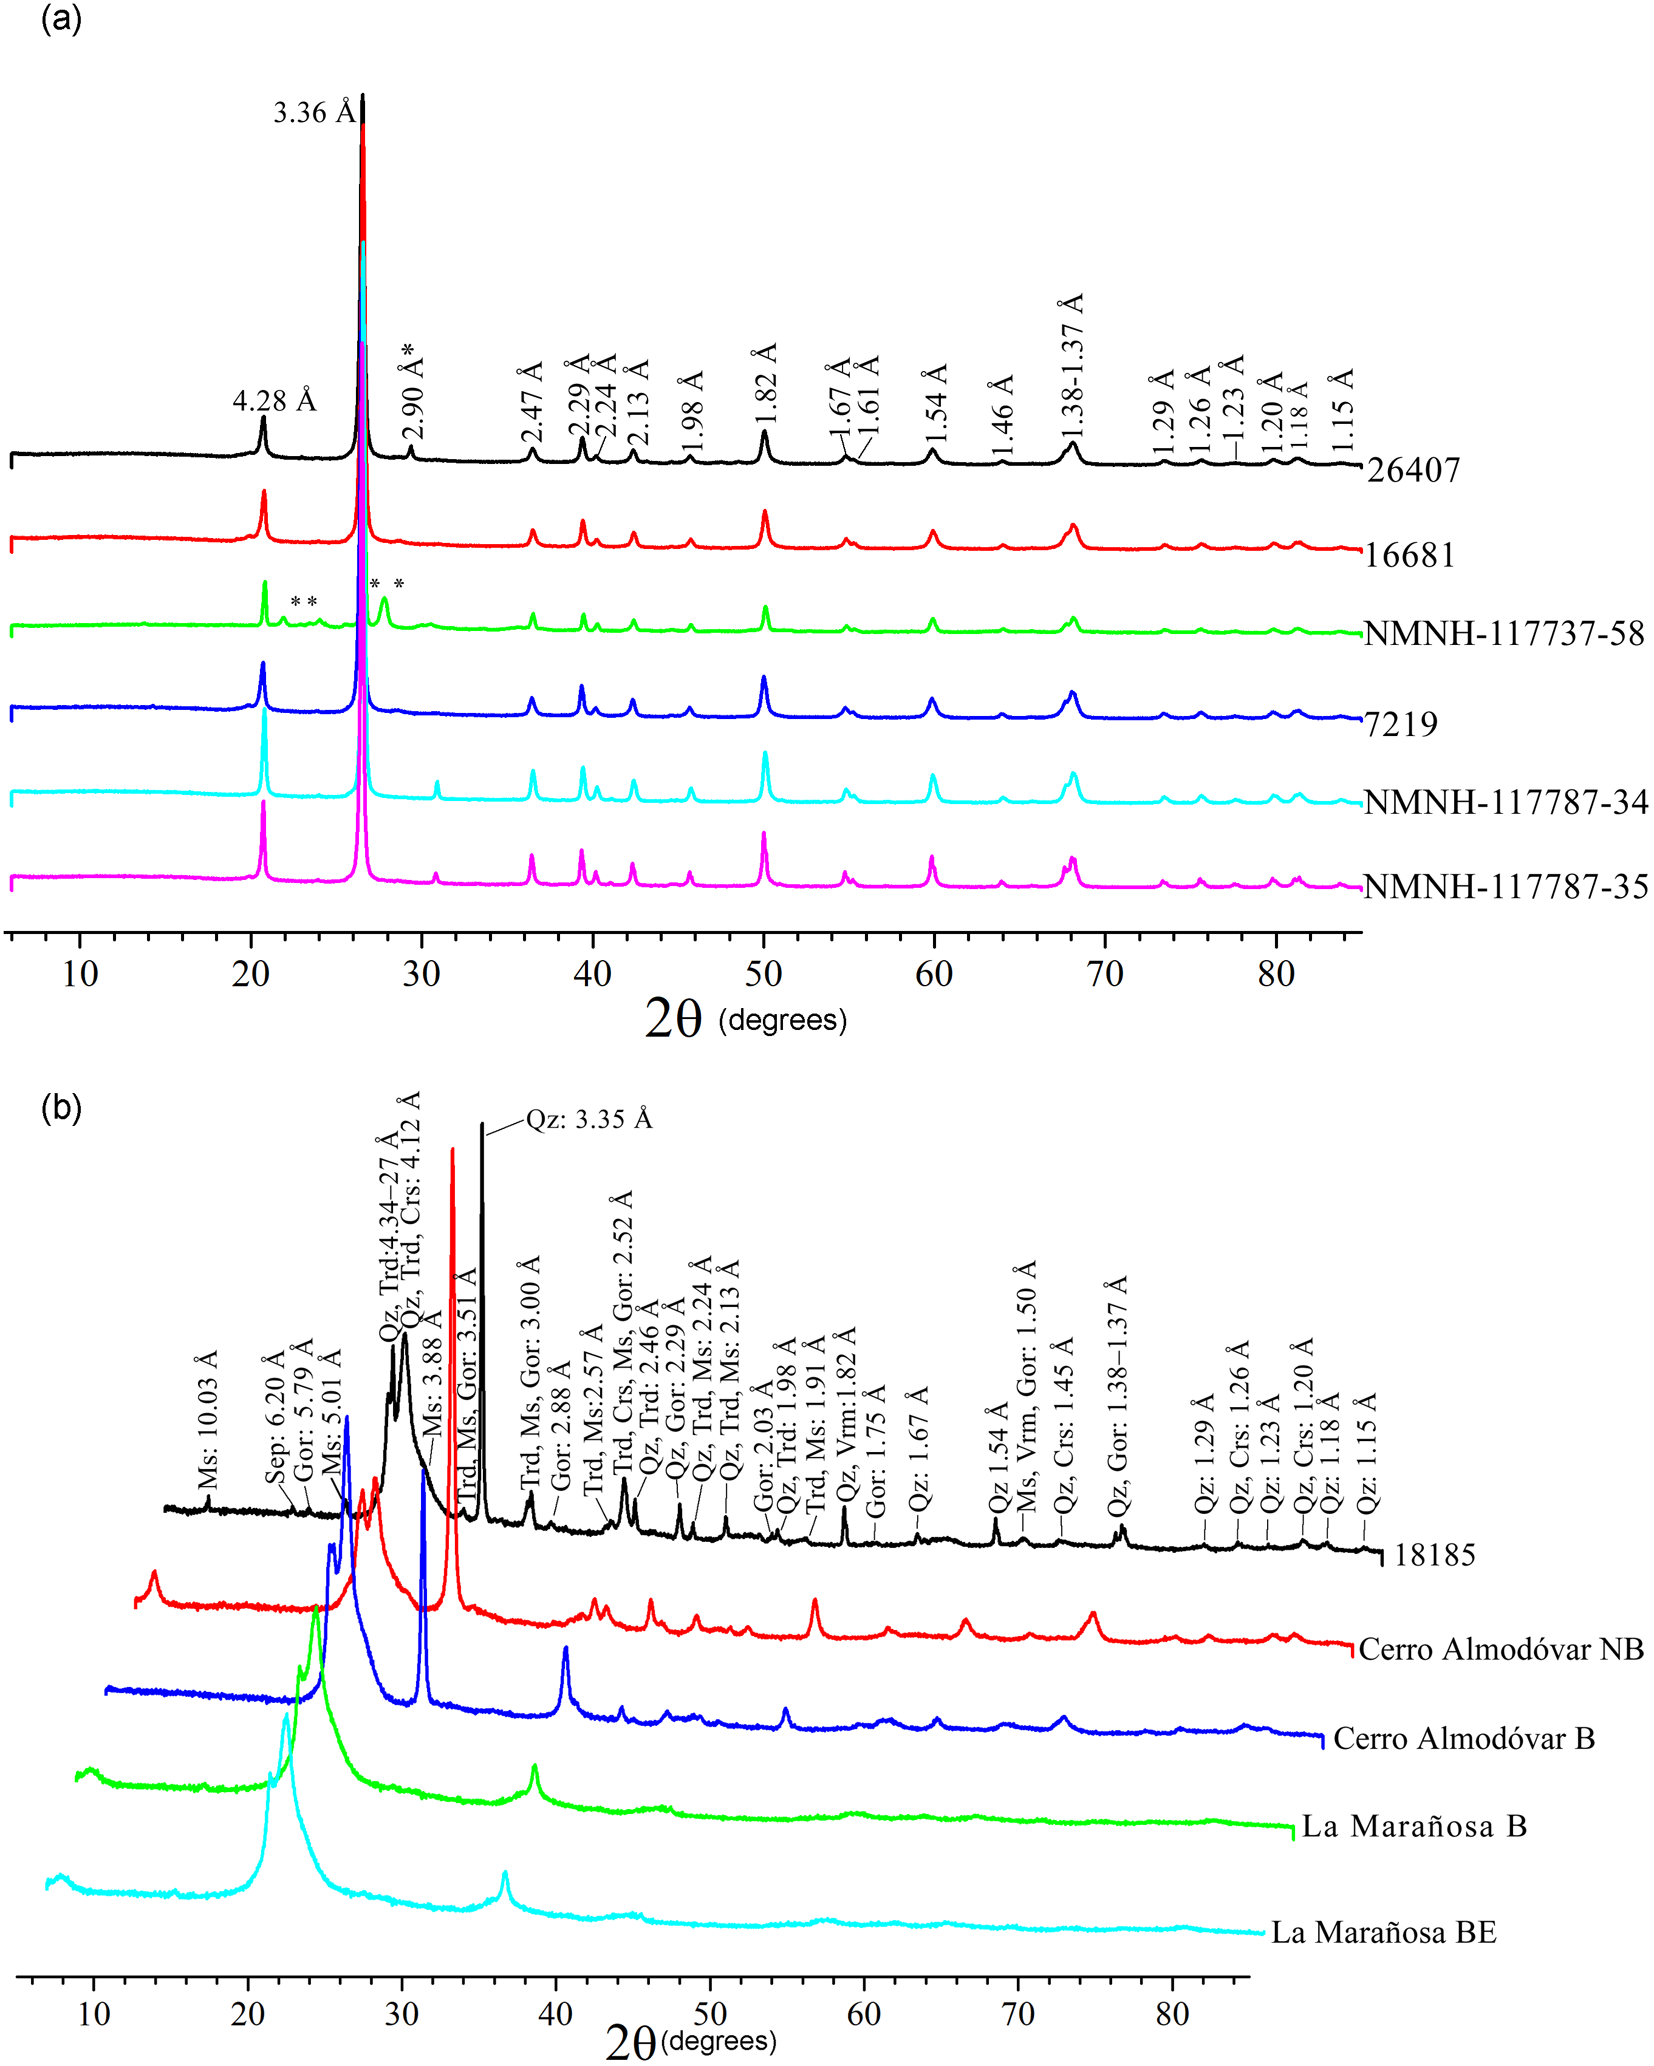
From the XRD results of the unheated cherts, two types can be differentiated on the basis of the main phase(s) of which they are composed. Quartzitic cherts (Fig. 2a) consist primarily of quartz. In contrast, the tridymitic/cristobalitic cherts (Fig. 2b) are composed of varying proportions of quartz, cristobalite and/or tridymite. Other phases may be present in very small proportions (moganite, calcite, dolomite, phyllosilicates, etc.) Table S2 lists all the phases found for the two groups.

Figure 2. XRD patterns: (a) quartzitic cherts in which the majority of the reflections correspond to quartz (Qz) and moganite (Mog), except those marked with * which correspond to dolomite (Dol) and ** which belong to albite (Ab); (b) tridymitic/cristobalitic cherts showing the reflections corresponding to the phases quartz, tridymite (Trd), cristobalite (Crs), gorceixite (Gor), sepiolite (Sep) and phyllosilicates (muscovite: Ms). Mineral abbreviations were taken from Whitney and Evans (Reference Whitney and Evans2010).
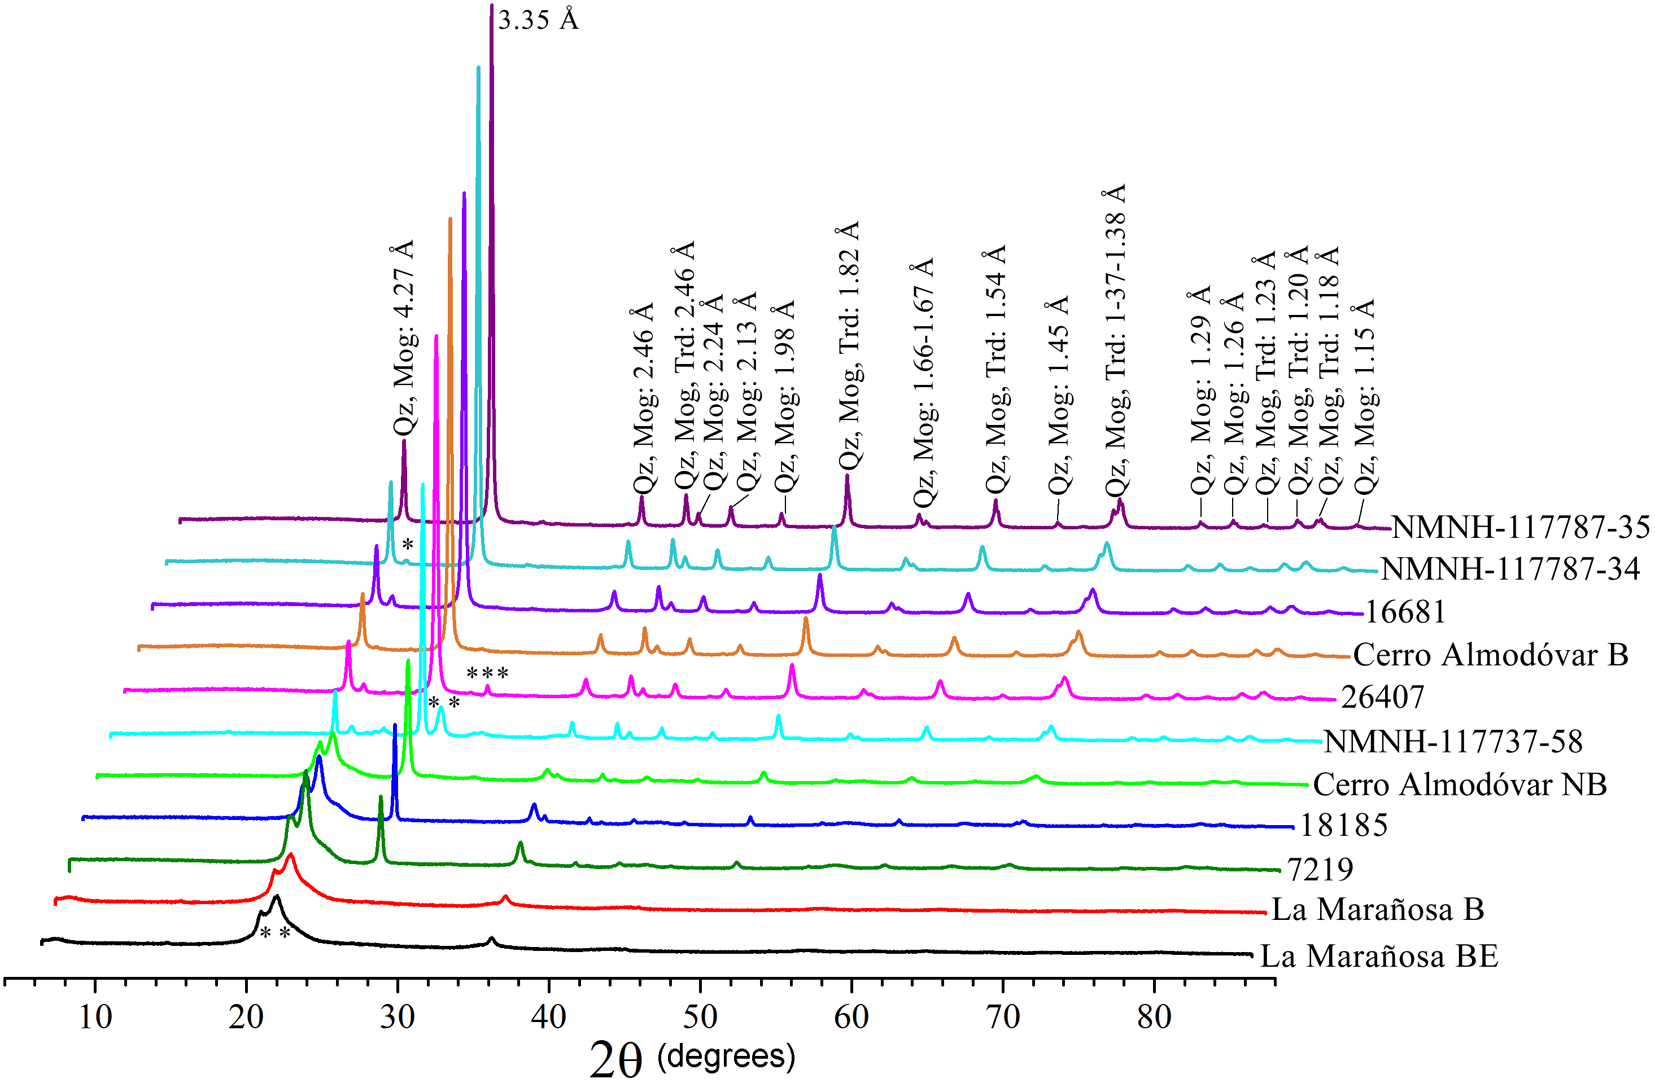
The XRD results for the cherts after heat treatment are presented in Fig. 3. After heat treatment, the cherts cannot be differentiated into quartzitic or tridymitic/cristobalitic groups because all of them may have quartz, cristobalite and tridymite, in addition to other phases present in very small proportions, such as moganite, e.g. sample 16681. The phases are listed in Table S3.

Figure 3. XRD patterns of heat-treated cherts showing reflections corresponding to the phases that make up the cherts: quartz (Qz), tridymite (Trd), cristobalite (Crs), moganite (Mog) and cristobalite–tridymite (*), quartz–tridymite–cristobalite (**), tridymite and wollastonite (Wo) (***). Mineral abbreviations were taken from Whitney and Evans (Reference Whitney and Evans2010).
Samples Cerro Almodóvar B and La Marañosa BE
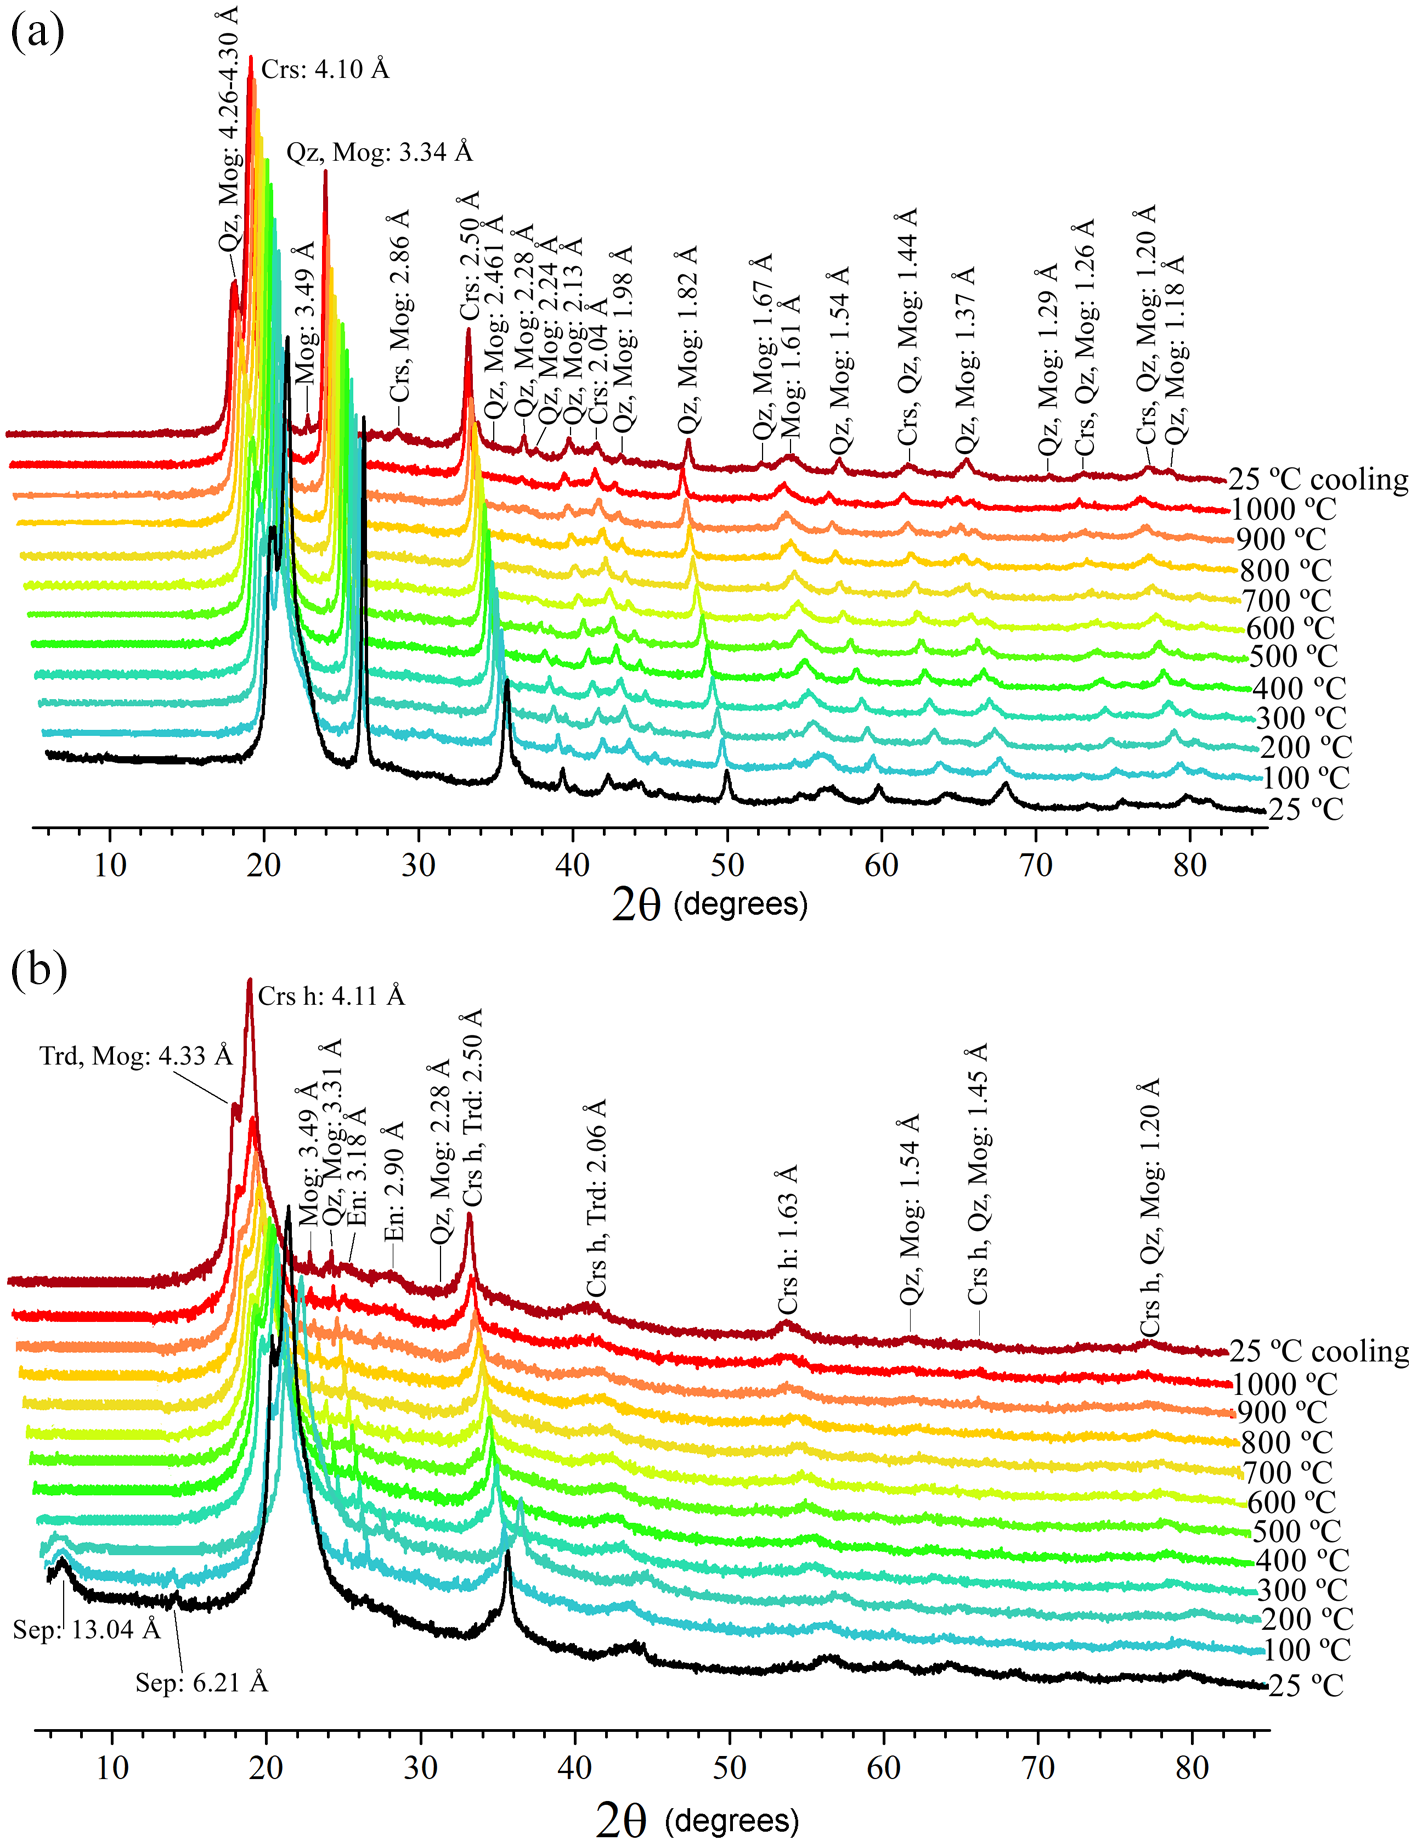
The XRD patterns taken while heating the Cerro Almodóvar B and La Marañosa BE samples are shown in Fig. 4a and 4b, respectively.
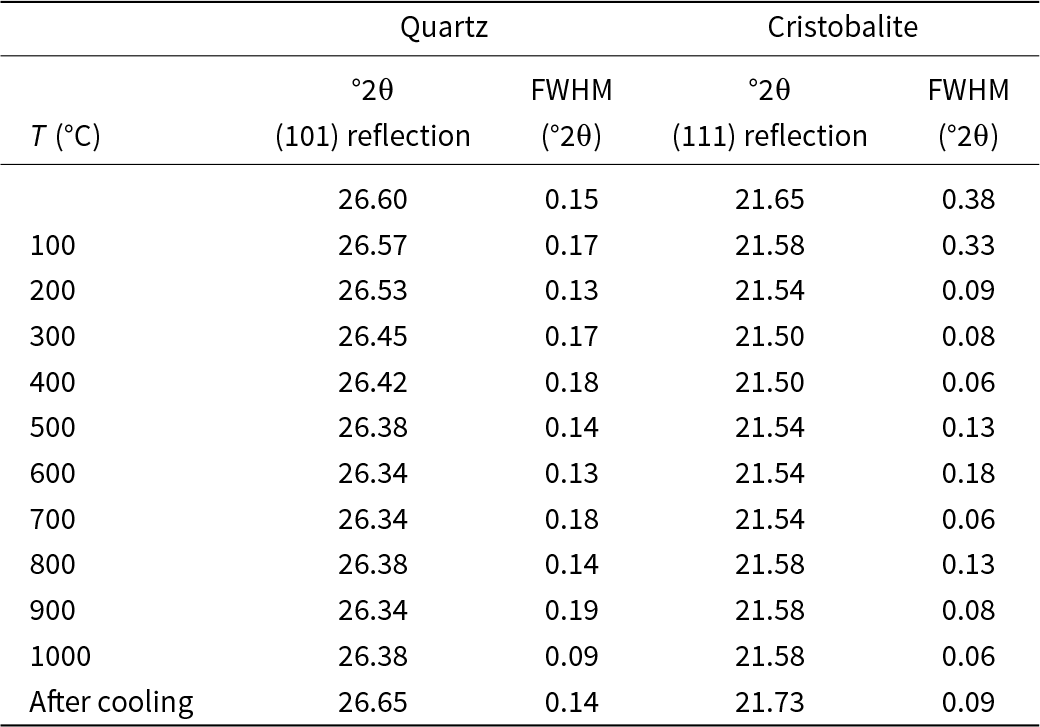
The intensity of reflections from both quartz (JCPDs 5-490) and tridymite (JCPDs 18-1169) of the heat-treated Cerro Almodóvar B sample (Fig. 4a) increase from 25 to 100°C; at 200°C, tridymite transformed to cristobalite (JCPDs 1-424); up to 400°C the intensity of these reflections increased. At 500°C, cristobalite intensity changed with temperature, however the high-cristobalite polymorph was not evident in this sample (Fig. 4a) and low-quartz transformed to high-quartz (JCPDs 11-252); at 600°C the intensity of the reflections decreased; at 700°C the intensity of reflections increased considerably and at 800°C decreased considerably, increased significantly again to 900°C; on cooling to 25°C the reflections decreased slightly and high-cristobalite and high-quartz transformed to low-cristobalite and low-quartz. Moganite (JCPDs 38-360 and/or AMCSD-2737, AMCSD-2738 and AMCSD-6460) was always present (Fig. 4a). The slope shown between 20 and 30°2θ indicates crystallinity loss of the sample. The gradual change in the °2θ value of the (101) quartz reflection and °2θ value of the (111) cristobalite reflection caused by heating the chert to 1000°C is shown in Table 2. The variation of the FWHM (Full Width at Half Maximum) values of the (101) quartz reflection and the principal (111) cristobalite reflection with temperature is also shown in Table 2. The FWHM of the (101) quartz reflection varied with temperature but there is no clear trend. The (111) cristobalite reflection decreased slightly with increasing temperature but also increased after cooling. The FWHM values of the (111) cristobalite reflection decreased significantly with increasing temperature, reaching its lowest value at ∼400°C, and then then varied without a clear trend.

Figure 4. In situ XRD patterns of the heated Cerro Almodóvar B sample (a) and the La Marañosa BE sample (b). Mineral abbreviations – quartz (Qz), tridymite (Trd), cristobalite (Crs), moganite (Mog), sepiolite (Sep) and enstatite (En) (from Whitney and Evans, Reference Whitney and Evans2010).
Table 2. 2θ and FWHM values and values for quartz reflection (101) and cristobalite reflection (111) for the Cerro Almodóvar B sample

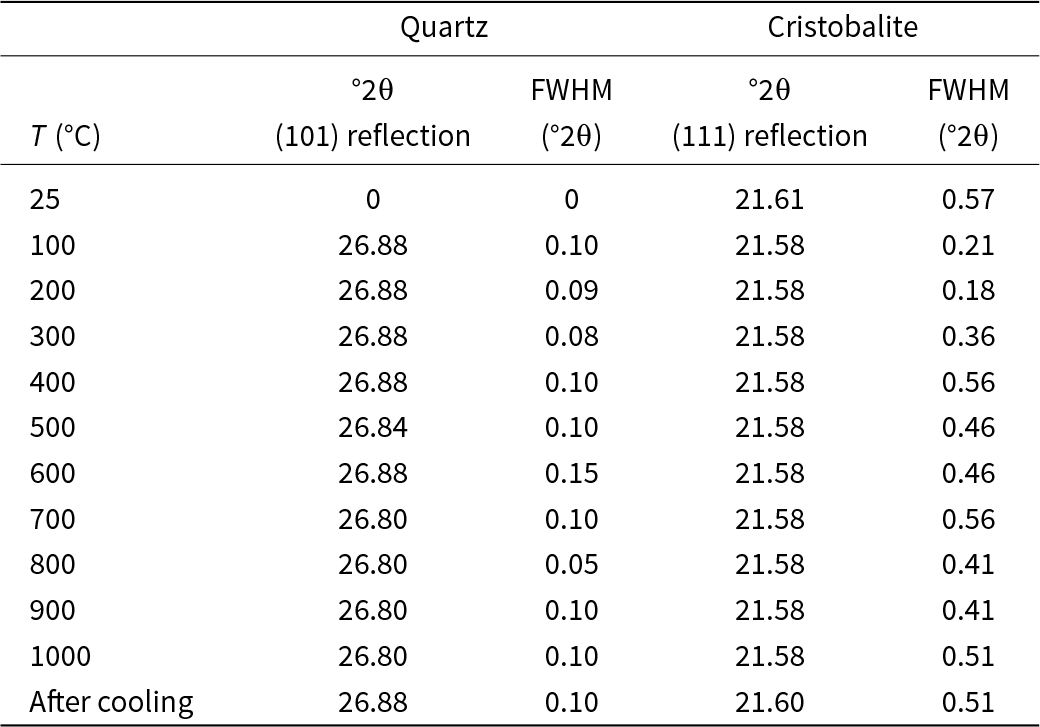
The XRD pattern for La Marañosa BE heated between 100 and 1000°C shows that cristobalite (JCPDs 27-605) is the major phase and quartz is minor (JCPDs 5-490); tridymite (JCPDs 16-152) and moganite (JCPDs 38-360) may also be present. The intensity of the cristobalite reflections decreased from 25 to 100°C, increased between 500 and 600°C, and then decreased slightly again up to 1000°C; after cooling, at 25°C, it increased slightly. The slope shown between 20 and 30°2θ indicates the very low crystallinity of the sample. The °2θ and FWHM values of the quartz reflection (101) and cristobalite reflection (111) for La Marañosa BE sample are presented in Table 3. The quartz reflection (101) stabilising around 26.80–26.88°2θ at higher temperatures suggests that the quartz structure became more stable and consistent as the temperature increased. The FWHM of the quartz reflection (101) showed some variation, with a notable dip at 800°C. The (111) cristobalite reflection remained fairly constant around 21.58°2θ across all temperatures, with a slight increase after cooling. The FWHM of the (111) cristobalite reflection showed significant variation, with larger values at lower temperatures and a decrease around 200–300°C, followed by fluctuations at higher temperatures.
Table 3. 2θ values and FWHM values for the quartz (101) reflection and the cristobalite (111) reflection for the La Marañosa BE sample

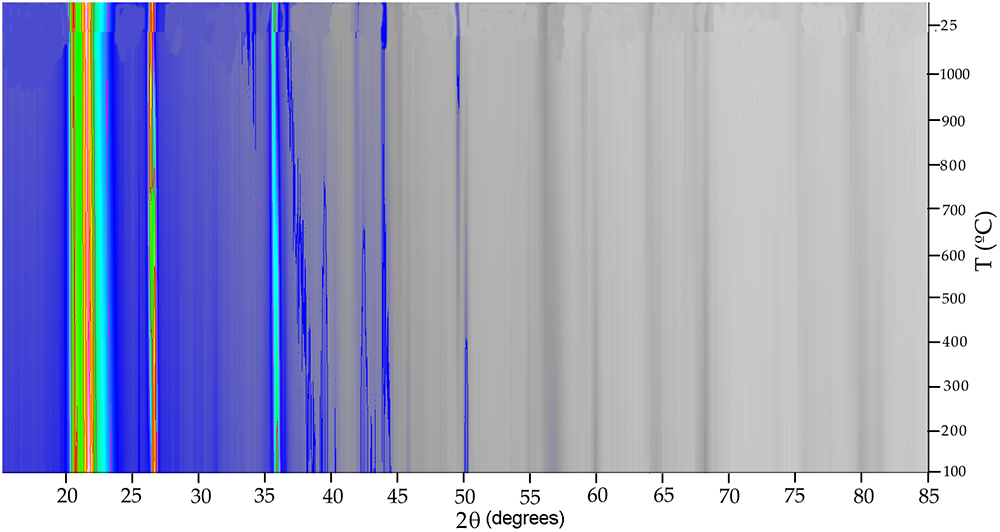
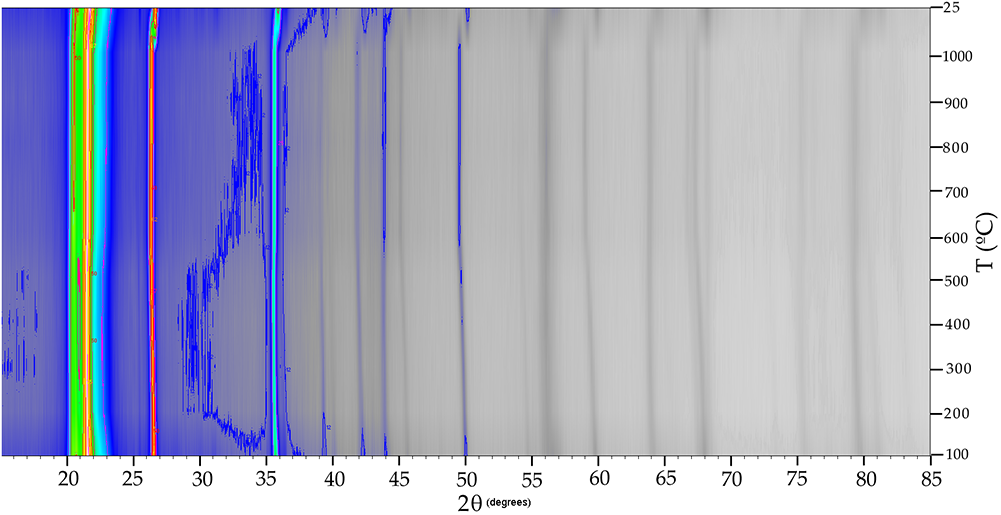
The XRD patterns of Cerro Almodóvar B and La Marañosa BE were plotted by projection with level curves and false colour with Xpowder software (Martin, Reference Martin2004) to visualise phase transformations, using refinement methods (based on stacking the different temperature conditions considered) through the internal calculations of the parameter-shift method (Bhuiya and Stanley, Reference Bhuiya and Stanley1963). This 2D representation calculated by quadratic interpolation methods and showing different intensity scales, requires that all XRD patterns have been recorded using the same experimental conditions. In the 2D representation with false colour of the in situ thermal diffraction pattern of the Cerro Almodóvar B sample (Fig. 5), transformations between 100–200°C, 500–600°C and 800–900°C were observed.

Figure 5. Two-dimensional representation with false colour of the in situ thermal XRD patterns of the Cerro Almodóvar B sample.
In the 2D representation with false colour of the in situ thermal XRD pattern of La Marañosa BE sample (Fig. 6), transformations were observed between 500–600°C and at ∼900°C. At 100°C, tridymite transforms into cristobalite, reducing the intensity of its main reflection, while quartz begins to appear. The 2D maps were generated in XPowder, which visualises diffraction intensity as a function of 2θ and temperature using false colour and/or isolines; the colour scale denotes intensity (red = high, green–yellow = intermediate, blue = low, grey = negligible), allowing subtle changes in crystallinity and phase transitions to be tracked during heating and cooling. In Fig. S1 the asymmetry due to the differences in the reflections before heating to 1000°C and the equivalent reflections at 25°C during cooling were observed.

Figure 6. Two-dimensional representation with false colour of the in situ thermal XRD patterns of the La Marañosa BE sample.
Raman spectroscopy
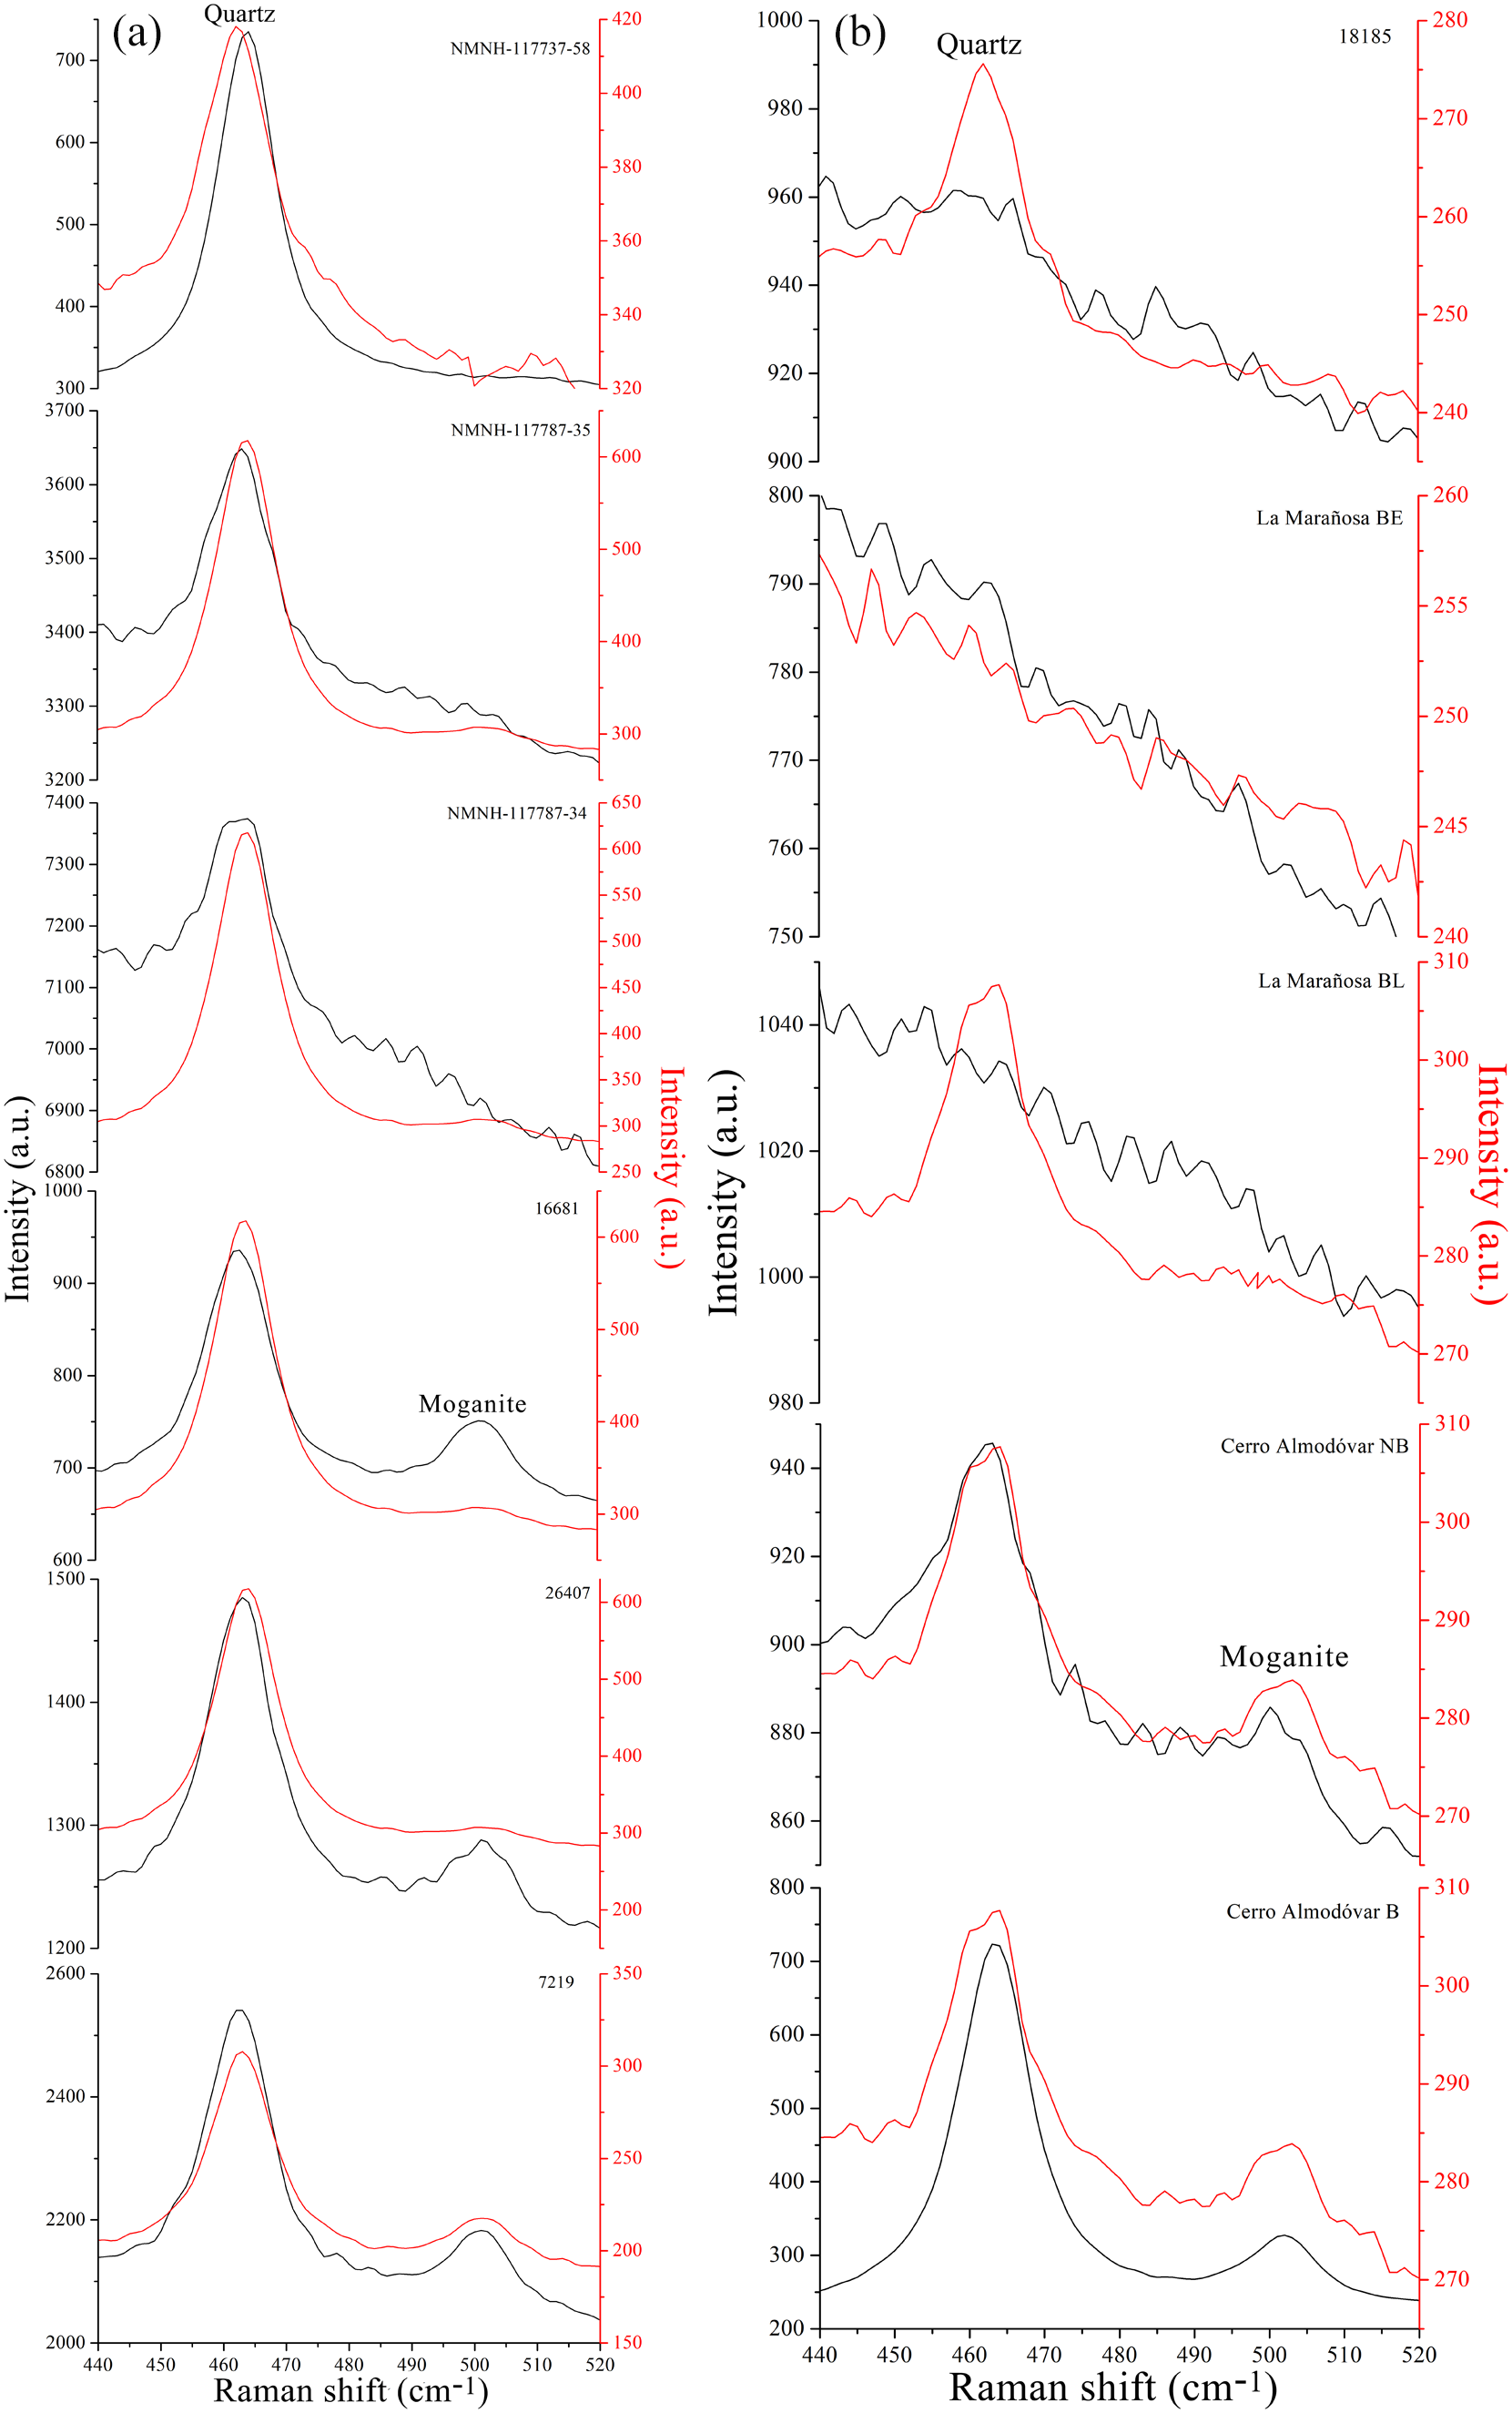
The Raman spectrum section between 440 and 520 cm–1 of the starting and heat-treated samples is shown in Fig. 7a for the quarzitic cherts and in Fig. 7b for the tridymitic/cristobalitic cherts. The high intensity band at 462 cm–1 is associated with the presence of quartz (Kingma and Hemley, Reference Kingma and Hemley1994; Sitarz et al., Reference Sitarz, Wyszomirski, Handke and Jelen2014), and the band visible around 501 cm–1 is associated with the presence of four-member rings in the moganite structure (Sitarz et al., Reference Sitarz, Wyszomirski, Handke and Jelen2014; Götze et al., Reference Götze, Nasdala and Kleeberg1998). The intensity of the Raman spectra of the samples heated at 1000°C is significantly lower than that of the starting samples.

Figure 7. Raman spectra of starting (black) and post-heat treatment (red) samples between 420 and 520 cm–1 showing the bands corresponding to moganite (∼500 cm–1) and quartz (∼463 cm–1) for: (a) quartzitic cherts and (b) tridymitic/cristobalitic cherts.
Discussion
Moganite
The presence of moganite in the cherts is independent of the type of chert (quartzitic or cristobalitic/tridymitic) but in the cherts that do not contain quartz, moganite was not detected by XRD or Raman spectroscopy. In addition, the detection of moganite by Raman spectroscopy coincides with its identification by XRD in the unheated cherts. The decrease in the Raman vibrational mode characteristic of moganite after heating to 1000°C for the cherts containing it, could be due to the symmetry change that occurs at 300°C. With Raman spectroscopy it was also possible to observe variations in the moganite content within the same chert sample, because this phase presents textural variations, corroborating observations made previously by Rodgers and Cressey (Reference Rodgers and Cressey2001) on other types of chert. Furthermore, Raman spectroscopy is a technique with sub-micron spatial resolution capable of detecting a phase such as moganite with a concentration undetectable by ordinary XRD. This investigation confirms that XRD and Raman spectroscopy are essential and complementary in the detection and quantification of moganite (Rodgers and Cressey, Reference Rodgers and Cressey2001), a crucial phase in determining the mineralogical maturity of a chert. Also, with the XRD technique, it is not necessary to use a position-sensitive detector system such as that cited by Rodgers and Cressey (Reference Rodgers and Cressey2001), as current instruments are significantly more sensitive than those used in the past.
Chert type and age
There is a correlation between unheated chert type and age. The younger Miocene cherts are predominantly cristobalitic/tridymitic whereas the older Cretaceous, Palaeogene and Carboniferous cherts are quartzitic. However, no correlation was found between elemental composition and age.
From the data provided by the techniques used in the characterisation of the investigated cherts it has been possible to describe their thermal behaviour according to the process described in this study.
Chert types after heating
After heating, the cherts cannot be differentiated into quartzitic and cristobalitic/tridymitic types because they all may contain some quartz, cristobalite and tridymite. In the heat-treated quartzitic cherts, the most important feature observed was the coexistence of low quartz and moganite with tridymite and/or high cristobalite formed by quartz transformation. However, in the heat-treated cristobalitic/tridymitic cherts, the same siliceous phases present in these unheated cherts were maintained but some cristobalite transformed to high cristobalite. Tridymite would have formed before cristobalite (Fenner, Reference Fenner1913), although according to Stevens et al. (Reference Stevens, Hand and Sharp1997) it would not be a stable phase and cristobalite would have formed earlier.
In summary, heating of quartzitic cherts led to the transformation of some quartz into tridymite and high cristobalite and also to the transformation of some moganite with monoclinic symmetry into moganite with orthorhombic symmetry. In the case of the cristobalitic/tridymitic cherts some cristobalite was transformed into high cristobalite.
Additionally, both non-siliceous and silicate phases, including phyllosilicates, were found to have transformed into vitreous phases after heating, some of which crystallised into new crystalline phases. The formation of wollastonite (CaSiO3) in sample 26407 probably occurred at the expense of the calcite (CaCO3) present in the starting sample due to decarbonation processes. The presence of anorthite (Ca(Al2Si2O8)) in NMNH-117737-58 can be explained by the disappearance of epidote (Ca2(Al,Fe)3(SiO4)3(OH)) and microcline (K(AlSi3O8)) after heating the starting sample because albite (Na(AlSi3O8)) and anorthite are part of the complete solid solution of plagioclase feldspars. Diopside (CaMg(SiO3)2) probably formed in NMNH-117787-35 at the expense of dolomite (CaMg(CO3)2) in the starting sample.
Although XRD analyses of cherts heated to 1000°C are recorded after cooling to room temperature, the quartz inversion caused by decreasing temperature allowed the detection of low quartz.
Transformations during heating
In the samples heated and analysed with in situ XRD, sepiolite (Mg4Si6O15(OH)2·6H2O) probably transformed into a vitreous phase during the heating of the Cerro Almodóvar NB and La Marañosa BE samples. In the heating of the La Marañosa BE sample, transformation of sepiolite to enstatite was observed at 1000°C remaining on cooling down to 25°C. Sepiolite loses water up to 300°C, rehydrates and restores its structure at 500°C, and transforms into protoenstatite and enstatite at 800°C, with enstatite remaining up to 1000°C (Preisinger, Reference Preisinger1959; Müller and Kolterman, Reference Müller and Kolterman1965; Fernández Álvarez, Reference Fernández Álvarez1970). However, the dehydration and rehydration (which involves disorder or structural collapse and subsequent restructuring) was not observed in this study, probably due to the specific characteristics of the sample, experimental conditions, interference from other substances or phases, etc.
The XRD during heating showed that the crystallinity of the heat-treated La Marañosa BE sample (Fig. 6) is much lower than that of the heat-treated Cerro Almodóvar B sample. In the Cerro Almodóvar B sample (Fig. 5), the decreasing intensity of the main quartz and tridymite reflections from 25 to 100°C coincides with the transformation observed in the 2D representation with false colour of the in situ thermal XRD pattern between 100 and 200°C, and would correspond to displacive transformations of low- and high-temperature forms of tridymite (Richerson, Reference Richerson1992). The decreasing intensity of the main quartz and tridymite reflections between 500 and 600°C coincides with the transformation observed in the 2D representation (Fig. 5) with false colour of the in situ thermal XRD pattern between 500 and 600°C, and would correspond to the inversion of α–β quartz (Richerson, Reference Richerson1992). For reference, the cristobalite (111 at ~21.5–21.6° 2θ) positions used to track its evolution are listed in Table 2. The decreasing intensity of the main quartz and tridymite reflections between 500–600°C coincides with the transformation observed in the 2D representation with false colour of the in situ thermal difractogram pattern between 500–600°C and would correspond to the inversion of α–β quartz (Richerson, Reference Richerson1992). The transformation observed in the 2D representation with false colour of the in situ thermal XRD pattern between 800 and 900°C corresponds to reconstructive transformations of high quartz to tridymite (Fenner, Reference Fenner1913). On the other hand, up to 600°C a gradual change in the °2θ value of the reflection (101) occurred with in situ heating of the chert samples. Above this temperature, the α–β quartz inversion temperature, the value of °2θ was maintained, at 800°C it decreased, coinciding with the high quartz to tridymite transformation, and increased again at higher temperatures.
The variations in FWHM of the reflections of quartz and cristobalite could suggest changes in the crystal quality or size with temperature. The (111) cristobalite reflection of the La Marañosa BE sample remaining fairly constant at ∼21.58°2θ might suggest that the cristobalite structure is stable across the temperature range. The slight increase after cooling might indicate a minor structural change or relaxation after the thermal cycle. Greater FWHM values of cristobalite at lower temperatures indicate lower crystallinity or smaller crystalline domains. The decrease in FWHM values of the cristobalite reflection (111) at around 200–300°C might suggest an increase in crystallinity or growth of crystalline domains at these temperatures. The fluctuations at higher temperatures would indicate ongoing changes in the crystal structure or quality with temperature.
Overall, these trends provide insights into the thermal stability and structural changes of quartz and cristobalite with temperature. In addition, if there is a change in the chert properties due to being heated, then this could also have an effect their conservation (i.e. archaeological applications).
Summary
The progress of crystalline transformations in cherts, as revealed by XRD measured after cooling and by in situ XRD during heating, may alter the chert properties and influence e.g. the process of carving archaeological tools or its conservation. Heat treatment is a process used in archaeology to modify the properties of lithic raw materials to improve their knapping quality. This technique was practiced in southern Africa during the Middle Stone Age (Brown et al., Reference Brown, Marean, Herries, Jacobs, Tribolo, Braun, Roberts, Meyer and Bernatchez2009; Mourre et al., Reference Mourre, Villa and Henshilwood2010; Porraz et al., Reference Porraz, Texier, Archer, Piboule, Rigaud and Tribolo2013), it is known from the European Upper Palaeolithic, Mesolithic and Neolithic (Bordes, Reference Bordes1969; Binder, Reference Binder1984; Tiffagom, Reference Tiffagom1998; Léa, Reference Léa2005 and Eriksen, Reference Eriksen and Kind2006), and the American Palaeo-Indian period (Crabtree and Butler, Reference Crabtree and Butler1964; Wilke et al., Reference Wilke, Flenniken and Ozbun1991).
Conclusions
These experiments provide insights into the thermal stability and structural changes of quartz and cristobalite when heated and during heating.
The presence of moganite in the cherts investigated is independent of whether the chert is quartzitic or cristobalitic/tridymitic. Heat-treated cherts cannot be differentiated into these two types, as they may all contain quartz, cristobalite and tridymite. In heat-treated quartzitic cherts, some quartz transforms into tridymite and high cristobalite, and some monoclinic moganite transforms into orthorhombic moganite, coexisting with low quartz, tridymite, and/or high cristobalite. In heat-treated cristobalitic/tridymitic cherts, the same siliceous phases are maintained, but cristobalite transforms into high cristobalite. Non-siliceous and silicate phases in the cherts transform into vitreous phases upon heating, some of which crystallise into new crystalline phases.
The temperatures of the quartz, tridymite, and cristobalite displacive and reconversion transformations observed in the cherts at 1000°C agree with those published in the literature. These conclusions highlight the importance of using both XRD and Raman spectroscopy for comprehensive chert analysis and understanding the complex thermal behaviour of cherts. X-ray diffraction and Raman spectroscopy are complementary techniques for detecting and quantifying moganite, with Raman spectroscopy capable of detecting lower concentrations and textural variations than XRD within the same sample. The 2D representation with false colour of the in situ thermal XRD patterns is very useful for visualising polymorphic transformations and dilation variations of the XRD reflections in the cherts.
The analytical tools applied in this study, namely XRD and Raman spectroscopy, provide a more suitable and efficient alternative to conventional petrographic microscopy for characterising the mineral phases of cherts. XRD and Raman allow rapid and accurate identification of siliceous and non-siliceous phases, however in situ XRD is particularly valuable for monitoring crystalline transformations during heating that cannot be observed after cooling.
The modification of the properties of cherts may vary depending on how the heat treatments are conducted.
A key outcome of this study is that the in situ XRD experiments during heating provided direct evidence of crystalline transformations occurring, such as phase inversions and reconstructive transitions, which could not have been fully identified in the patterns obtained after cooling. This demonstrates that in situ XRD during heating is essential for capturing transient mineralogical changes in cherts that would otherwise remain undetected. The in situ XRD experiments conducted here were particularly useful because they allowed the detection and monitoring of transient crystalline transformations during heating, such as the stepwise evolution of quartz, tridymite, cristobalite and moganite polymorphs. These transformations would not have been fully evident from post-heating analyses, and their direct observation was essential to establish the sequence of mineralogical changes and to evaluate how heat treatment modifies the properties of cherts.
Finally, a correlation is observed between chert type (quartzitic and cristobalitic/tridymitic) and age, indicating a relationship between mineralogical composition and age. However, no correlation was found between elemental composition and age. Nevertheless, it is confirmed that the cherts examined in this study are biogenic. Further analysis is needed to confirm these observations.
Acknowledgements
The authors acknowledge the Scientific-Technical Services of the University of Oviedo (Spain) for the X-ray diffraction work. They also thank the Barcelona Science Museum (Spain), Geominero Museum (Madrid, Spain) and the Smithsonian Institution (Washington, USA) for providing chert samples for this research.
Funding
This work was supported by Ministerio de Ciencia e Innovación (MCINN) project HAR2017-82557-P and MCIU-20-PCI2019-111931-2.
Supplementary material
The supplementary material for this article can be found at https://doi.org/10.1180/mgm.2025.18.
Competing interests
The authors declare none.


 Open access