


Impact statement
This article shows a practical way to make environmental models genuinely useful to people who need to act – water managers, farmers, landowners and local authorities. Instead of presenting model results as fixed answers, we use them to structure fair, two-way conversations about nature-based solutions (NbS) for drought, flooding and carbon. The approach distinguishes what is technically possible (“opportunity space”) from what is publicly acceptable and feasible (“decision space”), then uses clear maps and simple indicators to reveal where these overlap. This helps groups move from ideas to implementable actions more quickly, and with more buy-in.
The framework has three practical benefits. First, it improves transparency: assumptions, trade-offs and uncertainties are discussed in plain language, so participants understand what the model can and cannot say. Second, it supports social learning: stakeholders co-define objectives and review results iteratively, which surfaces local knowledge that models often miss. Third, it is scalable: starting from catchment-wide insights and zooming into specific sites makes it easier to link strategic planning with on-the-ground decisions.
Although demonstrated in a Dutch–Belgian catchment facing water stress and the need to increase soil carbon, the method is transferable. Any region weighing NbS can adapt the same steps – co-selecting indicators, exploring scenario maps together and recording how feedback changes the next model run. By turning models into conversation tools rather than one-way “black boxes,” the work helps public bodies design measures that are both effective and legitimate, supports policy alignment and shortens the path from analysis to action. In short, it strengthens the link between evidence, participation and real-world implementation of NbS.
Introduction
Environmental models can play a critical role in facilitating stakeholder discussions within complex decision-making processes. They support the visualization of scenarios, stimulate dialogue and enable the sharing of perspectives among diverse stakeholders (Andersson, Reference Andersson2004; Mielke and Geiges, Reference Mielke and Geiges2018). For instance, agent-based models and interactive visualizations have proven effective in enhancing the impact of these discussions, particularly in the context of transitions to more sustainable practices such as nature-based solutions (NbS; Becu et al., Reference Becu, Bousquet, Barreteau, Perez and Walker2003; Mielke and Geiges, Reference Mielke and Geiges2018). Such transitions often necessitate changes in land use, especially in river catchment planning for flood mitigation and drought resilience. However, ensuring transparency in model design and assumptions remains essential to promote socially robust, democratic and inclusive decision-making (Mielke and Geiges, Reference Mielke and Geiges2018).
Stakeholder engagement is a critical component of environmental and land-use planning. From a land and water management perspective, this is particularly evident in rural areas where stakeholders frequently own the land and are required to alter or completely change their practices (Frame et al., Reference Frame, Gunton and Day2004; Koontz, Reference Koontz2005). In practice, such change is prompted by tighter regulatory targets, repeated drought/flood impacts, shifting incentives and planning-cycle windows. In rural, privately owned landscapes, these triggers translate directly into parcel-level decisions about what must change, where and by when (Gunningham and Sinclair, Reference Gunningham and Sinclair1999; Greiner et al., Reference Greiner, Patterson and Miller2009; Prokopy et al., Reference Prokopy, Floress, Arbuckle, Church, Eanes, Gao, Gramig, Ranjan and Singh2019). Consequently, comprehensive information on the effects of planned or suggested land use change is necessary to facilitate informed and collaborative decision-making, a topic frequently addressed during stakeholder meetings. Echoing Putnam’s (Reference Putnam2002) emphasis, dialogue and the exchange of arguments are crucial at the interface of science and society when addressing complex issues like flooding or droughts (Putnam, Reference Putnam2002).
Although countless intervention options exist in theory, only a limited set is deemed viable in context-specific practice due to specific spatial, environmental, political and socioeconomic constraints. This highlights the importance of stakeholder meetings for articulating expectations, identifying opportunities and balancing multiple – often competing – objectives (Koontz, Reference Koontz2005; Cuppen, Reference Cuppen2012; Colvin et al., Reference Colvin, Witt and Lacey2020). These discussions are frequently hampered by differing knowledge bases, perspectives and priorities (Cuppen, Reference Cuppen2012). Environmental models can address this challenge by offering a structured approach to problem framing, intervention visualization and impact assessment (Salter et al., Reference Salter, Robinson, Wiek and Assessment2010; Hassenforder et al., Reference Hassenforder, Smajgl and Ward2015; Raymond et al., Reference Raymond, Frantzeskaki, Kabisch, Berry, Breil, Nita, Geneletti and Calfapietra2017; Mcevoy et al., Reference Mcevoy, Van De, Blind and Slinger2018; Pasquier et al., Reference Pasquier, Few, Goulden, Hooton, He and Hiscock2020). Still, model-based research does not always achieve its intended stakeholder uptake or influence (Hughes et al., Reference Hughes, Van Wonderen, Rees, Seymour, Manful and Karl2012).
In our view, effective stakeholder engagement often requires models to be understandable and relevant to different stakeholder groups while also being technically robust, enabling use by nonexperts and ensuring the process supports mutual respect and learning (Andersson, Reference Andersson2004). Cash et al. (Reference Cash, Borck and Patt2006) outline four functions essential for effective uptake of scientific insights: conveying goals collaboratively, translating technical results into accessible formats, facilitating dialogue and mediating competing perspectives (Cash et al., Reference Cash, Borck and Patt2006). Achieving successful benefits requires managing expectations and maintaining a realistic perspective, as models do not always provide definitive answers. It is essential to communicate the limitations and uncertainties of models in a way that fosters mutual trust and confidence between the stakeholders and both the modeling team and the model itself. Ultimately, it is the understanding derived from the model, rather than the model alone, that holds the greatest importance.
Existing literature highlights gaps regarding the practical application of models and visual modeling tools in planning contexts. For instance, Billger et al. (Reference Billger, Thuvander and Wästberg2017) and Rixon and Burn (Reference Rixon and Burn2008) call for more research on visualization tools in real-life planning (Rixon and Burn, Reference Rixon and Burn2008; Billger et al., Reference Billger, Thuvander and Wästberg2017), while Voinov et al. (Reference Voinov, Kolagani, McCall, Glynn, Kragt, Ostermann, Pierce and Ramu2016) emphasize the potential of virtual environments to enhance communication. Scholars such as El-Diraby (Reference El-Diraby2023) and Gray et al. (Reference Gray, Chan, Clark and Jordan2012) critique rigid, standardized models that fail to evolve with stakeholder interactions, reducing innovation and contextual relevance (Gray et al., Reference Gray, Chan, Clark and Jordan2012; El-Diraby, Reference El-Diraby2023).
However, so far, the literature is either focused on the social aspect of this process, specifically considering factors when modeling with stakeholders, related to the identification of the stakeholders (or stakeholder groups) (Walker et al., Reference Walker, Bourne and Shelley2008; André et al., Reference André, Simonsson, Swartling and Linnér2012; Zingra et al., Reference Zingra, Hüesker, Lupp, Begg, Huang, Oen, Vojinovic, Kuhlicke and Pauleit2020) or on the methods of their involvement (Glicken, Reference Glicken2001; Hare, Reference Hare2011; Basco-Carrera et al., Reference Basco-Carrera, Warren, van Beek, Jonoski and Giardino2017; Uittenbroek et al., Reference Uittenbroek, Mees, Hegger and Driessen2019; Bogatinoska et al., Reference Bogatinoska, Lansu, Hugé and Dekker2022). The outcomes of stakeholder engagement have been the subject of investigation by several researchers (Hummel et al., Reference Hummel, Van Houcke, Nadolski, Van Der Hiele, Kurvers and Löhr2011; Almoradie et al., Reference Almoradie, Cortes and Jonoski2015; Löschner et al., Reference Löschner, Nordbeck, Scherhaufer and Seher2016; Santoro et al., Reference Santoro, Pluchinotta, Pagano, Pengal, Cokan and Giordano2019; Moreno et al., Reference Moreno, Roman-Cuesta, Canty, Herrera, Teutli, Muñiz-Castillo, McField, Soto, Amaral, Paton, González-Trujillo, Poulter, Schumacher and Durán-Díaz2022). The other area of focus in the literature is more technical in nature, pertaining to the modeling aspects and essential factors involved in communicating uncertainties or model performance with stakeholders (Webler et al., Reference Webler, Tuler and Dietz2011; Will et al., Reference Will, Dressler, Kreuer, Thulke, Grêt-Regamey and Müller2021; Tuler et al., Reference Tuler, Webler, Hansen, Vörösmarty, Melillo and Wuebbles2023). Consequently, there is a scarcity of literature devoted to the nexus between the social science and technical aspects of stakeholder engagement with models. This area of inquiry is concerned with the role of environmental modeling in stakeholder discussions, with a particular focus on the different ways of defining opportunity and decision spaces, as conceptualized by Mark (Reference Mark1999). This article addresses this gap by exploring how models can be used to structure bottom-up environmental planning discussions rather than prescribing top-down solutions. We do so through a case study of the Aa of Weerijs catchment on the Netherlands–Belgium border, where stakeholders assess NbS aimed at reducing drought and flood risks, while also enhancing carbon sequestration. According to the Resolution 5 from the UNEP report on NbS for supporting sustainable development, we define the concept of NbS as ‘actions to protect, conserve, restore, sustainably use and manage natural or modified terrestrial, freshwater, coastal and marine ecosystems and calls for more collaboration and resources’. We selected the river Aa of Weerijs catchment because rising water stress, the presence of water-sensitive tree nurseries and cross-border governance make sustained stakeholder discussion essential. NbSs are presented as possible climate adaptation measures in the area, especially as farmers and other stakeholders might need to change their land use practices to implement these NbS. This situation increases the need for a bottom-up participatory approach to NbS planning and implementation. Consequently, in this research, we demonstrate how different types of model contributions (MCs) – sensitivity analysis, impact assessment and scenario evaluations – facilitate dialogue and build alignment between technical opportunities and stakeholder preferences. Our framework centers on the concepts of opportunity space – the set of interventions that are technically and physically feasible according to the model, given biophysical and hydrological constraints – and decision space – the subset of interventions that stakeholders consider acceptable in light of landownership, production needs, policy priorities and other socioeconomic or political constraints. Models help visualize where these spaces overlap, where they diverge, identify gaps and guide structured discussions to align interventions with shared goals. We hypothesize that (i) a coupled water–carbon modeling workflow, translated into simple indicators and maps, can help stakeholders move from a broad ‘opportunity space’ of nature-based options to a more realistic ‘decision space’ and (ii) the same workflow can be transferred to other catchments and models with minimal adaptation.
Materials and methods
Study area
To test the role of modeling on diverse opportunities in land transitions in stakeholder discussions, we use a practical real-life case, the Aa of Weerijs river catchment. The catchment area of the Aa of Weerijs is transboundary, encompassing territories in both Belgium and the Netherlands. The river has its source in Flanders (Belgium) and ultimately discharges into the canals in Breda, a city in the Netherlands. The area was originally a vast wetland, which was subsequently reclaimed in the fourteenth century and further expanded for agricultural use in the nineteenth century. During this period, numerous waterways were constructed, resulting in the formation of the present-day stream valley area within the catchment. Over time, the majority of the former wetland and several streams were realigned to facilitate faster drainage of excess precipitation. The primary land use is agriculture, with grassland being the most prevalent, followed by arable farming and tree cultivation. The width of the stream valley is approximately 3 km, and the catchment area is 346 km2. The principal tributaries are the Kleine Beek, Bijloop and Turfvaart (Beers et al., Reference Beers, Coenen, Keizer and Moll2018).
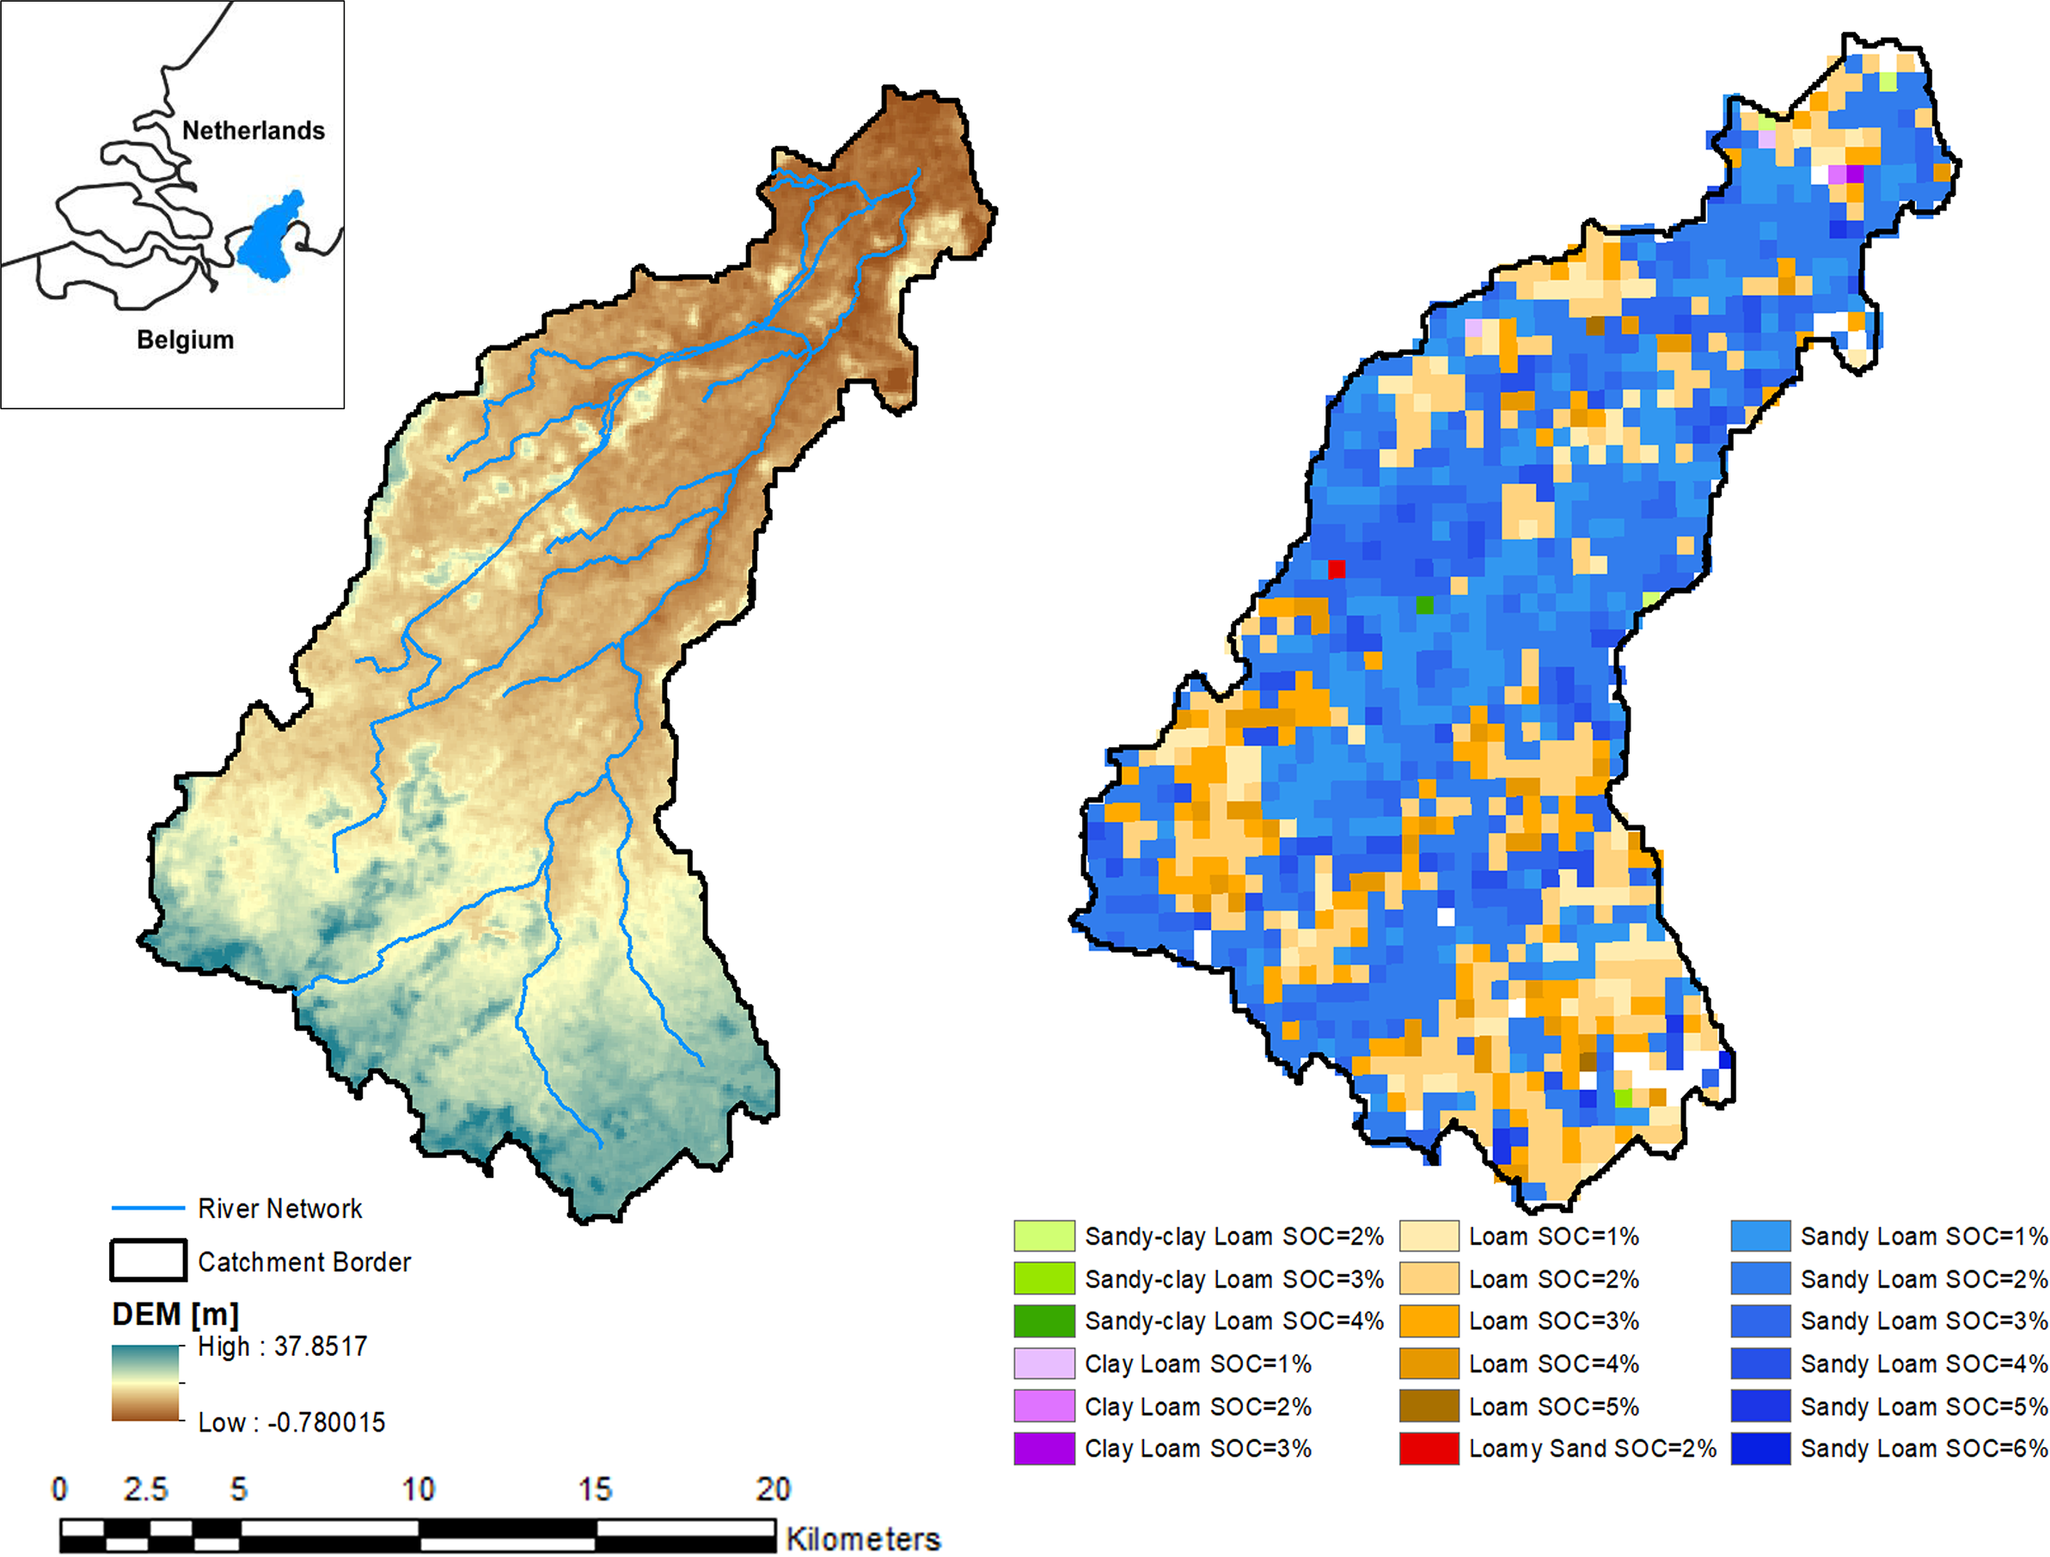
During periods of high precipitation, the water is discharged rapidly due to the limitations of drainage and the restricted natural storage capacity. Conversely, during periods of low precipitation, the discharge is significantly reduced. Furthermore, the catchment is subject to the effects of a number of significant groundwater abstractions and irrigation demands. The high concentration of nutrients from agricultural activities has also had a severe impact on aquatic life in the catchment (Beers et al., Reference Beers, Coenen, Keizer and Moll2018). The predominant soil type in the area is sandy loam, with soil organic carbon (SOC) contents within the range of 1–6%. Furthermore, loamy soils are present, exhibiting SOC levels within the range of 1–5% (Figure 1).

Figure 1. Digital elevation model including the river network (left) and soil map (right) of the Aa of Weerijs catchment.
The Aa of Weerijs catchment is facing a significant risk of drought, largely due to agricultural practices. The effects of climate change, including rising temperatures and more frequent and intense precipitation, are further exacerbating the water quality and quantity issues in the catchment. Consequently, a reduction in river discharge is anticipated during the summer months (Beers et al., Reference Beers, Coenen, Keizer and Moll2018). That is why, in the context of the Aa of Weerijs catchment, drought is defined hydrologically as a sustained period of reduced water availability due to a combination of meteorological conditions (low precipitation) and anthropogenic factors (e.g., high agricultural water demand).
NbS, namely through land use change, and for the context of smaller brook catchments, are discussed between practitioners and stakeholders in the context of Aa of the Weerijs catchment. With this type of environmental and land use planning, the main objective is enhancing the multifunctionality of the area and addressing environmental challenges, namely drought and flooding. Furthermore, in light of the ongoing discussions among stakeholders in the catchment area regarding drought mitigation and the necessity for enhanced carbon sequestration (IPCC, Reference Arias, Bustamante, Elgizouli, Flato, Howden, Méndez-Vallejo, Pereira, Pichs-Madruga, Rose, Saheb, Sánchez Rodríguez, Ürge-Vorsatz, Xiao, Yassaa, Romero, Kim, Haites, Jung, Stavins, Birt, Ha, Orendain, Ignon, Park, Park, Reisinger, Cammaramo, Fischlin, Fuglestvedt, Hansen, Ludden, Masson-Delmotte, Matthews, Mintenbeck, Pirani, Poloczanska, Leprince-Ringuet and Péan2023), it is imperative to consider the improvement of carbon sequestration within the area. This is particularly crucial in light of the significant historical alterations in land use that have contributed to elevated levels of carbon emissions (Ruyssenaars et al., Reference Ruyssenaars, Coenen, Rienstra, Zijlema, Arets, Baas, Dröge, Geilenkirchen, t Hoen, Honig, van Huet, van Huis, Koch, te Molder, Montfoort, van der Zee and van Zanten2021; Timmer, Reference Timmer2022). Furthermore, it is crucial to establish a carbon-water model linkage, given the profound impact of SOC on a range of soil-centered water processes, including water infiltration, evaporation, soil moisture and related sponge functioning and root uptake. This underscores the necessity for the application of a coupled water and carbon analysis (Sun et al., Reference Sun, Wu, Xiao, Hui, Hu, Zhao, Qiu and Liu2019; Zhao et al., Reference Zhao, Wu, Yao, Sun, Zhang, Winowiecki, Vågen, Xu, Qiu, Sun and Sun2020; Sun and Mu, Reference Sun and Mu2022).
Coupled water – carbon model
In this study, we use a coupled water–carbon models to simulate the impacts of NbS interventions and support structured stakeholder discussions. The hydrological processes are simulated with an existing hydrological model, and carbon processes are simulated with a relatively simple carbon model, designed to fit the spatial scale of the hydrological model. In order to provide a holistic understanding of landscape functions, these models were coupled using the framework of Bogatinoska et al. (Reference Bogatinoska, Lansu, Hugé, Ali, Dekker and Stoorvogel2024). Since stakeholder discussions in the area of Aa of Weerijs are mainly centered around land use change, this is how we will parameterize NbS in this illustrative study. Usually, the influence of NbS within standard hydrological models can be represented either by altering model parameters and boundary conditions to reflect different land cover and drainage pathways, adjusting the topology of streamlines within the drainage network or by adding modules to existing flood modeling software to manage runoff from various flow pathways (Metcalfe et al., Reference Metcalfe, Beven, Hankin and Lamb2017; Hankin et al., Reference Hankin, Metcalfe, Beven and Chappell2019; Griffiths et al., Reference Griffiths, Borne, Semadeni-Davies and Tanner2024). In this study, we operationalized NbS via land-use change scenarios that the model can represent at catchment scale (e.g., conversion to wetlands or woodlands). This is a pragmatic modeling choice, not a conceptual equivalence: land-use change does not automatically constitute NbS (e.g., urban expansion), and many recognized NbS involve land-management changes without changing land use (e.g., cover crops, floodplain reconnection, buffer strips, retention ponds, woodchop bioreactors). Our results therefore speak to the subset of NbS that entail a land-use transition. The hydrological component is based on the MIKE SHE model, which was selected due to its demonstrated robustness and versatility in addressing a range of hydrological processes (Abbott et al., Reference Abbott, Bathurst, Cunge, O’Connell and Rasmussen1986). MIKE SHE is a physically based, spatially distributed model capable of simulating surface and subsurface flow dynamics across different spatial scales. It integrates MIKE 11 for channel flow modeling, making it suitable for evaluating complex, catchment-wide scenarios like NbS (Im et al., Reference Im, Kim, Kim and Jang2009; Aredo et al., Reference Aredo, Hatiye and Pingale2021; Paudel and Benjankar, Reference Paudel and Benjankar2022). Literature emphasizes that process-based models such as MIKE SHE are particularly well suited for NbS planning because of their ability to simulate new scenarios under changing environmental conditions (Zhang and Chui, Reference Zhang and Chui2019).
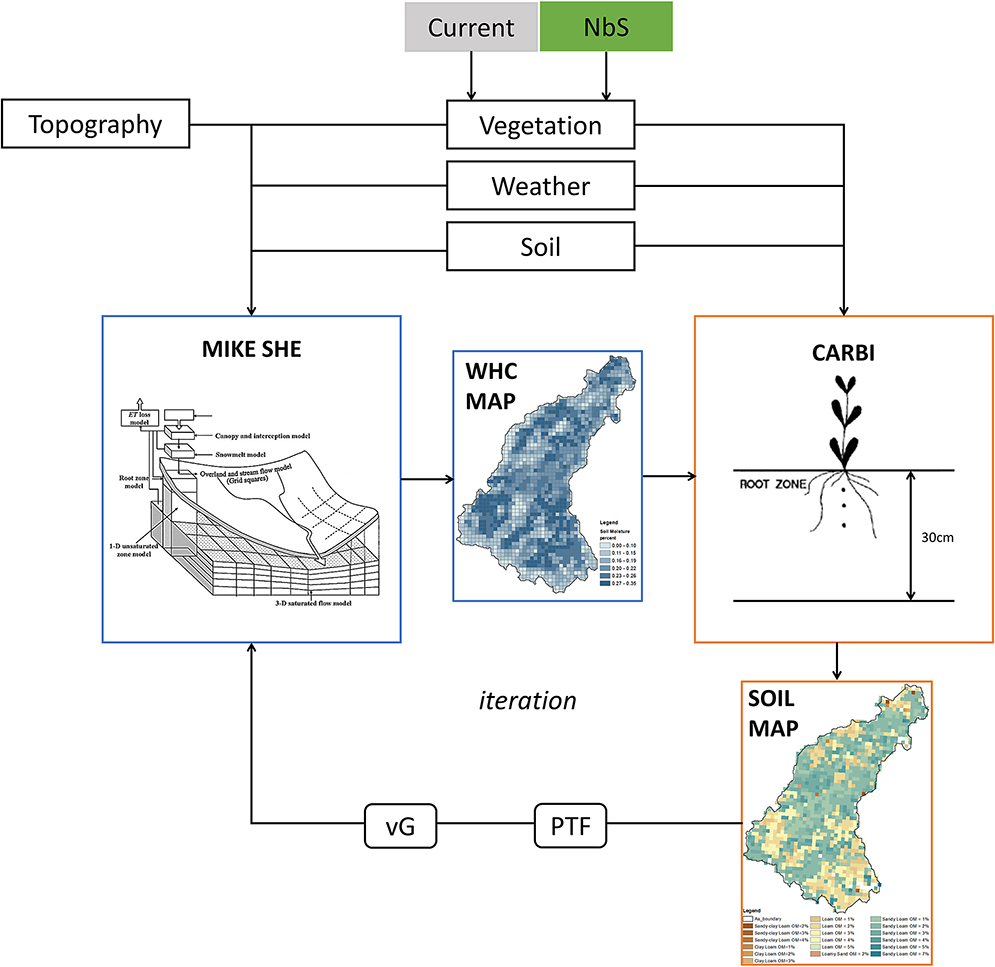
Additionally, MIKE SHE stands out for incorporating Mualem van Genuchten soil hydraulic parameters (vG, Figure 2), influencing soil retention curves and hydraulic conductivity. We use soil hydraulic parameterization because they describe how water is stored and transmitted in the soil profile via a set of shape parameters (θᵣ, θₛ, α, n, l) and the saturated conductivity Kₛ. Unlike other models, this integration recognizes the nonendogenous nature of these variables and acknowledges the impact of SOC on soil hydraulic parameters, crucial for understanding the landscape’s overall hydrology. The Mualem van Genuchten parameters are calculated using the pedotransfer function (Figure 2) (Wösten et al., Reference Wösten, Finke and Jansen1995).

Figure 2. Water (MIKE-SHE) in blue and Carbon (CARBI) in orange, coupled model framework (Bogatinoska et al., Reference Bogatinoska, Lansu, Hugé, Ali, Dekker and Stoorvogel2024).
The spatially distributed MIKE SHE model used in this study has been established, calibrated and validated for the Aa of Weerijs catchment (Umutoni, Reference Umutoni2021; Hassan, Reference Hassan2022; Ali et al., Reference Ali, Popescu, Jonoski and Solomatine2023; Jonoski et al., Reference Jonoski, Ali, Bertini, Popescu, van Andel and Lansu2025). It operates on a 500 m × 500 m grid and covers a 10-year period from September 15, 2009 to December 31, 2019 using observed data from for streamflow, soil moisture and groundwater levels, achieving high performance metrics such as Nash-Sutcliffe efficiency and Percent Bias. Vegetation-related parameters, including root depth, leaf area index (LAI) and evapotranspiration, were parameterized with datasets from the National Hydrological Instrument (Umutoni, Reference Umutoni2021; Nazar et al., Reference Nazar, Ali, Bertini, Popescu, Jonoski and van Andel2023; Jonoski et al., Reference Jonoski, Ali, Bertini, Popescu, van Andel and Lansu2025). Although the calibration period did not include large-scale reforestation, sensitivity analyses of vegetative parameters confirmed the model’s ability to simulate hydrological changes associated with NbS scenarios like afforestation. This ensures the robustness of its applications in evaluating long-term impacts of land-use changes. The model generates gridded results with daily time steps, including water content in the unsaturated zone, depth of overland flow and infiltration to the unsaturated zone. The model specifically runs past the year of 2018, as this was considered as the ‘driest’ year in the Netherlands.
The carbon model focuses on the SOC dynamics, addressing carbon sequestration in the landscape. Recognizing the complexity of SOC modeling, we narrow down our study to selected models, namely the CENTURY Model (Parton et al., Reference Parton, Scurlock, Ojima, Gilmanov, Scholes, Schimel, Kirchner, Menaut, Seastedt, Garcia Moya, Kamnalrut and Kinyamario1993), Roth C Model (Jenkinson, Reference Jenkinson1990) and Daisy Model (Abrahamsen and Hansen, Reference Abrahamsen and Hansen2000). The CENTURY and Roth C models utilize soil texture, specifically the percentage of clay, as an exogenous variable. Meanwhile, Daisy employs soil moisture as an exogenous variable for calculating carbon turnover.
Given the limitations and complexities of existing SOC models, a meta-model named CARBI was developed by Bogatinoska et al. (Reference Bogatinoska, Lansu, Hugé, Ali, Dekker and Stoorvogel2024) to assess the carbon sequestration potential in the catchment. CARBI adopts a static approach, focusing on one SOC pool and incorporating input from the MIKE SHE’s hydrological model. The model is calibrated to the spatial scale of MIKE SHE, ensuring compatibility. The linkage between the hydrological and carbon models is established through a loose coupling strategy, that has been already published in our previous research (Bogatinoska et al., Reference Bogatinoska, Lansu, Hugé, Ali, Dekker and Stoorvogel2024), where endogenous variables in one model become exogenous in the other, enhancing the overall understanding of landscape functions (Figure 2). Additionally, the modeling of NbS such as wetlands, tree planting and heathland restoration have been extensively explained in the study by (Nazar, Reference Nazar2023). Specifically, in MIKE SHE, wetlands are modeled by adjusting land-use and soil properties to simulate high water retention, surface water storage and gradual groundwater recharge. Heathland restoration is represented through modifications to vegetation and soil properties, such as reduced canopy cover and enhanced infiltration, mimicking natural conditions. Tree planting scenarios incorporate vegetation-specific parameters such as root depth, LAI and interception capacity to simulate increased water uptake and evapotranspiration, influencing soil moisture and groundwater dynamics.
Development of model contributions (MCs) and key performance indicators (KPIs) with stakeholders
The model contributions (MCs) and key performance indicators (KPIs) were developed through an integrated process combining stakeholder input, literature review and iterative modeling exercises. Model contributions (MCs) refer to how modeling results such as maps and graphs, can be used in stakeholder meetings to structure discussions. The KPIs refer to specific quantitative parameters that are used for assessing a specific landscape function, such as water or climate regulation. KPIs are usually defined by modelers and people with technical knowledge; however, in our case, the KPIs directly originate from the stakeholder themselves, through a participatory approach.
In this study, the stakeholder process was intentionally light-touch and designed to support and test the modeling workflow rather than to deliver a full participatory planning exercise. We invited a mix of regional authorities, water managers, landowners/farmers and environmental organizations from both the Dutch and Belgian sides of the catchment to two half-day workshops, on September 29, 2023 and March 25, 2024 with around 20 participants. The first workshop focused on co-defining objectives and indicators; the second focused on reviewing and discussing model scenarios and maps as inputs to further planning (EIFFEL, 2024a, 2024b).
The following steps were undertaken to align technical possibilities (or the defined opportunity space) with stakeholder priorities (the decision space):
-
1. Stakeholder identification and engagement: Stakeholders were identified based on their roles and potential influence on the management of the transboundary Aa of Weerijs catchment. Since the catchment is transboundary, starting from Belgium upstream and ending in the Netherlands downstream, both Belgian and Dutch stakeholders were invited to the workshops which was quite a challenge. Due to all kind of limitations, also in communication and time availability, Belgian stakeholders participated in the second workshop more in the form of consulting and informing (based on Arnstein’s participation ladder (Arnstein, Reference Arnstein1969) while the Dutch stakeholders were involved – higher in the ladder). Specifically, Dutch participants from the water board, the province and a few landowners and farmers directly discussed what the challenges are in the area, and how this could be translated to KPIs.
-
2. Definition of challenges and objectives: During the workshops, stakeholders highlighted key challenges, including frequent droughts, limited natural storage capacity and concerns regarding carbon emissions. These discussions informed the selection of objectives for the design of NbS and their expected landscape functions, namely water and climate regulation or more specifically improving drought resilience and enhancing carbon sequestration. Specifically for this area, since tree orchards are a dominant land use, it means the area is sensitive to water stress during longer periods of drought. Additionally, it was also brought to our attention by participants from the water board and province, that nontechnical users, such as farmers or landowners, require additional guidance and examples to effectively utilize the model results. Another point of discussion on the workshops was that a policy summary is necessary for engaging stakeholders at the decision-making level, that would be understandable by nontechnical stakeholders. This summary should link the models’ outputs to relevant policies, such as ‘water and soil systems as guiding principles in land-use planning.’ All participants agreed that meaningful impact can only be observed when interventions are implemented at a large scale. This aligns precisely with the model’s possibilities, since the larger spatial scale allows for viewing effects at a larger (catchment) scale. According to the stakeholders, the challenges also lie in adapting this approach for application in other catchments, which would demand considerable effort in modeling both water and soil carbon dynamics (EIFFEL, 2024b).
-
3. Prioritization of KPIs: Key indicators were co-selected with stakeholders to quantify the challenges listed above. The soil moisture index difference (ΔSMI) and ΔSOC were chosen for their relevance to evaluating drought mitigation and carbon sequestration, respectively (EIFFEL, 2024a; Jonoski et al., Reference Jonoski, Ali, Bertini, Popescu, van Andel and Lansu2025). Even though, more KPIs were selected and developed with the stakeholders during the workshops, such as surface water availability, groundwater availability, groundwater dynamics parameters and localized model outputs (EIFFEL, 2024a; Jonoski et al., Reference Jonoski, Ali, Bertini, Popescu, van Andel and Lansu2025), we will only showcase how the framework of MCs and KPIs can be applied using the SMI and SOC parameters. However, for other catchments, the same framework can be applied using other KPIs.
-
4. Explanation of model set up and calibration: At the beginning of both stakeholder workshops, presentations were given by the modelers to explain the model set up including input and output parameters, their calibration and validation and the limitations. This was done for both the hydrological and carbon model and after each presentation there was a discussion where stakeholders had the opportunity to ask questions.
-
5. Scenario co-design: Stakeholders contributed to the development of NbS scenarios, suggesting options such as wetland restoration, heathland restoration and tree planting (Nazar, Reference Nazar2023; Jonoski et al., Reference Jonoski, Ali, Bertini, Popescu, van Andel and Lansu2025). These suggestions were supplemented with technical feasibility studies and expert opinions.
Model outputs (maps/tables) are interpreted jointly by the modeling team and stakeholders during the workshops, and again in short follow-up sessions. As stated by Turnhout et al. (Reference Turnhout, Metze, Wyborn, Klenk and Louder2020) and De Angeli et al. (Reference De Angeli, Villani, Castelli, Rusca, Boni, Bresci and Piemontese2025), in all co-production work there are power imbalances and knowledge differences, including those from past experiences and background from other domains and even countries (Turnhout et al., Reference Turnhout, Metze, Wyborn, Klenk and Louder2020; De Angeli et al., Reference De Angeli, Villani, Castelli, Rusca, Boni, Bresci and Piemontese2025). Therefore, the process is per definition biased and selective. It is important to stress that co-modeling is not a guarantee to have unbiased results; however, we added the following steps to increase transparency: (i) display full legends and class thresholds; (ii) present alternative layer combinations side-by-side; (iii) log comments and divergent views verbatim and (iv) make available the complete set of generated maps for each MC, not only a curated subset. These steps promote transparency and reduce the possibility that either modelers or dominant voices steer conclusions unilaterally. As stated earlier, the main goal of our work is to develop a modeling workflow.
This study translated and used the outcomes of the stakeholder discussions in the following way:
Step 1: Defining the objectives of the NbS through KPIs. It is first necessary to specify the objectives of the NbS for each of the MCs. This is contingent upon the ongoing discussion with stakeholders and the identification of challenges within the catchments. This is followed by the selection of KPIs that are most pertinent to the specific challenges in question. They should ideally be co-created with the stakeholders, in an iterative process through multiple meetings or discussions, from the beginning until the end of the project, however, in practice different kinds of financial and/or time constraints make this challenging. In our Aa of Weerijs case study, we took initial steps toward this ideal by co-defining challenges and candidate KPIs in two mixed-stakeholder workshops (September 29, 2023 and March 25, 2024) involving regional authorities, the water board, provincial representatives and local landowners/farmers. The final selection of KPIs was made by the modeling team, based on these workshop discussions and a literature review, and should therefore be interpreted as partially, rather than fully, co-created. When disagreements arose on objectives or KPI definitions, we documented all proposals, sought consensus on a minimum common set, and – where disagreement persisted – carried forward parallel KPIs/scenario variants for side-by-side review in the next modeling cycle.
As previously stated in Section “Study area”, the objective of this modeling approach is to demonstrate how opportunities can be showcased in terms of drought and carbon sequestration. It is therefore necessary to compare two KPIs, one for drought – the ΔSMI (Sahbeni et al., Reference Sahbeni, Pleynet and Jarocki2023) (Eq. 2) – and one for carbon sequestration – the ΔSOC (Eq. 3). The specific KPIs have been selected on the basis of both stakeholder discussions and an examination of the literature on parameters used in drought and carbon sequestration analysis. We use ΔSMI and ΔSOC to summarize model outputs. In both cases, Δ refers to the difference from the reference scenario, with positive values indicating an increase relative to that reference.
The SMI is a metric that assesses the moisture content in the soil. It provides valuable insight into the availability of water for plants and ecosystems (Sahbeni et al., Reference Sahbeni, Pleynet and Jarocki2023). A value of 0 on the SMI scale indicates dry conditions, whereas a value of 1 indicates wet conditions in the unsaturated zone. Furthermore, the European Centre for Medium-Range Weather Forecast has adopted this same definition for the calculation of soil moisture anomaly using the hydrological model LISFLOOD at the European scale. The SMI can be presented at the catchment level or calculated grid by grid, or as a time series for a specific grid within the catchment. By calculating the SMI for the NbS and base model scenarios, we can calculate the ΔSMI.
The ΔSOC is a KPI utilized to assess the efficacy of NbSs or adaptation and mitigation strategies aimed at restoring and enhancing soil carbon levels in a degraded area. ΔSOC represents the quantification of the increase or decrease in organic carbon content (in percentage terms) per grid cell in an alternative NbS scenario as compared to the value of SOC (in percentage terms) in the same grid cell for its existing situation (ES). It is expressed in terms of carbon percentage for a specific soil texture, whereby the original carbon stock (kg/ha) is transformed to percentage using the bulk density for the soil texture in question within the grid cell. ΔSOC is computed per grid cell and then aggregated to the catchment, because the carbon submodel in the coupled water–carbon framework is static: it estimates the difference in potential SOC between land-use states, rather than simulating year-to-year carbon dynamics. The KPIs are parameterized in the following way:
 $$ SMI=1-\frac{1}{1+{\left(\frac{\theta }{\theta_{50}}\right)}^6}, $$
 $$ \Delta SMI={SMI}_{NBS}-{SMI}_{BM}, $$
 $$ \Delta \mathrm{SOC}={SOC}_{NBS}-{SOC}_{BM}, $$
where θ is the mean soil moisture content in terms of depth and θ
50 is the average between the wilting point and field capacity, $ {SOC}_{NBS} $
is the modeled SOC (%) for an NbS scenario and
$ {SOC}_{NBS} $
is the modeled SOC (%) for an NbS scenario and $ {SOC}_{BM} $
is the modeled SOC (%) for the ES (the base model) of the catchment.
$ {SOC}_{BM} $
is the modeled SOC (%) for the ES (the base model) of the catchment.
Once the objectives and their respective KPIs have been defined, it is essential to ascertain the contributions of the model in defining the opportunity space.
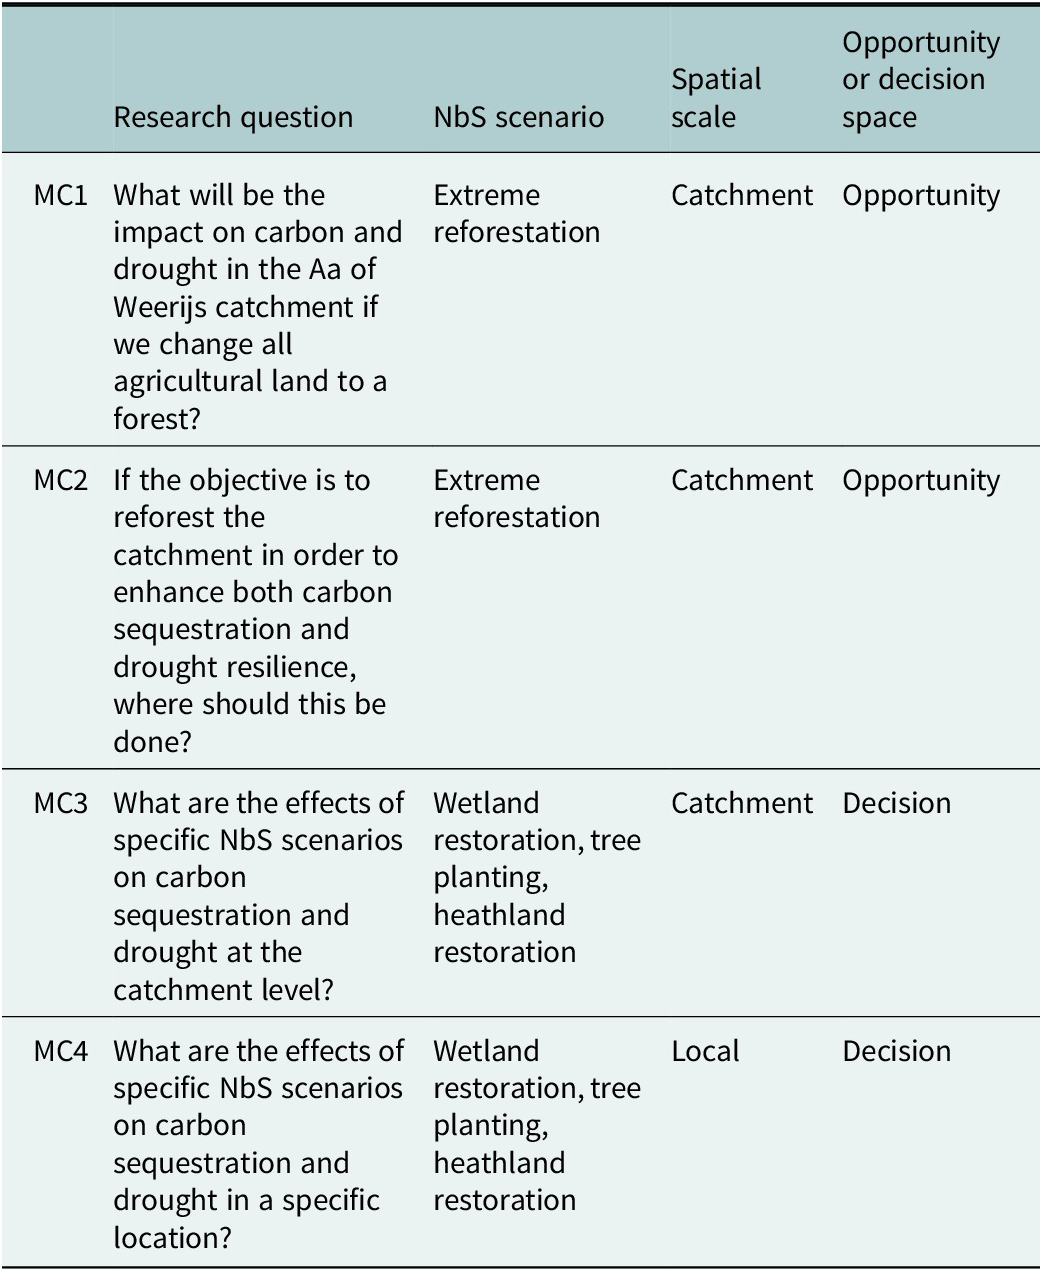
Step 2: Utilizing four models’ contributions (MC) to showcase the opportunity and/or decision space. MC1 – sensitivity analysis, MC2 – impact assessment, MC3 – Scenario evaluation catchment scale and MC4 – local scale (Table 1):
Table 1. The four model contributions’ (MCs) characteristics

Opportunity versus decision space approach
Our research is set in a specific case study area and employs the integrated model explained in Section “Development of MCs and KPIs with stakeholders” as an illustration for structuring stakeholder meetings using the framework of MCs and opportunity and decision space. This conceptual framework focuses on the alignment of the “opportunity space” (technically feasible options) and the “decision space” (stakeholder-preferred interventions). It is closely tied to stakeholder engagement processes, which should play a central role in the generation and refinement of options evaluated in the framework. In this section, we showcase how the outcomes of the MCs can be viewed within the framework of opportunity and decision space. Additionally, we will showcase the modeling results with the four different LULC changes and what this contributes to stakeholder discussions through the four MCs. Ideally, this should be a two way process, where stakeholders also contribute to improving the modeling, because they hold a lot of location-specific knowledge, which can often be overlooked by modelers.
Operationally, in the Aa of Weerijs case study, the opportunity space is delineated by the modeled NbS scenarios that deliver positive or acceptable ΔSMI and ΔSOC under biophysical constraints at catchment scale (MC1–MC2; Table 1). The decision space reflects stakeholder priorities and constraints expressed in the workshops, such as landownership, existing agricultural uses (e.g., tree nurseries) and cross-border governance considerations, which limit where and how NbS can realistically be implemented (MC3–MC4). The MCs therefore first map where NbS look promising from a hydrological and carbon perspective, and then show where these options coincide – or clash – with the locations and measures that stakeholders see as feasible.
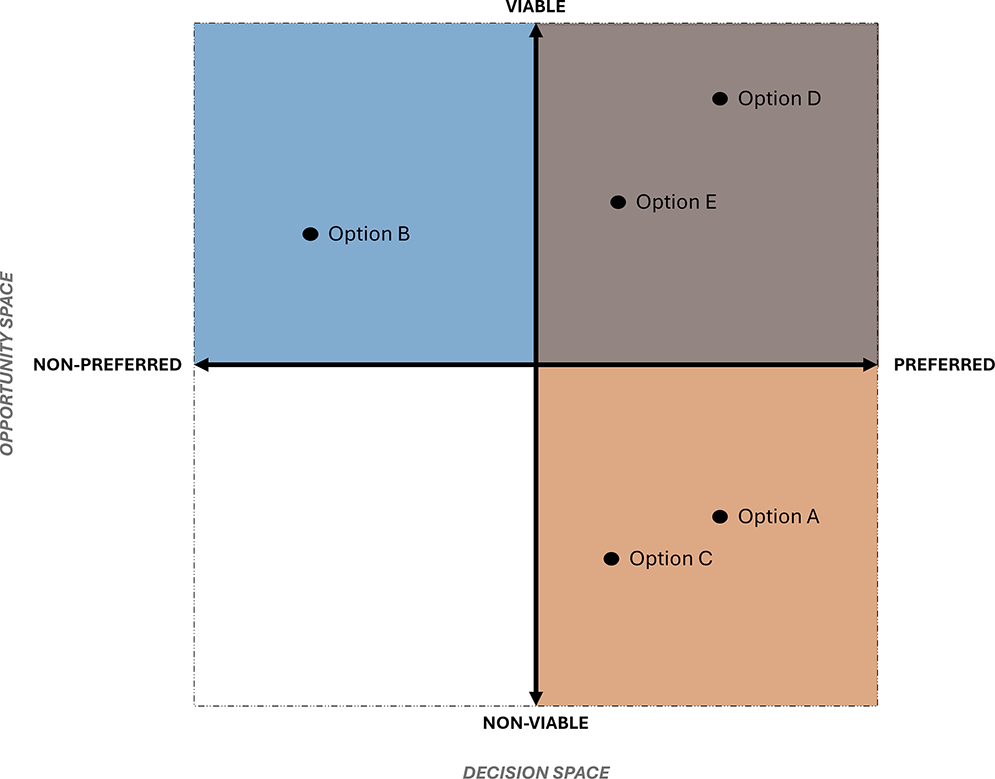
These contributions require different interpretations of outcomes and provide definitive results that define the overlap in the opportunity and decision spaces within our case study (Figure 3). Distinguishing the viable interventions (options B, D and E in Figure 3) from those that are not viable (options A and C in Figure 3) in reaching the goals allows the identification of the opportunity space, both by us as ‘modelers’ but also the stakeholders. At the same time, it is important to showcase interventions (option B) that are maybe unknown by the stakeholders and to add them to the decision space. The aim of this analysis is to then expand the decision space with alternative options from the opportunity space and to take out options from the decision space that are not viable. In other words, the analysis aims to create overlap between these two spaces. We explicitly aim to avoid a paternalistic or top-down portrayal of stakeholder involvement, which would contradict the co-creation narrative emphasized elsewhere in this research. While minimal stakeholder engagement objectives may be justified in some contexts, usually depending on time and budget constraints – as it was the case in this research, they should be transparently reflected in the framing – rather than overstating the role of stakeholders when their involvement is limited. Balancing the narrative between modeling insights and stakeholder contributions is essential to maintaining credibility and consistency in the co-creation process.

Figure 3. Schematic representation of opportunity (blue) and decision space (orange) and their overlap (brown). Adapted from: Mark (Reference Mark1999) and Stoorvogel and Antle (Reference Stoorvogel and Antle2001).
Additionally, the aim specifically for our case study is to structure the stakeholder meetings with nontechnical stakeholders, such as landowners, farmers, citizens or representatives from nongovernmental organizations.
The utilization of the water–carbon-coupled model affords modelers a plethora of avenues through which to demonstrate the potential of NbS within a particular area. Specifically, the model can facilitate visualization of scenarios for and by the stakeholders themselves. The plethora of potential avenues for exploration can present a challenge for modelers in determining the most impactful data to facilitate productive discussions and valuable NbS scenario outcomes. In this model, the implementation of NbS is utilized through land use land cover (LULC) change, as this is the most prominent and straightforward way of modeling NbS in literature (Possantti and Marques, Reference Possantti and Marques2022).
Results
MC1: sensitivity assessment
The objective of this MC is to analyze whether the catchment is sensitive to NbS. Given that NbS are typically implemented as LULC changes, we will initially test an extreme LULC NbS scenario. This resulted in choosing the most dominant LULC, agriculture, being replaced by an alternative LULC, which would simulate a possible NbS. For this, we chose the forest (Figure 4b). Of course, in reality, such a drastic LULC change is not possible, the goal is to only test whether the catchment has sensitivity of the KPI to this change. The question that must be addressed is as follows:

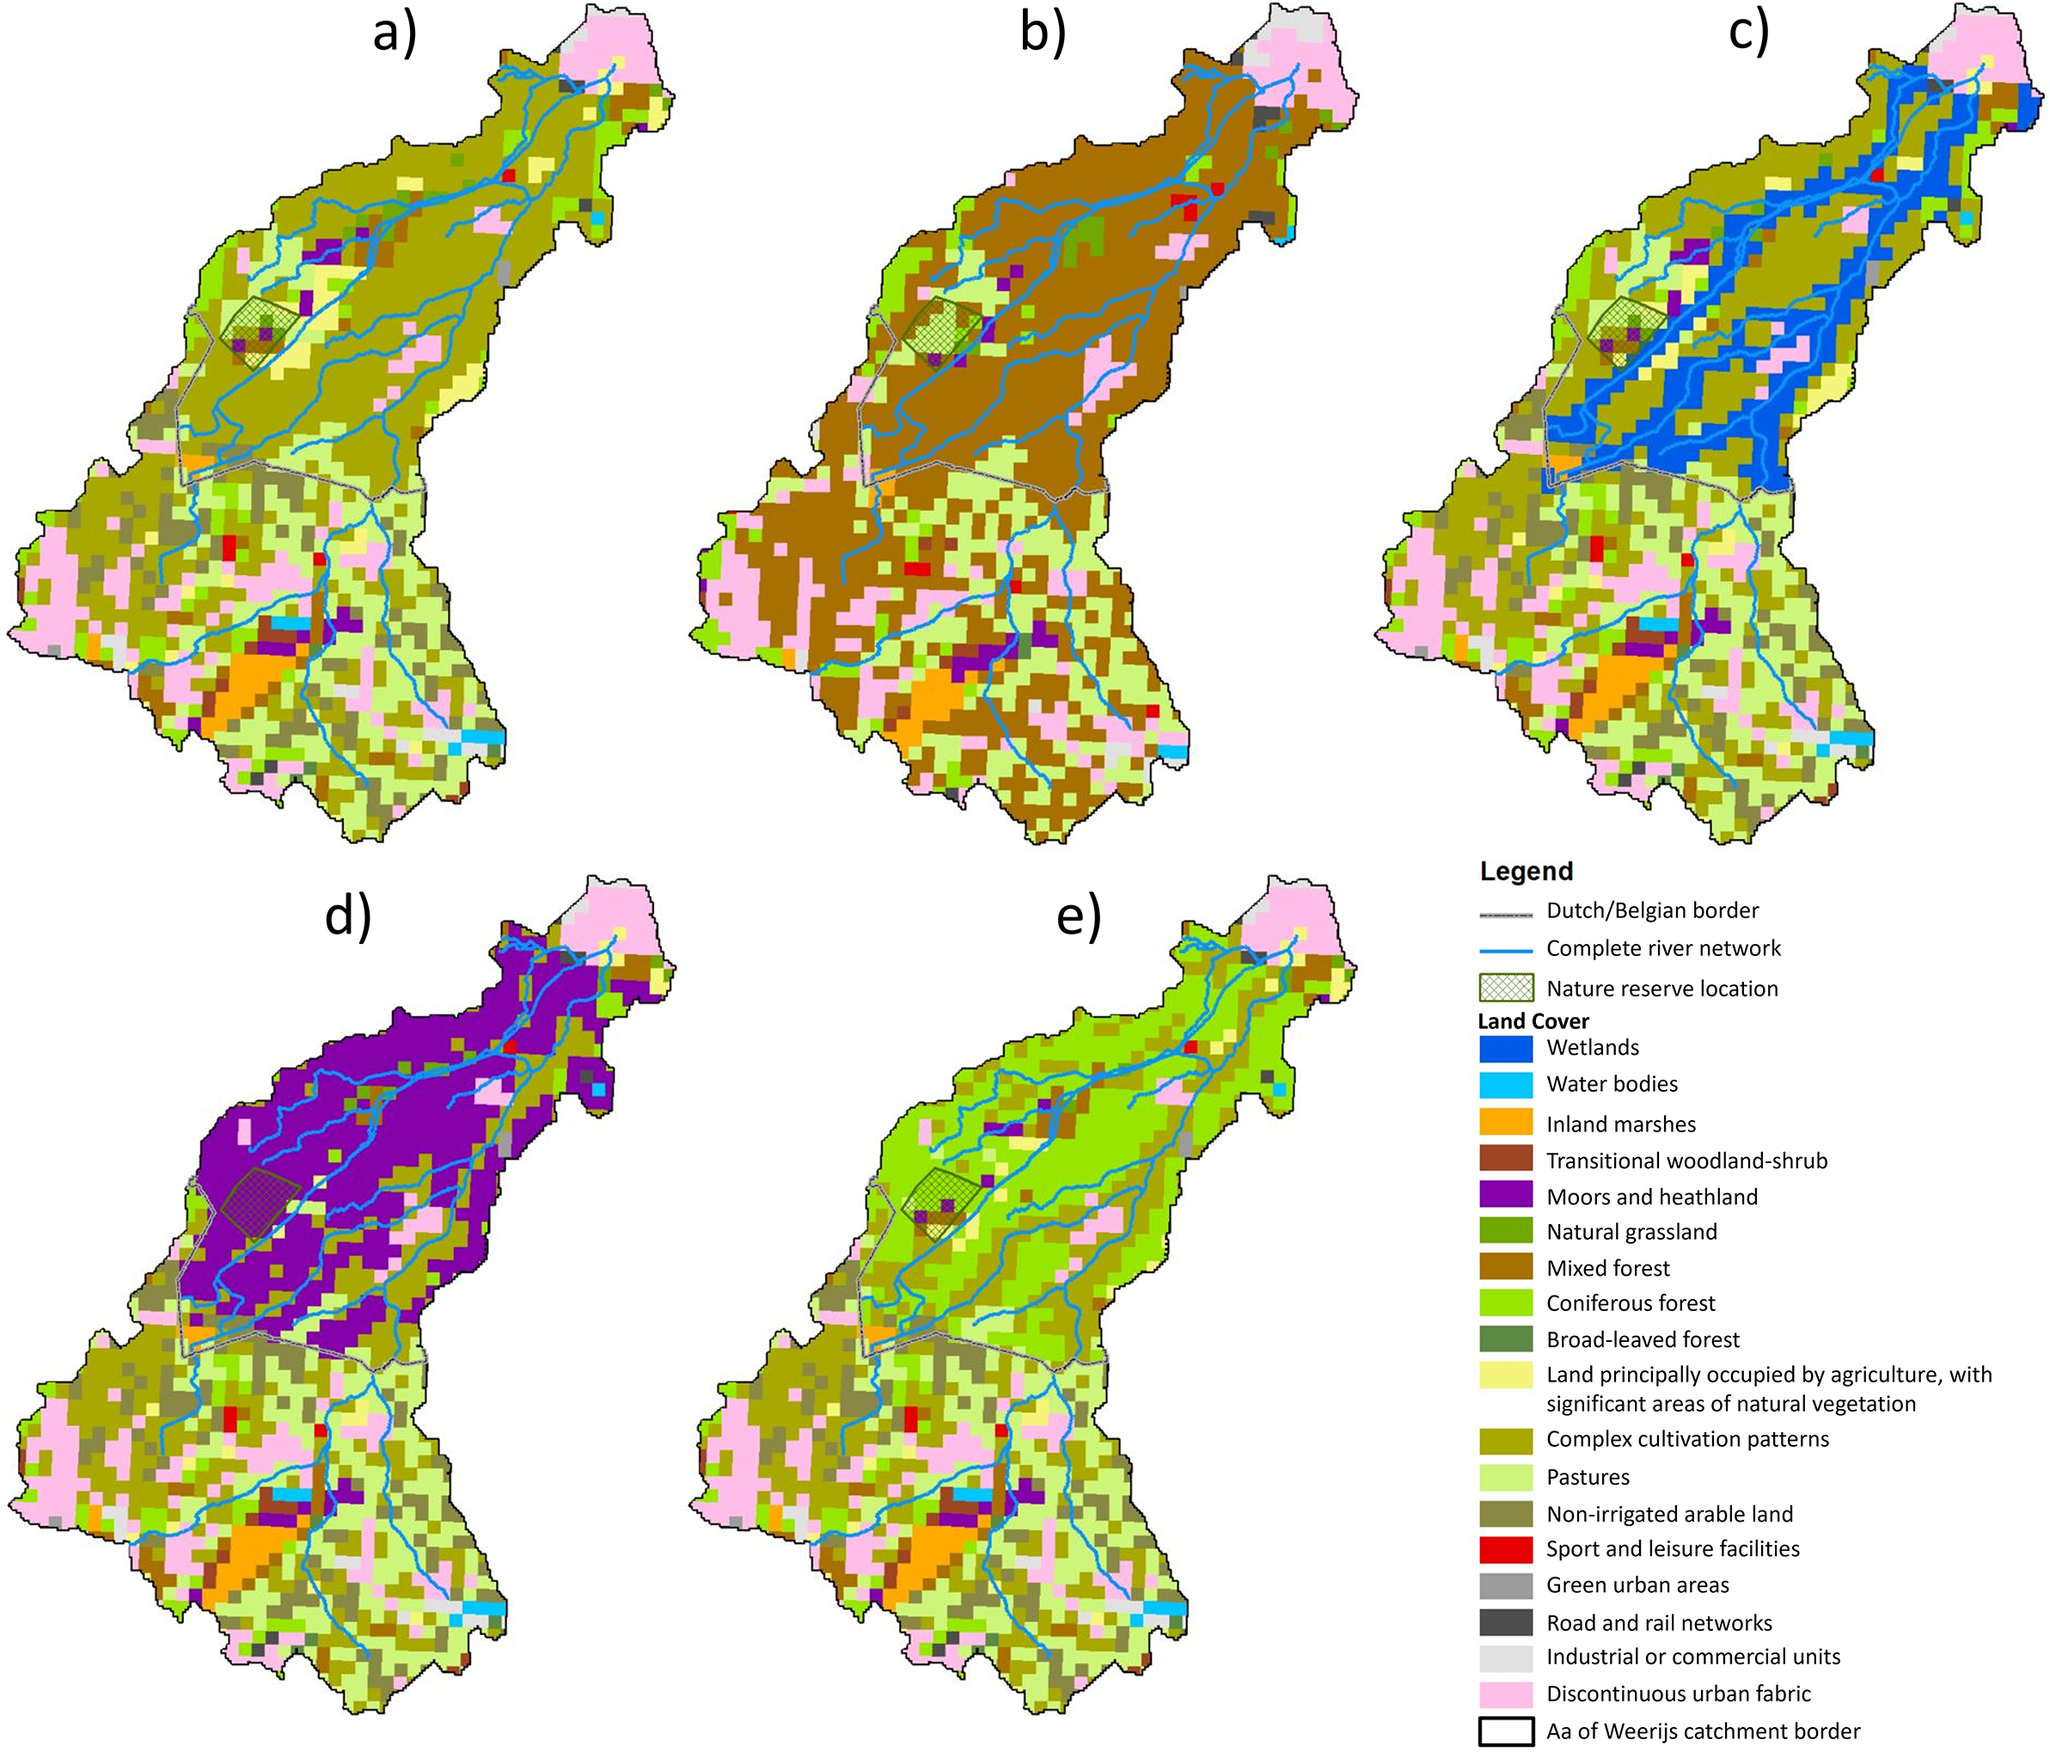
Figure 4. Land use land cover (LULC) maps used as inputs in the water–carbon model representing different NbS scenarios: (a) Land cover derived from Corine 2018 (CLMS, 2018), (b) extreme reforestation, (c) wetland restoration, (d) heathland restoration and (e) tree planting (adapted from Jonoski et al., Reference Jonoski, Ali, Bertini, Popescu, van Andel and Lansu2025).
The sensitivity assessment, focusing on the transition of LULC from current agriculture LULC to extreme reforestation (Figure 4b), resulted in location-dependent impacts on the overall catchment. In these visualizations, it would be quite evident for the stakeholders that the soil moisture difference (Figure 5a) and the $ \Delta \mathrm{SOC} $
(Figure 5b) exhibited notable variations. Specifically, it is quite straightforward to see that the extreme reforestation scenario demonstrated positive change in moisture content in most catchment areas, indicated with the red color, while some locations experienced a substantial negative change, indicated with blue color, mostly in the upstream region, indicating decreased soil moisture. The
$ \Delta \mathrm{SOC} $
(Figure 5b) exhibited notable variations. Specifically, it is quite straightforward to see that the extreme reforestation scenario demonstrated positive change in moisture content in most catchment areas, indicated with the red color, while some locations experienced a substantial negative change, indicated with blue color, mostly in the upstream region, indicating decreased soil moisture. The $ \Delta \mathrm{SOC} $
showed location-dependent variability, featuring positive, negative or minimal changes (Figure 5a). The primary impact of LULC change was upstream in the Belgian part of the catchment, contrasting with the middle and downstream Dutch sections.
$ \Delta \mathrm{SOC} $
showed location-dependent variability, featuring positive, negative or minimal changes (Figure 5a). The primary impact of LULC change was upstream in the Belgian part of the catchment, contrasting with the middle and downstream Dutch sections.

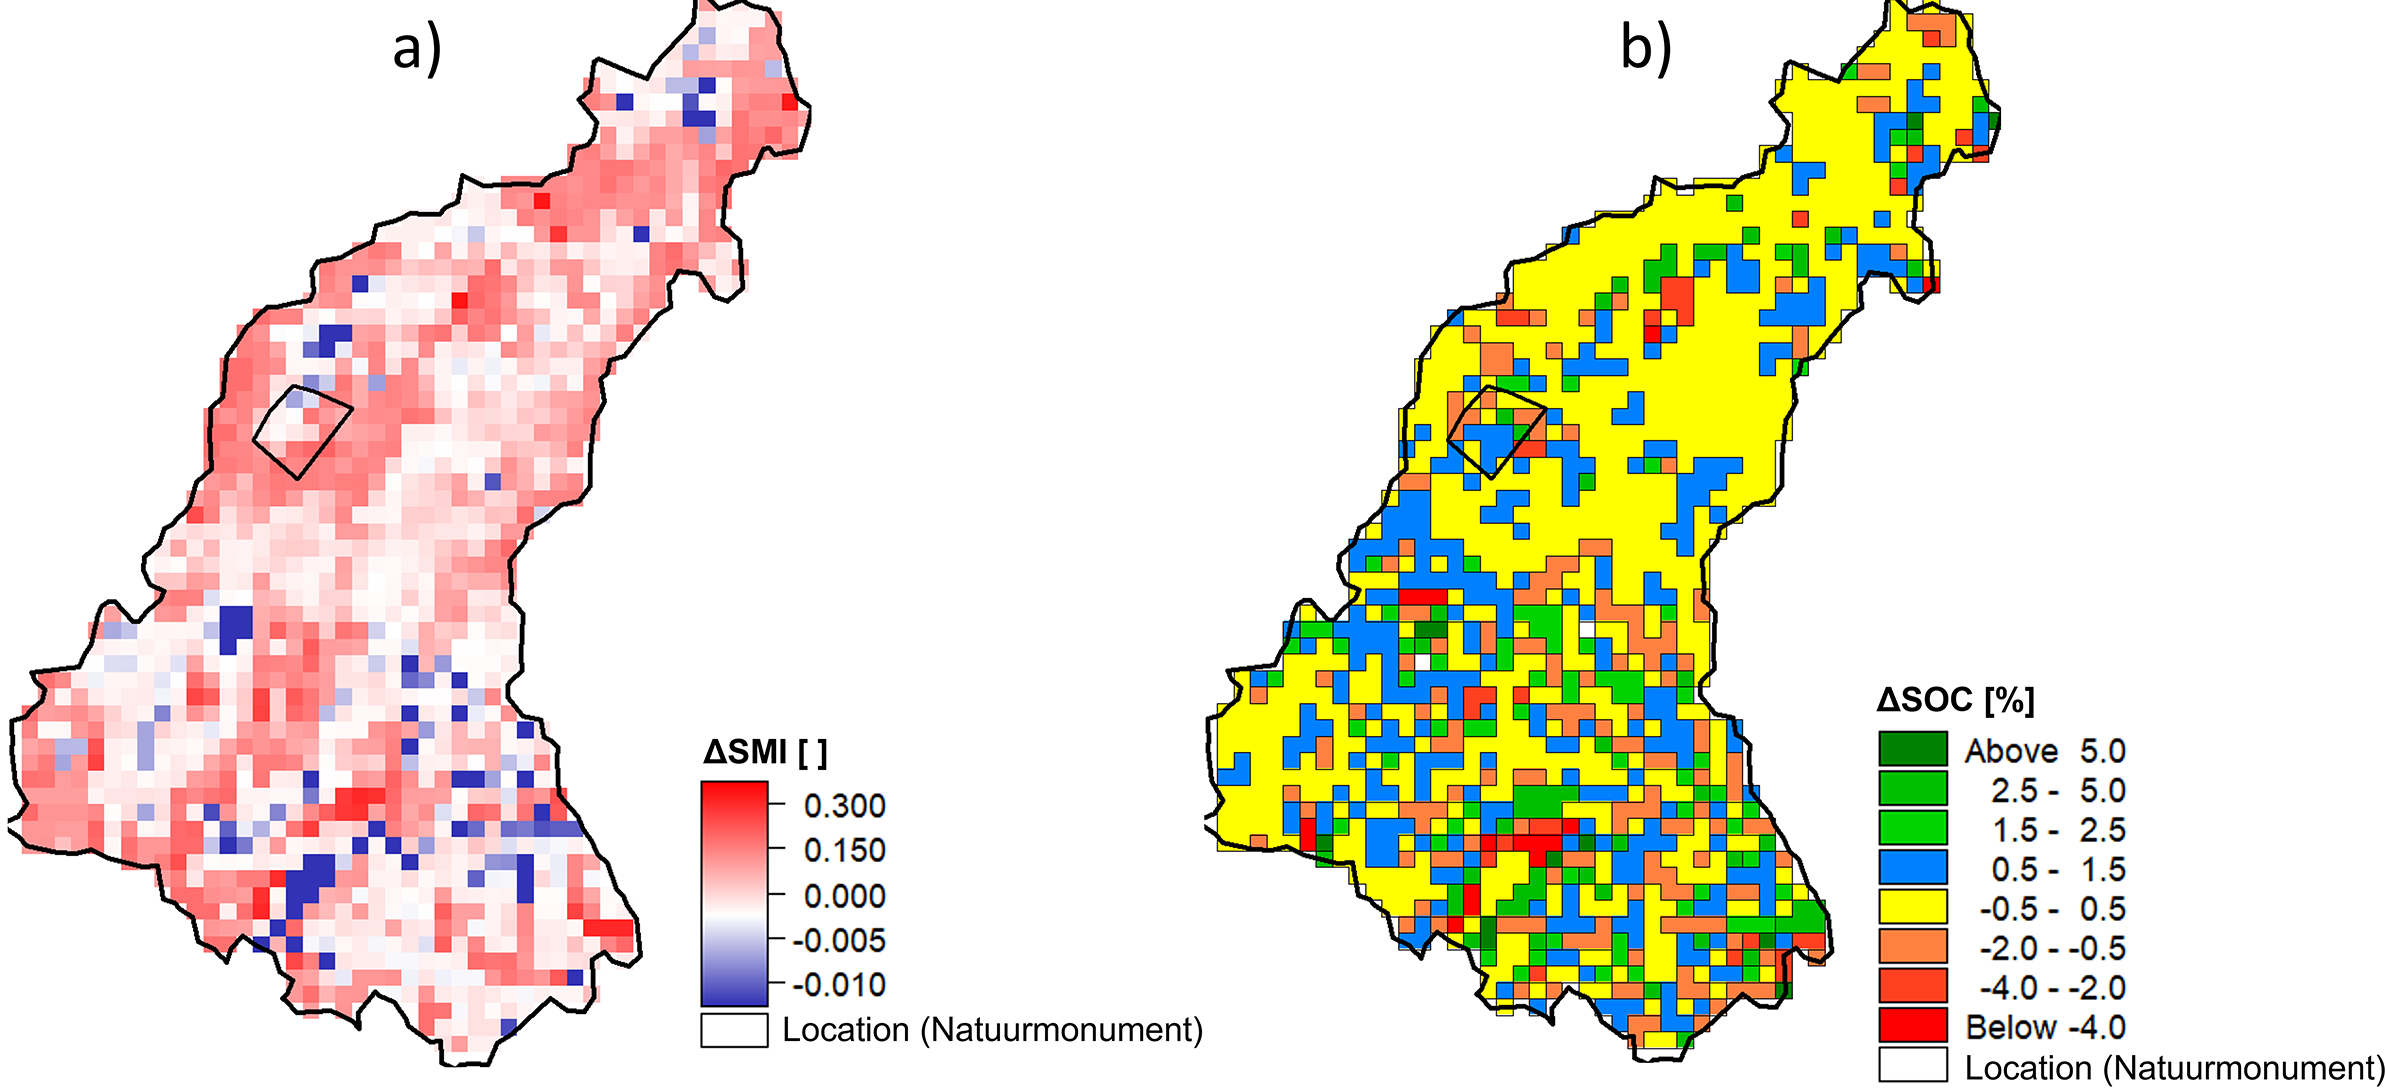
Figure 5. Sensitivity of the Aa of Werijs catchment to extreme reforestation scenario for the following KPI: (a) soil moisture index difference and (b) soil organic carbon difference.
This sensitivity assessment is crucial for stakeholders to understand the potential impacts of large-scale reforestation. By highlighting the areas where soil moisture and carbon sequestration would be most affected, in our case this is the upstream parts of the catchment, stakeholders can prioritize discussions on the feasibility and desirability of such extensive LULC changes. This understanding helps stakeholders to visualize and debate the scope and scale of potential interventions.
MC2: impact identification
Following the sensitivity analysis and an understanding of catchment responses to extreme LULC changes, the next step is to focus on the catchment and identify the locations that will be most impacted by a specific NbS. It must be acknowledged that reforestation will not have a uniformly positive impact across the entire catchment area. Consequently, the objective of this MC is to identify the optimal locations for a specific NbS, based on the anticipated impact on drought and carbon sequestration.
Analyzing the extreme reforestation scenario in terms of $ \Delta $
SMI and
$ \Delta $
SMI and $ \Delta $
SOC identified locations with positive effects for both droughts and soil carbon sequestration. If we overlap the
$ \Delta $
SOC identified locations with positive effects for both droughts and soil carbon sequestration. If we overlap the $ \Delta $
SMI and
$ \Delta $
SMI and $ \Delta $
SOC maps for the extreme reforestation scenario, upstream in the Belgium parts, there are quite a lot of locations showcasing positive effects for both KPIs. These locations that show mutual benefits, can be selected and zoomed in on, to look for possible locations where interventions are actually preferred by the stakeholders, and tested for more specific NbS. In the stakeholder meetings, stakeholders would gain a better idea of the catchment’s sensitivity to major LULC change, their spatial effect so they can pinpoint specific locations, that are available for interventions, suggest interventions and see their effect from the implementation of a specific NbS in the next MC.
$ \Delta $
SOC maps for the extreme reforestation scenario, upstream in the Belgium parts, there are quite a lot of locations showcasing positive effects for both KPIs. These locations that show mutual benefits, can be selected and zoomed in on, to look for possible locations where interventions are actually preferred by the stakeholders, and tested for more specific NbS. In the stakeholder meetings, stakeholders would gain a better idea of the catchment’s sensitivity to major LULC change, their spatial effect so they can pinpoint specific locations, that are available for interventions, suggest interventions and see their effect from the implementation of a specific NbS in the next MC.
Impact identification provides a clear visual representation of where interventions will be most beneficial. This allows stakeholders to focus their discussions on specific locations, making the meetings more targeted and effective. It aids in reaching a consensus on which areas should be prioritized for interventions based on the greatest overall benefit.
MC3: Scenario evaluation – catchment scale
The scenario evaluation is based on the testing of outputs from the opportunity mapping developed through the engagement of stakeholders and the analysis of climate adaptation visions from ongoing and past projects in the Aa of Weerijs catchment (Kortekaas, Reference Kortekaas2023). The three NbS scenarios represented in the model as LULC, will be modeled and evaluated. These are: heathland restoration (Figure 4d), tree planting (Figure 4e) and wetland restoration (Figure 4c).
Three NbS scenarios were suggested from the stakeholders: heathland restoration, tree planting and wetland restoration – revealing nuanced impacts. Heathland restoration exhibited a positive impact the majority of modeled grid cells transitioning to a positive value, tree planting had a negative effect with most of the grid cells transitioning to a negative value, and wetland restoration showed a substantial positive impact (Table 2).
Table 2. The impact on the ΔSMI and ΔSOC of the implementation of LULC as NbS on a catchment level as a percentage of the area (green for an overall positive and red for an overall negative change)

In terms of the $ \Delta $
SOC, heathland restoration had a positive impact, with an increase of 0.5–1.5% SOC and 951 cells indicating carbon sequestration. Tree planting demonstrated minimal or negative impacts, with a decrease of 0.5–4% SOC in select locations and 1,006 cells showcasing carbon emissions. Wetland restoration had the most significant positive impact on SOC, with an increase of at least 1.5% and above in locations where wetlands were restored and in the overall catchment 828 cells exhibited carbon sequestration.
$ \Delta $
SOC, heathland restoration had a positive impact, with an increase of 0.5–1.5% SOC and 951 cells indicating carbon sequestration. Tree planting demonstrated minimal or negative impacts, with a decrease of 0.5–4% SOC in select locations and 1,006 cells showcasing carbon emissions. Wetland restoration had the most significant positive impact on SOC, with an increase of at least 1.5% and above in locations where wetlands were restored and in the overall catchment 828 cells exhibited carbon sequestration.
MC3 links to actionable insights by providing a catchment-wide assessment of NbS impacts, allowing stakeholders to evaluate trade-offs and synergies between different scenarios (e.g., wetland restoration, tree planting). The outputs – such as maps of changes in soil moisture (ΔSMI) and carbon sequestration (ΔSOC) – quantify the overall benefits and limitations of each scenario. These insights enable stakeholders to prioritize NbS interventions that align with regional goals, such as improving water availability or enhancing ecological resilience. By presenting spatially explicit information, MC3 helps stakeholders identify high-impact zones for initial implementation or scaling efforts.
MC4: scenario evaluation – local scale
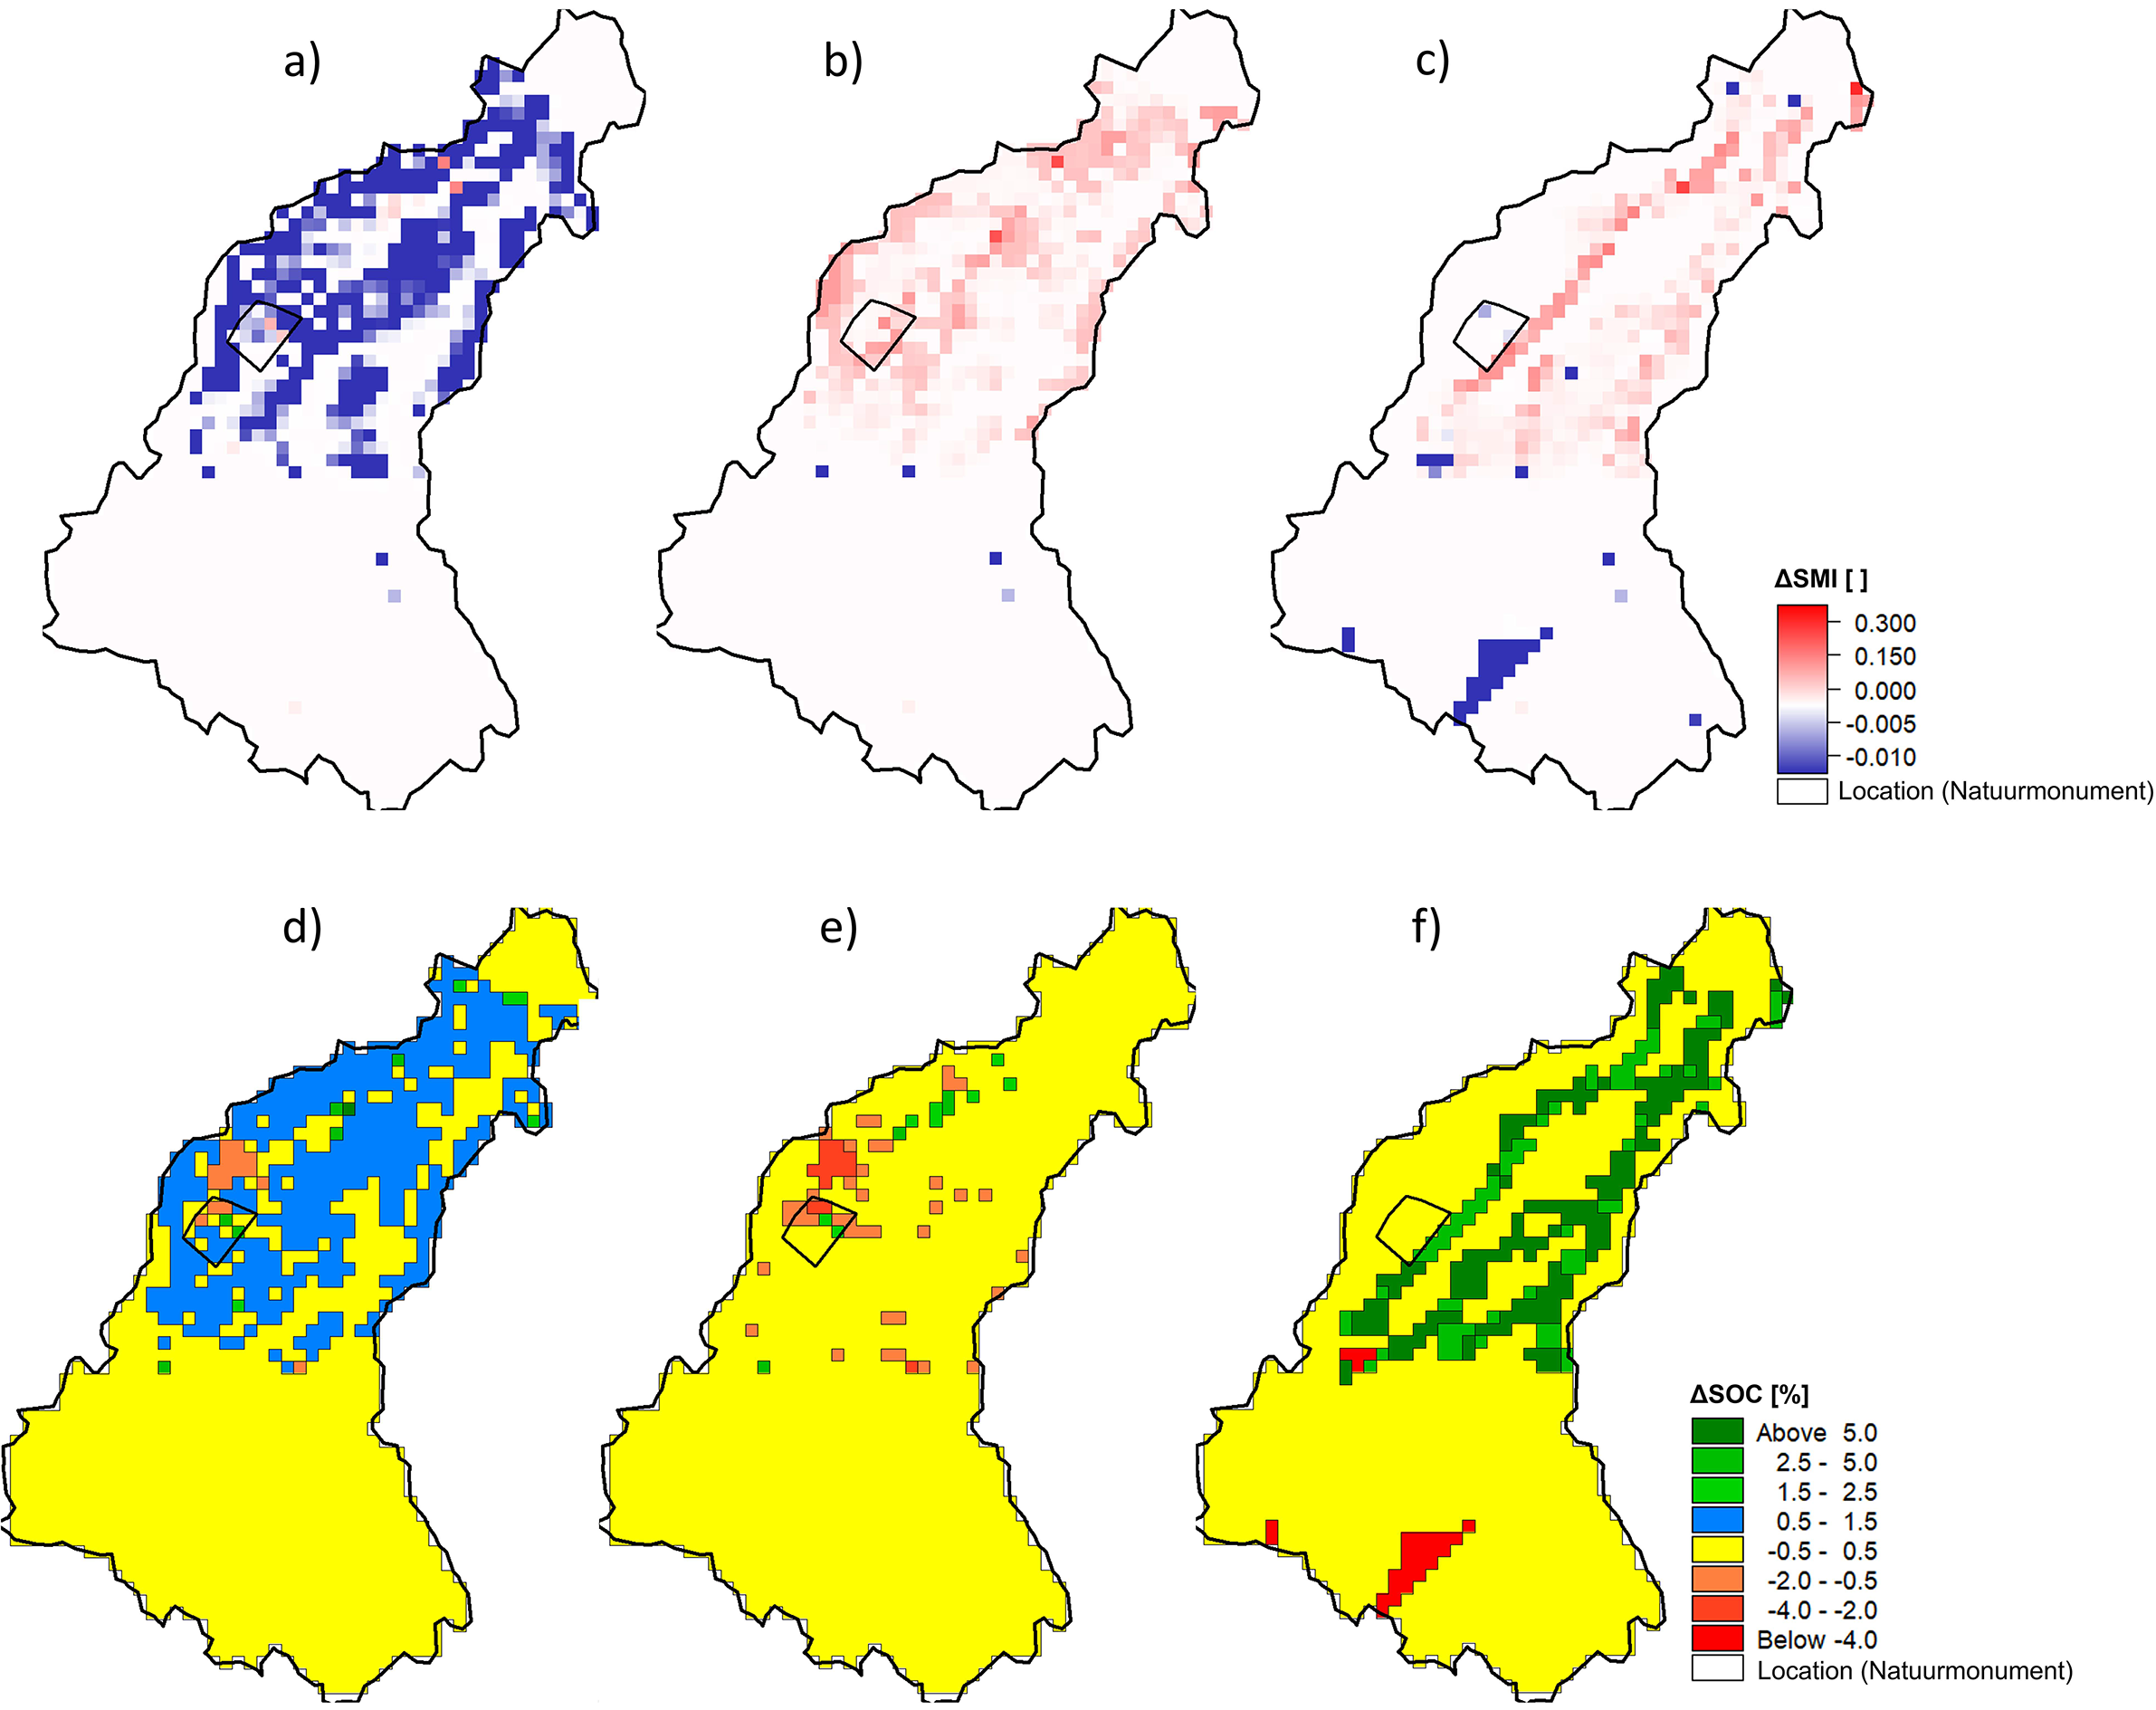
When considering a feasible location for implementing NbS scenarios, such as a parcel owned by a nature organization like Natuurmonumenten, a more specific evaluation is crucial. Despite wetland restoration being the optimal NbS scenario for the overall catchment, with positive impact especially in the downstream parts (Figure 6c,f), the chosen location poses challenges due to its distance from the modeled wetland restoration scenario. In this specific location, based on the ΔSMI and ΔSOC, heathland restoration emerges as the most suitable measure (Table 3). The model predicts an increase in ΔSMI between 0.10 and 0.15 (Figure 6a) and an increase in ΔSOC of 0.5–2.5 (Table 3) (Figure 6d).

Figure 6. $ \varDelta \mathrm{SMI}\;\mathrm{and}\;\varDelta $
SOC for the following NbS scenarios: (a) and (d) heathland restoration, (b) and (e) tree planting and (c) and (f) wetland restoration, respectively.
$ \varDelta \mathrm{SMI}\;\mathrm{and}\;\varDelta $
SOC for the following NbS scenarios: (a) and (d) heathland restoration, (b) and (e) tree planting and (c) and (f) wetland restoration, respectively.
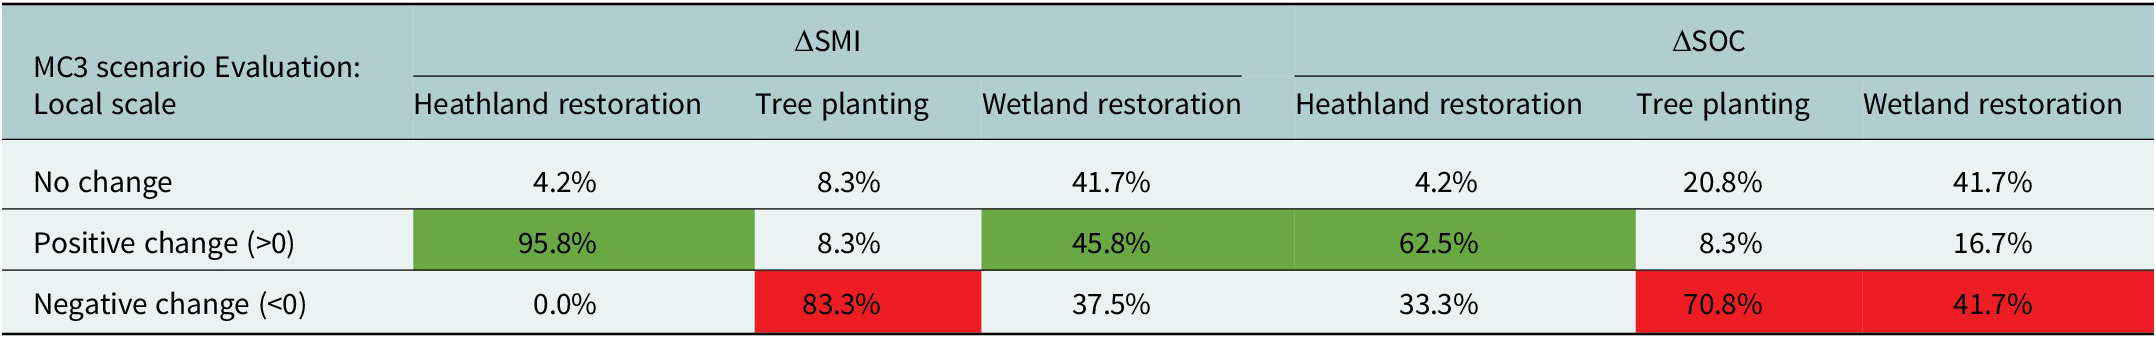
Table 3. The impact on the ΔSMI and ΔSOC of the implementation of LULC as NbS on a local level as a percentage of the area (green for an overall positive and red for an overall negative change)

MC4 provides actionable insights by zooming into stakeholder-relevant areas to tailor interventions, considering local constraints like landownership, cost-effectiveness and feasibility. Outputs from MC4 refine broader catchment insights (from MC3) into implementable recommendations at the parcel or community level. For example, localized changes in ΔSMI or specific zones with optimal carbon storage potential guide practical decisions on intervention placement. MC4 thus supports decision-making by ensuring that proposed measures are actionable and context-specific, facilitating on-the-ground implementation aligned with stakeholder objectives, assuming they are consistent between all stakeholders.
While the use of a 500 × 500 m grid resolution for the MIKE SHE model was chosen to balance computational feasibility with spatial accuracy over a catchment area of 346 km2, we acknowledge that this resolution may limit the model’s capacity to capture microscale heterogeneity, especially for localized interventions requiring finer spatial details. For example, parcel-scale variations in soil properties or hydrological processes could be underrepresented at this resolution. Using a finer, grid (e.g., 10 × 10 m or 50 × 50 m) was considered but would have drastically increased the computational power required for this analysis. Given the model’s aim to support stakeholder discussions at a strategic planning level, the 500 × 500 m grid provided sufficient resolution to illustrate general spatial patterns and trade-offs effectively without overwhelming stakeholders with excessive complexity.
Across the MCs, the ΔSMI and ΔSOC maps were central in structuring stakeholder dialogue. In the sensitivity and impact-assessment steps (MC1–MC2), the maps highlighted where large land-use changes would most strongly affect soil moisture and carbon, allowing stakeholders to prioritize discussions on the feasibility and desirability of interventions and to pinpoint candidate locations by overlapping ΔSMI and ΔSOC layers. At the catchment scale (MC3), scenario maps helped stakeholders evaluate trade-offs between their suggested NbS options and identify high-impact zones for potential implementation. At the local scale (MC4), zooming into a specific parcel (e.g., a Natuurmonumenten site) showed that, despite wetlands performing best overall, heathland restoration was more suitable at that location given the modeled ΔSMI and ΔSOC. Together, these examples illustrate how visual model outputs were used in practice to focus discussion on specific places, compare scenarios and connect strategic patterns to parcel-level choices.
Discussion
Through the examination of four instances of good practices through the suggested MCs, we demonstrate that there are numerous points of stakeholder influence for enhancing the impact of environmental models in policymaking or management. While our focus is on the opportunity analysis from the models to the actual decision-making process, primarily addressing the community of modelers and decision-makers, many of the aspects emphasized – particularly those related to model’s results development – remain applicable in situations involving a broader array of stakeholders, as seen in participatory modeling scenarios (Maskrey et al., Reference Maskrey, Mount, Thorne and Dryden2016; Basco-Carrera et al., Reference Basco-Carrera, Warren, van Beek, Jonoski and Giardino2017).
To overcome the resolution limitations, future work could incorporate multiscale modeling approaches, combining coarse-resolution catchment-level insights with finer-resolution local-scale analyses, to provide more detailed guidance for site-specific interventions. This iterative approach can ensure that stakeholders benefit from both broad strategic insights and detailed operational planning support.
Our study builds upon the recognized importance of integrating environmental modeling with stakeholder engagement by introducing a practical framework that links opportunity and decision spaces. This framework operationalizes stakeholder engagement by providing clear visual outputs and structured scenario evaluations. These tools facilitate consensus-building, ensuring interventions are both technically viable and socially acceptable, as demonstrated in the Aa of Weerijs case study. By aligning diverse priorities through iterative feedback loops, our approach addresses current gaps in adaptation planning, as highlighted in the latest IPCC AR6 WGII report (Caretta et al., Reference Caretta, Mukherji, Arfanuzzaman, Betts, Gelfan, Hirabayashi, Lissner, Liu, Lopez Gunn, Morgan, Mwanga, Supratid, Pörtner, Roberts, Tignor, Poloczanska, Mintenbeck, Alegría, Craig, Langsdorf, Löschke, Möller, Okem and Rama2022) – namely (i) the shortage of downscaled, decision-oriented impact models that incorporate socioeconomic and management dimensions, (ii) the translation gap between model evidence and decisions and (iii) weak integration across objectives and scales – and provides a practical workflow to mitigate them. Our study goes beyond reiterating the need by providing actionable contributions:
-
• Introducing a conceptual framework that aligns opportunity and decision spaces, offering a structured method for integrating stakeholder preferences with technical feasibility.
-
• Demonstrating the value of visual model outputs (e.g., maps) as tools to facilitate understanding and dialogue among diverse stakeholder groups.
-
• Using scenario-based evaluations to highlight how trade-offs and synergies can inform decision-making on drought mitigation and carbon sequestration.
Before starting the modeling, it is important to emphasize that the objectives and with that, the defined KPIs need to be co-designed with the stakeholders, based on what is necessary for them because they live and work in the catchment, and what is necessary for the overall health of the catchment. This part is fundamental in confidence building and trust between the ‘professional modelers’ and the stakeholders (Voinov et al., Reference Voinov, Kolagani, McCall, Glynn, Kragt, Ostermann, Pierce and Ramu2016; Murti and Mathez-Stiefel, Reference Murti and Mathez-Stiefel2019). It is quite important to stress out that the stakeholder feedback is integral to refining this modeling approach. Through a series of workshops oriented toward community mapping and designing exercises (Bogatinoska et al., Reference Bogatinoska, Lansu, Hugé and Dekker2022), stakeholders (e.g., from regional authorities and environmental groups) can provide insights that would shape the modeling scenarios. This collaborative process would ensure that the model’s outputs would be aligned with the practical needs and expectations of the community, leading to actionable strategies tailored to local conditions.
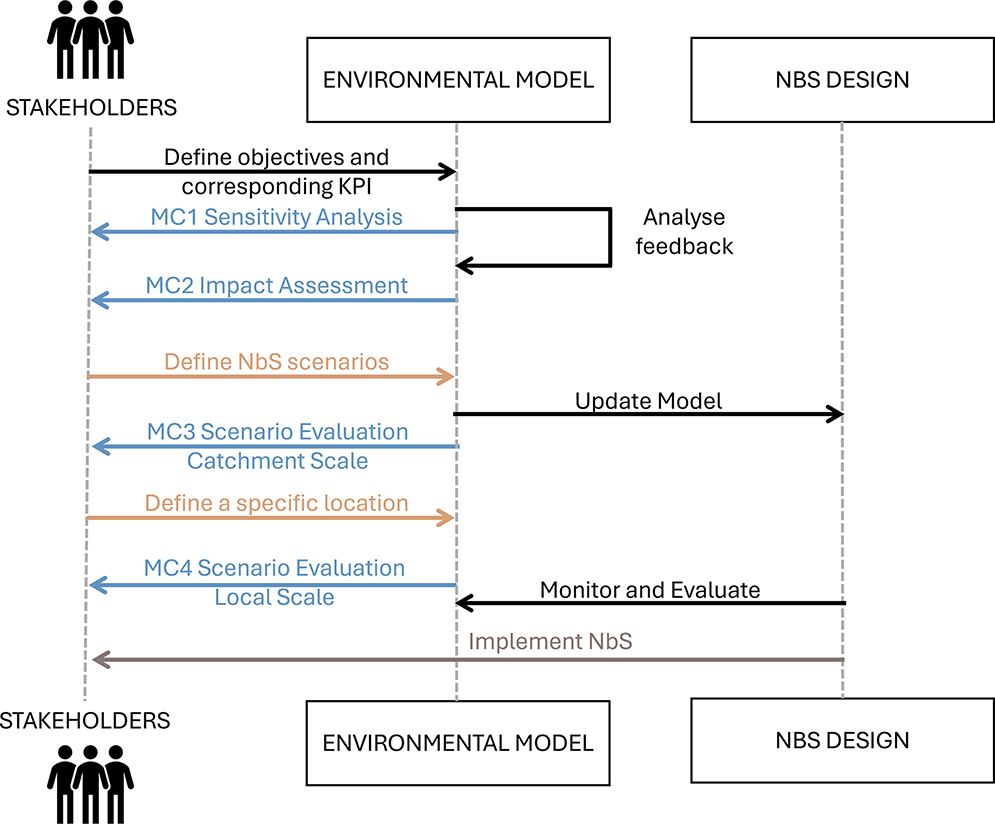
Our conceptual framework can be combined with other iterative frameworks on collaborative, participatory modeling but also networked and social learning (example given of Figure 7). For instance, it can be incorporated in the workflow in participatory modeling from (Voinov and Gaddis, Reference Voinov, Gaddis, Gray, Paolisso, Jordan and Gray2017), where it would be used for discussing and defining scenarios and then again but further in the process where results are presented to other stakeholders and decision makers. For instance, models can provide answers to questions arising from preliminary stakeholder engagement meetings such as concerns or suggestions regarding the catchments’ health. Phillipson et al. (Reference Phillipson, Lowe, Proctor and Ruto2012) highlighted that research programs and projects should pay more attention to early process of knowledge exchange and approaches to stakeholder engagement within the design and conduct of research and models for generating mutual benefits. By exploring the decision space arising from the stakeholders’ perspectives and testing how it overlaps with the opportunity space, we contribute to open and transparent design of NbS. This also influences the increase of social learning processes, especially if the model feedback coincides with the reflections of the stakeholders, as concluded by (Van der Wal et al., Reference Van der Wal, de Kraker, Kroeze, Kirschner and Valkering2016).

Figure 7. Suggested iterative process of how modeling can be implemented in stakeholder discussions for the purpose of designing and implementing NbS. The colors correlate to the ones used in Figure 3, that is, schematic representation of opportunity (blue), decision space (orange) and their overlap (brown).
Our framework also points out that, despite looking at a specific location, often a holistic approach is necessary to evaluate the impact in the required location (Figure 7). That is why, MC1, MC2 and MC3 are equally important before analyzing the impact in the required location (MC4) where NbS could be realistically implemented mostly due to landownership. So we need to look at the role of the modeling in stakeholder discussions more as an iterative process than a linear one. The reason is that often it is necessary to manage entire catchments rather than isolated segments to address upstream and downstream impacts comprehensively. This might mean that, despite the possibility to implement specific NbS in specific locations, additional measures in the catchment might be necessary to ensure that the location-specific NbS are feasible such as: employing erosion control measures such as terracing, contour farming and reforestation to prevent soil loss and sedimentation in downstream areas or increasing water retention in upstream areas through techniques like check dams, rainwater harvesting and soil moisture conservation. Such changes in the catchment would require constant discussion and feedback from stakeholders from different parts of the catchment, depending on where the measures need to be implemented. For example, if erosion control measures are proposed in upstream agricultural areas while retention zones are targeted downstream, this would require input and coordination between farming cooperatives, local water boards and municipalities to assess feasibility, land availability and operational concerns. Farmers could flag risks to their yield or suggest alternative plots, while municipalities might assess how these upstream changes affect flood safety or recreational use downstream. The creation of feedback mechanisms would ensure continuous learning and improvement, allowing for adjustments in response to new information or changing conditions. Additionally it would open the pathways toward successful identification and prioritization of actions based on their potential to provide the greatest benefits across the catchment.
These changes in the catchment require constant discussion and feedback from stakeholders in different parts of the catchment, depending on where the measures need to be implemented. The creation of feedback mechanisms would ensure continuous learning and improvement, allowing for adjustments in response to new information or changing conditions. In the context of our proposed approach, these feedback mechanisms can be realized through structured, recurring stakeholder sessions embedded within the modeling cycle – particularly between MC2 and MC4. For instance, following the initial scenario definition phase (MC2), preliminary model outputs can be shared through visual tools (e.g., interactive maps or dashboards) in a second round of workshops. Stakeholders are then invited to comment on these results and flag any discrepancies, knowledge gaps or site-specific limitations. This feedback is directly incorporated into refining both the scenarios and model parameters before evaluating implementation feasibility in MC4. In our Aa of Weerijs case study, regional stakeholders identified that using only an existing hydrological model simulating one landscape function overlooks the need for more integrated scenarios aiming at multiple benefits. They recommended that a summary should link the models themselves but also their outputs to relevant policies, such as ’water and soil systems as guiding principles in land-use planning.’ All participants agreed that meaningful impact can only be observed when interventions are implemented at a large scale. Hence, the need for a coupled water–carbon model, incorporating both processes and showcasing multiple landscape functions. This aligns with the IPCC’s emphasis on the need for suitable downscaled climate and impact models that incorporate economic, social, cultural and management aspects for an extensive range of future adaptation options (Caretta et al., Reference Caretta, Mukherji, Arfanuzzaman, Betts, Gelfan, Hirabayashi, Lissner, Liu, Lopez Gunn, Morgan, Mwanga, Supratid, Pörtner, Roberts, Tignor, Poloczanska, Mintenbeck, Alegría, Craig, Langsdorf, Löschke, Möller, Okem and Rama2022). Additionally, it would open pathways toward successfully identifying and prioritizing actions based on their potential to provide the greatest benefits across the catchment, focusing on critical upstream areas that can significantly influence downstream conditions.
Our approach is closely related to existing collaborative-modeling traditions, such as shared vision planning (Palmer et al., Reference Palmer, Cardwell, Lorie and Werick2013) and serious gaming (Van der Wal et al., Reference Van der Wal, de Kraker, Kroeze, Kirschner and Valkering2016; Khoury et al., Reference Khoury, Gibson, Savic, Chen, Vamvakeridou-Lyroudia, Langford and Wigley2018), which explicitly focus on conflict resolution and on shifting stakeholder understandings and preferences. In contrast, the present study uses a lighter, workshop-based process to test whether a coupled water–carbon model, expressed through simple indicators and maps, can structure dialogue around NbSs. We see our workflow as complementary to these approaches: it could be embedded within a full Shared Vision Planning process or serious game, with pre-/post engagement data, to study in more detail how exposure to model outputs influences stakeholder attitudes and agreements.
Limitations
This case study was designed as a light-touch test of a modeling workflow rather than a full participatory planning trajectory, and the stakeholder component should be interpreted accordingly. We did not develop a formal facilitation protocol in advance, nor did we record a full sampling frame, attendance by sector or reasons for nonparticipation. As a result, participation varied across groups and countries, and the transparency and reproducibility of the engagement process are limited.
During the workshops, objectives and candidate KPIs were discussed with a mixed group of stakeholders but co-creation was constrained to two sessions rather than a continuous, project-long process. The final selection of ΔSMI and ΔSOC therefore reflects an illustrative, partially co-created set of indicators rather than the outcome of a fully co-produced planning cycle. We also did not employ specific tools to manage power dynamics (e.g., rotating spokespersons, anonymous scoring or a comment-to-action log), which may have allowed some voices to be more influential than others.
Finally, we did not collect systematic pre-/post-workshop data on stakeholder attitudes or perceptions. We can therefore not quantitatively assess how exposure to the model outputs influenced positions, trust or willingness to act. A more detailed process evaluation, including clearer reporting of participation, formal facilitation measures and attitude tracking over time, is an important avenue for future work.
Conclusion
We presented a practical workflow that turns coupled water–carbon modeling into a co-design process with stakeholders, using simple indicators and maps to move from an opportunity space to a feasible decision space. Applied in a transboundary catchment, it revealed where nature-based options are promising and where constraints limit uptake, helping focus discussions on implementable measures. The approach is portable: the same steps – co-select indicators, iterate scenarios with feedback and link catchment screening to site selection – can be used elsewhere. The workflow is also model-agnostic and can be paired with hydraulic floodplain, groundwater, crop/soil, ecosystem-service, cost–benefit or adoption models for policy appraisal and planning across sectors. Key limitations are the summary-level stakeholder process and lack of formal uncertainty quantification; both can be addressed with clearer participation reporting and ensemble outputs. Overall, the method shortens the path from analysis to action while making assumptions and trade-offs explicit.
Open peer review
To view the open peer review materials for this article, please visit http://doi.org/10.1017/wat.2025.10010.
Data availability statement
Datasets for KPI results presented in this research are available in the main web application at https://eiffel.un-ihe.org/EIFFEL-prod/. This application also lists all publicly available data used in this research.
The MIKE SHE modeling system is available from DHI Denmark at: https://www.dhigroup.com/technologies/mikepoweredbydhi/mike-she.
Local data and actual MIKE SHE model setups are explained in more detail in (Jonoski et al., Reference Jonoski, Ali, Bertini, Popescu, van Andel and Lansu2025).
Local data and actual CARBI model setups are explained and provided in more detail in (Bogatinoska et al., Reference Bogatinoska, Lansu, Hugé, Ali, Dekker and Stoorvogel2024).
Acknowledgments
We would like to thank colleagues from IHE Delft Institute for Water Education which were our partners in the EIFFEL project and kindly provided us with the Hydrological model of the Aa of Weerijs in MIKE-SHE and the methodology behind the modeling of the single NbS measures. Additionally, the Province of Noord Brabant and the Water Board Brabantse Delta provided local data and expert advice for this research, which is greatly appreciated. We also thank DHI Denmark for providing the MIKE SHE modeling system free of charge for this research.
Author contribution
Borjana Bogatinoska: Conceptualization, Data curation, Formal analysis, Methodology, Software, Visualization, Writing – original draft. Angelique Lansu: Conceptualization, Funding acquisition, Project administration, Supervision, Writing – review & editing. Jean Hugé: Supervision, Writing – review & editing. Stefan C. Dekker: Conceptualization, Supervision, Writing – review & editing. Jetse Stoorvogel: Conceptualization, Methodology, Supervision, Writing – review & editing.
Financial support
The authors greatly acknowledge the financial support by the European Union’s Horizon 2020 research and innovation program: the “EIFFEL project” (grant No. 101003518) and the Interreg 2 Seas program: the “Co-Adapt project” (grant No. 2S06–023). Open access funding provided by University of Twente.
Competing interests
The authors declare the following financial interests/personal relationships which may be considered as potential competing interests: Borjana Bogatinoska reports financial support was provided by European Union’s Horizon 2020 research and innovation program and the Interreg 2 Seas program. If there are other authors, they declare that they have no known competing financial interests or personal relationships that could have appeared to influence the work reported in this article.


 Open access
Comments
Dear editor of the Cambridge Prism: Water, Special Issue System Impacts of Nature-Based Solutions for Coastal and Water Management,
I am pleased to submit our manuscript entitled ”Bridging Technical Insights and Stakeholder Perspectives: The Role of Models in Environmental Planning” for consideration in the special issue System Impacts of Nature-Based Solutions for Coastal and Water Management of Cambridge Prisms: Water. I was officially invited to contribute to this issue following my participation in the IAHR World Congress Nature-Based Solutions sessions and the related Hydrolink issue.
Our paper presents a novel, practice-oriented framework that integrates coupled water–carbon modelling with participatory stakeholder engagement to assess and co-design Nature-based Solutions (NbS). Using the transboundary Aa of Weerijs catchment as a case study, we introduce the concepts of opportunity space and decision space to bridge technical feasibility with social acceptability. This approach translates complex hydrological and carbon dynamics into accessible visual outputs—such as maps, scenario comparisons, and key performance indicators—that facilitate consensus building among diverse stakeholders.
We believe this contribution aligns closely with the special issue’s aim to explore system-level impacts of NbS for water management. Our framework addresses both the technical and governance dimensions of NbS implementation, offering a replicable method for other regions facing similar challenges of drought, flooding, and carbon management.
This manuscript is original, has not been published previously, and is not under consideration for publication elsewhere. All authors have approved the final version and agree to its submission to Cambridge Prisms: Water.
We thank you for considering our manuscript and look forward to the opportunity to contribute to this special issue.
Kind regards,
Borjana Bogatinoska, Angelique Lansu, Jean Huge, Stefan Dekker and Jetse Stoorvogel